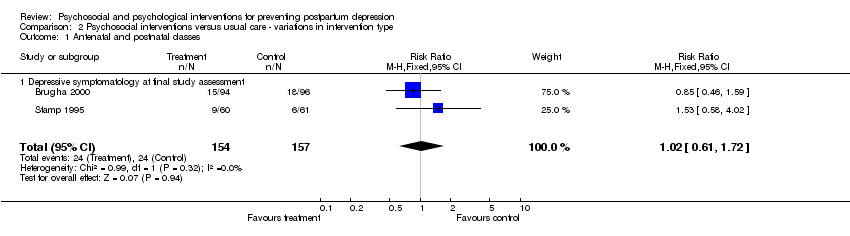
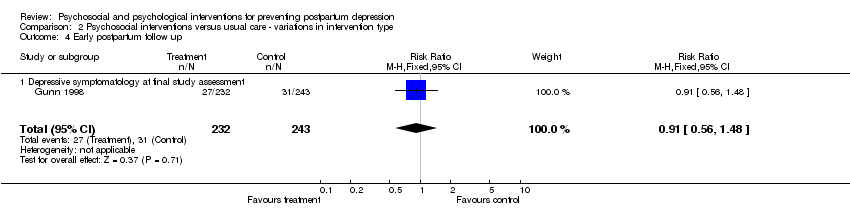
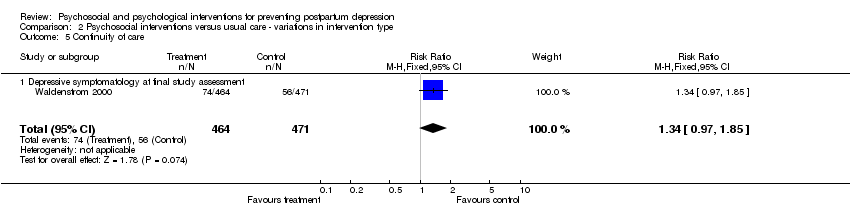
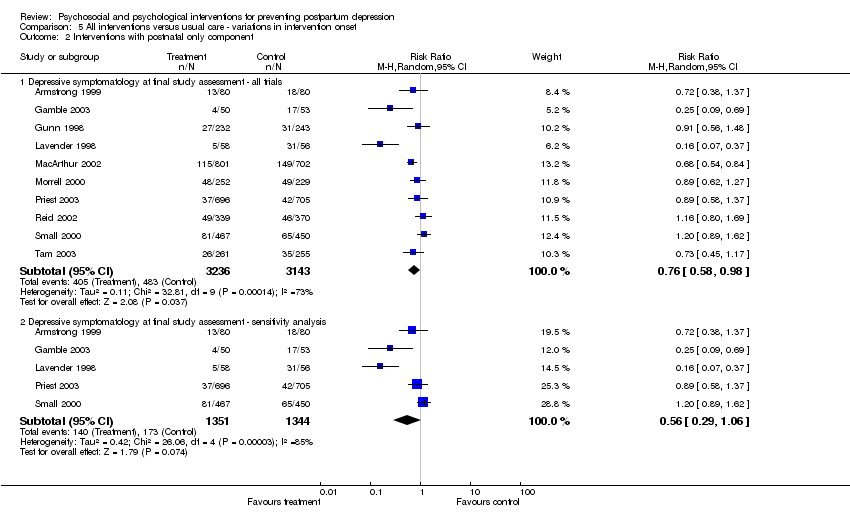
| 1 Depressive symptomatology at final study assessment (variously defined) Show forest plot | 15 | | Risk Ratio (M‐H, Random, 95% CI) | Subtotals only |
|
| 1.1 Depressive symptomatology ‐ all trials | 15 | 7697 | Risk Ratio (M‐H, Random, 95% CI) | 0.81 [0.65, 1.02] |
| 1.2 Sensitivity analysis | 9 | 3978 | Risk Ratio (M‐H, Random, 95% CI) | 0.76 [0.52, 1.12] |
| 2 Depressive symptomatology at final study assessment (EPDS > 12) Show forest plot | 10 | | Risk Ratio (M‐H, Random, 95% CI) | Subtotals only |
|
| 2.1 Depressive symptomatology ‐ all trials | 10 | 6126 | Risk Ratio (M‐H, Random, 95% CI) | 0.91 [0.73, 1.15] |
| 2.2 Sensitivity analysis | 7 | 3667 | Risk Ratio (M‐H, Random, 95% CI) | 1.00 [0.75, 1.34] |
| 3 Mean depression scores at final study assessment Show forest plot | 8 | | Mean Difference (IV, Random, 95% CI) | Subtotals only |
|
| 3.1 Mean depression scores ‐ all trials | 8 | 4880 | Mean Difference (IV, Random, 95% CI) | ‐0.36 [‐1.21, 0.48] |
| 3.2 Sensitivity analysis | 3 | 1107 | Mean Difference (IV, Random, 95% CI) | 0.23 [‐0.43, 0.89] |
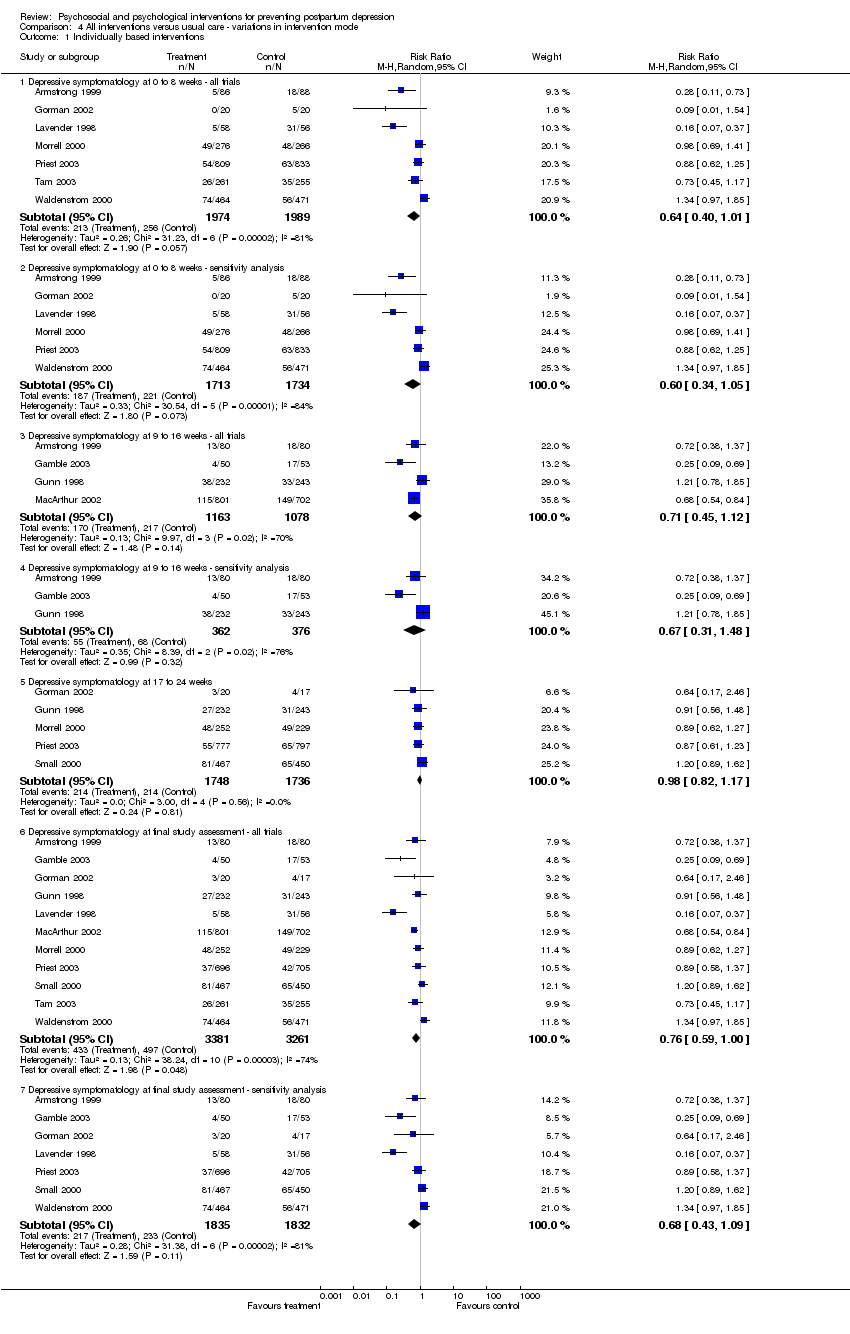
| 4 Depressive symptomatology at 8, 16, 24 weeks postpartum (variously defined) Show forest plot | 15 | | Risk Ratio (M‐H, Random, 95% CI) | Subtotals only |
|
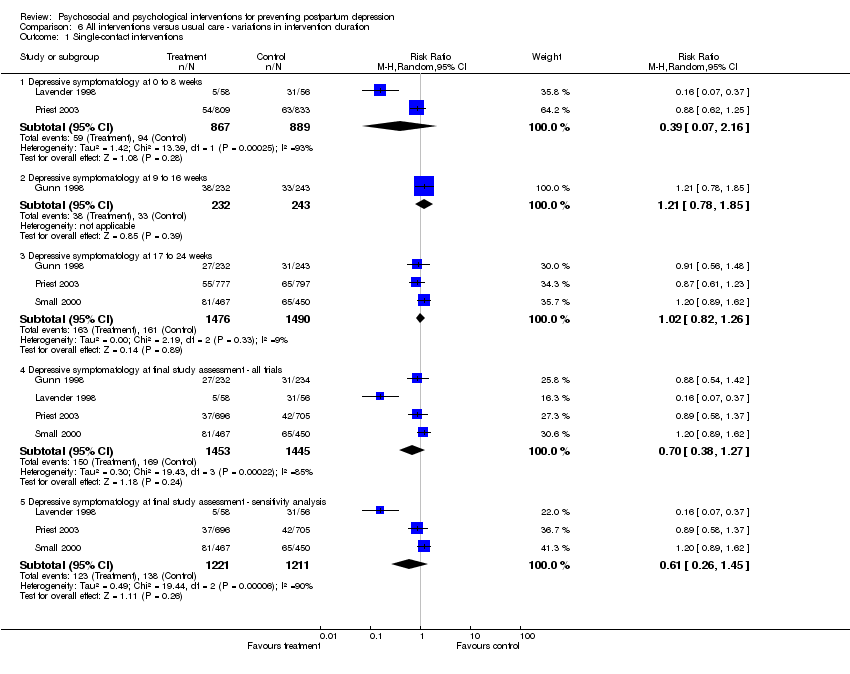
| 4.1 Depressive symptomatology at 0 to 8 weeks ‐ all trials | 8 | 4091 | Risk Ratio (M‐H, Random, 95% CI) | 0.65 [0.43, 1.00] |
| 4.2 Depressive symptomatology at 0 to 8 weeks ‐ sensitivity analysis | 7 | 3575 | Risk Ratio (M‐H, Random, 95% CI) | 0.62 [0.38, 1.03] |
| 4.3 Depressive symptomatology at 9 to 16 weeks ‐ all trials | 8 | 3326 | Risk Ratio (M‐H, Random, 95% CI) | 0.80 [0.56, 1.12] |
| 4.4 Depressive symptomatology at 9 to 16 weeks ‐ sensitivity analysis | 6 | 1788 | Risk Ratio (M‐H, Random, 95% CI) | 0.87 [0.59, 1.28] |
| 4.5 Depressive symptomatology at 17 to 24 weeks | 7 | 4314 | Risk Ratio (M‐H, Random, 95% CI) | 1.02 [0.87, 1.19] |
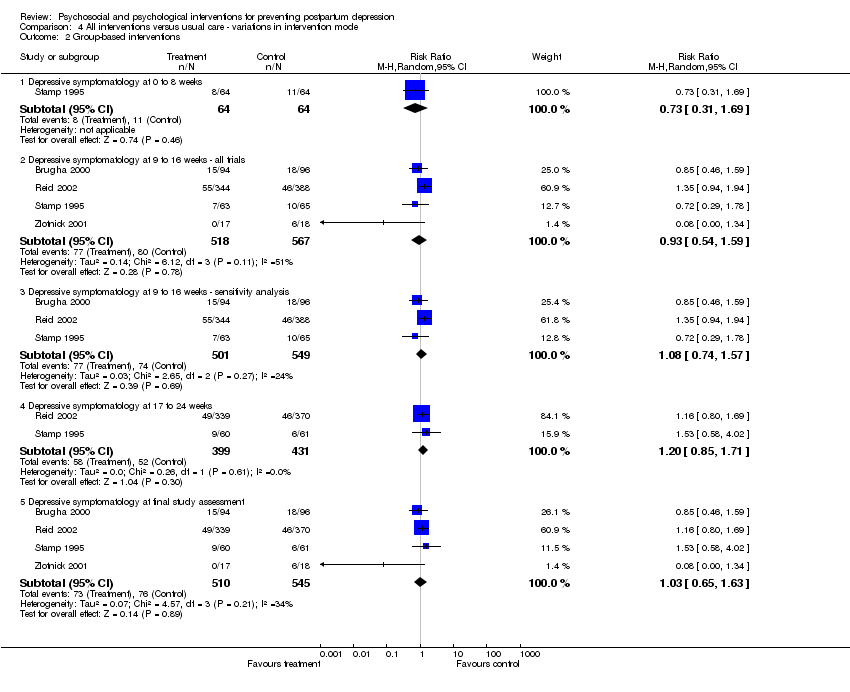
| 5 Depressive symptomatology at 8, 16, 24 weeks postpartum (EPDS > 12) Show forest plot | 10 | | Risk Ratio (M‐H, Random, 95% CI) | Subtotals only |
|
| 5.1 Depressive symptomatology at 0 to 8 weeks | 6 | 3452 | Risk Ratio (M‐H, Random, 95% CI) | 0.90 [0.65, 1.25] |
| 5.2 Depressive symptomatology at 9 to 16 weeks ‐ all trials | 5 | 2369 | Risk Ratio (M‐H, Random, 95% CI) | 0.72 [0.49, 1.06] |
| 5.3 Depressive symptomatology at 9 to 16 weeks ‐ sensitivity analysis | 4 | 866 | Risk Ratio (M‐H, Random, 95% CI) | 0.70 [0.39, 1.28] |
| 5.4 Depressive symptomatology at 17 to 24 weeks | 6 | 3598 | Risk Ratio (M‐H, Random, 95% CI) | 1.00 [0.84, 1.19] |
| 6 Maternal health service contact at final study assessment Show forest plot | 1 | 190 | Risk Ratio (M‐H, Fixed, 95% CI) | 1.21 [0.57, 2.56] |
|
| 6.1 Maternal health service contact | 1 | 190 | Risk Ratio (M‐H, Fixed, 95% CI) | 1.21 [0.57, 2.56] |
| 7 Maternal‐infant attachment at 8, 16, 24 weeks postpartum Show forest plot | 1 | | Mean Difference (IV, Fixed, 95% CI) | Subtotals only |
|
| 7.1 Maternal‐infant attachment at 0 to 8 weeks | 1 | 174 | Mean Difference (IV, Fixed, 95% CI) | ‐0.10 [‐1.18, 0.98] |
| 7.2 Maternal‐infant attachment at 9 to 16 weeks | 1 | 160 | Mean Difference (IV, Fixed, 95% CI) | ‐0.73 [‐1.84, 0.38] |
| 8 Maternal attitudes toward motherhood at 8, 16, 24 weeks postpartum Show forest plot | 1 | | Mean Difference (IV, Fixed, 95% CI) | Subtotals only |
|
| 8.1 Restriction of role at 0 to 8 weeks | 1 | 174 | Mean Difference (IV, Fixed, 95% CI) | ‐0.13 [‐1.88, 1.62] |
| 8.2 Restriction of role at 9 to 16 weeks | 1 | 160 | Mean Difference (IV, Fixed, 95% CI) | ‐1.12 [‐2.95, 0.71] |
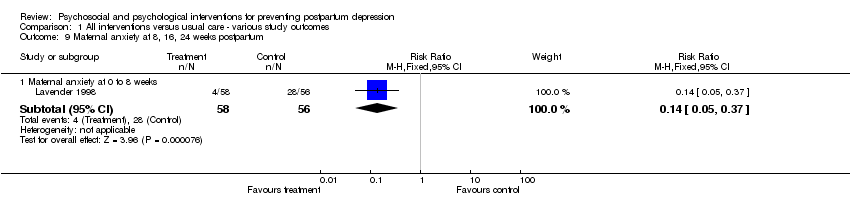
| 9 Maternal anxiety at 8, 16, 24 weeks postpartum Show forest plot | 1 | | Risk Ratio (M‐H, Fixed, 95% CI) | Subtotals only |
|
| 9.1 Maternal anxiety at 0 to 8 weeks | 1 | 114 | Risk Ratio (M‐H, Fixed, 95% CI) | 0.14 [0.05, 0.37] |
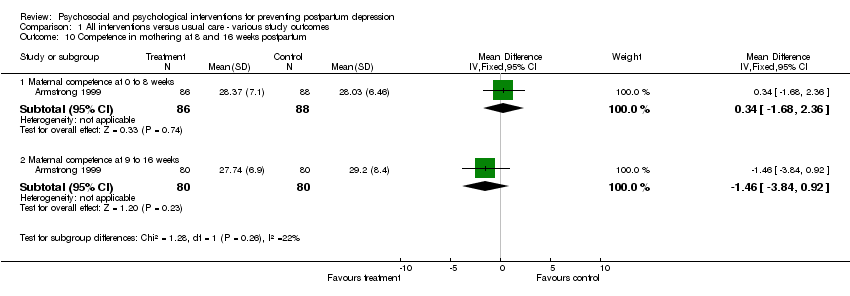
| 10 Competence in mothering at 8 and 16 weeks postpartum Show forest plot | 1 | | Mean Difference (IV, Fixed, 95% CI) | Subtotals only |
|
| 10.1 Maternal competence at 0 to 8 weeks | 1 | 174 | Mean Difference (IV, Fixed, 95% CI) | 0.34 [‐1.68, 2.36] |
| 10.2 Maternal competence at 9 to 16 weeks | 1 | 160 | Mean Difference (IV, Fixed, 95% CI) | ‐1.46 [‐3.84, 0.92] |
| 11 General physical and mental health (SF‐36) at final study assessment Show forest plot | 4 | | Mean Difference (IV, Fixed, 95% CI) | Subtotals only |
|
| 11.1 Physical functioning | 4 | 2589 | Mean Difference (IV, Fixed, 95% CI) | 0.29 [‐0.91, 1.49] |
| 11.2 Role functioning (physical) | 4 | 2588 | Mean Difference (IV, Fixed, 95% CI) | ‐0.90 [‐3.33, 1.52] |
| 11.3 Bodily pain | 4 | 2589 | Mean Difference (IV, Fixed, 95% CI) | 0.25 [‐1.41, 1.92] |
| 11.4 Mental health | 4 | 2582 | Mean Difference (IV, Fixed, 95% CI) | ‐0.85 [‐2.21, 0.52] |
| 11.5 Role functioning (emotional) | 4 | 2586 | Mean Difference (IV, Fixed, 95% CI) | ‐0.93 [‐3.55, 1.69] |
| 11.6 Vitality | 4 | 2581 | Mean Difference (IV, Fixed, 95% CI) | 0.64 [‐0.99, 2.28] |
| 11.7 Social functioning | 4 | 2591 | Mean Difference (IV, Fixed, 95% CI) | ‐0.59 [‐2.29, 1.10] |
| 11.8 General health | 4 | 2586 | Mean Difference (IV, Fixed, 95% CI) | ‐0.19 [‐1.68, 1.29] |
| 12 Perceived social support at 8, 16, 24 weeks postpartum Show forest plot | 2 | | Std. Mean Difference (IV, Fixed, 95% CI) | Subtotals only |
|
| 12.1 Perceived social support at 0 to 8 weeks | 1 | 513 | Std. Mean Difference (IV, Fixed, 95% CI) | 0.01 [‐0.16, 0.19] |
| 12.2 Perceived social support at 9 to 16 weeks | 1 | 732 | Std. Mean Difference (IV, Fixed, 95% CI) | 0.0 [‐0.15, 0.15] |
| 12.3 Perceived social support at 17 to 24 weeks | 2 | 1174 | Std. Mean Difference (IV, Fixed, 95% CI) | 0.02 [‐0.09, 0.14] |
| 13 Breastfeeding duration at 8, 16, 24 weeks postpartum Show forest plot | 3 | | Risk Ratio (M‐H, Fixed, 95% CI) | Subtotals only |
|
| 13.1 Breastfeeding at 0 to 8 weeks | 2 | 722 | Risk Ratio (M‐H, Fixed, 95% CI) | 1.03 [0.89, 1.19] |
| 13.2 Breastfeeding at 9 to 16 weeks | 2 | 635 | Risk Ratio (M‐H, Fixed, 95% CI) | 0.89 [0.76, 1.04] |
| 13.3 Breastfeeding at 17 to 24 weeks | 2 | 968 | Risk Ratio (M‐H, Fixed, 95% CI) | 0.90 [0.74, 1.10] |
| 14 Infant immunisations Show forest plot | 1 | 160 | Mean Difference (IV, Fixed, 95% CI) | 0.42 [0.11, 0.73] |
|
| 14.1 Mean number of immunizations at 12 to 16 weeks | 1 | 160 | Mean Difference (IV, Fixed, 95% CI) | 0.42 [0.11, 0.73] |
| 15 Infant injuries Show forest plot | 1 | 160 | Risk Ratio (M‐H, Fixed, 95% CI) | 0.54 [0.31, 0.92] |
|
| 15.1 Infant injuries at 9 to 16 weeks | 1 | 160 | Risk Ratio (M‐H, Fixed, 95% CI) | 0.54 [0.31, 0.92] |
| 16 Marital discord at 4 and 24 weeks postpartum Show forest plot | 1 | | Mean Difference (IV, Fixed, 95% CI) | Subtotals only |
|
| 16.1 Marital discord at 0 to 8 weeks | 1 | 31 | Mean Difference (IV, Fixed, 95% CI) | ‐3.20 [‐16.93, 10.53] |
| 16.2 Marital discord at 17 to 24 weeks | 1 | 29 | Mean Difference (IV, Fixed, 95% CI) | ‐7.90 [‐21.52, 5.72] |