Intervención para las crisis en personas con enfermedades mentales graves
Referencias
Referencias de los estudios incluidos en esta revisión
Referencias de los estudios excluidos de esta revisión
Referencias de los estudios en espera de evaluación
Referencias adicionales
Referencias de otras versiones publicadas de esta revisión
Characteristics of studies
Characteristics of included studies [ordered by study ID]
Ir a:
| Methods | Allocation: randomised. | |
| Participants | Diagnosis: schizophrenia 41.9%, psychosis 30.3%, neurosis 27.8% (ICD‐8). | |
| Interventions | 1. Home care: assessment & treatment in home environment, multidisciplinary team, 24 hr service, drug treatment, psychotherapy, instruction in living skills. N=78. | |
| Outcomes | Death.** Unable to use ‐ | |
| Notes | * Demographic data on 155 patients only. ** Assumed deaths occured at 6 months. ***Home care: number of visits made by team to families or patients in community. Standard care: number of visits made by patient to OPD. | |
| Risk of bias | ||
| Bias | Authors' judgement | Support for judgement |
| Allocation concealment? | Unclear risk | B ‐ Unclear |
| Methods | Allocation: random assignment. | |
| Participants | Diagnosis: severe psychosis (PSE), 50.4% schizophrenia (DSM III). | |
| Interventions | 1. Home care: multidisciplinary team, 24 hr crisis service, drug treatment, counselling, training in basic living skills, family intervention, support & education, intensive treatment during acute phase. N=60. | |
| Outcomes | Death. Unable to use ‐ | |
| Notes | * 19 symptoms, rated by relatives. For purposes of this review these were grouped into affective symptoms, psychotic symptoms, behaviour, physical problems, social functioning, substance abuse & most relevant symptom taken from each category for analysis. | |
| Risk of bias | ||
| Bias | Authors' judgement | Support for judgement |
| Allocation concealment? | Unclear risk | B ‐ Unclear |
| Methods | Allocation: randomised. | |
| Participants | Diagnosis: serious mental illness (PSE), 53% met criteria for schizophrenia. | |
| Interventions | 1. Home care: DLP's home based care, multidisciplinary team, crisis clinics, 24hr answering service, problem solving, home visits & relative support, life skills training, assistance with financial & housing problems. N=92. | |
| Outcomes | Death. Unable to use‐ | |
| Notes | * After 31 months change in policy meant DLP team lost control of admission & discharges. ** Only relatives living with patient were followed up. | |
| Risk of bias | ||
| Bias | Authors' judgement | Support for judgement |
| Allocation concealment? | Unclear risk | B ‐ Unclear |
| Methods | Allocation: randomised. | |
| Participants | Diagnosis: schizophrenia. | |
| Interventions | 1. Home‐drug care: home based nurse visits, drug treatment, practical assistance & support for patient & family, multidisciplinary team, 24 hour answering service. N=64.** | |
| Outcomes | Hospital admission: unable to keep to initial protocol. Unable to use‐ | |
| Notes | * A second cohort recruited from community centres ‐ only randomised to home‐drug or home‐placebo care ‐ not used in this review. ** Once a patient from the home‐care group was admitted they were no longer treated by the community team, follow‐up interviews still conducted. *** Not used in this analysis. | |
| Risk of bias | ||
| Bias | Authors' judgement | Support for judgement |
| Allocation concealment? | Unclear risk | B ‐ Unclear |
| Methods | Allocation: randomised. | |
| Participants | Diagnosis: any severe psychiatric disorder. | |
| Interventions | 1. Home care: CLP's home based care, multidisciplinary team, 24hr service, drug treatment, coping skills taught, family support given, use of community agencies ‐ for 14 months & then withdrawn. N=65. 2. Standard care: hospitalisation, aim of returning to community as soon as possible, normal staffing levels, standard outpatient follow‐up. N=65. | |
| Outcomes | Death. Unable to use‐ | |
| Notes | * At 6 months only 60 people in each group ‐ preliminary report data. | |
| Risk of bias | ||
| Bias | Authors' judgement | Support for judgement |
| Allocation concealment? | Unclear risk | B ‐ Unclear |
Abbreviations
1. Diagnostic systems
DSM III: Diagnostic Statistical Manual, version 3
ICD ‐ 8: International Classification of Diseases ‐ 8th Review
PSE: Present State Examination
2.Scales/Forms used to collect data
BPRS: Brief Psychiatric Rating Scale
CAF: Community Adjustment Form
DLS: Daily Living Score
FBS: Family Burden Scale
FEF: Family Evaluation Form
HSRS: Health and Sickness Rating Scale
IMPS: Inpatient Multidimensional Psychiatric Scale
LSS: Life Satisfaction Scale
MSPP: Multidmensional Scale for Rating Psychiatric Patients
PEF: Psychiatric Evaluation Form
PHNR: Public Health Nursing Report
SAS: Social Adjustment Scale
SCRS: Short Clinical Rating Scale
SES: Self Esteem Scale
SORR: SIgnificant Other Rating Report
RSQ: Relative' s Satisfaction Questionnaire
Other
ACT: Assertive Community Treatment
M: Male
F: Female
N: Number
CLP: Community Living Programme
CPN: Community Psychiatric Nurse
DLP: Daily Living Programme
OPD: Outpatient department
relatives‐sub ‐ sub group of relatives actually living with the patient.
SD: Standard deviation
WMD: Weighted mean diffference
Characteristics of excluded studies [ordered by study ID]
Ir a:
| Study | Reason for exclusion |
| Allocation: not randomised, parallel case series. | |
| Allocation: randomised ‐ but 332 allocated yet only 162 entered study. | |
| Allocation: randomised. | |
| Allocation: randomised. | |
| Allocation: randomised. | |
| Allocation: randomised. | |
| Allocation: not randomised. | |
| Allocation: randomised. | |
| Allocation: randomised. | |
| Allocation: randomised. | |
| Allocation: randomised. | |
| Allocation: randomised. | |
| Allocation: randomised. | |
| Allocation: randomised. | |
| Allocation: randomised. | |
| Allocation: quasi randomisation. | |
| Allocation: randomised. | |
| Allocation: quasi randomised. | |
| Allocation: randomised. | |
| Allocation: randomised. | |
| Allocation: randomised. | |
| Allocation: randomised. | |
| Allocation: randomised. | |
| Allocation: randomised. | |
| Allocation: randomised. |
Data and analyses
| Outcome or subgroup title | No. of studies | No. of participants | Statistical method | Effect size | ||||||||||||||||||||||||||||||||||||||||||||||||||||||||||||||||||
| 1 Death: 1. Any cause Show forest plot | 4 | 601 | Risk Ratio (M‐H, Fixed, 95% CI) | 0.75 [0.30, 1.88] | ||||||||||||||||||||||||||||||||||||||||||||||||||||||||||||||||||
| Analysis 1.1  Comparison 1 HOME‐BASED CARE + INITIAL CRISIS INTERVENTION vs 'STANDARD CARE', Outcome 1 Death: 1. Any cause. | ||||||||||||||||||||||||||||||||||||||||||||||||||||||||||||||||||||||
| 2 Death: 2. By cause Show forest plot | 4 | Risk Ratio (M‐H, Fixed, 95% CI) | Subtotals only | |||||||||||||||||||||||||||||||||||||||||||||||||||||||||||||||||||
| Analysis 1.2  Comparison 1 HOME‐BASED CARE + INITIAL CRISIS INTERVENTION vs 'STANDARD CARE', Outcome 2 Death: 2. By cause. | ||||||||||||||||||||||||||||||||||||||||||||||||||||||||||||||||||||||
| 2.1 natural causes | 4 | 601 | Risk Ratio (M‐H, Fixed, 95% CI) | 0.84 [0.23, 3.09] | ||||||||||||||||||||||||||||||||||||||||||||||||||||||||||||||||||
| 2.2 suicide or death in suspicious circumstances | 4 | 601 | Risk Ratio (M‐H, Fixed, 95% CI) | 0.74 [0.24, 2.32] | ||||||||||||||||||||||||||||||||||||||||||||||||||||||||||||||||||
| 3 Harm to self or others Show forest plot | 3 | Risk Ratio (M‐H, Fixed, 95% CI) | Subtotals only | |||||||||||||||||||||||||||||||||||||||||||||||||||||||||||||||||||
| Analysis 1.3  Comparison 1 HOME‐BASED CARE + INITIAL CRISIS INTERVENTION vs 'STANDARD CARE', Outcome 3 Harm to self or others. | ||||||||||||||||||||||||||||||||||||||||||||||||||||||||||||||||||||||
| 3.1 attempted suicide | 2 | 250 | Risk Ratio (M‐H, Fixed, 95% CI) | 1.33 [0.87, 2.03] | ||||||||||||||||||||||||||||||||||||||||||||||||||||||||||||||||||
| 3.2 homicide | 1 | 189 | Risk Ratio (M‐H, Fixed, 95% CI) | 3.16 [0.13, 76.63] | ||||||||||||||||||||||||||||||||||||||||||||||||||||||||||||||||||
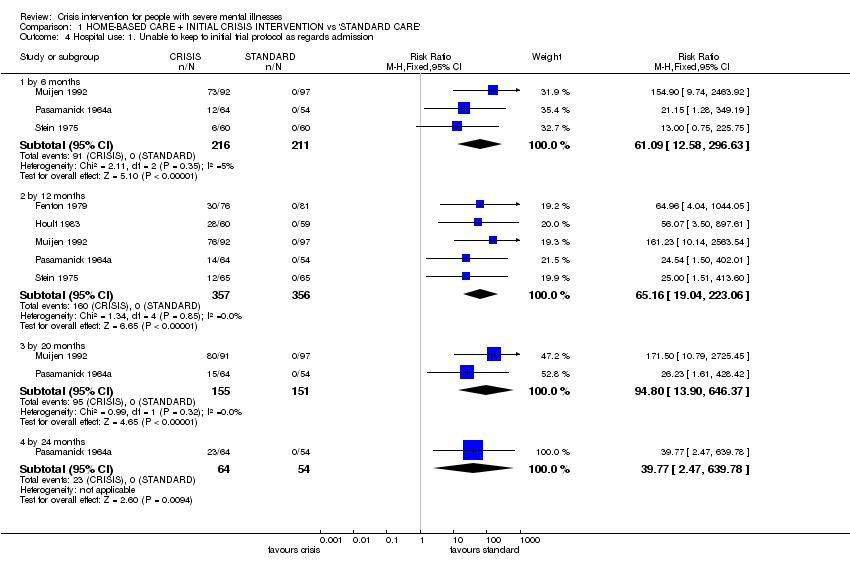
| 4 Hospital use: 1. Unable to keep to initial trial protocol as regards admission Show forest plot | 5 | Risk Ratio (M‐H, Fixed, 95% CI) | Subtotals only | |||||||||||||||||||||||||||||||||||||||||||||||||||||||||||||||||||
| Analysis 1.4  Comparison 1 HOME‐BASED CARE + INITIAL CRISIS INTERVENTION vs 'STANDARD CARE', Outcome 4 Hospital use: 1. Unable to keep to initial trial protocol as regards admission. | ||||||||||||||||||||||||||||||||||||||||||||||||||||||||||||||||||||||
| 4.1 by 6 months | 3 | 427 | Risk Ratio (M‐H, Fixed, 95% CI) | 61.09 [12.58, 296.63] | ||||||||||||||||||||||||||||||||||||||||||||||||||||||||||||||||||
| 4.2 by 12 months | 5 | 713 | Risk Ratio (M‐H, Fixed, 95% CI) | 65.16 [19.04, 223.06] | ||||||||||||||||||||||||||||||||||||||||||||||||||||||||||||||||||
| 4.3 by 20 months | 2 | 306 | Risk Ratio (M‐H, Fixed, 95% CI) | 94.80 [13.90, 646.37] | ||||||||||||||||||||||||||||||||||||||||||||||||||||||||||||||||||
| 4.4 by 24 months | 1 | 118 | Risk Ratio (M‐H, Fixed, 95% CI) | 39.77 [2.47, 639.78] | ||||||||||||||||||||||||||||||||||||||||||||||||||||||||||||||||||
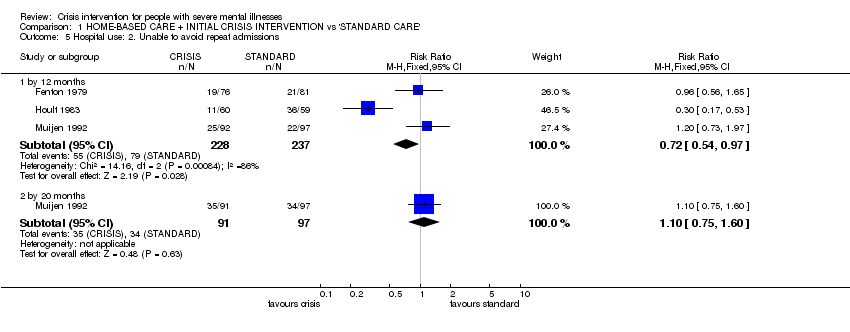
| 5 Hospital use: 2. Unable to avoid repeat admissions Show forest plot | 3 | Risk Ratio (M‐H, Fixed, 95% CI) | Subtotals only | |||||||||||||||||||||||||||||||||||||||||||||||||||||||||||||||||||
| Analysis 1.5  Comparison 1 HOME‐BASED CARE + INITIAL CRISIS INTERVENTION vs 'STANDARD CARE', Outcome 5 Hospital use: 2. Unable to avoid repeat admissions. | ||||||||||||||||||||||||||||||||||||||||||||||||||||||||||||||||||||||
| 5.1 by 12 months | 3 | 465 | Risk Ratio (M‐H, Fixed, 95% CI) | 0.72 [0.54, 0.97] | ||||||||||||||||||||||||||||||||||||||||||||||||||||||||||||||||||
| 5.2 by 20 months | 1 | 188 | Risk Ratio (M‐H, Fixed, 95% CI) | 1.10 [0.75, 1.60] | ||||||||||||||||||||||||||||||||||||||||||||||||||||||||||||||||||
| 6 Hospital use: 3. Home or outpatient visits (data likely to be skewed) Show forest plot | Other data | No numeric data | ||||||||||||||||||||||||||||||||||||||||||||||||||||||||||||||||||||
| Analysis 1.6
Comparison 1 HOME‐BASED CARE + INITIAL CRISIS INTERVENTION vs 'STANDARD CARE', Outcome 6 Hospital use: 3. Home or outpatient visits (data likely to be skewed). | ||||||||||||||||||||||||||||||||||||||||||||||||||||||||||||||||||||||
| 6.1 6 ‐ 12 months | Other data | No numeric data | ||||||||||||||||||||||||||||||||||||||||||||||||||||||||||||||||||||
| 6.2 by 12 months | Other data | No numeric data | ||||||||||||||||||||||||||||||||||||||||||||||||||||||||||||||||||||
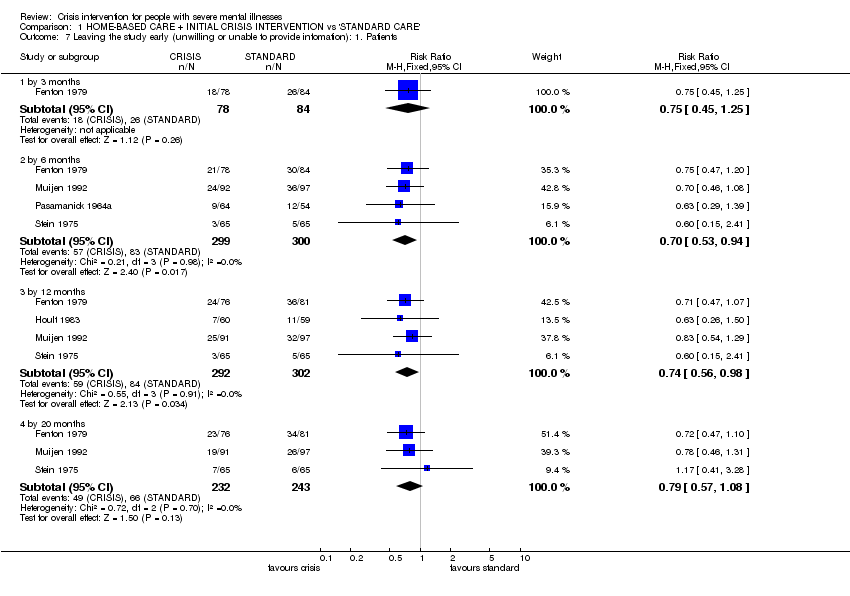
| 7 Leaving the study early (unwilling or unable to provide infomation): 1. Patients Show forest plot | 5 | Risk Ratio (M‐H, Fixed, 95% CI) | Subtotals only | |||||||||||||||||||||||||||||||||||||||||||||||||||||||||||||||||||
| Analysis 1.7  Comparison 1 HOME‐BASED CARE + INITIAL CRISIS INTERVENTION vs 'STANDARD CARE', Outcome 7 Leaving the study early (unwilling or unable to provide infomation): 1. Patients. | ||||||||||||||||||||||||||||||||||||||||||||||||||||||||||||||||||||||
| 7.1 by 3 months | 1 | 162 | Risk Ratio (M‐H, Fixed, 95% CI) | 0.75 [0.45, 1.25] | ||||||||||||||||||||||||||||||||||||||||||||||||||||||||||||||||||
| 7.2 by 6 months | 4 | 599 | Risk Ratio (M‐H, Fixed, 95% CI) | 0.70 [0.53, 0.94] | ||||||||||||||||||||||||||||||||||||||||||||||||||||||||||||||||||
| 7.3 by 12 months | 4 | 594 | Risk Ratio (M‐H, Fixed, 95% CI) | 0.74 [0.56, 0.98] | ||||||||||||||||||||||||||||||||||||||||||||||||||||||||||||||||||
| 7.4 by 20 months | 3 | 475 | Risk Ratio (M‐H, Fixed, 95% CI) | 0.79 [0.57, 1.08] | ||||||||||||||||||||||||||||||||||||||||||||||||||||||||||||||||||
| 8 Leaving the study early (unwilling or unable to provide information) 2. Relatives Show forest plot | 2 | Risk Ratio (M‐H, Fixed, 95% CI) | Subtotals only | |||||||||||||||||||||||||||||||||||||||||||||||||||||||||||||||||||
| Analysis 1.8  Comparison 1 HOME‐BASED CARE + INITIAL CRISIS INTERVENTION vs 'STANDARD CARE', Outcome 8 Leaving the study early (unwilling or unable to provide information) 2. Relatives. | ||||||||||||||||||||||||||||||||||||||||||||||||||||||||||||||||||||||
| 8.1 total in study | 1 | 120 | Risk Ratio (M‐H, Fixed, 95% CI) | 1.09 [0.52, 2.28] | ||||||||||||||||||||||||||||||||||||||||||||||||||||||||||||||||||
| 8.2 subgroup of those living with patient | 1 | 76 | Risk Ratio (M‐H, Fixed, 95% CI) | 0.71 [0.43, 1.17] | ||||||||||||||||||||||||||||||||||||||||||||||||||||||||||||||||||
| 9 Global state: 1. GAS (endpoint score, range 1‐100, low = poor) (loss in some cases is greater than 30%) Show forest plot | 1 | Mean Difference (IV, Fixed, 95% CI) | Subtotals only | |||||||||||||||||||||||||||||||||||||||||||||||||||||||||||||||||||
| Analysis 1.9  Comparison 1 HOME‐BASED CARE + INITIAL CRISIS INTERVENTION vs 'STANDARD CARE', Outcome 9 Global state: 1. GAS (endpoint score, range 1‐100, low = poor) (loss in some cases is greater than 30%). | ||||||||||||||||||||||||||||||||||||||||||||||||||||||||||||||||||||||
| 9.1 by 6 months | 1 | 129 | Mean Difference (IV, Fixed, 95% CI) | 5.10 [‐0.86, 11.06] | ||||||||||||||||||||||||||||||||||||||||||||||||||||||||||||||||||
| 9.2 by 12 months | 1 | 131 | Mean Difference (IV, Fixed, 95% CI) | 3.5 [‐3.15, 10.15] | ||||||||||||||||||||||||||||||||||||||||||||||||||||||||||||||||||
| 9.3 by 20 months | 1 | 142 | Mean Difference (IV, Fixed, 95% CI) | 5.70 [‐0.26, 11.66] | ||||||||||||||||||||||||||||||||||||||||||||||||||||||||||||||||||
| 10 Global state: 2. SAS (endpoint score, high=poor) (loss in some cases in greater than 30%) Show forest plot | 1 | Mean Difference (IV, Fixed, 95% CI) | Subtotals only | |||||||||||||||||||||||||||||||||||||||||||||||||||||||||||||||||||
| Analysis 1.10  Comparison 1 HOME‐BASED CARE + INITIAL CRISIS INTERVENTION vs 'STANDARD CARE', Outcome 10 Global state: 2. SAS (endpoint score, high=poor) (loss in some cases in greater than 30%). | ||||||||||||||||||||||||||||||||||||||||||||||||||||||||||||||||||||||
| 10.1 by 6 months | 1 | 130 | Mean Difference (IV, Fixed, 95% CI) | ‐0.20 [‐0.75, 0.35] | ||||||||||||||||||||||||||||||||||||||||||||||||||||||||||||||||||
| 10.2 by 12 months | 1 | 120 | Mean Difference (IV, Fixed, 95% CI) | ‐0.30 [‐0.85, 0.25] | ||||||||||||||||||||||||||||||||||||||||||||||||||||||||||||||||||
| 10.3 by 20 months | 1 | 139 | Mean Difference (IV, Fixed, 95% CI) | ‐0.60 [‐1.15, ‐0.05] | ||||||||||||||||||||||||||||||||||||||||||||||||||||||||||||||||||
| 11 Global state: 3. GAS scale change data by 3 months (+ve change=good, data likely to be skewed) Show forest plot | 1 | 129 | Mean Difference (IV, Fixed, 95% CI) | 5.20 [‐1.19, 11.59] | ||||||||||||||||||||||||||||||||||||||||||||||||||||||||||||||||||
| Analysis 1.11  Comparison 1 HOME‐BASED CARE + INITIAL CRISIS INTERVENTION vs 'STANDARD CARE', Outcome 11 Global state: 3. GAS scale change data by 3 months (+ve change=good, data likely to be skewed). | ||||||||||||||||||||||||||||||||||||||||||||||||||||||||||||||||||||||
| 12 Global state: 4. SAS change data by 3 months (‐ve change=good, data likely to be skewed) Show forest plot | 1 | 127 | Mean Difference (IV, Fixed, 95% CI) | ‐0.09 [‐0.31, 0.13] | ||||||||||||||||||||||||||||||||||||||||||||||||||||||||||||||||||
| Analysis 1.12  Comparison 1 HOME‐BASED CARE + INITIAL CRISIS INTERVENTION vs 'STANDARD CARE', Outcome 12 Global state: 4. SAS change data by 3 months (‐ve change=good, data likely to be skewed). | ||||||||||||||||||||||||||||||||||||||||||||||||||||||||||||||||||||||
| 13 Mental state ‐ general: 1. Unwell by 12 months Show forest plot | 1 | 120 | Risk Ratio (M‐H, Fixed, 95% CI) | 0.65 [0.40, 1.07] | ||||||||||||||||||||||||||||||||||||||||||||||||||||||||||||||||||
| Analysis 1.13  Comparison 1 HOME‐BASED CARE + INITIAL CRISIS INTERVENTION vs 'STANDARD CARE', Outcome 13 Mental state ‐ general: 1. Unwell by 12 months. | ||||||||||||||||||||||||||||||||||||||||||||||||||||||||||||||||||||||
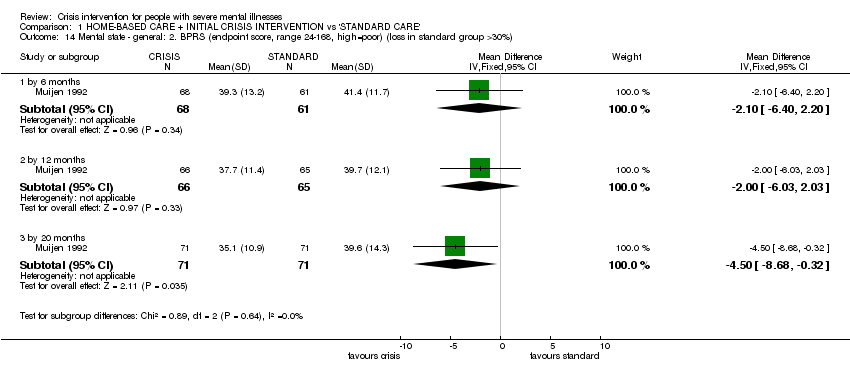
| 14 Mental state ‐ general: 2. BPRS (endpoint score, range 24‐168, high=poor) (loss in standard group >30%) Show forest plot | 1 | Mean Difference (IV, Fixed, 95% CI) | Subtotals only | |||||||||||||||||||||||||||||||||||||||||||||||||||||||||||||||||||
| Analysis 1.14  Comparison 1 HOME‐BASED CARE + INITIAL CRISIS INTERVENTION vs 'STANDARD CARE', Outcome 14 Mental state ‐ general: 2. BPRS (endpoint score, range 24‐168, high=poor) (loss in standard group >30%). | ||||||||||||||||||||||||||||||||||||||||||||||||||||||||||||||||||||||
| 14.1 by 6 months | 1 | 129 | Mean Difference (IV, Fixed, 95% CI) | ‐2.10 [‐6.40, 2.20] | ||||||||||||||||||||||||||||||||||||||||||||||||||||||||||||||||||
| 14.2 by 12 months | 1 | 131 | Mean Difference (IV, Fixed, 95% CI) | ‐2.0 [‐6.03, 2.03] | ||||||||||||||||||||||||||||||||||||||||||||||||||||||||||||||||||
| 14.3 by 20 months | 1 | 142 | Mean Difference (IV, Fixed, 95% CI) | ‐4.5 [‐8.68, ‐0.32] | ||||||||||||||||||||||||||||||||||||||||||||||||||||||||||||||||||
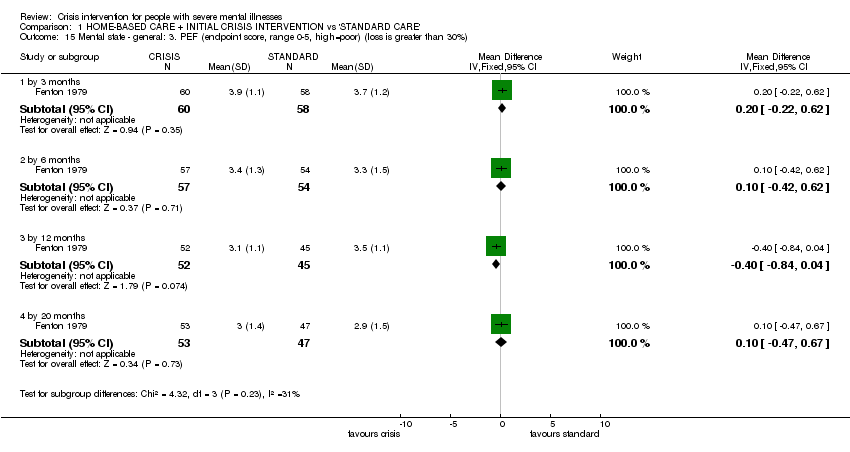
| 15 Mental state ‐ general: 3. PEF (endpoint score, range 0‐5, high=poor) (loss is greater than 30%) Show forest plot | 1 | Mean Difference (IV, Fixed, 95% CI) | Subtotals only | |||||||||||||||||||||||||||||||||||||||||||||||||||||||||||||||||||
| Analysis 1.15  Comparison 1 HOME‐BASED CARE + INITIAL CRISIS INTERVENTION vs 'STANDARD CARE', Outcome 15 Mental state ‐ general: 3. PEF (endpoint score, range 0‐5, high=poor) (loss is greater than 30%). | ||||||||||||||||||||||||||||||||||||||||||||||||||||||||||||||||||||||
| 15.1 by 3 months | 1 | 118 | Mean Difference (IV, Fixed, 95% CI) | 0.20 [‐0.22, 0.62] | ||||||||||||||||||||||||||||||||||||||||||||||||||||||||||||||||||
| 15.2 by 6 months | 1 | 111 | Mean Difference (IV, Fixed, 95% CI) | 0.10 [‐0.42, 0.62] | ||||||||||||||||||||||||||||||||||||||||||||||||||||||||||||||||||
| 15.3 by 12 months | 1 | 97 | Mean Difference (IV, Fixed, 95% CI) | ‐0.40 [‐0.84, 0.04] | ||||||||||||||||||||||||||||||||||||||||||||||||||||||||||||||||||
| 15.4 by 20 months | 1 | 100 | Mean Difference (IV, Fixed, 95% CI) | 0.10 [‐0.47, 0.67] | ||||||||||||||||||||||||||||||||||||||||||||||||||||||||||||||||||
| 16 Mental state ‐ general: 4. PSE (endpoint score, high score = poor, data likely to be skewed) Show forest plot | Other data | No numeric data | ||||||||||||||||||||||||||||||||||||||||||||||||||||||||||||||||||||
| Analysis 1.16
Comparison 1 HOME‐BASED CARE + INITIAL CRISIS INTERVENTION vs 'STANDARD CARE', Outcome 16 Mental state ‐ general: 4. PSE (endpoint score, high score = poor, data likely to be skewed). | ||||||||||||||||||||||||||||||||||||||||||||||||||||||||||||||||||||||
| 16.1 by 6 months | Other data | No numeric data | ||||||||||||||||||||||||||||||||||||||||||||||||||||||||||||||||||||
| 16.2 by 12 months | Other data | No numeric data | ||||||||||||||||||||||||||||||||||||||||||||||||||||||||||||||||||||
| 16.3 by 20 months | Other data | No numeric data | ||||||||||||||||||||||||||||||||||||||||||||||||||||||||||||||||||||
| 17 Mental state ‐ general: 5. BPRS scale change data by 3 months (‐ve change=good, data likely to be skewed) Show forest plot | 1 | 129 | Mean Difference (IV, Fixed, 95% CI) | ‐3.5 [‐8.92, 1.92] | ||||||||||||||||||||||||||||||||||||||||||||||||||||||||||||||||||
| Analysis 1.17  Comparison 1 HOME‐BASED CARE + INITIAL CRISIS INTERVENTION vs 'STANDARD CARE', Outcome 17 Mental state ‐ general: 5. BPRS scale change data by 3 months (‐ve change=good, data likely to be skewed). | ||||||||||||||||||||||||||||||||||||||||||||||||||||||||||||||||||||||
| 18 Mental state ‐ general: 6. PSE scale change data by 3 months (‐ve change=good, data likely to be skewed). Show forest plot | 1 | 129 | Mean Difference (IV, Fixed, 95% CI) | ‐2.70 [‐7.69, 2.29] | ||||||||||||||||||||||||||||||||||||||||||||||||||||||||||||||||||
| Analysis 1.18  Comparison 1 HOME‐BASED CARE + INITIAL CRISIS INTERVENTION vs 'STANDARD CARE', Outcome 18 Mental state ‐ general: 6. PSE scale change data by 3 months (‐ve change=good, data likely to be skewed).. | ||||||||||||||||||||||||||||||||||||||||||||||||||||||||||||||||||||||
| 19 Mental state ‐ specific: 1. Unsociable (reported by relatives) Show forest plot | 1 | Risk Ratio (M‐H, Fixed, 95% CI) | Subtotals only | |||||||||||||||||||||||||||||||||||||||||||||||||||||||||||||||||||
| Analysis 1.19  Comparison 1 HOME‐BASED CARE + INITIAL CRISIS INTERVENTION vs 'STANDARD CARE', Outcome 19 Mental state ‐ specific: 1. Unsociable (reported by relatives). | ||||||||||||||||||||||||||||||||||||||||||||||||||||||||||||||||||||||
| 19.1 by 3 months | 1 | 120 | Risk Ratio (M‐H, Fixed, 95% CI) | 0.86 [0.66, 1.12] | ||||||||||||||||||||||||||||||||||||||||||||||||||||||||||||||||||
| 19.2 by 6 months | 1 | 120 | Risk Ratio (M‐H, Fixed, 95% CI) | 0.43 [0.30, 0.64] | ||||||||||||||||||||||||||||||||||||||||||||||||||||||||||||||||||
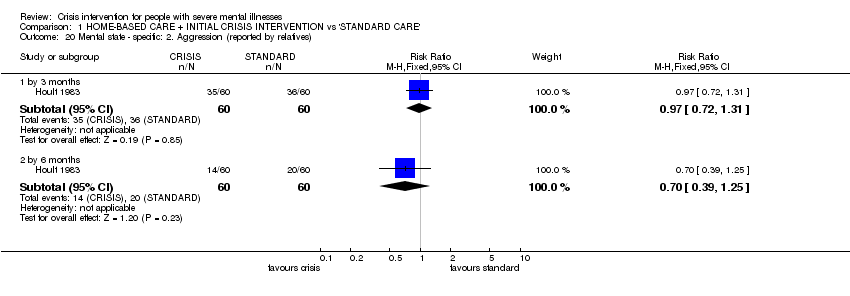
| 20 Mental state ‐ specific: 2. Aggression (reported by relatives) Show forest plot | 1 | Risk Ratio (M‐H, Fixed, 95% CI) | Subtotals only | |||||||||||||||||||||||||||||||||||||||||||||||||||||||||||||||||||
| Analysis 1.20  Comparison 1 HOME‐BASED CARE + INITIAL CRISIS INTERVENTION vs 'STANDARD CARE', Outcome 20 Mental state ‐ specific: 2. Aggression (reported by relatives). | ||||||||||||||||||||||||||||||||||||||||||||||||||||||||||||||||||||||
| 20.1 by 3 months | 1 | 120 | Risk Ratio (M‐H, Fixed, 95% CI) | 0.97 [0.72, 1.31] | ||||||||||||||||||||||||||||||||||||||||||||||||||||||||||||||||||
| 20.2 by 6 months | 1 | 120 | Risk Ratio (M‐H, Fixed, 95% CI) | 0.7 [0.39, 1.25] | ||||||||||||||||||||||||||||||||||||||||||||||||||||||||||||||||||
| 21 Mental state ‐ specific: 3. Various problems at 4 months (reported by relatives) Show forest plot | 1 | Risk Ratio (M‐H, Fixed, 95% CI) | Subtotals only | |||||||||||||||||||||||||||||||||||||||||||||||||||||||||||||||||||
| Analysis 1.21  Comparison 1 HOME‐BASED CARE + INITIAL CRISIS INTERVENTION vs 'STANDARD CARE', Outcome 21 Mental state ‐ specific: 3. Various problems at 4 months (reported by relatives). | ||||||||||||||||||||||||||||||||||||||||||||||||||||||||||||||||||||||
| 21.1 agitation | 1 | 120 | Risk Ratio (M‐H, Fixed, 95% CI) | 0.59 [0.36, 0.95] | ||||||||||||||||||||||||||||||||||||||||||||||||||||||||||||||||||
| 21.2 depression | 1 | 120 | Risk Ratio (M‐H, Fixed, 95% CI) | 0.8 [0.57, 1.13] | ||||||||||||||||||||||||||||||||||||||||||||||||||||||||||||||||||
| 21.3 disorientation | 1 | 120 | Risk Ratio (M‐H, Fixed, 95% CI) | 0.47 [0.28, 0.79] | ||||||||||||||||||||||||||||||||||||||||||||||||||||||||||||||||||
| 21.4 psychotic behaviour | 1 | 120 | Risk Ratio (M‐H, Fixed, 95% CI) | 0.58 [0.30, 1.11] | ||||||||||||||||||||||||||||||||||||||||||||||||||||||||||||||||||
| 21.5 substance abuse | 1 | 120 | Risk Ratio (M‐H, Fixed, 95% CI) | 0.67 [0.33, 1.36] | ||||||||||||||||||||||||||||||||||||||||||||||||||||||||||||||||||
| 21.6 withdrawl | 1 | 120 | Risk Ratio (M‐H, Fixed, 95% CI) | 0.72 [0.48, 1.07] | ||||||||||||||||||||||||||||||||||||||||||||||||||||||||||||||||||
| 22 Burden ‐ family: 1. Disruption to daily routine Show forest plot | 2 | Risk Ratio (M‐H, Fixed, 95% CI) | Subtotals only | |||||||||||||||||||||||||||||||||||||||||||||||||||||||||||||||||||
| Analysis 1.22  Comparison 1 HOME‐BASED CARE + INITIAL CRISIS INTERVENTION vs 'STANDARD CARE', Outcome 22 Burden ‐ family: 1. Disruption to daily routine. | ||||||||||||||||||||||||||||||||||||||||||||||||||||||||||||||||||||||
| 22.1 by 3 months | 2 | 220 | Risk Ratio (M‐H, Fixed, 95% CI) | 0.74 [0.58, 0.96] | ||||||||||||||||||||||||||||||||||||||||||||||||||||||||||||||||||
| 22.2 by 6 months | 2 | 220 | Risk Ratio (M‐H, Fixed, 95% CI) | 0.69 [0.52, 0.92] | ||||||||||||||||||||||||||||||||||||||||||||||||||||||||||||||||||
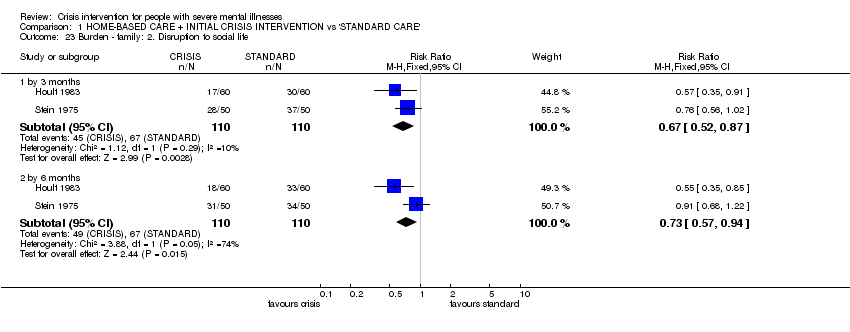
| 23 Burden ‐ family: 2. Disruption to social life Show forest plot | 2 | Risk Ratio (M‐H, Fixed, 95% CI) | Subtotals only | |||||||||||||||||||||||||||||||||||||||||||||||||||||||||||||||||||
| Analysis 1.23  Comparison 1 HOME‐BASED CARE + INITIAL CRISIS INTERVENTION vs 'STANDARD CARE', Outcome 23 Burden ‐ family: 2. Disruption to social life. | ||||||||||||||||||||||||||||||||||||||||||||||||||||||||||||||||||||||
| 23.1 by 3 months | 2 | 220 | Risk Ratio (M‐H, Fixed, 95% CI) | 0.67 [0.52, 0.87] | ||||||||||||||||||||||||||||||||||||||||||||||||||||||||||||||||||
| 23.2 by 6 months | 2 | 220 | Risk Ratio (M‐H, Fixed, 95% CI) | 0.73 [0.57, 0.94] | ||||||||||||||||||||||||||||||||||||||||||||||||||||||||||||||||||
| 24 Burden ‐ family: 3. Financial strain Show forest plot | 1 | Risk Ratio (M‐H, Fixed, 95% CI) | Subtotals only | |||||||||||||||||||||||||||||||||||||||||||||||||||||||||||||||||||
| Analysis 1.24  Comparison 1 HOME‐BASED CARE + INITIAL CRISIS INTERVENTION vs 'STANDARD CARE', Outcome 24 Burden ‐ family: 3. Financial strain. | ||||||||||||||||||||||||||||||||||||||||||||||||||||||||||||||||||||||
| 24.1 by 3 months | 1 | 120 | Risk Ratio (M‐H, Fixed, 95% CI) | 0.76 [0.52, 1.10] | ||||||||||||||||||||||||||||||||||||||||||||||||||||||||||||||||||
| 24.2 by 6 months | 1 | 120 | Risk Ratio (M‐H, Fixed, 95% CI) | 0.84 [0.53, 1.33] | ||||||||||||||||||||||||||||||||||||||||||||||||||||||||||||||||||
| 25 Burden ‐ family: 4. Physical illness due to patient's illness Show forest plot | 1 | Risk Ratio (M‐H, Fixed, 95% CI) | Subtotals only | |||||||||||||||||||||||||||||||||||||||||||||||||||||||||||||||||||
| Analysis 1.25  Comparison 1 HOME‐BASED CARE + INITIAL CRISIS INTERVENTION vs 'STANDARD CARE', Outcome 25 Burden ‐ family: 4. Physical illness due to patient's illness. | ||||||||||||||||||||||||||||||||||||||||||||||||||||||||||||||||||||||
| 25.1 by 3 months | 1 | 100 | Risk Ratio (M‐H, Fixed, 95% CI) | 0.78 [0.65, 0.95] | ||||||||||||||||||||||||||||||||||||||||||||||||||||||||||||||||||
| 25.2 by 6 months | 1 | 100 | Risk Ratio (M‐H, Fixed, 95% CI) | 0.71 [0.55, 0.92] | ||||||||||||||||||||||||||||||||||||||||||||||||||||||||||||||||||
| 26 Burden ‐ family: 5. Overall burden is great Show forest plot | 1 | Risk Ratio (M‐H, Fixed, 95% CI) | Subtotals only | |||||||||||||||||||||||||||||||||||||||||||||||||||||||||||||||||||
| Analysis 1.26  Comparison 1 HOME‐BASED CARE + INITIAL CRISIS INTERVENTION vs 'STANDARD CARE', Outcome 26 Burden ‐ family: 5. Overall burden is great. | ||||||||||||||||||||||||||||||||||||||||||||||||||||||||||||||||||||||
| 26.1 by 3 months | 1 | 120 | Risk Ratio (M‐H, Fixed, 95% CI) | 0.57 [0.41, 0.80] | ||||||||||||||||||||||||||||||||||||||||||||||||||||||||||||||||||
| 26.2 by 6 months | 1 | 120 | Risk Ratio (M‐H, Fixed, 95% CI) | 0.34 [0.20, 0.59] | ||||||||||||||||||||||||||||||||||||||||||||||||||||||||||||||||||
| 27 Burden ‐ community: 1. Not employed by 20 months Show forest plot | 1 | 189 | Risk Ratio (M‐H, Fixed, 95% CI) | 0.97 [0.85, 1.12] | ||||||||||||||||||||||||||||||||||||||||||||||||||||||||||||||||||
| Analysis 1.27  Comparison 1 HOME‐BASED CARE + INITIAL CRISIS INTERVENTION vs 'STANDARD CARE', Outcome 27 Burden ‐ community: 1. Not employed by 20 months. | ||||||||||||||||||||||||||||||||||||||||||||||||||||||||||||||||||||||
| 28 Burden ‐ community: 2. Various outcomes by 12 months Show forest plot | 1 | Risk Ratio (M‐H, Fixed, 95% CI) | Subtotals only | |||||||||||||||||||||||||||||||||||||||||||||||||||||||||||||||||||
| Analysis 1.28  Comparison 1 HOME‐BASED CARE + INITIAL CRISIS INTERVENTION vs 'STANDARD CARE', Outcome 28 Burden ‐ community: 2. Various outcomes by 12 months. | ||||||||||||||||||||||||||||||||||||||||||||||||||||||||||||||||||||||
| 28.1 at least one arrest | 1 | 120 | Risk Ratio (M‐H, Fixed, 95% CI) | 0.71 [0.46, 1.12] | ||||||||||||||||||||||||||||||||||||||||||||||||||||||||||||||||||
| 28.2 at least one use of emergency services | 1 | 120 | Risk Ratio (M‐H, Fixed, 95% CI) | 0.81 [0.43, 1.54] | ||||||||||||||||||||||||||||||||||||||||||||||||||||||||||||||||||
| 29 Satisfaction ‐ patient: 1. Various outcomes by 12 months Show forest plot | 1 | Risk Ratio (M‐H, Fixed, 95% CI) | Subtotals only | |||||||||||||||||||||||||||||||||||||||||||||||||||||||||||||||||||
| Analysis 1.29  Comparison 1 HOME‐BASED CARE + INITIAL CRISIS INTERVENTION vs 'STANDARD CARE', Outcome 29 Satisfaction ‐ patient: 1. Various outcomes by 12 months. | ||||||||||||||||||||||||||||||||||||||||||||||||||||||||||||||||||||||
| 29.1 feels unimproved | 1 | 119 | Risk Ratio (M‐H, Fixed, 95% CI) | 0.48 [0.31, 0.74] | ||||||||||||||||||||||||||||||||||||||||||||||||||||||||||||||||||
| 29.2 dissatisfied with treatment received | 1 | 119 | Risk Ratio (M‐H, Fixed, 95% CI) | 0.66 [0.50, 0.88] | ||||||||||||||||||||||||||||||||||||||||||||||||||||||||||||||||||
| 29.3 prefered to get other treatment | 1 | 119 | Risk Ratio (M‐H, Fixed, 95% CI) | 0.46 [0.27, 0.77] | ||||||||||||||||||||||||||||||||||||||||||||||||||||||||||||||||||
| 29.4 feels less able to cope | 1 | 119 | Risk Ratio (M‐H, Fixed, 95% CI) | 0.36 [0.21, 0.62] | ||||||||||||||||||||||||||||||||||||||||||||||||||||||||||||||||||
| 29.5 feels will need more help outside working hours in the future | 1 | 119 | Risk Ratio (M‐H, Fixed, 95% CI) | 1.48 [0.88, 2.48] | ||||||||||||||||||||||||||||||||||||||||||||||||||||||||||||||||||
| 30 Satisfaction ‐ patient: 2. Patient not satisitfied with care: Satisfaction Scale (endpoint score, range 0 ‐32, Show forest plot | 1 | Mean Difference (IV, Fixed, 95% CI) | Subtotals only | |||||||||||||||||||||||||||||||||||||||||||||||||||||||||||||||||||
| Analysis 1.30  Comparison 1 HOME‐BASED CARE + INITIAL CRISIS INTERVENTION vs 'STANDARD CARE', Outcome 30 Satisfaction ‐ patient: 2. Patient not satisitfied with care: Satisfaction Scale (endpoint score, range 0 ‐32,. | ||||||||||||||||||||||||||||||||||||||||||||||||||||||||||||||||||||||
| 30.1 by 6 months | 1 | 115 | Mean Difference (IV, Fixed, 95% CI) | 5.10 [3.16, 7.04] | ||||||||||||||||||||||||||||||||||||||||||||||||||||||||||||||||||
| 30.2 by 12 months | 1 | 121 | Mean Difference (IV, Fixed, 95% CI) | 4.80 [3.11, 6.49] | ||||||||||||||||||||||||||||||||||||||||||||||||||||||||||||||||||
| 30.3 by 20 months | 1 | 137 | Mean Difference (IV, Fixed, 95% CI) | 5.40 [3.91, 6.89] | ||||||||||||||||||||||||||||||||||||||||||||||||||||||||||||||||||
| 31 Satisfaction ‐ relatives: 1. Feels patient is not improved Show forest plot | 1 | Risk Ratio (M‐H, Fixed, 95% CI) | Subtotals only | |||||||||||||||||||||||||||||||||||||||||||||||||||||||||||||||||||
| Analysis 1.31  Comparison 1 HOME‐BASED CARE + INITIAL CRISIS INTERVENTION vs 'STANDARD CARE', Outcome 31 Satisfaction ‐ relatives: 1. Feels patient is not improved. | ||||||||||||||||||||||||||||||||||||||||||||||||||||||||||||||||||||||
| 31.1 by 3 months | 1 | 120 | Risk Ratio (M‐H, Fixed, 95% CI) | 0.79 [0.60, 1.04] | ||||||||||||||||||||||||||||||||||||||||||||||||||||||||||||||||||
| 31.2 by 6 months | 1 | 120 | Risk Ratio (M‐H, Fixed, 95% CI) | 0.71 [0.53, 0.97] | ||||||||||||||||||||||||||||||||||||||||||||||||||||||||||||||||||
| 32 Satisfaction ‐ relatives: 2. Dissatisfied with treatment received Show forest plot | 1 | Risk Ratio (M‐H, Fixed, 95% CI) | Subtotals only | |||||||||||||||||||||||||||||||||||||||||||||||||||||||||||||||||||
| Analysis 1.32  Comparison 1 HOME‐BASED CARE + INITIAL CRISIS INTERVENTION vs 'STANDARD CARE', Outcome 32 Satisfaction ‐ relatives: 2. Dissatisfied with treatment received. | ||||||||||||||||||||||||||||||||||||||||||||||||||||||||||||||||||||||
| 32.1 by 3 months | 1 | 120 | Risk Ratio (M‐H, Fixed, 95% CI) | 0.63 [0.44, 0.89] | ||||||||||||||||||||||||||||||||||||||||||||||||||||||||||||||||||
| 32.2 by 6 months | 1 | 120 | Risk Ratio (M‐H, Fixed, 95% CI) | 0.57 [0.42, 0.78] | ||||||||||||||||||||||||||||||||||||||||||||||||||||||||||||||||||
| 32.3 by 12 months | 1 | 120 | Risk Ratio (M‐H, Fixed, 95% CI) | 0.46 [0.29, 0.72] | ||||||||||||||||||||||||||||||||||||||||||||||||||||||||||||||||||
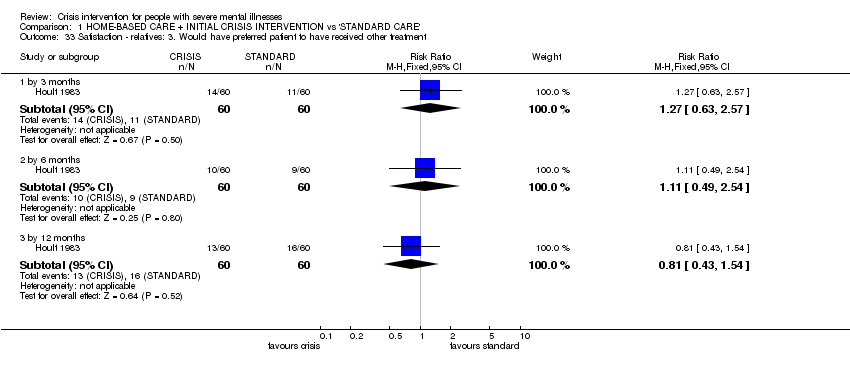
| 33 Satisfaction ‐ relatives: 3. Would have preferred patient to have received other treatment Show forest plot | 1 | Risk Ratio (M‐H, Fixed, 95% CI) | Subtotals only | |||||||||||||||||||||||||||||||||||||||||||||||||||||||||||||||||||
| Analysis 1.33  Comparison 1 HOME‐BASED CARE + INITIAL CRISIS INTERVENTION vs 'STANDARD CARE', Outcome 33 Satisfaction ‐ relatives: 3. Would have preferred patient to have received other treatment. | ||||||||||||||||||||||||||||||||||||||||||||||||||||||||||||||||||||||
| 33.1 by 3 months | 1 | 120 | Risk Ratio (M‐H, Fixed, 95% CI) | 1.27 [0.63, 2.57] | ||||||||||||||||||||||||||||||||||||||||||||||||||||||||||||||||||
| 33.2 by 6 months | 1 | 120 | Risk Ratio (M‐H, Fixed, 95% CI) | 1.11 [0.49, 2.54] | ||||||||||||||||||||||||||||||||||||||||||||||||||||||||||||||||||
| 33.3 by 12 months | 1 | 120 | Risk Ratio (M‐H, Fixed, 95% CI) | 0.81 [0.43, 1.54] | ||||||||||||||||||||||||||||||||||||||||||||||||||||||||||||||||||
| 34 Satisfaction ‐ relatives: 4. Various outcomes by 12 months Show forest plot | 1 | Risk Ratio (M‐H, Fixed, 95% CI) | Subtotals only | |||||||||||||||||||||||||||||||||||||||||||||||||||||||||||||||||||
| Analysis 1.34  Comparison 1 HOME‐BASED CARE + INITIAL CRISIS INTERVENTION vs 'STANDARD CARE', Outcome 34 Satisfaction ‐ relatives: 4. Various outcomes by 12 months. | ||||||||||||||||||||||||||||||||||||||||||||||||||||||||||||||||||||||
| 34.1 feel themselves less able to cope | 1 | 120 | Risk Ratio (M‐H, Fixed, 95% CI) | 0.57 [0.42, 0.78] | ||||||||||||||||||||||||||||||||||||||||||||||||||||||||||||||||||
| 34.2 feel themsleves to need more help outside working hours in the future | 1 | 120 | Risk Ratio (M‐H, Fixed, 95% CI) | 1.21 [0.91, 1.60] | ||||||||||||||||||||||||||||||||||||||||||||||||||||||||||||||||||
| 35 Economic cost per patient (data likely to be skewed) Show forest plot | Other data | No numeric data | ||||||||||||||||||||||||||||||||||||||||||||||||||||||||||||||||||||
| Analysis 1.35
Comparison 1 HOME‐BASED CARE + INITIAL CRISIS INTERVENTION vs 'STANDARD CARE', Outcome 35 Economic cost per patient (data likely to be skewed). | ||||||||||||||||||||||||||||||||||||||||||||||||||||||||||||||||||||||
| 35.1 total cost for trial period ‐ as assessed by researchers | Other data | No numeric data | ||||||||||||||||||||||||||||||||||||||||||||||||||||||||||||||||||||
| 35.2 total cost for trial period ‐ as assessed by finance department | Other data | No numeric data | ||||||||||||||||||||||||||||||||||||||||||||||||||||||||||||||||||||
| 35.3 per week | Other data | No numeric data | ||||||||||||||||||||||||||||||||||||||||||||||||||||||||||||||||||||

Comparison 1 HOME‐BASED CARE + INITIAL CRISIS INTERVENTION vs 'STANDARD CARE', Outcome 1 Death: 1. Any cause.

Comparison 1 HOME‐BASED CARE + INITIAL CRISIS INTERVENTION vs 'STANDARD CARE', Outcome 2 Death: 2. By cause.

Comparison 1 HOME‐BASED CARE + INITIAL CRISIS INTERVENTION vs 'STANDARD CARE', Outcome 3 Harm to self or others.
Comparison 1 HOME‐BASED CARE + INITIAL CRISIS INTERVENTION vs 'STANDARD CARE', Outcome 4 Hospital use: 1. Unable to keep to initial trial protocol as regards admission.
Comparison 1 HOME‐BASED CARE + INITIAL CRISIS INTERVENTION vs 'STANDARD CARE', Outcome 5 Hospital use: 2. Unable to avoid repeat admissions.
| Study | Interventions | Mean | SD | N | Notes |
| 6 ‐ 12 months | |||||
| Fenton 1979 | Crisis/home group | 2.1 | 3.4 | 76 | Difference favouring home group (two tailed t‐test, p=0.005) |
| Fenton 1979 | Standard care group | 6.3 | 12.3 | 79 | |
| by 12 months | |||||
| Fenton 1979 | Crisis/home group | 16.5 | 11.7 | 76 | No difference between the groups (two tailed t test p>0.05) |
| Fenton 1979 | Standard care group | 13.0 | 19.2 | 79 | |
Comparison 1 HOME‐BASED CARE + INITIAL CRISIS INTERVENTION vs 'STANDARD CARE', Outcome 6 Hospital use: 3. Home or outpatient visits (data likely to be skewed).
Comparison 1 HOME‐BASED CARE + INITIAL CRISIS INTERVENTION vs 'STANDARD CARE', Outcome 7 Leaving the study early (unwilling or unable to provide infomation): 1. Patients.

Comparison 1 HOME‐BASED CARE + INITIAL CRISIS INTERVENTION vs 'STANDARD CARE', Outcome 8 Leaving the study early (unwilling or unable to provide information) 2. Relatives.

Comparison 1 HOME‐BASED CARE + INITIAL CRISIS INTERVENTION vs 'STANDARD CARE', Outcome 9 Global state: 1. GAS (endpoint score, range 1‐100, low = poor) (loss in some cases is greater than 30%).

Comparison 1 HOME‐BASED CARE + INITIAL CRISIS INTERVENTION vs 'STANDARD CARE', Outcome 10 Global state: 2. SAS (endpoint score, high=poor) (loss in some cases in greater than 30%).

Comparison 1 HOME‐BASED CARE + INITIAL CRISIS INTERVENTION vs 'STANDARD CARE', Outcome 11 Global state: 3. GAS scale change data by 3 months (+ve change=good, data likely to be skewed).

Comparison 1 HOME‐BASED CARE + INITIAL CRISIS INTERVENTION vs 'STANDARD CARE', Outcome 12 Global state: 4. SAS change data by 3 months (‐ve change=good, data likely to be skewed).

Comparison 1 HOME‐BASED CARE + INITIAL CRISIS INTERVENTION vs 'STANDARD CARE', Outcome 13 Mental state ‐ general: 1. Unwell by 12 months.
Comparison 1 HOME‐BASED CARE + INITIAL CRISIS INTERVENTION vs 'STANDARD CARE', Outcome 14 Mental state ‐ general: 2. BPRS (endpoint score, range 24‐168, high=poor) (loss in standard group >30%).
Comparison 1 HOME‐BASED CARE + INITIAL CRISIS INTERVENTION vs 'STANDARD CARE', Outcome 15 Mental state ‐ general: 3. PEF (endpoint score, range 0‐5, high=poor) (loss is greater than 30%).
| Study | Interventions | Mean | SD | N | Notes |
| by 6 months | |||||
| Muijen 1992 | Crisis/home care group | 13.5 | 11.5 | 67 | No difference between groups (ANCOVA, p = not reported). |
| Muijen 1992 | Standard care group | 16.5 | 12.1 | 61 | |
| by 12 months | |||||
| Muijen 1992 | Crisis/home care group | 11.8 | 12.0 | 64 | No difference between groups (ANCOVA, p = not reported). |
| Muijen 1992 | Standard care group | 13.8 | 14.4 | 64 | |
| by 20 months | |||||
| Muijen 1992 | Crisis/home care group | 8.2 | 9.3 | 72 | Result not statistically significant (p=0.09) |
| Muijen 1992 | Standard care group | 12.2 | 15.0 | 70 | |
Comparison 1 HOME‐BASED CARE + INITIAL CRISIS INTERVENTION vs 'STANDARD CARE', Outcome 16 Mental state ‐ general: 4. PSE (endpoint score, high score = poor, data likely to be skewed).

Comparison 1 HOME‐BASED CARE + INITIAL CRISIS INTERVENTION vs 'STANDARD CARE', Outcome 17 Mental state ‐ general: 5. BPRS scale change data by 3 months (‐ve change=good, data likely to be skewed).

Comparison 1 HOME‐BASED CARE + INITIAL CRISIS INTERVENTION vs 'STANDARD CARE', Outcome 18 Mental state ‐ general: 6. PSE scale change data by 3 months (‐ve change=good, data likely to be skewed)..

Comparison 1 HOME‐BASED CARE + INITIAL CRISIS INTERVENTION vs 'STANDARD CARE', Outcome 19 Mental state ‐ specific: 1. Unsociable (reported by relatives).
Comparison 1 HOME‐BASED CARE + INITIAL CRISIS INTERVENTION vs 'STANDARD CARE', Outcome 20 Mental state ‐ specific: 2. Aggression (reported by relatives).

Comparison 1 HOME‐BASED CARE + INITIAL CRISIS INTERVENTION vs 'STANDARD CARE', Outcome 21 Mental state ‐ specific: 3. Various problems at 4 months (reported by relatives).

Comparison 1 HOME‐BASED CARE + INITIAL CRISIS INTERVENTION vs 'STANDARD CARE', Outcome 22 Burden ‐ family: 1. Disruption to daily routine.
Comparison 1 HOME‐BASED CARE + INITIAL CRISIS INTERVENTION vs 'STANDARD CARE', Outcome 23 Burden ‐ family: 2. Disruption to social life.

Comparison 1 HOME‐BASED CARE + INITIAL CRISIS INTERVENTION vs 'STANDARD CARE', Outcome 24 Burden ‐ family: 3. Financial strain.

Comparison 1 HOME‐BASED CARE + INITIAL CRISIS INTERVENTION vs 'STANDARD CARE', Outcome 25 Burden ‐ family: 4. Physical illness due to patient's illness.

Comparison 1 HOME‐BASED CARE + INITIAL CRISIS INTERVENTION vs 'STANDARD CARE', Outcome 26 Burden ‐ family: 5. Overall burden is great.

Comparison 1 HOME‐BASED CARE + INITIAL CRISIS INTERVENTION vs 'STANDARD CARE', Outcome 27 Burden ‐ community: 1. Not employed by 20 months.

Comparison 1 HOME‐BASED CARE + INITIAL CRISIS INTERVENTION vs 'STANDARD CARE', Outcome 28 Burden ‐ community: 2. Various outcomes by 12 months.

Comparison 1 HOME‐BASED CARE + INITIAL CRISIS INTERVENTION vs 'STANDARD CARE', Outcome 29 Satisfaction ‐ patient: 1. Various outcomes by 12 months.

Comparison 1 HOME‐BASED CARE + INITIAL CRISIS INTERVENTION vs 'STANDARD CARE', Outcome 30 Satisfaction ‐ patient: 2. Patient not satisitfied with care: Satisfaction Scale (endpoint score, range 0 ‐32,.

Comparison 1 HOME‐BASED CARE + INITIAL CRISIS INTERVENTION vs 'STANDARD CARE', Outcome 31 Satisfaction ‐ relatives: 1. Feels patient is not improved.

Comparison 1 HOME‐BASED CARE + INITIAL CRISIS INTERVENTION vs 'STANDARD CARE', Outcome 32 Satisfaction ‐ relatives: 2. Dissatisfied with treatment received.
Comparison 1 HOME‐BASED CARE + INITIAL CRISIS INTERVENTION vs 'STANDARD CARE', Outcome 33 Satisfaction ‐ relatives: 3. Would have preferred patient to have received other treatment.

Comparison 1 HOME‐BASED CARE + INITIAL CRISIS INTERVENTION vs 'STANDARD CARE', Outcome 34 Satisfaction ‐ relatives: 4. Various outcomes by 12 months.
| Study | Interventions | Mean | SD | N | Notes |
| total cost for trial period ‐ as assessed by researchers | |||||
| Fenton 1979 | Crisis/home care group | $1980 | $1850 | 79 | Difference favouring home group stated (2 tailed t‐test p<0.001) |
| Fenton 1979 | Standard care group | $3250 | $2410 | 76 | |
| total cost for trial period ‐ as assessed by finance department | |||||
| Fenton 1979 | Crisis/home care group | $3230 | $5120 | 79 | Difference favouring home group (2 tailed t‐test p=0.001) |
| Fenton 1979 | Standard care group | $6750 | $7180 | 76 | |
| per week | |||||
| Muijen 1992 | Crisis/home care group | £196 | £97 | 55 | Over 20 month trial period |
| Muijen 1992 | Standard care group | £358 | £241 | 48 | Difference favouring home group (p=0.000) |
Comparison 1 HOME‐BASED CARE + INITIAL CRISIS INTERVENTION vs 'STANDARD CARE', Outcome 35 Economic cost per patient (data likely to be skewed).
| Methods | Participants | Interventions | Outcomes | Notes |
| Allocation: randomised, with sequence generation and concealment of allocation clearly described. | Diagnosis: schizophrenia or related psychoses. | 1. Home care: assertive community treatment + crisis team, multidisciplinary, 24 hr service, drug treatment, psychotherapy, instruction in living skills. N=150. | Death. | * Size of study with sufficient power to highlight about a 10% difference between groups for primary outcome. |
| Outcome or subgroup title | No. of studies | No. of participants | Statistical method | Effect size |
| 1 Death: 1. Any cause Show forest plot | 4 | 601 | Risk Ratio (M‐H, Fixed, 95% CI) | 0.75 [0.30, 1.88] |
| 2 Death: 2. By cause Show forest plot | 4 | Risk Ratio (M‐H, Fixed, 95% CI) | Subtotals only | |
| 2.1 natural causes | 4 | 601 | Risk Ratio (M‐H, Fixed, 95% CI) | 0.84 [0.23, 3.09] |
| 2.2 suicide or death in suspicious circumstances | 4 | 601 | Risk Ratio (M‐H, Fixed, 95% CI) | 0.74 [0.24, 2.32] |
| 3 Harm to self or others Show forest plot | 3 | Risk Ratio (M‐H, Fixed, 95% CI) | Subtotals only | |
| 3.1 attempted suicide | 2 | 250 | Risk Ratio (M‐H, Fixed, 95% CI) | 1.33 [0.87, 2.03] |
| 3.2 homicide | 1 | 189 | Risk Ratio (M‐H, Fixed, 95% CI) | 3.16 [0.13, 76.63] |
| 4 Hospital use: 1. Unable to keep to initial trial protocol as regards admission Show forest plot | 5 | Risk Ratio (M‐H, Fixed, 95% CI) | Subtotals only | |
| 4.1 by 6 months | 3 | 427 | Risk Ratio (M‐H, Fixed, 95% CI) | 61.09 [12.58, 296.63] |
| 4.2 by 12 months | 5 | 713 | Risk Ratio (M‐H, Fixed, 95% CI) | 65.16 [19.04, 223.06] |
| 4.3 by 20 months | 2 | 306 | Risk Ratio (M‐H, Fixed, 95% CI) | 94.80 [13.90, 646.37] |
| 4.4 by 24 months | 1 | 118 | Risk Ratio (M‐H, Fixed, 95% CI) | 39.77 [2.47, 639.78] |
| 5 Hospital use: 2. Unable to avoid repeat admissions Show forest plot | 3 | Risk Ratio (M‐H, Fixed, 95% CI) | Subtotals only | |
| 5.1 by 12 months | 3 | 465 | Risk Ratio (M‐H, Fixed, 95% CI) | 0.72 [0.54, 0.97] |
| 5.2 by 20 months | 1 | 188 | Risk Ratio (M‐H, Fixed, 95% CI) | 1.10 [0.75, 1.60] |
| 6 Hospital use: 3. Home or outpatient visits (data likely to be skewed) Show forest plot | Other data | No numeric data | ||
| 6.1 6 ‐ 12 months | Other data | No numeric data | ||
| 6.2 by 12 months | Other data | No numeric data | ||
| 7 Leaving the study early (unwilling or unable to provide infomation): 1. Patients Show forest plot | 5 | Risk Ratio (M‐H, Fixed, 95% CI) | Subtotals only | |
| 7.1 by 3 months | 1 | 162 | Risk Ratio (M‐H, Fixed, 95% CI) | 0.75 [0.45, 1.25] |
| 7.2 by 6 months | 4 | 599 | Risk Ratio (M‐H, Fixed, 95% CI) | 0.70 [0.53, 0.94] |
| 7.3 by 12 months | 4 | 594 | Risk Ratio (M‐H, Fixed, 95% CI) | 0.74 [0.56, 0.98] |
| 7.4 by 20 months | 3 | 475 | Risk Ratio (M‐H, Fixed, 95% CI) | 0.79 [0.57, 1.08] |
| 8 Leaving the study early (unwilling or unable to provide information) 2. Relatives Show forest plot | 2 | Risk Ratio (M‐H, Fixed, 95% CI) | Subtotals only | |
| 8.1 total in study | 1 | 120 | Risk Ratio (M‐H, Fixed, 95% CI) | 1.09 [0.52, 2.28] |
| 8.2 subgroup of those living with patient | 1 | 76 | Risk Ratio (M‐H, Fixed, 95% CI) | 0.71 [0.43, 1.17] |
| 9 Global state: 1. GAS (endpoint score, range 1‐100, low = poor) (loss in some cases is greater than 30%) Show forest plot | 1 | Mean Difference (IV, Fixed, 95% CI) | Subtotals only | |
| 9.1 by 6 months | 1 | 129 | Mean Difference (IV, Fixed, 95% CI) | 5.10 [‐0.86, 11.06] |
| 9.2 by 12 months | 1 | 131 | Mean Difference (IV, Fixed, 95% CI) | 3.5 [‐3.15, 10.15] |
| 9.3 by 20 months | 1 | 142 | Mean Difference (IV, Fixed, 95% CI) | 5.70 [‐0.26, 11.66] |
| 10 Global state: 2. SAS (endpoint score, high=poor) (loss in some cases in greater than 30%) Show forest plot | 1 | Mean Difference (IV, Fixed, 95% CI) | Subtotals only | |
| 10.1 by 6 months | 1 | 130 | Mean Difference (IV, Fixed, 95% CI) | ‐0.20 [‐0.75, 0.35] |
| 10.2 by 12 months | 1 | 120 | Mean Difference (IV, Fixed, 95% CI) | ‐0.30 [‐0.85, 0.25] |
| 10.3 by 20 months | 1 | 139 | Mean Difference (IV, Fixed, 95% CI) | ‐0.60 [‐1.15, ‐0.05] |
| 11 Global state: 3. GAS scale change data by 3 months (+ve change=good, data likely to be skewed) Show forest plot | 1 | 129 | Mean Difference (IV, Fixed, 95% CI) | 5.20 [‐1.19, 11.59] |
| 12 Global state: 4. SAS change data by 3 months (‐ve change=good, data likely to be skewed) Show forest plot | 1 | 127 | Mean Difference (IV, Fixed, 95% CI) | ‐0.09 [‐0.31, 0.13] |
| 13 Mental state ‐ general: 1. Unwell by 12 months Show forest plot | 1 | 120 | Risk Ratio (M‐H, Fixed, 95% CI) | 0.65 [0.40, 1.07] |
| 14 Mental state ‐ general: 2. BPRS (endpoint score, range 24‐168, high=poor) (loss in standard group >30%) Show forest plot | 1 | Mean Difference (IV, Fixed, 95% CI) | Subtotals only | |
| 14.1 by 6 months | 1 | 129 | Mean Difference (IV, Fixed, 95% CI) | ‐2.10 [‐6.40, 2.20] |
| 14.2 by 12 months | 1 | 131 | Mean Difference (IV, Fixed, 95% CI) | ‐2.0 [‐6.03, 2.03] |
| 14.3 by 20 months | 1 | 142 | Mean Difference (IV, Fixed, 95% CI) | ‐4.5 [‐8.68, ‐0.32] |
| 15 Mental state ‐ general: 3. PEF (endpoint score, range 0‐5, high=poor) (loss is greater than 30%) Show forest plot | 1 | Mean Difference (IV, Fixed, 95% CI) | Subtotals only | |
| 15.1 by 3 months | 1 | 118 | Mean Difference (IV, Fixed, 95% CI) | 0.20 [‐0.22, 0.62] |
| 15.2 by 6 months | 1 | 111 | Mean Difference (IV, Fixed, 95% CI) | 0.10 [‐0.42, 0.62] |
| 15.3 by 12 months | 1 | 97 | Mean Difference (IV, Fixed, 95% CI) | ‐0.40 [‐0.84, 0.04] |
| 15.4 by 20 months | 1 | 100 | Mean Difference (IV, Fixed, 95% CI) | 0.10 [‐0.47, 0.67] |
| 16 Mental state ‐ general: 4. PSE (endpoint score, high score = poor, data likely to be skewed) Show forest plot | Other data | No numeric data | ||
| 16.1 by 6 months | Other data | No numeric data | ||
| 16.2 by 12 months | Other data | No numeric data | ||
| 16.3 by 20 months | Other data | No numeric data | ||
| 17 Mental state ‐ general: 5. BPRS scale change data by 3 months (‐ve change=good, data likely to be skewed) Show forest plot | 1 | 129 | Mean Difference (IV, Fixed, 95% CI) | ‐3.5 [‐8.92, 1.92] |
| 18 Mental state ‐ general: 6. PSE scale change data by 3 months (‐ve change=good, data likely to be skewed). Show forest plot | 1 | 129 | Mean Difference (IV, Fixed, 95% CI) | ‐2.70 [‐7.69, 2.29] |
| 19 Mental state ‐ specific: 1. Unsociable (reported by relatives) Show forest plot | 1 | Risk Ratio (M‐H, Fixed, 95% CI) | Subtotals only | |
| 19.1 by 3 months | 1 | 120 | Risk Ratio (M‐H, Fixed, 95% CI) | 0.86 [0.66, 1.12] |
| 19.2 by 6 months | 1 | 120 | Risk Ratio (M‐H, Fixed, 95% CI) | 0.43 [0.30, 0.64] |
| 20 Mental state ‐ specific: 2. Aggression (reported by relatives) Show forest plot | 1 | Risk Ratio (M‐H, Fixed, 95% CI) | Subtotals only | |
| 20.1 by 3 months | 1 | 120 | Risk Ratio (M‐H, Fixed, 95% CI) | 0.97 [0.72, 1.31] |
| 20.2 by 6 months | 1 | 120 | Risk Ratio (M‐H, Fixed, 95% CI) | 0.7 [0.39, 1.25] |
| 21 Mental state ‐ specific: 3. Various problems at 4 months (reported by relatives) Show forest plot | 1 | Risk Ratio (M‐H, Fixed, 95% CI) | Subtotals only | |
| 21.1 agitation | 1 | 120 | Risk Ratio (M‐H, Fixed, 95% CI) | 0.59 [0.36, 0.95] |
| 21.2 depression | 1 | 120 | Risk Ratio (M‐H, Fixed, 95% CI) | 0.8 [0.57, 1.13] |
| 21.3 disorientation | 1 | 120 | Risk Ratio (M‐H, Fixed, 95% CI) | 0.47 [0.28, 0.79] |
| 21.4 psychotic behaviour | 1 | 120 | Risk Ratio (M‐H, Fixed, 95% CI) | 0.58 [0.30, 1.11] |
| 21.5 substance abuse | 1 | 120 | Risk Ratio (M‐H, Fixed, 95% CI) | 0.67 [0.33, 1.36] |
| 21.6 withdrawl | 1 | 120 | Risk Ratio (M‐H, Fixed, 95% CI) | 0.72 [0.48, 1.07] |
| 22 Burden ‐ family: 1. Disruption to daily routine Show forest plot | 2 | Risk Ratio (M‐H, Fixed, 95% CI) | Subtotals only | |
| 22.1 by 3 months | 2 | 220 | Risk Ratio (M‐H, Fixed, 95% CI) | 0.74 [0.58, 0.96] |
| 22.2 by 6 months | 2 | 220 | Risk Ratio (M‐H, Fixed, 95% CI) | 0.69 [0.52, 0.92] |
| 23 Burden ‐ family: 2. Disruption to social life Show forest plot | 2 | Risk Ratio (M‐H, Fixed, 95% CI) | Subtotals only | |
| 23.1 by 3 months | 2 | 220 | Risk Ratio (M‐H, Fixed, 95% CI) | 0.67 [0.52, 0.87] |
| 23.2 by 6 months | 2 | 220 | Risk Ratio (M‐H, Fixed, 95% CI) | 0.73 [0.57, 0.94] |
| 24 Burden ‐ family: 3. Financial strain Show forest plot | 1 | Risk Ratio (M‐H, Fixed, 95% CI) | Subtotals only | |
| 24.1 by 3 months | 1 | 120 | Risk Ratio (M‐H, Fixed, 95% CI) | 0.76 [0.52, 1.10] |
| 24.2 by 6 months | 1 | 120 | Risk Ratio (M‐H, Fixed, 95% CI) | 0.84 [0.53, 1.33] |
| 25 Burden ‐ family: 4. Physical illness due to patient's illness Show forest plot | 1 | Risk Ratio (M‐H, Fixed, 95% CI) | Subtotals only | |
| 25.1 by 3 months | 1 | 100 | Risk Ratio (M‐H, Fixed, 95% CI) | 0.78 [0.65, 0.95] |
| 25.2 by 6 months | 1 | 100 | Risk Ratio (M‐H, Fixed, 95% CI) | 0.71 [0.55, 0.92] |
| 26 Burden ‐ family: 5. Overall burden is great Show forest plot | 1 | Risk Ratio (M‐H, Fixed, 95% CI) | Subtotals only | |
| 26.1 by 3 months | 1 | 120 | Risk Ratio (M‐H, Fixed, 95% CI) | 0.57 [0.41, 0.80] |
| 26.2 by 6 months | 1 | 120 | Risk Ratio (M‐H, Fixed, 95% CI) | 0.34 [0.20, 0.59] |
| 27 Burden ‐ community: 1. Not employed by 20 months Show forest plot | 1 | 189 | Risk Ratio (M‐H, Fixed, 95% CI) | 0.97 [0.85, 1.12] |
| 28 Burden ‐ community: 2. Various outcomes by 12 months Show forest plot | 1 | Risk Ratio (M‐H, Fixed, 95% CI) | Subtotals only | |
| 28.1 at least one arrest | 1 | 120 | Risk Ratio (M‐H, Fixed, 95% CI) | 0.71 [0.46, 1.12] |
| 28.2 at least one use of emergency services | 1 | 120 | Risk Ratio (M‐H, Fixed, 95% CI) | 0.81 [0.43, 1.54] |
| 29 Satisfaction ‐ patient: 1. Various outcomes by 12 months Show forest plot | 1 | Risk Ratio (M‐H, Fixed, 95% CI) | Subtotals only | |
| 29.1 feels unimproved | 1 | 119 | Risk Ratio (M‐H, Fixed, 95% CI) | 0.48 [0.31, 0.74] |
| 29.2 dissatisfied with treatment received | 1 | 119 | Risk Ratio (M‐H, Fixed, 95% CI) | 0.66 [0.50, 0.88] |
| 29.3 prefered to get other treatment | 1 | 119 | Risk Ratio (M‐H, Fixed, 95% CI) | 0.46 [0.27, 0.77] |
| 29.4 feels less able to cope | 1 | 119 | Risk Ratio (M‐H, Fixed, 95% CI) | 0.36 [0.21, 0.62] |
| 29.5 feels will need more help outside working hours in the future | 1 | 119 | Risk Ratio (M‐H, Fixed, 95% CI) | 1.48 [0.88, 2.48] |
| 30 Satisfaction ‐ patient: 2. Patient not satisitfied with care: Satisfaction Scale (endpoint score, range 0 ‐32, Show forest plot | 1 | Mean Difference (IV, Fixed, 95% CI) | Subtotals only | |
| 30.1 by 6 months | 1 | 115 | Mean Difference (IV, Fixed, 95% CI) | 5.10 [3.16, 7.04] |
| 30.2 by 12 months | 1 | 121 | Mean Difference (IV, Fixed, 95% CI) | 4.80 [3.11, 6.49] |
| 30.3 by 20 months | 1 | 137 | Mean Difference (IV, Fixed, 95% CI) | 5.40 [3.91, 6.89] |
| 31 Satisfaction ‐ relatives: 1. Feels patient is not improved Show forest plot | 1 | Risk Ratio (M‐H, Fixed, 95% CI) | Subtotals only | |
| 31.1 by 3 months | 1 | 120 | Risk Ratio (M‐H, Fixed, 95% CI) | 0.79 [0.60, 1.04] |
| 31.2 by 6 months | 1 | 120 | Risk Ratio (M‐H, Fixed, 95% CI) | 0.71 [0.53, 0.97] |
| 32 Satisfaction ‐ relatives: 2. Dissatisfied with treatment received Show forest plot | 1 | Risk Ratio (M‐H, Fixed, 95% CI) | Subtotals only | |
| 32.1 by 3 months | 1 | 120 | Risk Ratio (M‐H, Fixed, 95% CI) | 0.63 [0.44, 0.89] |
| 32.2 by 6 months | 1 | 120 | Risk Ratio (M‐H, Fixed, 95% CI) | 0.57 [0.42, 0.78] |
| 32.3 by 12 months | 1 | 120 | Risk Ratio (M‐H, Fixed, 95% CI) | 0.46 [0.29, 0.72] |
| 33 Satisfaction ‐ relatives: 3. Would have preferred patient to have received other treatment Show forest plot | 1 | Risk Ratio (M‐H, Fixed, 95% CI) | Subtotals only | |
| 33.1 by 3 months | 1 | 120 | Risk Ratio (M‐H, Fixed, 95% CI) | 1.27 [0.63, 2.57] |
| 33.2 by 6 months | 1 | 120 | Risk Ratio (M‐H, Fixed, 95% CI) | 1.11 [0.49, 2.54] |
| 33.3 by 12 months | 1 | 120 | Risk Ratio (M‐H, Fixed, 95% CI) | 0.81 [0.43, 1.54] |
| 34 Satisfaction ‐ relatives: 4. Various outcomes by 12 months Show forest plot | 1 | Risk Ratio (M‐H, Fixed, 95% CI) | Subtotals only | |
| 34.1 feel themselves less able to cope | 1 | 120 | Risk Ratio (M‐H, Fixed, 95% CI) | 0.57 [0.42, 0.78] |
| 34.2 feel themsleves to need more help outside working hours in the future | 1 | 120 | Risk Ratio (M‐H, Fixed, 95% CI) | 1.21 [0.91, 1.60] |
| 35 Economic cost per patient (data likely to be skewed) Show forest plot | Other data | No numeric data | ||
| 35.1 total cost for trial period ‐ as assessed by researchers | Other data | No numeric data | ||
| 35.2 total cost for trial period ‐ as assessed by finance department | Other data | No numeric data | ||
| 35.3 per week | Other data | No numeric data | ||