Intervención para las crisis en personas con enfermedades mentales graves
Resumen
Antecedentes
La administración de un nivel de cuidado aceptable durante las fases agudas de una enfermedad mental grave es un desafío particularmente difícil para el tratamiento comunitario de personas con problemas mentales serios. Se han desarrollado modelos de atención para la intervención en las crisis como una solución posible.
Objetivos
Examinar los efectos de los modelos de intervención de crisis para cualquier persona con enfermedad mental grave que experimenta un episodio agudo en comparación con la atención estándar que recibiría normalmente. Cuando fue posible, comparar los efectos de los equipos de crisis móviles que visitan al paciente en su domicilio con las unidades de crisis basadas en residencias de tipo domiciliario.
Métodos de búsqueda
Se realizaron búsquedas en el registro de ensayos basado en estudios del Grupo Cochrane de Esquizofrenia (Cochrane Schizophrenia Group). No hay limitaciones de idioma, fecha, tipo de documento o estado de publicación para la inclusión de los archivos en el registro. La búsqueda se realizó en 1998 y se actualizó en 2003, 2006, 2010 y el 29 de septiembre de 2014.
Criterios de selección
Se incluyeron todos los ensayos controlados con asignación aleatoria de modelos de intervención de crisis versus atención estándar para personas con enfermedades mentales graves que cumplieron los criterios.
Obtención y análisis de los datos
Los revisores extrajeron los datos de estos ensayos de forma independiente y se calcularon los cocientes de riesgos (CR) o las diferencias de medias (DM), con intervalos de confianza (IC) del 95%. Se evaluó el riesgo de sesgo de los estudios incluidos y se utilizó GRADE para crear la tabla "Resumen de los hallazgos".
Resultados principales
La actualización de septiembre de 2014 no halló nuevos estudios para su inclusión, el número de estudios continúan siendo ocho con un total de 1144 participantes. Los resultados de interés fueron la recaída, el estado general, el estado mental, los eventos adversos, el funcionamiento social, la calidad de vida y la satisfacción con el tratamiento. A excepción del estado mental, no fue posible agrupar los datos para estos resultados.
La intervención para la crisis podría reducir los reingresos en el hospital (excluyendo los ingresos índice) a los seis meses (1 ECA, n = 369, RR 0,75; IC: 0,50 a 1,13, evidencia de alta calidad), pero parece reducir la carga familiar (a los seis meses: 1 ECA, n = 120, RR 0,34 IC 0,20 a 0,59, evidencia de baja calidad), mejorar el estado mental (Brief Psychiatric Rating Scale (BPRS) tres meses: 2 ECA, n = 248, DM ‐4,03; IC: ‐8,18 a 0,12, evidencia de baja calidad), y mejorar el estado global (Escala de evaluación global (GAS) 20 meses; 1 ECA, n = 142, DM 5,70, ‐0,26 a 11,66, evidencia de calidad moderada). Los pacientes en el grupo de la intervención para la crisis estaban más satisfechos con su atención a los 20 meses de la crisis (Client Satisfaction Questionnaire (CSQ‐8): 1 ECA; n = 137; DM 5,40; IC: 3,91 a 6,89; evidencia de calidad moderada). Sin embargo, las puntuaciones de la calidad de vida a los seis meses fueron similares entre los grupos de tratamiento (Manchester Short Assessment of quality of life (MANSA); 1 ECA, n = 226, DM ‐1,50; IC: ‐5,15 a 2,15, evidencia de calidad baja). También se encontraron resultados favorables para la intervención para la crisis en cuanto a la salida temprana del estudio y la satisfacción de la familia. No se encontraron diferencias en las tasas de mortalidad. Algunos estudios sugieren que la intervención para la crisis era más rentable que la atención hospitalaria pero todos los datos eran asimétricos o inutilizables. No se identificaron datos sobre la satisfacción del personal, aportaciones del cuidador, complicaciones con la medicación o el número de recaídas.
Conclusiones de los autores
La atención basada en principios de intervención para las crisis, con o sin un paquete de atención domiciliaria continua, parece ser una manera viable y aceptable para tratar a las personas con graves enfermedades mentales. Sin embargo, sólo se pudieron incluir ocho estudios pequeños con un cegamiento, sesgo de informe y abandono poco claros y la evidencia de los principales resultados de interés son de calidad baja a moderada. Para que este enfoque se implemente ampliamente, todavía se necesitan más estudios evaluativos.
PICO
Resumen en términos sencillos
Intervención para las crisis en personas con enfermedades mentales graves
El paso del hospital a la atención ambulatoria puede ser una experiencia aterradora y difícil para las personas con enfermedades mentales graves (EMG). Es posible que la mayoría de las personas con problemas de salud mental no tengan redes de apoyo como familia, amigos y cuidadores. A menudo no tienen a nadie conocido personalmente para ayudarles cuando llegan a casa. Para complicar las cosas, las personas con EMG pueden tener bajones críticos en su salud mental creando una puerta giratoria de atención, donde los usuarios del servicio son dados de alta del hospital cuando se considera que están estables y bien y regresan al hospital cuando su salud mental empeora durante un episodio agudo o crisis. Se han desarrollado paquetes de atención en el domicilio y para la intervención en las crisis como una solución posible a estos problemas.
Esta revisión observó que la asistencia para la crisis, cuando se proporciona apoyo durante la crisis para los usuarios de un servicio, ya sea domiciliaria o en un contexto comunitario, proporciona un paquete de apoyo que merece la pena, es aceptable y más barato que la atención estándar. Además, la asistencia para la crisis evitó el reingreso hospitalario, mejoró el estado mental de los usuarios más que la atención estándar, fue más aceptable y satisfactoria para los usuarios y supuso una menor carga para familias y cuidadores. No hubo diferencias en las tasas de mortalidad entre los grupos de intervención para las crisis y de atención estándar.
Sin embargo, esta revisión sólo observa ocho estudios. Los métodos de la mayoría de estos estudios se consideraron deficientes y no hubo una descripción definitiva de la intervención para la crisis o la asistencia para la crisis para los estudios incluidos antes de 2006, lo que significa que no se prestó atención a la asistencia para la crisis en su forma pura. La mayoría de los estudios excluyeron a los usuarios con consumo indebido de alcohol y drogas y a los que representaban algún peligro para sí mismos u otros. Los autores de la revisión sugieren que se necesitan más estudios para crear una mejor base de evidencia. La asistencia para las crisis puede ser prestada actualmente sin evidencia sólida y de buena calidad. Por ejemplo, no se disponía de datos ni información sobre la aportación de los cuidadores, la concordancia o la disposición de los usuarios del servicio a tomar la medicación ni el número de recaídas experimentadas por los usuarios del servicio. Finalmente, a pesar de los informes de “burn‐out” de los trabajadores, no se evaluó la satisfacción del trabajador con la asistencia para la crisis.
Este resumen en términos sencillos ha sido preparado por Ben Gray, Investigador Principal, McPin Foundation (http://mcpin.org/).
Authors' conclusions
Summary of findings
| CRISIS INTERVENTION compared with STANDARD CARE for people with severe mental illnesses | ||||||
| Patient or population: patients with people with severe mental illnesses | ||||||
| Outcomes | Illustrative comparative risks* (95% CI) | Relative effect | No of Participants | Quality of the evidence | Comments | |
| Assumed risk | Corresponding risk | |||||
| STANDARD CARE | CRISIS INTERVENTION | |||||
| Global state | The mean global state in the control groups was | The mean global state in the intervention groups was | 142 | ⊕ ⊕ ⊕ ⊝ | Outcome measure favours crisis intervention over standard care, although not to a significant extent | |
| Mental state ‐ general | The mean mental state ‐ general in the control groups was | The mean mental state ‐ general in the intervention groups was | 248 | ⊕ ⊕ ⊝ ⊝ | Outcome measure favours crisis intervention, although not to a significant extent | |
| Patient Satisfaction | The mean patient satisfaction in the control groups was | The mean patient satisfaction in the intervention groups was | 137 | ⊕ ⊕ ⊕ ⊝ | Outcome favours crisis intervention to a significant extent | |
| Quality of Life | The mean quality of life in the control groups was | The mean quality of life in the intervention groups was | 226 | ⊕ ⊕ ⊝ ⊝ | Outcome favours standard care although not to a significant extent | |
| Burden on family | 583 per 1000 | 198 per 1000 | RR 0.34 | 120 | ⊕ ⊕ ⊝ ⊝ | Outcome significantly favours crisis intervention |
| Hospital use | 758 per 1000 | 470 per 1000 | RR 0.75 | 369 | ⊕ ⊕ ⊕ ⊕ | Outcome significantly favours crisis intervention |
| *The basis for the assumed risk (e.g. the median control group risk across studies) is provided in footnotes. The corresponding risk (and its 95% confidence interval) is based on the assumed risk in the comparison group and the relative effect of the intervention (and its 95% CI). | ||||||
| GRADE Working Group grades of evidence | ||||||
| 1 Details of randomisation not described. | ||||||
Background
Description of the condition
Severe psychiatric illnesses are phasic. After initial treatment, people with schizophrenia or other similar disorders usually experience long periods of relative stability (Bleuler 1974). Relapses can, however, occur for reasons such as exposure to environmental stressors or difficulties with medication concordance. During a psychotic relapse sufferers experience a sudden exacerbation of acute symptoms such as delusions and hallucinations and consequently will have disturbed and difficult behaviour. Some people become aggressive, threatening harm to themselves or others. Intervention at this stage is crucial as it brings much needed relief for both the sufferer and their carers and can help prevent further deterioration (Weisman 1989).
During the last 40 years, large‐scale closure of psychiatric hospitals and reduction in the availability of bed spaces has facilitated a sharp rise in the number of people with serious mental illnesses being treated in the community. After an initial reduction in admissions however, there was a rise in the number of people requiring hospital readmission, suggesting that this policy of community care was perhaps failing some vulnerable people (Ellison 1974). Although research suggested there were many benefits to community care (Langsley 1968; Pasamanick 1967), in practice it was proving difficult to implement. A particularly difficult area was the delivery of an acceptable level of care during the acute phases of severe mental illness (Audit Comm 1986; WHO 1987).
A major problem with early community care was that although it could care for people during their relatively stable periods, it was unable to cope with acute phases or relapses. This created a cyclic pattern whereby people were hospitalised for short periods during a crisis, then discharged into the community until a further crisis arose (Hoult 1986).
Description of the intervention
Breaking this cycle required the development of some form of community care that could adequately treat psychiatric crises in the home environment. Psychiatric services in Amsterdam were at the forefront of such treatment introducing a 24‐hour 'first‐aid' emergency home service just after the Second World War (Querido 1968). In the 1970's, more specific crisis‐intervention models were introduced. Like Amsterdam's first‐aid service, crisis‐intervention models aimed to treat psychiatric crises in the community and if possible, avoid hospitalisation or, if this was unavoidable, reduce time spent in hospital (Weisman 1989). Crisis‐intervention models for people with serious mental illnesses were based on models originally developed to treat normally healthy individuals in psychological crisis. A crisis can be defined as a situation where a person experiencing overwhelming stress due to a life event such as bereavement, rape or major illness finds that their usual coping mechanisms for everyday life break down (Caplan 1964; Lindemann 1944). People with severe psychiatric illnesses may have fragile coping mechanisms. If exposed to excessive stress; these coping mechanisms can breakdown, leading to an exacerbation of their acute symptoms for which crisis‐intervention techniques may be used (Weisman 1989).
In keeping with the original ethos of earlier crisis‐intervention models, the models used for people with serious mental illnesses usually, but not always, require a multidisciplinary team of specifically trained staff. These teams may be available 24 hours a day. They advocate prompt detection of exacerbation of serious mental illness followed by swift, time‐limited, intense treatment delivered in a community setting. There is immediate assessment and identification of problems followed by initial implementation of treatment. Treatment usually involves a combination of medication, counselling/therapy plus practical help with living skills and support for close family members. After the crisis has been stabilised, sufferers are carefully introduced to other models of care more suited for the chronic phases of psychiatric illnesses. The aim of crisis‐intervention models is to prevent, where possible, hospitalisation, further deterioration of symptoms and stress experienced by relatives/others involved in the crisis situation (Thomas 1970).
Since their initial introduction several 'crisis' programmes have emerged, all designed to offer intensive crisis‐oriented treatment to severely disturbed mentally ill people in a variety of community settings. These include programmes such as mobile crisis teams, crisis units in hospitals, crisis day treatment centres and crisis residential programs. This expansion of crisis‐intervention programs has been dramatic. In countries such as Australia and in North America it is now the central method of treatment used in community mental health programmes (Finch 1991; Weisman 1989). In the UK, government policy mandated that crisis resolution home teams (CRHTs) be established throughout England (Department of Health 2000).
How the intervention might work
The rapid dissemination of crisis‐intervention models suggests they have been successful methods of treatment for psychiatric crises. Supporting this is much research suggesting that crisis‐intervention models are beneficial in that they reduce hospital admissions by up to 50%, are more cost‐effective, and reduce the stigma of institutionalisation for both the sufferer and their family (Hoult 1984a; Hoult 1984b; Hoult 1986; Lamb 1979; Schoenfeld 1986; Stein 1978; Test 1978). In addition, early intervention with immediate reduction of psychotic symptoms is said to be beneficial for the long‐term prognoses of these illnesses (McGorry 1996). A survey, however, has suggested that the original claims for the efficacy of mobile crisis teams were not based on enough empirical evidence and it calls for more research into the effects of this intervention (Geller 1995).
Why it is important to do this review
Athough several searches for relevant trials have been run for this review, data relating to readmission, length of stay, general functioning and mental state remain inconclusive. The most recent update search in 2014 has not produced any new studies and so, for now, our knowledge has not advanced in this field, further good quality research is needed to provide robust conclusions. Crisis intervention is a topic area that has also been covered by other reviews within The Cochrane Collaboration. Crisis interventions for people with borderline personality as well as alternatives to inpatient mental health care for children and young people have also been reviewed (see Table 1).
| Title | Stage | Reference | Cochrane Editorial Group |
| Crisis intervention for people with severe mental illnesses | Review | This review | Cochrane Schizophrenia Group |
| Crisis interventions for people with borderline personality disorder | Review | Cochrane Developmental, Psychosocial and Learning Problems Group. | |
| Alternatives to inpatient mental health care for children and | Review | Cochrane Effective Practice and Organisation of Care Group |
Objectives
To review the effects of crisis‐intervention models for anyone with serious mental illness experiencing an acute episode compared to the standard care they would normally receive. If possible, to compare the effects of mobile crisis teams visiting patients' homes with crisis units based in home‐like residential houses.
Methods
Criteria for considering studies for this review
Types of studies
Randomised controlled trials. If a trial had been described as 'double‐blind' but only implied randomisation, we would have included it in a sensitivity analysis of all such trials. If there was no substantive difference within primary outcomes (see Types of outcome measures) when these 'implied randomisation' studies were added, then we would have included them in the final analysis. If there was a substantive difference, we would have only included clearly randomised trials and described the results of the sensitivity analysis in the text. We excluded quasi‐randomised studies, such as those allocating by using alternate days of the week.
Types of participants
1. For previous versions
Adults, however defined, with schizophrenia or related disorders, including schizophreniform disorder, schizoaffective disorder and delusional disorder, again, by any means of diagnosis. We are interested in making sure that information is as relevant to the current care of people with schizophrenia as possible so propose, if possible, to clearly highlight the current clinical state (acute, early post‐acute, partial remission, remission) as well as the stage (prodromal, first episode, early illness, persistent), and as to whether the studies primarily focused on people with particular problems (for example, negative symptoms, treatment‐resistant illnesses).
2. For 2010 and 2014 update
In earlier versions of this review we included studies such as Stein 1975, which did not describe clearly the illness from which people suffered. This, we feel was correct to do as it was in keeping with the title of this review and the desired focus of this work. However, on consideration, the definition regarding types of participants used in the older versions is not correct and we now wish to be clearer.
Adults, however defined, with either (a) severe mental illness as defined for the previous version of the review or (b) adults with severe mental health conditions except where the focus of the trial is one particular group of people only with a particular condition. For example, a study that includes adults with severe depression only would be excluded, but a mixed study including severe depression and other severe mental illnesses would be included.
Types of interventions
1. Crisis intervention
Any type of crisis‐orientated treatment of an acute psychiatric episode by staff with a specific remit to deal with such situations, in and beyond 'office hours'. This can include mobile teams caring for patients within their own homes, or non‐mobile residential programmes based in a home‐like houses within the community.
2. Standard care
The normal care given to those suffering from acute psychiatric episodes in the area concerned.
3. Different forms of crisis interventions
If data were available, we would have assessed one delivery setting for crisis care with another (mobile versus non‐mobile) in separate comparisons.
Types of outcome measures
We divided outcomes into very short term (less than three months), short term (less than six months), medium term (seven to 12 months) and long term (over one year).
Primary outcomes
1. Service utilisation
1.1 Admission to hospital
1.2 Number of days in hospital
1.3 Number of staff/user contacts
Secondary outcomes
1. Satisfaction with treatment
1.1 Number of people leaving the study early
1.2 Patient satisfaction
1.3 Staff satisfaction
1.4 Carer satisfaction
2. Clinical outcome
2.1 Death/suicide
2.2 Improvement, general or specific
2.3 Medication concordance
2.4 Antipsychotic medication
2.5 Relapses
3. Social outcome
3.1 Social functioning, including life skills
3.2 Employed (paid/voluntary/attendance at school/college)
3.3 Able to live independently
3.4 Number of carers ‐ professional or significant others ‐ needed to maintain stable state
4. Cost of treatment
4.1 Total, mental health care or medical care costs
4.2 Staff input ‐ hours worked
4.3 Carer input ‐ change in lifestyle/no change in lifestyle/loss of income
We have selected outcome measures that provide global estimations of functioning. We did not report highly specific outcomes, such as, 'sense of safety'. Such specific outcomes are rarely reported in more than one study and it is difficult to assess their relevance to the effectiveness of the treatment.
'Summary of findings' table
We used the GRADE approach to interpret findings (Schünemann 2008) and used GRADE profiler (GRADE Profiler) to import data from RevMan 5 (RevMan) to create a 'Summary of findings' table. This table provides outcome‐specific information concerning the overall quality of evidence from each included study in the comparison, the magnitude of effect of the interventions examined, and the sum of available data on all outcomes we rated as important to patient‐care and decision making. We selected the following main outcomes for inclusion in the summary of findings Table for the main comparison. Outcomes were selected using the following criteria, in priority order: endpoint versus change data, data where loss was below 30%, largest sample size for a particular outcome, the longest follow‐up time available for a particular outcome.
-
Service utilisation outcomes: hospital use
-
Quality of Life: as measured by the Manchester Short Assessment of quality of life (MANSA)
-
Clinical response in global state: as measured by the Global Assessment Scale (GAS)
-
Clinical response in general mental state: as measured by the Brief Psychiatric Rating Scale (BPRS)
-
Burden on family: overall burden on family by six months
-
Participant satisfaction
Search methods for identification of studies
Electronic searches
Cochrane Schizophrenia Group’s Trials Register
On September 29, 2014, the Trials Search Co‐ordinator (TSC) searched the Cochrane Schizophrenia Group’s Study‐Based Register of Trials using the following search strategy which has been developed based on literature review and consulting with the authors of the review:
(((acute* or cris?s* or emergen* or intensiv* or mobile* or outreach* or (time* NEAR2 limit*) or communit* or home*) NEXT (*care* or interven* or treat* or therap* or managem* or model* or program* or team* or service* or "health service*" or "mental health service*")) or (hospital* NEAR2 (diversion* or alternative*))):ti of REFERENCE or ((brief hosp*) or (community mental health service*) or (community resid*) or crisis* or (critical time*) or (district psychiatr*) or (*brief intensive*)):sin of STUDY
The Cochrane Schizophrenia Group’s Register of Trials is compiled by systematic searches of major resources (including AMED, BIOSIS CINAHL, EMBASE, MEDLINE, PsycINFO, PubMed, and registries of clinical trials) and their monthly updates, handsearches, grey literature, and conference proceedings (see Group’s Module). There is no language, date, document type, or publication status limitations for inclusion of records into the register.
For previous searches, please see Appendix 1.
Searching other resources
1. Reference searching
We inspected references of all identified studies for further relevant studies.
2. Personal contact
We contacted the first author of each included study for information regarding unpublished trials.
Data collection and analysis
For previous data collection please see Appendix 2
Selection of studies
Review author SM independently inspected citations from the searches and identified relevant abstracts. We planned that a random 20% sample should be independently re‐inspected by MW to ensure reliability, however, only six studies appeared to possibly meet the review criteria, all of these were checked by MW. Where disputes arose, the full report was acquired for more detailed scrutiny. Full reports of the abstracts potentially meeting the review criteria were obtained and inspected by SM and MW. Had it not been possible to resolve disagreement by discussion, we would have attempted to contact the authors of the study for clarification.
Data extraction and management
2014 update
We planned for review author SM to extract data from all included studies. The protocol stated that, to ensure reliability, MW would, if necessary, independently extract data from a random sample of these studies, comprising 10% of the total.
For studies included in previous version we used the methods below.
1. Extraction
Review author SM extracted data from all included studies. The protocol stated that, to ensure reliability, previous review author, RD, would independently extract data from a random sample of these studies, comprising 10% of the total, however, there were actually only three new studies so RD checked data from all the studies. We discussed disagreement on data extraction, we documented decisions and, if necessary, we contacted authors of studies for clarification. With remaining problems CI and CA helped clarify issues and we documented these final decisions. We extracted data presented only in graphs and figures whenever possible, but included the data only if the two review authors independently had the same result. We attempted to contact authors through an open‐ended request in order to obtain missing information or for clarification whenever necessary. If studies had been multicentre, where possible, we planned to extract data relevant to each component centre separately.
2. Management
2.1 Forms
We extracted data onto standard, simple forms.
2.2 Scale‐derived data
We included continuous data from rating scales only if:
a. the psychometric properties of the measuring instrument have been described in a peer‐reviewed journal (Marshall 2000); and
b. the measuring instrument has not been written or modified by one of the trialists for that particular trial.
Ideally, the measuring instrument should either be i. a self‐report or ii. completed by an independent rater or relative (not the therapist). We realise that this is not often reported clearly, in Description of studies we noted if this was the case or not.
2.3 Endpoint versus change data
There are advantages of both endpoint and change data. Change data can remove a component of between‐person variability from the analysis. On the other hand, calculation of change needs two assessments (baseline and endpoint), which can be difficult in unstable and difficult to measure conditions such as schizophrenia. We decided primarily to use endpoint data, and only use change data if the former were not available. If necessary, we combined endpoint and change data in the analysis as we preferred to used mean differences (MD) rather than standardised mean differences (SMD) throughout (Higgins 2011, Chapter 9.4.5.2).
2.4 Skewed data
Continuous data on clinical and social outcomes are often not normally distributed. To avoid the pitfall of applying parametric tests to non‐parametric data, we applied the following standards to all data before inclusion.
For change data:
We entered relevant useable change data into the analyses, as when continuous data are presented on a scale that includes a possibility of negative values (such as change data), it is difficult to tell whether data are skewed or not.
For endpoint data from small trials (n > 200):
a) When a scale starts from the finite number 0, we subtracted the lowest possible value from the mean, and divided this by the standard deviation (SD). If this value is lower than 1, it strongly suggests a skew, and we excluded the study data. If this ratio was higher than 1 but below 2, there is a suggestion of skew. We entered the study data and tested whether inclusion or exclusion would change the results substantially. Finally, if the ratio was larger than 2, we included the study data, because skew is less likely (Altman 1996; Higgins 2011).
b) If a scale starts from a positive value (such as the Positive and Negative Syndrome Scale (PANSS), which can have values from 30 to 210) (Kay 1986), we modified the calculation described above to take into account the scale starting point. In such cases skew is present if 2 SD > (S ‐ S min), where S is the mean score and S min is the minimum score.
For endpoint data from larger trials (n < 200)
We entered relevant endpoint data from studies of at least 200 participants in the analyses irrespective of the above rules because skewed data pose less of a problem in large studies.
2.5 Common measure
To facilitate comparison between trials, if possible, we converted variables that can be reported in different metrics, such as days in hospital (mean days per year, per week or per month) to a common metric (e.g. mean days per month).
2.6 Conversion of continuous to binary
Where possible, we made efforts to convert outcome measures to dichotomous data. This can be done by identifying cut‐off points on rating scales and dividing participants accordingly into 'clinically improved' or 'not clinically improved'. It is generally assumed that if there is a 50% reduction in a scale‐derived score such as the Brief Psychiatric Rating Scale (BPRS, Overall 1962) or PANSS (Kay 1986), this can be considered as a clinically significant response (Leucht 2005; Leucht 2005a). If data based on these thresholds were not available, we used the primary cut‐off presented by the original authors.
2.7 Direction of graphs
Where possible, we entered data in such a way that the area to the left of the line of no effect indicates a favourable outcome for crisis intervention. Where keeping to this makes it impossible to avoid outcome titles with clumsy double‐negatives (e.g. 'Not un‐improved'), we reported data where the left of the line indicates an unfavourable outcome. This was noted in the relevant graphs.
Assessment of risk of bias in included studies
Again, SM and RD worked independently to assess risk of bias by using criteria described in the Cochrane Handbook for Systematic Reviews of Interventions (Higgins 2011) to assess trial quality. This set of criteria is based on evidence of associations between overestimate of effect and high risk of bias of the article such as sequence generation, allocation concealment, blinding, incomplete outcome data and selective reporting.
Where the raters disagreed, we made the final rating by consensus, with the involvement of another member of the review group. Where inadequate details of randomisation and other characteristics of trials were provided, we contacted authors of the studies in order to obtain further information. We reported non‐concurrence in quality assessment.
We noted the level of risk of bias in both the text of the review and in the summary of findings Table for the main comparison.
Measures of treatment effect
1. Binary data
For binary outcomes, we calculated a standard estimation of the risk ratio (RR) and its 95% confidence interval (CI). It has been shown that RR is more intuitive (Boissel 1999) than odds ratios and that odds ratios tend to be interpreted as RR by clinicians (Deeks 2000).
2. Continuous data
For continuous outcomes, we estimated the mean difference (MD) between groups. We preferred not to calculate effect size measures (standardised mean difference (SMD)). However, if scales of very considerable similarity had been used, we would have presumed there was a small difference in measurement, and we would have calculated effect size and transformed the effect back to the units of one or more of the specific instruments.
Unit of analysis issues
1. Cluster trials
Studies increasingly employ 'cluster randomisation' (such as randomisation by clinician or practice) but analysis and pooling of clustered data poses problems. Firstly, authors often fail to account for intra‐class correlation in clustered studies, leading to a 'unit of analysis' error (Divine 1992) whereby P values are spuriously low, confidence intervals unduly narrow and statistical significance overestimated. This causes type I errors (Bland 1997; Gulliford 1999).
If clustering had not been accounted for in primary studies, we would have presented data in a table, with a (*) symbol to indicate the presence of a probable unit of analysis error. In subsequent versions of this review we will seek to contact first authors of studies to obtain intra‐class correlation coefficients (ICCs) for their clustered data and to adjust for this by using accepted methods (Gulliford 1999). Where clustering has been incorporated into the analysis of primary studies, we will present these data as if from a non‐cluster randomised study, but adjust for the clustering effect.
We have sought statistical advice and have been advised that the binary data as presented in a report should be divided by a 'design effect'. This is calculated using the mean number of participants per cluster (m) and the ICC [Design effect=1+ (m‐1) *ICC] (Donner 2002). If the ICC is not reported it will be assumed to be 0.1 (Ukoumunne 1999).
If cluster studies have been appropriately analysed taking into account ICCs and relevant data documented in the report, synthesis with other studies will be possible using the generic inverse variance technique.
2. Cross‐over trials
A major concern of cross‐over trials is the carry‐over effect. It occurs if an effect (e.g. pharmacological, physiological or psychological) of the treatment in the first phase is carried over to the second phase. As a consequence, on entry to the second phase the participants can differ systematically from their initial state despite a wash‐out phase. For the same reason cross‐over trials are not appropriate if the condition of interest is unstable (Elbourne 2002). As both effects are very likely in severe mental illness, we planned only to use data from the first phase of cross‐over studies.
3. Studies with multiple treatment groups
Where a study involved more than two treatment arms, if relevant, we presented the additional treatment arms in comparisons. If data were binary, we simply added and combined the data within the two‐by‐two table. If data were continuous, we combined data following the formula in section 7.7.3.8 (Combining groups) of the Cochrane Handbook for Systematic Reviews of Interventions (Higgins 2011). Where the additional treatment arms were not relevant, we did not use these data.
Dealing with missing data
1. Overall loss of credibility
At some degree of loss of follow‐up, data must lose credibility (Xia 2009). We chose that, for any particular outcome, should more than 50% of data be unaccounted for, we would not reproduce these data or use them within analyses. If, however, more than 50% of those in one arm of a study were lost, but the total loss was less than 50%, we would have marked such data with (*) to indicate that such a result may well be prone to bias.
2. Binary
In the case where attrition for a binary outcome was between 0% and 50% and where these data were not clearly described, we presented data presented on a 'once‐randomised‐always‐analyse' basis (an intention‐to‐treat analysis). We assumed all those leaving the study early to have the same rates of negative outcome as those who completed, with the exception of the outcome of death and adverse effects (for these outcomes the rate of those who stayed in the study ‐ in that particular arm of the trial ‐ were used for those who did not). We completed a sensitivity analysis testing how prone the primary outcomes were to change when 'completer' data only were compared to the intention‐to‐treat analysis using the above assumptions.
3. Continuous
3.1 Attrition
In the case where attrition for a continuous outcome was between 0% and 50% and completer‐only data were reported, we used these data.
3.2 Standard deviations
If standard deviations (SDs) were not reported, we first tried to obtain the missing values from the authors. If not available, where there were missing measures of variance for continuous data, but an exact standard error (SE) and confidence intervals (CIs) available for group means, and either a 'P' value or 't' value available for differences in mean, we calculated them according to the rules described in the Cochrane Handbook for Systematic Reviews of Interventions (Higgins 2011): When only the SE was reported, SDs were calculated by the formula SD=SE * square root (n). Chapters 7.7.3 and 16.1.3 (Higgins 2011) present detailed formulae for estimating SDs from P values, t or F values CIs, ranges or other statistics. If these formulae did not apply, we calculated the SDs according to a validated imputation method, which is based on the SDs of the other included studies (Furukawa 2006). Although some of these imputation strategies can introduce error, the alternative would be to exclude a given study’s outcome and thus to lose information. We nevertheless examined the validity of the imputations in a sensitivity analysis excluding imputed values.
3.3 Last observation carried forward (LOCF)
We anticipated that in some studies the method of last observation carried forward (LOCF) would be employed within the study report. As with all methods of imputation to deal with missing data, LOCF introduces uncertainty about the reliability of the results (Leucht 2007). Therefore, where LOCF data had been used in the trial, if less than 50% of the data had been assumed, we used these data and indicated that they were the product of LOCF assumptions.
Assessment of heterogeneity
1. Clinical heterogeneity
We considered all included studies initially, without seeing comparison data, to judge clinical heterogeneity. We simply inspected all studies for clearly outlying people or situations which we had not predicted would arise. When such situations or participant groups arose, we fully discussed these.
2. Methodological heterogeneity
We considered all included studies initially, without seeing comparison data, to judge methodological heterogeneity. We simply inspected all studies for clearly outlying methods which we had not predicted would arise. When such methodological outliers arose, we fully discussed these.
3. Statistical heterogeneity
3.1 Visual inspection
We visually inspected graphs to investigate the possibility of statistical heterogeneity.
3.2 Employing the I2 statistic
Heterogeneity between studies was investigated by considering the I2 method alongside the Chi2 'P' value. The I2 provides an estimate of the percentage of inconsistency thought to be due to chance (Higgins 2003). The importance of the observed value of I2 depends on i. magnitude and direction of effects and ii. strength of evidence for heterogeneity (e.g. 'P' value from Chi2 test, or a confidence interval for I2). An I2 estimate greater than or equal to around 50% accompanied by a statistically significant Chi2 statistic, was interpreted as evidence of substantial levels of heterogeneity (Section 9.5.2 ‐ Higgins 2011). When substantial levels of heterogeneity were found in the primary outcome, we explored reasons for heterogeneity (seeSubgroup analysis and investigation of heterogeneity).
Assessment of reporting biases
Reporting biases arise when the dissemination of research findings is influenced by the nature and direction of results (Egger 1997). These are described in Section 10 of the Cochrane Handbook for Systematic Reviews of Interventions (Higgins 2011). We are aware that funnel plots may be useful in investigating reporting biases but are of limited power to detect small‐study effects. We did not use funnel plots as there were less than 10 included studies. For future updates of this review, we will use the same methodology and not use funnel plots for outcomes where there are 10 or fewer studies, or where all studies are of similar sizes. In other cases, where funnel plots are possible, we will seek statistical advice in their interpretation.
Data synthesis
We understand that there is no closed argument for preference for use of fixed‐effect or random‐effects models. The random‐effects method incorporates an assumption that the different studies are estimating different, yet related, intervention effects. This often seems to be true to us and the random‐effects model takes into account differences between studies even if there is no statistically significant heterogeneity. There is, however, a disadvantage to the random‐effects model. It puts added weight onto small studies, which often are the most biased ones. Depending on the direction of effect, these studies can either inflate or deflate the effect size. We chose random‐effects model for all analyses. The reader is, however, able to choose to inspect the data using the fixed‐effect model.
Subgroup analysis and investigation of heterogeneity
1. Subgroup analyses ‐ only primary outcomes
We anticipated subgroup analyses investigating mobile crisis teams versus non‐mobile residential home‐like programmes. In the event however, such analyses were not possible due to lack of data comparing these conditions directly against each other.
1.2 Clinical state, stage or problem
We proposed to undertake this review and provide an overview of the effects of crisis intervention for people with severe mental illnesses. In addition, however, we tried to report data on subgroups of people in the same clinical state, stage and with similar problems.
2. Investigation of heterogeneity
If inconsistency was high, this was reported. First, we investigated whether data had been entered correctly. Second, if data were correct, we visually inspected the graph and successively removed outlying studies to see if heterogeneity was restored. For this review, we decided that should this occur with data contributing to the summary finding of no more than around 10% of the total weighting, data would be presented. If not, data would not be pooled and issues would be discussed. We know of no supporting research for this 10% cut‐off but are investigating the use of prediction intervals as an alternative to this unsatisfactory state.
When unanticipated clinical or methodological heterogeneity were obvious, we simply stated hypotheses regarding these for future reviews or versions of this review. We did not anticipate undertaking analyses relating to these.
Sensitivity analysis
1. Implication of randomisation
We aimed to include trials in a sensitivity analysis if they were described in some way as to imply randomisation. For the primary outcomes, we included these studies and if there was no substantive difference when the implied randomised studies were added to those with better description of randomisation, then all data were employed from these studies.
2. Assumptions for lost binary data
Where assumptions had to be made regarding people lost to follow‐up (see Dealing with missing data), we compared the findings of the primary outcomes when we used our assumption compared with completer data only. If there was a substantial difference, we reported the results and discussed them but continued to employ our assumption.
Where assumptions have to be made regarding missing SDs data (see Dealing with missing data), we compared the findings on primary outcomes when we used our assumption compared with completer data only. A sensitivity analysis was undertaken to test how prone results changed when 'completer' data only were compared to the imputed data using the above assumption. If there was a substantial difference, we reported results and discussed them, but continued to employ our assumption.
3. Risk of bias
We analysed the effects of excluding trials that were judged to be at high risk of bias across one or more of the domains of randomisation (implied as randomised with no further details available), allocation concealment, blinding and outcome reporting for the meta‐analysis of the primary outcome. If the exclusion of trials at high risk of bias did not substantially alter the direction of effect or the precision of the effect estimates, then we included data from these trials in the analysis
4. Imputed values
We also planned to undertake a sensitivity analysis to assess the effects of including data from trials where we used imputed values for ICC in calculating the design effect in cluster‐randomised trials.
If substantial differences were noted in the direction or precision of effect estimates in any of the sensitivity analyses listed above, we did not pool data from the excluded trials with the other trials contributing to the outcome, but presented them separately.
5. Fixed and random effects
We synthesised all data using a random‐effects model, however, we also synthesised data for the primary outcome using a fixed‐effect model to evaluate whether the greater weights assigned to larger trials with greater event rates, altered the significance of the results compared with the more evenly distributed weights in the random‐effects model.
Results
Description of studies
Results of the search
1. 2014 search
We found no new relevant studies in the 2014 search. The number of included studies remains eight. These eight studies randomised a total of 1144 people (Fenton 1979; Fenton 1998; Hoult 1983; Howard 2010; Johnson 2005; Muijen 1992; Pasamanick 1964a; Stein 1975). (see Figure 1).

Study flow diagram 2014 search
2. 2010 search
For the 2010 update, the initial search produced 266 studies, which produced a possible database of seven reports. When full reports were obtained for all of these, the authors agreed that three new studies (Fenton 1998, Howard 2010 and Johnson 2005) met the specified inclusion criteria. The number of included studies rose to eight (See Figure 2).

Study flow diagram (2010 UPDATE).
3. Previous searches
The initial search yielded 2446 references (Joy 2000b). An initial electronic and subsequent paper scan of all abstracts produced a final database of 61 possible reports. A full copy of each of these was obtained and sorted into 18 separate studies. From the original 2446 references only five studies met the specified inclusion criteria. When the search was run again in 2003, the resulting numbers of possible references and actual studies was very similar. Because the search term is so broad, the 2003 search term yielded over 2000 references (Joy 2004). Again, these were scanned and narrowed down to a possible nine trials, none of which met the inclusion criteria and we added all of these to the excluded studies table. A rethinking of the search term for the 2006 update resulted in a much more manageable list of hits but again, none of the new trials met our inclusion criteria.
Included studies
For detailed descriptions please also see Characteristics of included studies.
1. Length of trials
The shortest trial was Howard 2010 having a duration of three months, and Pasamanick 1964a was the longest trial, lasting two years.
2. Participants
The eight included studies all focused on severely mentally ill adults who were in crisis and required, or were in need of, immediate hospitalisation. The majority of participants were psychotic (most suffering from schizophrenia), but there was a substantial representation of other diagnoses such as depression and severe neuroses. Three studies stated how they had used diagnostic criteria for diagnosis (Fenton 1979; Hoult 1983; Muijen 1992). All included people aged 18 years and above of both sexes (except Howard 2010 who included women only).
3. Setting
Due to the inclusion criteria, all included studies needed to take place in hospital and the community. The trials were based in Australia (Hoult 1983), Canada (Fenton 1979; Fenton 1998), the USA (Pasamanick 1964a; Stein 1975) and the UK (Howard 2010; Johnson 2005; Muijen 1992).
4. Size
Trial size ranged from 41 participants (Howard 2010) to 260 participants (Johnson 2005).
5. Interventions
5.1. Crisis Intervention
Johnson 2005 investigated care provided by crisis resolution home teams versus standard care. Five other trials (Fenton 1979; Hoult 1983; Muijen 1992; Pasamanick 1964a; Stein 1975) had home‐based treatments similar to each other where crisis intervention was included as part of a package. Two studies investigated crisis houses providing residential home‐like care. For all studies, a multidisciplinary team, usually comprising psychiatrists, psychologists, nurses, occupational therapists and social workers, delivered care. To be included in this review, the teams had to treat crises occurring in and out of office hours. All included studies provided emergency care, although the type of cover varied. Six had members of staff on call ready to visit 24 hours a day if needed (Fenton 1979; Fenton 1998; Hoult 1983; Howard 2010; Johnson 2005; Stein 1975). Muijen 1992 provided a telephone answering service only, but if people wanted further help they could use the walk‐in emergency clinic at the local hospital. Pasamanick 1964a initially provided a telephone service with home visits but then switched to an answer‐machine instructing callers to call back during office hours. If it was truly an emergency they could contact the local police station.
5.2. Standard care
Standard care for all the included studies involved hospitalisation if required. The majority of standard care patients were hospitalised immediately after allocation. Once hospitalised, people received the standard level of care for that hospital. This tended to be short and intense care with the overall aim being early discharge. As well as medication, various forms of treatment programmes such as counselling, physiotherapy and occupational therapy were available on site. Social workers were also available. After discharge, all trials used their normal outpatient services.
6. Outcomes
We presented the 11 main outcomes as follows: death/harm, hospital use, leaving the study early, global state, mental state, burden, satisfaction, economic costs, quality of life, social functioning, and clinical and social problems.
6.1 Missing
None of the studies evaluated staff satisfaction, medication concordance, or number of carers (professional or lay) needed to maintain the well‐being of an individual. For some studies, readmission to hospital was evaluated, but it was not clear if all relapses necessitated readmission so it is impossible to see if crisis intervention helped postpone relapse. Only two studies provided data on readmission (Fenton 1998; Johnson 2005). Stein 1975 did attempt to evaluate the living situation of participants but did not report usable data.
6.2 Scales
Eighteen different instruments were used to collect continuous data. Only nine of these rating scales, however, collected data useful to this review. The primary reason for exclusion of these data were that the scales had never been validated. To prevent bias in data collection, the quality and validity of scales need to be assessed through unbiased peer review as research has shown trials using non‐validated scales are more likely to find significant differences in outcomes than trials using peer‐reviewed scales (Marshall 2000).
Other methodological problems in data collection are recorded in the Characteristics of included studies.
Below are details of the scales that provided useful data.
6.2.1 Brief Psychiatric Rating Scale (BPRS, Overall 1962).
A brief clinician‐rated scale used to assess the global severity of a range of psychiatric symptoms. Scores range from 24 (not present) to 168 (extremely severe impairment). Used in Hoult 1983, Johnson 2005 and Howard 2010.
6.2.2 Client Satisfaction Questionnaire (Larsen 1979).
Eight‐item, patient‐rated scale measuring patients' satisfaction with different aspects of their care (quality of service, amount of support received, needs and preferences). Measured on a scale of one to four for each item. Higher scores indicate greater satisfaction. Used in Johnson 2005 and Muijen 1992.
6.2.3 Global Assessment Scale (GAS, Endicott 1976).
A clinician‐rated assessment of overall functioning on a scale of one to 100. Lower scores indicate poorer functioning. Used in Muijen 1992 and Howard 2010.
6.2.4 Health of the Nation Outcome Scores (HoNOS, Wing 1998).
Twelve‐item scale covering clinical problems and social functioning in mentally ill people on a scale of zero to four each item, range zero to 48. Higher scores indicate poorer functioning. Used in Johnson 2005.
6.2.5 Manchester Short Assessment of quality of life (MANSA, Priebe 1999).
Sixteen‐item scale covering quality if life, some items rated on a scale of one to seven, some items yes/no. Higher scores indicate higher quality of life. Used in Johnson 2005, short form used in Howard 2010.
6.2.6 Life Skills Profile (LSP, Parker 1991).
Instrument assessing functioning in persons with severe mental illnesses, 39 items, higher scores reflect better functioning. Used in Johnson 2005.
6.2.7 Present State Examination ‐ 9th Edition (PSE, Wing 1974).
Clinician‐rated scale measuring mental status. One hundred and forty symptom items are rated and combined to give various syndrome and sub‐syndrome scores. Higher scores indicate greater clinical impairment. Used in Hoult 1983.
6.2.8 Psychiatric Evaluation Form (PEF, Endicott 1972).
A clinician‐rated scale used to assess psychological functioning during the week prior to interview. Consists of 24 individual and eight summary scales. Scoring on each scale ranges from one to five with higher scores indicating greater impairment. Used in Fenton 1979.
6.2.9 Social Adjustment Scale (SAS, Weissman 1971).
Measures social functioning in a number of life domains (work, social, extended family, marital, parental, family unit, and economic adequacy) on a scale of one to seven. Lower scores indicate poorer functioning. Used in Muijen 1992.
6.2.10 EuroQuol ‐ 5 dimension (EQ‐5D, Brooks 1996).
Measures quality of life across five dimensions, scores from zero to one with one being perfect health and zero being death, used in Howard 2010.
Excluded studies
For detailed descriptions please also see Characteristics of excluded studies.
1. Excluded studies
We have now excluded 30 studies with reasons from this review, two of which we excluded after the 2014 search (UKCRN10714; NTR3168), three of which we excluded after the 2010 search (Grawe 2006; Power 2007; Warner 2006). and four after the 2006 search (Harrison 2003; Jones 2003; Kuipers 2004; Metcalfe 2005). Only five of the excluded studies were not randomised (Bond 1989; Harrison 2003; Mosher 1975; Pai 1983; UKCRN10714). One study, (Kuipers 2004), did randomise treatments, but did not randomise a homecare package with standard care. NTR3168 randomised people receiving crisis intervention, but were randomising feedback‐informed therapy as the treatment. Four studies focused on people who did not meet the eligibility criteria (Bush 1990; Knapp 1998; Pasamanick 1964b; Van Minnen 1997). Although severely mentally ill, it was unclear if they were in crisis and in need of immediate hospitalisation. Two studies, Henlegger 1999 and Mattejat 2001 focused on children and young people who were severely ill and in crisis and UKCRN10714 focused on carers of people in crisis rather than our population of interest which was adults in crisis.
Most of the trials (17), were judged to have unsuitable homecare intervention. Some specifically did not provide 24‐hour emergency cover (Gater 1997; Merson 1992), or diverted people from hospital to attendance at a daily clinic (Levenson 1977). We had to exclude eight studies (Gandhi 2001; Herz 2000; Linszen 1998; Rosenheck 1995; Sledge 1996; Taylor 1998; Tyrer 1995; Warner 2006) in this category as they were investigating 'homecare packages' versus hospital care rather than crisis intervention. Power 2007 investigated general practitioner access to crisis teams. Three recent studies (Jones 2003; Metcalfe 2005; Grawe 2006) used forms of intensive case management.
Finally, Burns 1993 met most eligibility criteria but, because of the design of the study, many people were lost after allocation (48%). We felt that data with such a degree of loss incorporated too great a level of assumption (see Methods), so we excluded these. We also excluded Polak 1976 as too much of the data were unusable.
2. Awaiting assessment
One study (Bindman 2008) requires further assessment. This is an unpublished study referred to in Johnson 2008. Many outcomes are not reported. Mean number of days in hospital after initial admission and patient satisfaction are reported, but no standard deviations (SDs) are provided. We have written to the author and await his reply.
3. Ongoing
We are not aware of any ongoing trials relevant to this review.
Risk of bias in included studies
For summary of risk of bias across included studies please see Figure 3 and Figure 4.

'Risk of bias' graph: review authors' judgements about each risk of bias item presented as percentages across all included studies.

'Risk of bias' summary: review authors' judgements about each risk of bias item for each included study.
Allocation
All trials were randomised, but two studies did not describe how this took place (Fenton 1979; Stein 1975) and, therefore, we categorised these as moderate risk of bias with some doubt about the results (see 'Methods 3. Assessment of a trial's methodological quality'). Other trials used sealed envelopes to blind the sequence of allocation (Hoult 1983; Muijen 1992) or allocated by a deck of randomly sequenced cards (Pasamanick 1964a). Both systems are open to the possibility of selection bias operating. Fenton 1998, Howard 2010 and Johnson 2005 used independent, computer‐generated 24‐hour randomisation services.
Blinding
Due to the nature of the intervention it is impossible to blind participants to the type of treatment received. All studies, therefore were single‐blind with raters either blind to treatment allocation or not part of treatment teams. Five studies used independent raters who were not part of the treatment teams (Fenton 1979; Fenton 1998; Hoult 1983; Muijen 1992; Stein 1975). Four of these studies did not state if these raters were blind to treatment group but Muijen 1992 did report that raters were not blinded for reasons of safety. Pasamanick 1964a was the only trial where the raters were clearly not independent. In this study, nurses and clinicians responsible for care completed follow‐up ratings. For Johnson 2005, ratings of patient satisfaction, mental state and quality of life were taken by independent researchers at eight weeks but clinical problems and social functioning were taken at eight weeks and six months by clinicians involved in care. Furthermore, Johnson 2005 and Howard 2010 stated that it was not possible to blind researchers collecting the data.
Incomplete outcome data
Proportions of follow‐up varied with outcome. For example, for the outcome of 'hospital admission and readmission', four studies had no loss to follow‐up. The two exceptions (Hoult 1983; Johnson 2005) did not report data for 19/119 and 34/260 people, respectively. The follow‐up assessments of clinical state and 'satisfaction with treatment' were not so good but only Fenton 1979 had greater than 30% loss (57/157). Most of the attrition was clearly explained as the result of refusal or inability to complete the assessments. Pasamanick 1964a did lose 21 people, seven of whom were impossible to trace. Loss of data from relatives was more substantial. Again, it was primarily due to inability or refusal to complete assessments but the logistics of this made the attrition understandable. Consent had to be obtained from the patient as well as the relative, and, in some cases the person in crisis had to be present at the interview. Reasons for loss of data were, however, well explained in five of the studies but reasons for the loss in Fenton 1998, Howard 2010 and Johnson 2005 were not explained.
Selective reporting
The majority of data in this review originates from published reports. We have had no opportunity to see protocols of these trials to compare the outcomes reported in the full publications with what was measured during the conduct of the trial. Most other problems arose with continuous data. Several studies failed to present the standard deviation/error of the means, making data unusable. Several outcomes were presented as P values alone. These were also reported as 'P < 0.05 or P > 0.05' rather than their exact value thus making it impossible to extract data. Other problems were: (a) data given for one group only (Muijen 1992; Pasamanick 1964a; Stein 1975), (b) data combined and not presented by randomised group (Fenton 1979), (c) data obtained using non‐validated scales (Muijen 1992; Stein 1975), and (d) in some cases, no data presented on specific outcomes (Hoult 1983; Muijen 1992). We tried to contact authors some time ago for additional data but it now seems unlikely that further information will become available.
Other potential sources of bias
All studies had small sample sizes, Howard 2010 deals with a women‐only sample. We could detect no other sources of bias such as biased sources of funding to authors.
Effects of interventions
1. Introduction
The review now includes eight studies, six of these have investigated mobile programmes delivered in the patients' own homes and two report on home‐like residential crisis houses. As these programmes differ somewhat, the outcomes below were analysed both including and excluding the two studies examining residential alternatives. Generally, analyses are reported including available data from all studies, however, where the exclusion of the two residential studies produced substantially different findings, results are reported both with and without these.
2. COMPARISON 1: CRISIS INTERVENTION versus STANDARD CARE
2.1 Death/harm
Overall, the number of deaths was similar for both groups, two studies, Howard 2010 and Pasamanick 1964a did not report any deaths. For the outcome of death by natural causes, pooled data showed no statistical difference between treatment groups (n = 980, 6 RCTs, risk ratio (RR) 0.63, 95% confidence interval (CI) 0.18 to 2.24). Death by suicide also showed no statistical difference for pooled data (n = 980, 6 RCTs, RR 1.06, 95% CI 0.36 to 3.11). Combining these groups for the outcome death by any cause produced similar results (n = 980, 6 RCTs, RR 0.88, 95% CI 0.37 to 2.07).
We analysed two outcomes of harm. Again, pooled data for 'attempted suicide' showed no difference between crisis interventions and standard care (n = 369, 3 RCTs, RR 2.62, 95% CI 0.21 to 32.02). There were two studies (Johnson 2005; Muijen 1992) with at least one homicide. These occurred in the crisis arm (n = 568, 3 RCTs, RR 2.96, 95% CI 0.31 to 28.28).
2.2 Hospital use
We assessed hospital admission in several ways to reflect the differing measures used in the included studies. For some of the studies, it is misleading to compare treatment groups on the 'number of hospital admissions' as those in standard care had an index admission as part of their care package. This 'result', in effect, records only the treatment given rather than its outcome. In order to present the difficulty the crisis resolution care teams experienced in keeping people out of hospital, the relative success at 'keeping to initial trial protocol' was assessed instead. This presentation of the data was used for Fenton 1979; Hoult 1983; Muijen 1992; Pasamanick 1964a; Stein 1975. in comparisons 2.2.1 and 2.2.2. below.
However, Fenton 1998 and Johnson 2005 did report data for admission to acute servicesafter initial index admission to hospital, a residential crisis house or care by a crisis resolution team. These data are therefore, presented separately below (from 2.2.3 to 2.2.7) to distinguish them from data from Fenton 1979; Hoult 1983; Muijen 1992; Pasamanick 1964a; Stein 1975, where index and other admission were not differentiated. Howard 2010 did not report hospital admission data.
2.2.1 Unable to keep to initial trial protocol as regards admission
The difference between the groups was highly significant with more crisis‐intervention care 'failures'. These data also show the difficulty encountered by the crisis‐intervention care teams in keeping people from admission. By 12 months, pooled data from all the trials showed 44.8% of those allocated to crisisintervention care on presentation were admitted.
2.2.2 Repeat admissions including index admission
A second analysis looked at repeat admissions. At 12 months, there was a non‐significant difference between groups (n = 465, 3 RCTs, RR 0.71, 95% CI 0.31 to 1.61), furthermore, there was significant heterogeneity for this latter outcome (I2 86%). At 20 months, data from Muijen 1992 similarly did not show a statistically significant effect (n = 188, 1 RCT, RR 1.10, 95% CI 0.75 to 1.60).
2.2.3 Number of repeat admissions per participant
Fenton 1998 reported data for mean number of admissions per participant. However, the data are highly skewed and descriptive statistics only are presented; the mean for admissions is slightly higher for standard care.
2.2.4. Repeat admissions excluding index admission
Fenton 1998 and Johnson 2005 reported data for admission to acute services after initial index admission to hospital, a residential crisis house or care by a crisis resolution team by numbers of participants. At three months Johnson 2005 reported that there were significantly fewer number of participants readmitted after the initial crisis for the crisis arm than for the standard arm (n = 260,1 RCT, RR, 0.53, 95% CI 0.41 to 0.68). At six months, the Fenton 1998 and Johnson 2005 data combined indicated again that there were fewer participants readmitted for the crisis arm than for the standard arm, although this difference was not significant (n = 369, 2 RCTs, RR 0.75, 95% CI 0.50 to 1.13).
However, there was significant heterogeneity for the outcome at six months (I2 80%), and it should be remembered that Fenton 1998 was investigating a residential programme, whilst Johnson 2005 looked at a mobile crisis resolution team. Taking Johnson 2005 data only, the number of participants readmitted after the initial crisis for the crisis arm rather than the standard arm was significantly lower (n = 258,1 RCT, RR 0.6.20, 95% CI 0.51 to 0.76.
2.2.5. Repeat admissions: Compulsory detentions under Mental Health Act
One study (Johnson 2005), reported numbers of participants admitted by compulsory detention under the Mental Health Act at three months and six months. There were fewer compulsory detentions in the crisis arm, although not to a significant extent (n = 260, 1 RCT, RR 0.62, 95% CI 0.34 to 1.11) and (n = 258, 1 RCT, RR 0.69, 95% CI 0.43 to 1.11), respectively.
2.2.6 Treatment failure
Fenton 1998 defined 'treatment failure' as transfer to another in‐patient facility without a prior return to the community; 13% of participants in the crisis arm required transfer and 4% of those in the standard arm. This was not a significant difference (n = 119, 1 RCT, RR 3.26, 95% CI 0.74 to 14.44).
2.2.7 Number of days in acute care
Data were unusable for some studies. Three studies (Fenton 1979; Muijen 1992; Stein 1975) included 'index admission' in their data and the remaining two did not report standard deviations (Hoult 1983; Pasamanick 1964a). 'Acute care' here is defined as admission to hospital or to crisis house after the initial index crisis.
Data at three months were reported by Johnson 2005, and show that the crisis group had significantly fewer days in acute care post‐crisis (n = 260, 1 RCT, mean difference (MD) ‐10.30, 95% CI ‐14.77 to ‐5.83). Data at six months are reported by Fenton 1998 and Johnson 2005. The crisis group again had fewer days in acute care post‐crisis, but not to a significant extent (n = 365, 2 RCTs, MD ‐10.54, 95% CI ‐26.49 to 5.42).
As with the repeat admissions above however, it appears that the exclusion of the data from Fenton 1998, which relates to a residential programme, produces a different result, With the inclusion of Johnson 2005 data only, the crisis group had significantly fewer days in acute care post‐crisis (n = 257,1 RCT, MD ‐17.30, 95% CI ‐27.80 to ‐6.80).
2.2.8 Number of visits
Skewed data were presented. One study reported that the crisis‐intervention care group had significantly fewer staff contacts during the six‐ to 12‐month period (P = 0.005) but by 12 months there was no statistical difference between the two groups use of staff time (P > 0.05) (Fenton 1979).
2.3 Leaving the study early
If data for this outcome were not clearly presented in the tables, we took relevant data from the text of each report.
At three months, there was no difference between treatment groups (n = 463, 3, RCTs, RR 0.80 95% CI 0.55 to 1.15). Small but significant differences favouring the standard‐care group were found for pooled data at six (n = 718, 5 RCTs, RR 0.73, 95% CI 0.55 to 0.97), and 12 months (n = 594, 4 RCTs, RR 0.74, 95% CI 0.56 to 0.98). By 20 months, a very slight but not statistically significant effect favouring the crisis group was found (n = 475, 3 RCTs, RR 0.78, 95% CI 0.57 to 1.06).
Only Hoult 1983 presented data for all relatives of those randomised. We found no difference in attrition between the groups (n = 120, RR 1.09, 95% CI 0.52 to 2.28). Muijen 1992 reported only on those relatives who were living with the randomised person and again found no clear differences between the groups at 20 months (n = 76, RR 0.71, 95% CI 0.43 to 1.17).
2.4 Global state
Global state did not vary greatly between the two groups. Two scales were used, the Global Assessment Scale (GAS) and Social Adjustment Scale (SAS). Data for GAS in Howard 2010 at three months showed no difference in scores between the crisis and standard groups. Data for GAS in Muijen 1992 were equivocal at six, 12 and 20 months (six months: n = 129, MD 5.10, 95% CI ‐0.86 to 11.06; 12 months: n = 131, MD 3.50, 95% CI ‐3.15 to 10.15; 20 months: n = 142, MD 5.70, 95% CI ‐0.26 to 11.66). SAS data from Muijen 1992 were also not significantly different over the same time periods (six months: n = 130, MD ‐0.20, 95% CI ‐0.75 to 0.35; 12 months: n = 120, MD ‐0.30, 95% CI ‐0.85 to 0.25; 20 months: n = 139, MD ‐0.60 95% CI ‐1.15 to ‐0.05).
Muijen 1992 also reported change in global state during the first three months. They found no difference for GAS change scores (n = 129, MD 5.20, 95% CI ‐1.19 to 11.59) or for SAS change scores (n = 127, MD 0.09, 95% CI ‐0.31 to 0.13). The data, however, were likely to be skewed. Hoult 1983 found the crisis‐intervention care patients had significantly higher scores on the Health and Sickness Rating Scale (HSRS) (P < 0.05) but reported no variance of these data.
2.5 Mental state
2.5.1 Numbers unwell
The crisis‐intervention packages investigated within this review seem to have little discernible effect on mental state. Hoult 1983 gave numbers unwell at 12 months and reported a slight, statistically non‐significant effect favouring the crisis‐intervention care group (n = 120, RR 0.65, 95% CI 0.40 to 1.07).
2.5.2 Scale data
2.5.2.1 Endpoint data
Johnson 2005 and Howard 2010 assessed mental state using the Brief Psychiatric Rating Scale (BPRS) at three months and found that the crisis group scored better, although not significantly (n = 248, 2 RCTs, MD ‐4.03, 95% CI ‐8.18 to 0.12 ). However, we wish to determine whether there are differences between residential programmes such as in Howard 2010 and mobile teams investigated in Johnson 2005. When data from Howard 2010 are removed, the difference between the crisis group and the standard group becomes significant (n = 226, 1 RCT, MD ‐2.90, 95% CI 5.50 to 0.30).
Muijen 1992 also assessed mental state using the BPRS and found no significant difference between the groups by six or 12 months (n = 129, 1 RCT, MD ‐2.10, 95% CI ‐6.40 to 2.20; n = 131, 1 RCT, MD ‐2.00, 95% CI ‐6.03 to 2.03, respectively), but a statistically significant difference favouring the crisis‐intervention care group by 20 months (n = 142, 1 RCT, MD ‐4.50, 95% CI ‐8.68 to ‐0.32). Hoult 1983 also assessed mental state using the BPRS and claimed no difference between the groups but reported no data to support this.
Fenton 1979 used the Psychiatric Evaluation Form (PEF) and found no effect at three months (n = 118, 1 RCT, MD 0.20, 95% CI ‐0.22 to 0.62), or at six months (n = 111, 1 RCT, MD 0.10, 95% CI ‐0.42 to 0.62). By 12 months, there was a small difference suggesting mental state of crisis‐intervention care group to be more improved (n = 97, 1 RCT, MD ‐0.40, 95% CI ‐0.84 to 0.04). This slight advantage was lost by 20 months when the difference between the groups was not significant (n = 100, 1 RCT, MD 0.10, 95% CI ‐0.47 to 0.67).
Muijen 1992 used the Present State Examination (PSE) but data were skewed. No significant difference was found at six or 12 months (P not reported) but they found a slight difference favouring the crisis‐intervention care group at 20 months (P = 0.09, trend only). Hoult 1983 also reported data for the PSE endpoint scores. They found a significant difference favouring the crisis‐intervention care group but did not report standard deviations.
Fenton 1998 used Positive and Negative Syndrome Scale (PANSS) at six months follow‐up. There were no significant differences between the groups (n = 111, 1 RCT, MD 4.00, 95% CI ‐3.45 to 11.45).
2.5.2.2 Change data
Muijen 1992 presented skewed data for change in mental state. At three months, they found no significant differences for scores on the BPRS (n = 129, 1 RCT, MD ‐3.50, 95% CI ‐8.92 to 1.92), or the PSE (n = 129, 1 RCT, MD ‐2.70, 95% CI ‐7.69 to 2.29).
2.5.3 Specific symptoms or behaviour
Hoult 1983 found no significant difference between the crisis‐intervention care and standard‐care groups for patient sociability at three months (n = 120, 1 RCT, RR 0.86, 95% CI 0.66 to 1.12), but the crisis care group was significantly more 'sociable' by six months (n = 120, 1 RCT, RR 0.43, 95% CI 0.30 to 0.64). This study also reported that there was no significant difference in aggressive behaviour at three or six months (n = 120, 1 RCT, RR 0.97, 95% CI 0.72 to 1.31; n = 120, 1 RCT, RR 0.70, 95% CI 0.39 to 1.25, respectively).
Hoult 1983 also recorded various behaviours such as agitation, depression, disorientation, psychotic thoughts, substance abuse and withdrawal (at four months).
The crisis‐intervention care group was less agitated (n = 120, 1 RCT, RR 0.59, 95% CI 0.36 to 0.95) and disorientated (n = 120, 1 RCT, RR 0.47, 95% CI 0.28 to 0.79) than the standard‐care group. There was a very small effect favouring the crisis‐intervention care group on the outcomes of 'psychotic behaviour' (n = 120, 1 RCT, RR 0.58, 95% CI 0.30 to 1.11) and 'withdrawal' (n = 120, 1 RCT, RR 0.72, 95% CI 0.48 to 1.07), but these results are not statistically significant. No differences were found for 'depression' (n = 120, 1 RCT, RR 0.80, 95% CI 0.57 to 1.13) or 'substance abuse' (n = 120, 1 RCT, RR 0.67, 95% CI 0.33 to 1.36).
2.6 Burden
Studies measured two types of burden; the burden placed on the families of the patients and burden placed on the community.
In general, the families of patients in the crisis‐intervention care group reported less burden than those of standard‐care patients. Significantly fewer crisis‐intervention care families reported disruption to their daily routine at three months than their standard‐care counterparts (n = 220, 2 RCTs, RR 0.76, 95% CI 0.59 to 0.97). This was a non‐significant difference at six months (n = 220, 2 RCTs, RR 0.67, 95% CI 0.37 to 1.21,).
Significantly fewer crisis‐intervention care families reported significant disruption to their social life at three months (n = 220, 2 RCTs, RR 0.69, 95% CI 0.53 to 0.91). By six months, this was a non‐significant difference (n = 220, 2 RCTs, RR 0.72, 95% CI 0.43 to 1.22). The crisis‐intervention care families also reported significantly less physical illness over the same time periods (n = 100, 1 RCT, RR physically ill by three months 0.78, 95% CI 0.65 to 0.95; n = 100, 1 RCT, RR physically ill by six months 0.71, 95% CI 0.55 to 0.92,) than those allocated to standard care. Data from Hoult 1983 show no significant difference in financial burden at three months (n = 120, RR 0.76, 95% CI 0.52 to 1.10) and at six months (n = 120 RR 0.84, 95% CI 0.53 to 1.33). This study also reported the number of families who felt that the overall burden was great; the outcome favoured the crisis‐intervention care group at three months (n = 120 RR 0.57, 95% CI 0.41 to 0.80), and also at six months (n = 120, RR 0.34, 95% CI 0.20 to 0.59).
Fenton 1979 assessed family burden using the Family Evaluation Form (FEF) but presented combined data. The two significant items (assuming patient's responsibilities and finding extra chores difficult) were the only items presented as individual data. A total of 61 items were analysed.
No differences were found between those allocated to the crisis‐intervention care and standard care for 'community burden'. The number of people with paid work at six months (Fenton 1998) and without full time employment at 20 months (Muijen 1992) was not significantly different (n = 112, 1 RCT, RR 1.41, 95% CI 0.65 to 3.04 and n = 189, 1 RCT, RR 0.97, 95% CI 0.85 to 1.12, respectively) as were the risk of using the emergency services at least once (n = 120, 1 RCT, RR 0.81, 95% CI 0.43 to 1.54). Stein 1975 reported slightly fewer crisis‐intervention care patients having had at least one arrest by 12 months although this result was not statistically significant (n = 120, 1 RCT, RR 0.71, 95% CI 0.46 to 1.12), Fenton 1998 reported only three arrests in total, all of these occurred in the crisis arm but this was not a significant difference (n = 111, 1 RCT, RR 5.36, 95% CI 0.28 to 101.35). Fenton 1998 also reported that at six months follow‐up, there was no significant difference in the numbers of participants who were homeless (n = 113, 1 RCT, RR 1.23, 95% CI 0.59 to 2.57). Hoult 1983 commented on community burden. They did not claim significant difference between the groups but no data were reported.
2.7 Satisfaction
One trial gave count data for patient and relative satisfaction (Hoult 1983). Overall, people allocated to crisis‐intervention care and their relatives were more satisfied with their treatment and level of support than those given standard care. By 12 months, significantly fewer people in the crisis‐intervention care groups felt 'unimproved' (n = 119, 1 RCT, RR 0.48 95% CI 0.31 to 0.74) when compared to the standard‐care group. Also data significantly favoured the crisis‐intervention care group when it came to dissatisfaction with the level of treatment received (n = 119, 1 RCT, RR 0.66 95% CI 0.50 to 0.88) and or feeling less able to cope than before their treatment (n = 119, 1 RCT, RR 0.36 95% CI 0.21 to 0.62). More people allocated to standard care felt they would have preferred community treatment when compared to the numbers of crisis‐intervention care patients preferring to have received hospital care (n = 119, 1 RCT, RR 0.46 95% CI 0.27 to 0.77). There was a small effect suggesting more crisis‐intervention care patients felt they would need extra help in the future but the difference was not statistically significant (n = 119, 1 RCT, RR 1.48 95% CI 0.88 to 2.48).
Three other studies used satisfaction scales to obtain continuous data (Johnson 2005, Muijen 1992 and Howard 2010). Johnson 2005 measured patient satisfaction at three months using the Client Satisfaction Questionnaire (CSQ) and found borderline significant differences favouring the crisis‐intervention care group (n = 226, 1 RCT, MD 1.60, 95% CI ‐0.22 to 3.42). Muijen 1992 also measured patient satisfaction using the CSQ and found significant differences favouring the crisis‐intervention care group at six months (n = 115, 1 RCT, MD 5.10 95% CI 3.16 to 7.04), at 12 months (n = 121, 1 RCT, MD 4.80 95% CI 3.12 to 6.49), and also at 20 months (n = 137, 1 RCT, MD 5.40 95% CI 3.91 to 6.89). Howard 2010 measured patient satisfaction by three months using the Verona Service Satisfaction Scale (VSSS) scale but found no significant differences (n = 24, 1 RCT, MD 0.20, 95% CI ‐0.20 to 0.60)
Only Hoult 1983 assessed relative satisfaction using count data. At three months, slightly fewer relatives in the crisis‐intervention care group were dissatisfied with the patients' improvement (n = 120, 1 RCT, RR 0.79, 95% CI 0.60 to 1.04). By six months the difference was statistically significant (n = 120, 1 RCT, RR 0.71, 95% CI 0.53 to 0.97). Significantly fewer crisis‐intervention care relatives were dissatisfied with the treatment the patient was receiving at three months (n = 120, 1 RCT, RR 0.63, 95% CI 0.44 to 0.89), six months (n = 120, 1 RCT, RR 0.57, 95% CI 0.42 to 0.78), and one year (n = 120, 1 RCT, RR 0.46, 95% CI 0.29 to 0.72). There was no difference in the number of relatives preferring the patient to have been allocated to the other treatment at any of the time points. There was a slight tendency towards more crisis‐intervention care relatives being satisfied with their allocated treatment as time progressed although this was not significant at any time point (n = 120, 1 RCT, RR at three months 1.27, 95% CI 0.63 to 2.57; n = 120, 1 RCT, RR at six months 1.11, 95% CI 0.49 to 2.54; n = 120, 1 RCT, RR at one year 0.81, 95% CI 0.43 to 1.54).
Significantly fewer relatives in the crisis‐intervention care group felt unable to cope at 12 months than they had felt before treatment began (n = 120, 1 RCT, RR 0.57, 95% CI 0.42 to 0.78) when compared with the standard‐care group. A small effect was found at 12 months showing more crisis‐intervention care relatives felt they would need future help. This difference was not statistically significant (n = 120, 1 RCT, RR 1.21, 95% CI 0.91 to 1.60).
2.8 Economic
The two trials that reported relevant data found crisis‐intervention care for those in crisis was significantly cheaper than standard care (P < 0.001) but all data presented were highly skewed (Fenton 1979; Muijen 1992). The other two trials (Hoult 1983; Stein 1975), also found crisis‐intervention care to be significantly cheaper but gave no variance of the average cost.
2.9 Quality of Life
Johnson 2005 measured quality of life by three months using the Manchester Short Assessment of quality of life (MANSA) scale but found no significant differences (n = 226, 1 RCT, MD ‐1.50, 95% CI ‐5.15 to 2.15). Howard 2010 measured quality of life by three months using the short form MANSA scale and found a significantly better quality of life for the crisis‐intervention arm over the standard‐care group (n = 28, 1 RCT, MD 0.70, 95% CI 0.14 to 1.26).
Howard 2010 measured also quality of life by three months using the : EuroQuol 5 dimension quality of life measure (EQ‐5D) scale but found no significant differences between the crisis‐ and standard‐care group (n = 26, 1 RCT, MD 0.01, 95% CI ‐0.32 to 0.34).
2.10 Social functioning
Johnson 2005 measured social functioning by three months and six months using the Life Skills Profile (LSP) scale but found no significant differences at either time point (n = 260, 1 RCT, MD 3.00, 95% CI ‐0.72 to 6.72 and MD 1.00, 95% CI ‐2.76 to 4.76, respectively).
Fenton 1998 reported the mean number of social contacts per week for participants at six months, rates for the two arms were very similar and showed no significant difference (n = 107, 1 RCT, MD 0.43, 95% CI ‐0.30 to 1.16).
2.11 Clinical and social problems
Johnson 2005 measured clinical and social problems by three months and six months using the Health of the Nation Outcomes Scales (HoNOS) scale but found no significant differences at either time point (n = 257, 1 RCT, MD ‐1.90, 95% CI ‐3.20 to ‐0.60 and n = 255, MD ‐0.60, 95% CI ‐2.07 to 0.87, respectively).
2.12 Unmet needs
Howard 2010 measured participants' unmet needs using the Community Adjustment Form (CAN) scale. However, the data are highly skewed and descriptive statistics only are presented, the mean for the standard‐care group is higher (more unmet needs) than for the crisis arm.
2.13 Outcomes with no data ‐ staff satisfaction
No data were presented for this outcome although three trials (Hoult 1983; Muijen 1992; Pasamanick 1964a) mentioned considerable problems with staff recruitment, despondency and 'burnout' within the crisis‐intervention care team.
2. COMPARISON 2: CRISIS INTERVENTION (Mobile teams) versus CRISIS INTERVENTION (residential)
A stated objective of the review was to compare crisis intervention carried out by mobile teams operating in the homes of patients versus crisis intervention taking place in home‐like residential units. It has not been possible to make this comparison as the studies we have identified make comparisons between either mobile teams or residential units and standard care, usually hospital admission.
Discussion
Summary of main results
1. General
Overall, the description of the methodology within the included studies was poor. Trials were small and data reporting problematic. We had great difficulty in acquiring a definitive description of 'crisis intervention' for studies included in 2006 and earlier and used the criteria that it should involve an intense, time‐limited, input of care during a crisis period and that this care should be available 24 hours. None of the included studies included before 2006 investigated 'crisis intervention' in a pure form. All employed packages of homecare that included an element of crisis intervention according to the above criteria. The crisis‐intervention elements ranged from an automated 24‐hour telephone help line to on‐call staff who could provide an immediate response. The 2006 results of this review therefore related to this type of home care (i.e. home care designed to treat those in psychiatric crisis) compared with standard hospital care. To complicate matters further, as the homecare intervention was not only implemented during a crisis but also lasted well beyond, results also relate to the effects of this ongoing treatment.
However, in the 2010 update we included three new studies. Johnson 2005 gathered data in the UK after government policy established crisis resolution teams (CRTs) (Department of Health 2000). This study investigated 'crisis intervention' given in a form specified for CRTs which, unlike the earlier studies, provided short‐term input but did not provide on‐going homecare intervention. The two other new studies included (Fenton 1998; Howard 2010) investigated alternatives to hospitalisation, home‐like 'crisis houses' aiming to provide care in a residential setting and support to continue daily routines as far as possible.
It should be noted that one of the included studies (Pasamanick 1964a), took place almost fifty years ago. In general, the care of people with schizophrenia has changed enormously since then and the relevance of this trial is questionable. It does, however, meet all the criteria necessary for inclusion and the two results obtained from this trial (hospital admission and leaving the study early) are in line with findings from other studies. The new 2014 search produced no new studies for inclusion.
2. COMPARISON 1. CRISIS INTERVENTION versus STANDARD CARE
2.1 Death or harm
There were few episodes of self‐harm and even less of death. There were two homicides altogether in the total sample, both occurring in the crisis‐intervention treatment arms of studies. However, with a total sample size of 980 for all the studies reporting death or harm., it is difficult to draw conclusions from this. There is no indication of any effect crisis intervention may have on these important outcomes. The only firm conclusion possible is that much larger studies are needed if this is to be investigated within the context of trials.
2.2. Hospital use
Care needs to be taken when interpreting hospital admission rates. For studies included in the 2006 update and earlier, comparing the treatment groups on overall number of admissions is misleading as admission was an integral part of the standard care and this ‘index’ admission was not differentiated from subsequent admissions taking place within the timescale of the study.
However, with two of the new studies, (Fenton 1998; Johnson 2005), admission data were differentiated and therefore, data from these two studies have been presented separately. There is a further distinction to be made between these studies, as Fenton 1998 reports data from a crisis house, whereas Johnson 2005 reports on the work of a mobile crisis team treating patients within their own homes.
Data from Johnson 2005 at three months and six months show a clear, significant advantage for the crisis arm, this is also the case for admissions due to compulsory detentions, which were analysed separately. Once the data from Fenton 1998 at six months are included, the crisis arm retains a more favourable outcome than standard care, but not to a significant extent. It appears that the crisis‐intervention package provided by the Crisis Resolution Teams in the UK succeeded in reducing hospital admissions, which was one of their main stated aims.
Data for hospital admission rates for the homecare package group i.e. all included studies dating before 1998, were presented as the number of repeat admissions.
Pooled data from three studies (Fenton 1979; Hoult 1983; Muijen 1992), suggested crisis intervention as part of a homecare package was superior, with significantly less repeat admissions by 12 months. However, this result contains a considerable amount of heterogeneity (I2 86%), with one very positive study (Hoult 1983) affecting data from the other two studies which found no differences in repeat admissions. There is no clear reason why Hoult 1983 sits apart from the other two trials. Data from Fenton 1979 suggested the homecare group had fewer staff contacts, but this information was not supported by usable data and more research is needed. In conclusion, the picture for hospital readmission is mixed with two studies finding a distinct advantage for the crisis arm and three studies finding no difference. These varied findings may be caused by the different ways in which 'crisis intervention' has been applied and also by the different methods by which hospital readmission has been measured.
2.3 Leaving the study early
Homogeneous data suggest that people who were allocated to have their crisis managed within the homecare group were more likely to stay in care for at least a year. This is an important finding and even though findings for several other important effects of this package may be unremarkable these data alone may be enough to promote the use of a crisis ethos within homecare teams (see Implications for practice).
2.4 Global state and mental state
Howard 2010 and Muijen 1992 were the only studies reporting usable data for global measures of outcome. Although there was some suggestion that within the GAS score there was an effect favouring the crisis group, no major differences between the two treatments were found and the clinical meaning is unclear.
Pooled data on mental state as measured by the BPRS for Howard 2010 and Johnson 2005 found a clear, significant advantage for the crisis arm after three months. Muijen 1992 found no differences in the crisis‐ and standard‐care arms at six and 12 months, but at 20 months again, the advantage was significant for the crisis arm. Hoult 1983 was the only trial to give binary data based on relatives' observations. Some differences in behaviours such as sociability, agitation and disorientation were found favouring the crisis‐intervention care group, but it would be prudent to replicate these findings as they are all from one very positive small study (n = 120, Hoult 1983). Overall, one may cautiously suggest that results favour crisis intervention over hospital admission, however, all studies are small and not of high quality (see summary of findings Table for the main comparison)
2.5 Burden
Overall, specific burden on families such as 'disruption to daily routine' (CI 3 to 30), 'physical illnesses experienced' (CI 2 to 14), and 'disruption to social life' (CI 3 to 30), favoured the crisis‐intervention group. None of these findings are based on large numbers and, again, all should be replicated. The direction of effect, however, is consistent within and across trials. These data, at the very least, are hypotheses‐generating for further studies and may suggest that families find routine admission more disruptive and burdensome than well‐motivated crisis intervention.
Little can be said about the effect of crisis intervention regarding 'community burden' in terms of employment, numbers of people being arrested, homelessness or using emergency teams, except perhaps that the results are resolutely equivocal. Unfortunately few of the included studies recorded and reported these important outcomes.
2.6 Satisfaction
Patient and relatives' satisfaction was higher in the crisis‐intervention care group than in those allocated to standard care. This finding was generally consistent over several measures although all continuous measures are difficult to interpret, one study only found that relatives may have preferred more help outside of working hours (Hoult 1983). These data would fit with the findings relating to 'burden' and further supports the suggestion that the experimental intervention is acceptable to both those with serious mental illness and their 'lay' carers.
2.7 Economic
The limited data available found crisis‐intervention care to be significantly cheaper than standard care. Again, data were difficult to interpret, as they were either very skewed or unusable. We recognise the difficulty in recording such data but nevertheless such outcomes are of crucial importance if research is to be relevant to managers and policy makers.
2.8 Quality of Life
Limited data from two studies found no significant differences between treatment arms, however, one very small study (Howard 2010), did find a significant advantage for the crisis arm.
2.9 Social functioning
Limited data from one study found no significant differences between treatment arms.
2.10 Clinical and social problems
Limited data from one study found no significant differences between treatment arms.
2.11 Missing outcome: staff satisfaction
It is unfortunate that no data are available for staff satisfaction. Issues such as staff recruitment, despondency and burnout are essential to the successful implementation of crisis‐intervention care packages. Several of the studies mentioned these as notable problems affecting the running of the project. If such problems were prominent in these usually well‐resourced and well‐motivated research teams, they may amount to insurmountable obstacles to the implementation of similar projects in routine psychiatric settings.
2. COMPARISON 1. CRISIS INTERVENTION (mobile) versus CRISIS INTERVENTION (residential)
It was not possible to compare these outcomes as none of the studies directly compared residential units providing crisis care versus the mobile teams. However, inclusion of the data from the two studies assessing the residential crisis houses with the data from the six studies examining mobile care generally produced consistent results. Where results were at variance this has been indicated above. For hospital admission, mobile teams did appear to be slightly more successful at preventing readmission compared with standard care.
Overall completeness and applicability of evidence
1. Completeness
No outcomes in this review involve large numbers of people. Some important measures and more subtle findings are not recorded. Most importantly, it was possible to assess whether crisis interventions were achieving their chief aim, that is, to reduce hospital admissions for psychiatric treatment on one study only. Furthermore, we identified few data on quality of life, social functioning and patient satisfaction. Staff satisfaction was identified in the literature as an important factor but was not measured by any of the studies, although some did mention problems with staff recruitment and stress.
2. Applicability
Only one of the most recent trials, Johnson 2005, evaluated crisis intervention as practiced by Crisis Resolution Home Care teams currently in the UK, that is, as a brief, time‐limited intervention. The other, older trials, all comprised crisis interventions which were part of an on‐going healthcare package. The extent to which these are relevant to current treatment is debated in Johnson 2008. An important limitation is that the older studies, unlike the present system, continued care for a longer term after the resolution of the initial crisis. Two other studies were included because they evaluated crisis houses, home‐like units based in residential areas, as an alternative to hospital admission.
Quality of the evidence
The included trials were of similar size, ranging from 41 to 260 participants and follow‐up ranged from three months to 24 months. Trials of this relatively small size are unlikely to detect subtle but important differences with any confidence, and it was not possible to look at subgroups such as different kinds of programmes and patients at different clinical stages. Overall, the quality of reporting of these trials was poor. Some studies were not clearly blinded or did not have independent assessors collecting outcome data. Allocation concealment was not always described and loss of some participants to follow‐up unaccounted for. We are unsure if data are incomplete or selectively reported, or if other biases were operating.
Potential biases in the review process
1. Missing studies
Every effort was made to identify relevant trials. However, trials in this area are very few in number. Johnson 2005 point out that recruitment to a trial during a psychiatric crisis is a challenge as crises tend to occur suddenly and unexpectedly. To fulfil the consent requirements for present ethical regulations, waiting for a researcher to arrive and conduct an interview before formulating a treatment plan is often unsafe and unfeasible, and patients often lack the capacity to make informed decisions. These problems probably account for the lack of recent randomised evaluations of crisis services. It seems unlikely therefore, that we have failed to identify large relevant studies in accessible literature. We were unable to include one unpublished study where we are awaiting a response from the author.
2. Introducing bias
This review group has now updated this review several times and incorporated the new methodology of the Cochrane Schizophrenia Group. We have tried to be balanced in our appraisal of the evidence, but we could have inadvertently introduced bias. We welcome comments or criticisms.
Agreements and disagreements with other studies or reviews
The authors of Johnson 2008 have reviewed the evidence for crisis intervention for adults requiring psychiatric admission for any condition, and included non‐randomised studies as well as randomised controlled trials. They concluded that trends have emerged suggesting that crisis intervention has an impact on hospital admission and that service users are more satisfied with them than with standard hospital care. However, they cautioned that the evidence base remains very limited and that high‐quality randomised trials are needed, particularly on the functioning of well‐established crisis‐intervention teams which have not, as yet, been assessed. Shepperd 2009 have reviewed alternatives to inpatient mental health care for children and young people, including crisis intervention. They identified one study only for this age group, for children with emotional and behavioural disorders experiencing psychiatric crises requiring hospitalisation. By comparison to standard care, children in the crisis‐intervention group showed small, significant favourable differences in family cohesion, social behaviour and competency and self‐esteem in the short term, again, providing some limited support for the crisis approach.

Study flow diagram 2014 search
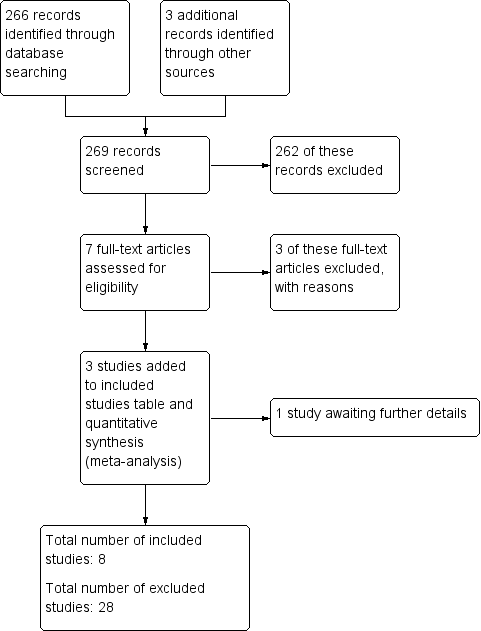
Study flow diagram (2010 UPDATE).
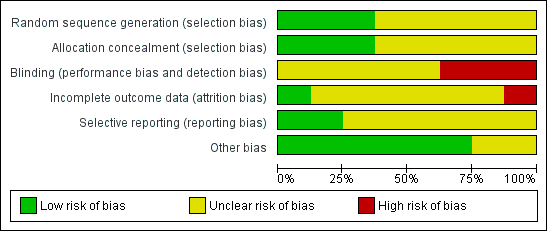
'Risk of bias' graph: review authors' judgements about each risk of bias item presented as percentages across all included studies.
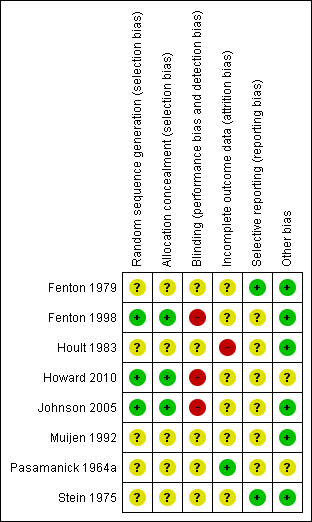
'Risk of bias' summary: review authors' judgements about each risk of bias item for each included study.
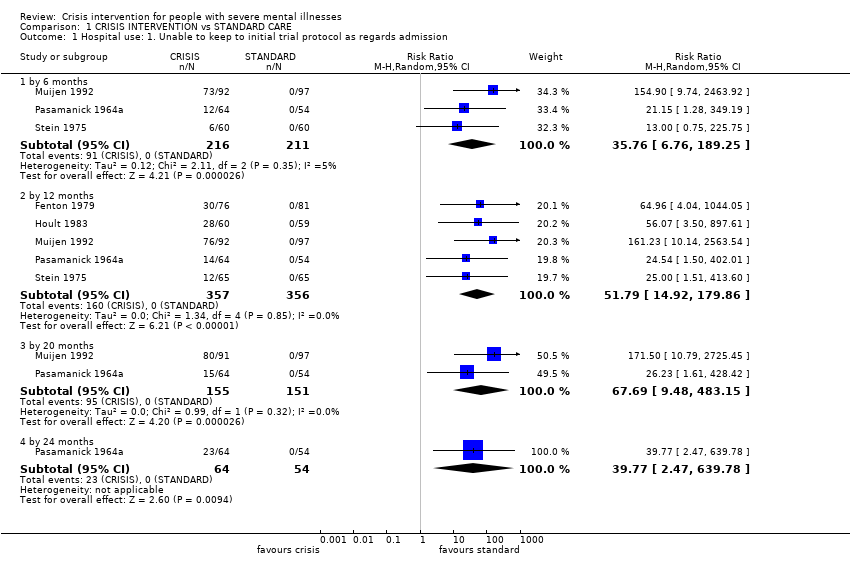
Comparison 1 CRISIS INTERVENTION vs STANDARD CARE, Outcome 1 Hospital use: 1. Unable to keep to initial trial protocol as regards admission.

Comparison 1 CRISIS INTERVENTION vs STANDARD CARE, Outcome 2 Hospital use: 2. Repeat admissions including index admission.
| Study | Interventions | Mean | SD | N | Notes |
| By 6 months | |||||
| Fenton 1998 | Crisis care | 1.30 | 1.88 | 63 | |
| Fenton 1998 | Standard care | 1.77 | 3.32 | 48 | |
Comparison 1 CRISIS INTERVENTION vs STANDARD CARE, Outcome 3 Hospital Use: 3. Number of repeat admissions per participant.

Comparison 1 CRISIS INTERVENTION vs STANDARD CARE, Outcome 4 Hospital use: 4. Repeat admissions excluding index admission.

Comparison 1 CRISIS INTERVENTION vs STANDARD CARE, Outcome 5 Hospital use: 5. Repeat admissions excluding index admission ‐ compulsory detentions only.
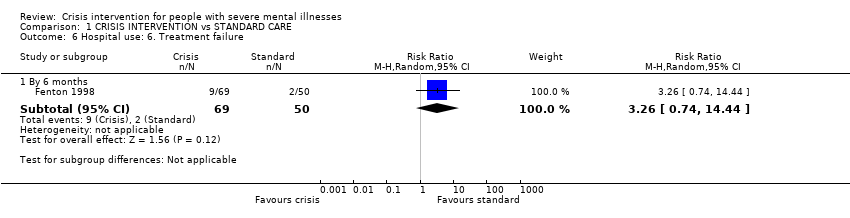
Comparison 1 CRISIS INTERVENTION vs STANDARD CARE, Outcome 6 Hospital use: 6. Treatment failure.

Comparison 1 CRISIS INTERVENTION vs STANDARD CARE, Outcome 7 Hospital use: 7. Days in acute care.
| Study | Interventions | Mean | SD | N | Notes |
| 6 ‐ 12 months | |||||
| Fenton 1979 | Crisis/home group | 2.1 | 3.4 | 76 | Difference favouring home group (two tailed t‐test, p=0.005) |
| Fenton 1979 | Standard care group | 6.3 | 12.3 | 79 | |
| by 12 months | |||||
| Fenton 1979 | Crisis/home group | 16.5 | 11.7 | 76 | No difference between the groups (two tailed t test p> 0.05) |
| Fenton 1979 | Standard care group | 13.0 | 19.2 | 79 | |
Comparison 1 CRISIS INTERVENTION vs STANDARD CARE, Outcome 8 Hospital use: 8. Home or outpatient visits (data likely to be skewed).

Comparison 1 CRISIS INTERVENTION vs STANDARD CARE, Outcome 9 Leaving the study early (unwilling or unable to provide infomation): 1. Patients.

Comparison 1 CRISIS INTERVENTION vs STANDARD CARE, Outcome 10 Leaving the study early (unwilling or unable to provide information) 2. Relatives.

Comparison 1 CRISIS INTERVENTION vs STANDARD CARE, Outcome 11 Death: 1. Any cause.

Comparison 1 CRISIS INTERVENTION vs STANDARD CARE, Outcome 12 Death: 2. By cause.

Comparison 1 CRISIS INTERVENTION vs STANDARD CARE, Outcome 13 Harm to self or others.

Comparison 1 CRISIS INTERVENTION vs STANDARD CARE, Outcome 14 Global state: 1. GAS (endpoint score, range 1‐100, low=poor) (loss in some cases is greater than 30%).

Comparison 1 CRISIS INTERVENTION vs STANDARD CARE, Outcome 15 Global state: 2. SAS (endpoint score, high=poor) (loss in some cases in greater than 30%).

Comparison 1 CRISIS INTERVENTION vs STANDARD CARE, Outcome 16 Global state: 3. GAS scale change data by 3 months (+ve change=good, data likely to be skewed).

Comparison 1 CRISIS INTERVENTION vs STANDARD CARE, Outcome 17 Global state: 4. SAS change data by 3 months (‐ve change=good, data likely to be skewed).
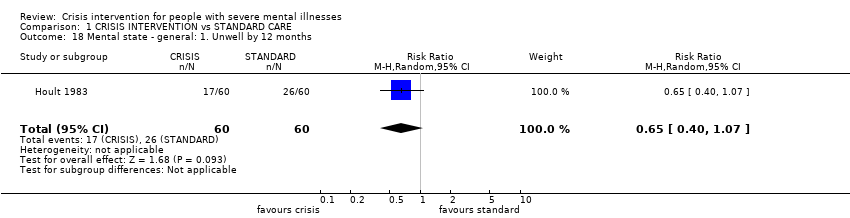
Comparison 1 CRISIS INTERVENTION vs STANDARD CARE, Outcome 18 Mental state ‐ general: 1. Unwell by 12 months.

Comparison 1 CRISIS INTERVENTION vs STANDARD CARE, Outcome 19 Mental state ‐ general: 2. BPRS (endpoint score, range 24‐168, high=poor) (loss in standard group >30% for 6 months or more).

Comparison 1 CRISIS INTERVENTION vs STANDARD CARE, Outcome 20 Mental state ‐ general: 3. PEF (endpoint score, range 0‐5, high=poor) (loss is greater than 30%).
| Study | Interventions | Mean | SD | N | Notes |
| by 6 months | |||||
| Muijen 1992 | Crisis group | 13.5 | 11.5 | 67 | No difference between groups (ANCOVA, p=not reported). |
| Muijen 1992 | Standard care group | 16.5 | 12.1 | 61 | |
| by 12 months | |||||
| Muijen 1992 | Crisis group | 11.8 | 12.0 | 64 | No difference between groups (ANCOVA, p=not reported). |
| Muijen 1992 | Standard care group | 13.8 | 14.4 | 64 | |
| by 20 months | |||||
| Muijen 1992 | Crisis group | 8.2 | 9.3 | 72 | Result not statistically significant (p=0.09) |
| Muijen 1992 | Standard care group | 12.2 | 15.0 | 70 | |
Comparison 1 CRISIS INTERVENTION vs STANDARD CARE, Outcome 21 Mental state ‐ general: 4. PSE (endpoint score, high score=poor, data likely to be skewed).

Comparison 1 CRISIS INTERVENTION vs STANDARD CARE, Outcome 22 Mental state ‐ general: 5. BPRS scale change data by 3 months (‐ve change=good, data likely to be skewed).

Comparison 1 CRISIS INTERVENTION vs STANDARD CARE, Outcome 23 Mental state ‐ general: 6. PSE scale change data by 3 months (‐ve change=good, data likely to be skewed)..

Comparison 1 CRISIS INTERVENTION vs STANDARD CARE, Outcome 24 Mental state: general PANSS (endpoint score, range 30‐210, high=poor).

Comparison 1 CRISIS INTERVENTION vs STANDARD CARE, Outcome 25 Mental state ‐ specific: 1. Unsociable (reported by relatives).
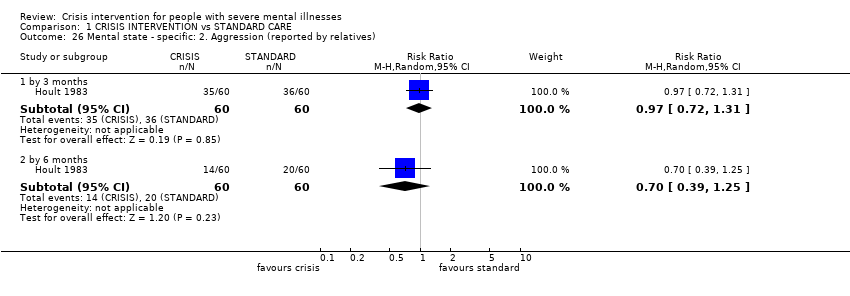
Comparison 1 CRISIS INTERVENTION vs STANDARD CARE, Outcome 26 Mental state ‐ specific: 2. Aggression (reported by relatives).
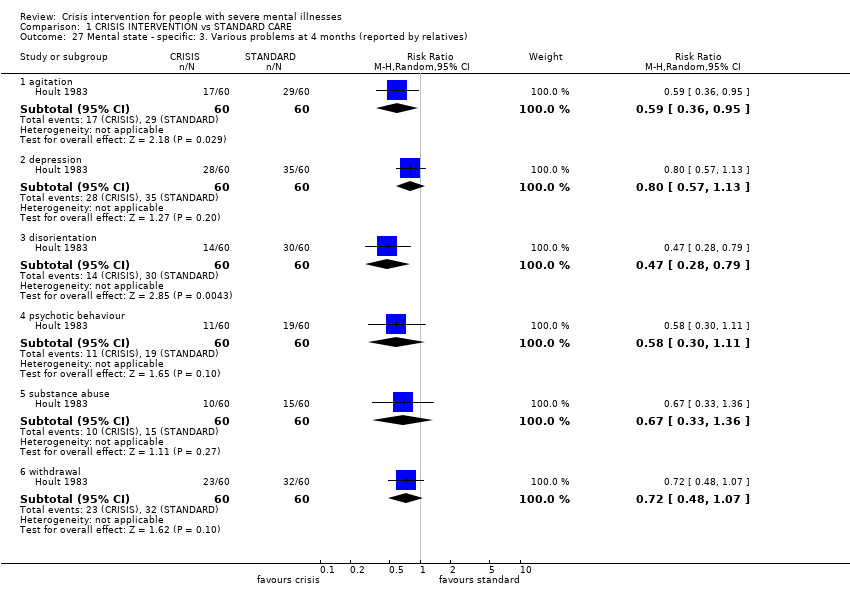
Comparison 1 CRISIS INTERVENTION vs STANDARD CARE, Outcome 27 Mental state ‐ specific: 3. Various problems at 4 months (reported by relatives).

Comparison 1 CRISIS INTERVENTION vs STANDARD CARE, Outcome 28 Burden ‐ family: 1. Disruption to daily routine.
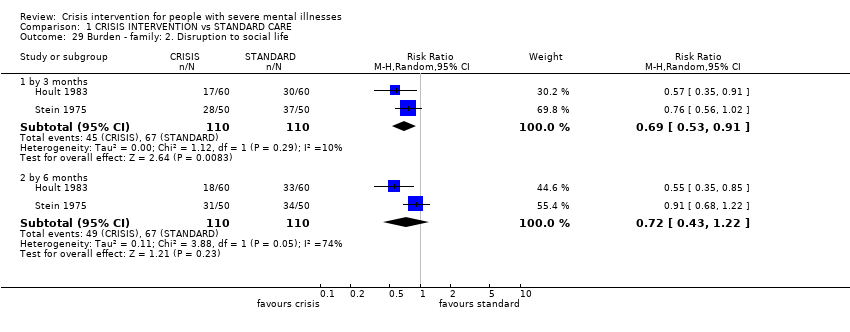
Comparison 1 CRISIS INTERVENTION vs STANDARD CARE, Outcome 29 Burden ‐ family: 2. Disruption to social life.
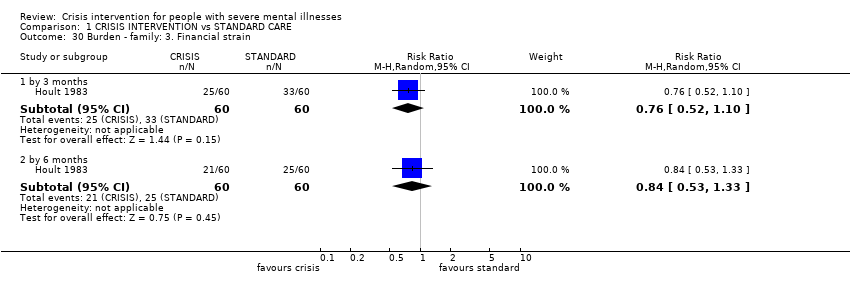
Comparison 1 CRISIS INTERVENTION vs STANDARD CARE, Outcome 30 Burden ‐ family: 3. Financial strain.

Comparison 1 CRISIS INTERVENTION vs STANDARD CARE, Outcome 31 Burden ‐ family: 4. Physical illness due to patient's illness.

Comparison 1 CRISIS INTERVENTION vs STANDARD CARE, Outcome 32 Burden ‐ family: 5. Overall burden is great.

Comparison 1 CRISIS INTERVENTION vs STANDARD CARE, Outcome 33 Burden ‐ community: 1. Not employed by 20 months.
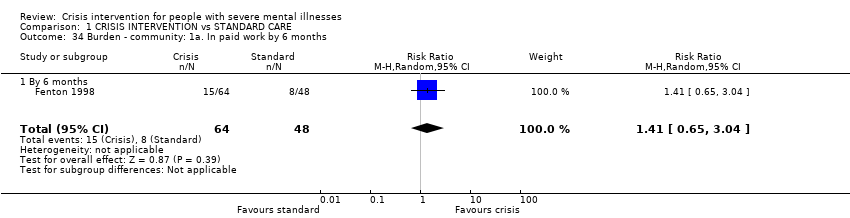
Comparison 1 CRISIS INTERVENTION vs STANDARD CARE, Outcome 34 Burden ‐ community: 1a. In paid work by 6 months.
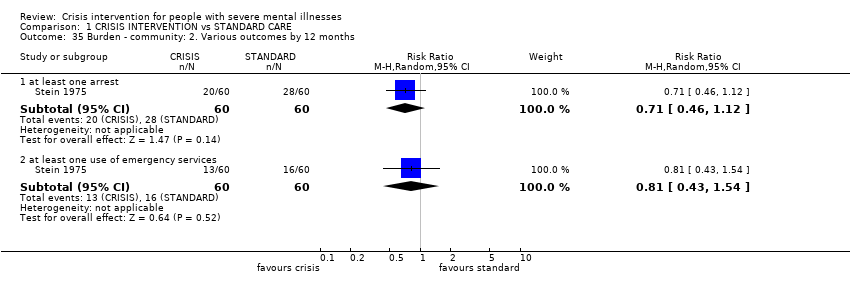
Comparison 1 CRISIS INTERVENTION vs STANDARD CARE, Outcome 35 Burden ‐ community: 2. Various outcomes by 12 months.
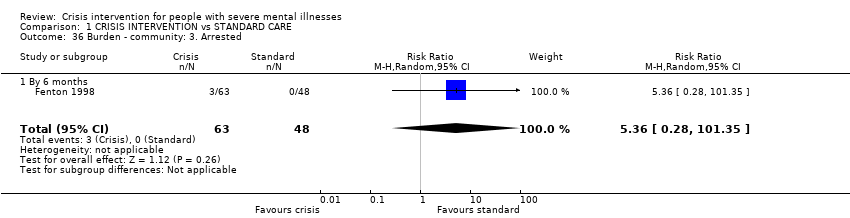
Comparison 1 CRISIS INTERVENTION vs STANDARD CARE, Outcome 36 Burden ‐ community: 3. Arrested.
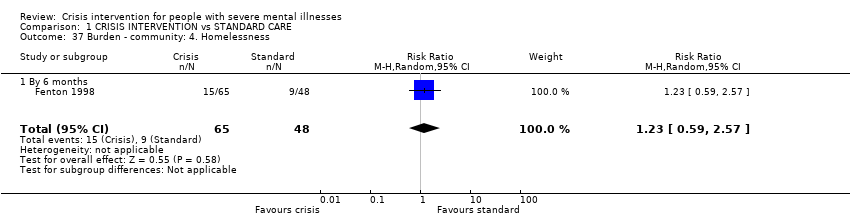
Comparison 1 CRISIS INTERVENTION vs STANDARD CARE, Outcome 37 Burden ‐ community: 4. Homelessness.

Comparison 1 CRISIS INTERVENTION vs STANDARD CARE, Outcome 38 Satisfaction ‐ patient: 1. Various outcomes by 12 months.
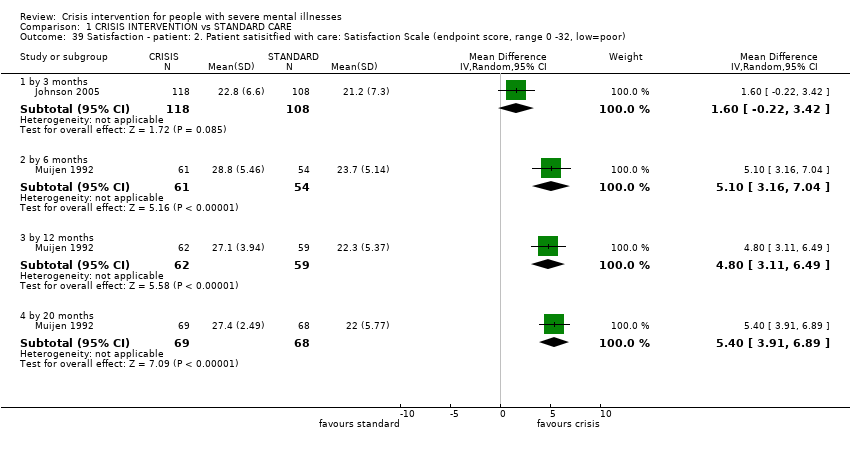
Comparison 1 CRISIS INTERVENTION vs STANDARD CARE, Outcome 39 Satisfaction ‐ patient: 2. Patient satisitfied with care: Satisfaction Scale (endpoint score, range 0 ‐32, low=poor).

Comparison 1 CRISIS INTERVENTION vs STANDARD CARE, Outcome 40 Satisfaction: Patient: 3. VSSS Scale (low=poor).

Comparison 1 CRISIS INTERVENTION vs STANDARD CARE, Outcome 41 Satisfaction ‐ relatives: 1. Feels patient is not improved.
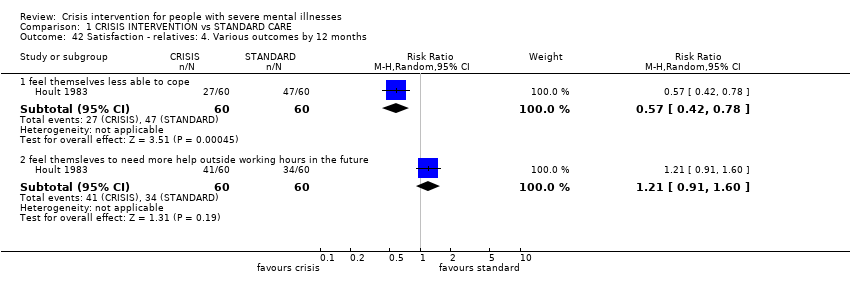
Comparison 1 CRISIS INTERVENTION vs STANDARD CARE, Outcome 42 Satisfaction ‐ relatives: 4. Various outcomes by 12 months.

Comparison 1 CRISIS INTERVENTION vs STANDARD CARE, Outcome 43 Satisfaction ‐ relatives: 3. Would have preferred patient to have received other treatment.

Comparison 1 CRISIS INTERVENTION vs STANDARD CARE, Outcome 44 Satisfaction ‐ relatives: 2. Dissatisfied with treatment received.
| Study | Interventions | Mean | SD | N | Notes |
| total cost for trial period ‐ as assessed by researchers | |||||
| Fenton 1979 | Crisis/home care group | $1980 | $1850 | 79 | Difference favouring home group stated (2 tailed t‐test p< 0.001) |
| Fenton 1979 | Standard care group | $3250 | $2410 | 76 | |
| total cost for trial period ‐ as assessed by finance department | |||||
| Fenton 1979 | Crisis/home care group | $3230 | $5120 | 79 | Difference favouring home group (2 tailed t‐test p=0.001) |
| Fenton 1979 | Standard care group | $6750 | $7180 | 76 | |
| per week | |||||
| Muijen 1992 | Crisis/home care group | £196 | £97 | 55 | Over 20 month trial period |
| Muijen 1992 | Standard care group | £358 | £241 | 48 | Difference favouring home group (p=0.000) |
Comparison 1 CRISIS INTERVENTION vs STANDARD CARE, Outcome 45 Economic cost per patient (data likely to be skewed).
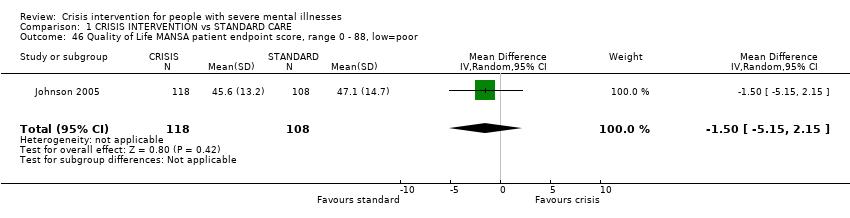
Comparison 1 CRISIS INTERVENTION vs STANDARD CARE, Outcome 46 Quality of Life MANSA patient endpoint score, range 0 ‐ 88, low=poor.
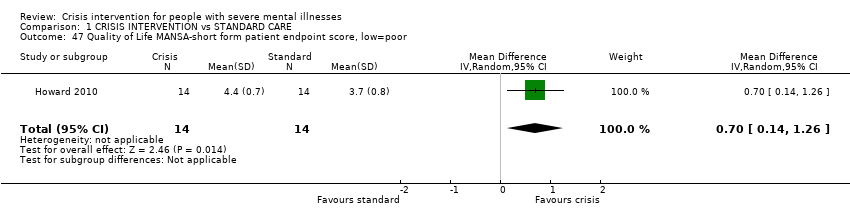
Comparison 1 CRISIS INTERVENTION vs STANDARD CARE, Outcome 47 Quality of Life MANSA‐short form patient endpoint score, low=poor.
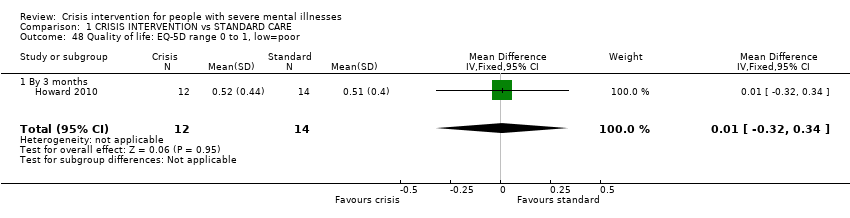
Comparison 1 CRISIS INTERVENTION vs STANDARD CARE, Outcome 48 Quality of life: EQ‐5D range 0 to 1, low=poor.

Comparison 1 CRISIS INTERVENTION vs STANDARD CARE, Outcome 49 Social contacts.
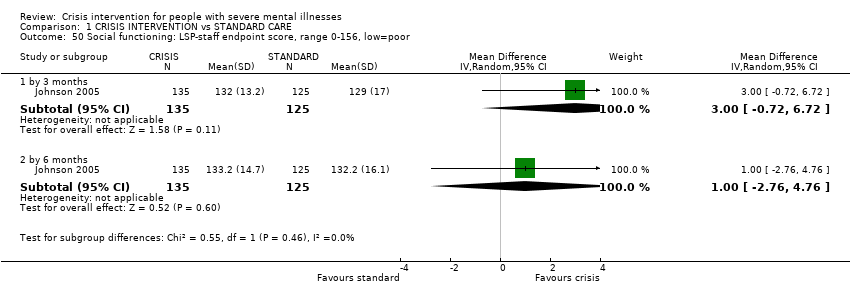
Comparison 1 CRISIS INTERVENTION vs STANDARD CARE, Outcome 50 Social functioning: LSP‐staff endpoint score, range 0‐156, low=poor.

Comparison 1 CRISIS INTERVENTION vs STANDARD CARE, Outcome 51 Clinical and social problems HoNOS ‐ staff endpoint score, range 0‐48, high=poor.
| Study | Interventions | Mean | SD | N | Notes |
| Howard 2010 | Crisis group | 4.1 | 2.4 | 13 | |
| Howard 2010 | Standard care group | 6.4 | 4.5 | 12 | |
Comparison 1 CRISIS INTERVENTION vs STANDARD CARE, Outcome 52 Unmet needs: CAN scale range 0‐22, high=poor.
| Methods | Allocation: randomised, with sequence generation and concealment of allocation clearly described. |
| Participants | Diagnosis: schizophrenia or related psychoses. |
| Interventions | 1. Mobile crisis team, providing treatment in patients' homes, multidisciplinary, 24‐hour service, drug treatment, psychotherapy, instruction in living skills. N = 150. 2. Crisis houses, providing treatment in residential areas, multidisciplinary, 24‐hour service, drug treatment, psychotherapy, instruction in living skills. N = 150. 3. Admission to psychiatric wards N = 150. In all three treatment arms, continuing treatment likely to be given by community mental health teams after initial crisis. |
| Outcomes | Death. Quality of life. |
| Notes | * Size of study with sufficient power to highlight about a 10% difference between groups for primary outcome. |
| CGI: Clinical Global Impression | |
| CRISIS INTERVENTION compared with STANDARD CARE for people with severe mental illnesses | ||||||
| Patient or population: patients with people with severe mental illnesses | ||||||
| Outcomes | Illustrative comparative risks* (95% CI) | Relative effect | No of Participants | Quality of the evidence | Comments | |
| Assumed risk | Corresponding risk | |||||
| STANDARD CARE | CRISIS INTERVENTION | |||||
| Global state | The mean global state in the control groups was | The mean global state in the intervention groups was | 142 | ⊕ ⊕ ⊕ ⊝ | Outcome measure favours crisis intervention over standard care, although not to a significant extent | |
| Mental state ‐ general | The mean mental state ‐ general in the control groups was | The mean mental state ‐ general in the intervention groups was | 248 | ⊕ ⊕ ⊝ ⊝ | Outcome measure favours crisis intervention, although not to a significant extent | |
| Patient Satisfaction | The mean patient satisfaction in the control groups was | The mean patient satisfaction in the intervention groups was | 137 | ⊕ ⊕ ⊕ ⊝ | Outcome favours crisis intervention to a significant extent | |
| Quality of Life | The mean quality of life in the control groups was | The mean quality of life in the intervention groups was | 226 | ⊕ ⊕ ⊝ ⊝ | Outcome favours standard care although not to a significant extent | |
| Burden on family | 583 per 1000 | 198 per 1000 | RR 0.34 | 120 | ⊕ ⊕ ⊝ ⊝ | Outcome significantly favours crisis intervention |
| Hospital use | 758 per 1000 | 470 per 1000 | RR 0.75 | 369 | ⊕ ⊕ ⊕ ⊕ | Outcome significantly favours crisis intervention |
| *The basis for the assumed risk (e.g. the median control group risk across studies) is provided in footnotes. The corresponding risk (and its 95% confidence interval) is based on the assumed risk in the comparison group and the relative effect of the intervention (and its 95% CI). | ||||||
| GRADE Working Group grades of evidence | ||||||
| 1 Details of randomisation not described. | ||||||
| Title | Stage | Reference | Cochrane Editorial Group |
| Crisis intervention for people with severe mental illnesses | Review | This review | Cochrane Schizophrenia Group |
| Crisis interventions for people with borderline personality disorder | Review | Cochrane Developmental, Psychosocial and Learning Problems Group. | |
| Alternatives to inpatient mental health care for children and | Review | Cochrane Effective Practice and Organisation of Care Group |
| Outcome or subgroup title | No. of studies | No. of participants | Statistical method | Effect size |
| 1 Hospital use: 1. Unable to keep to initial trial protocol as regards admission Show forest plot | 5 | Risk Ratio (M‐H, Random, 95% CI) | Subtotals only | |
| 1.1 by 6 months | 3 | 427 | Risk Ratio (M‐H, Random, 95% CI) | 35.76 [6.76, 189.25] |
| 1.2 by 12 months | 5 | 713 | Risk Ratio (M‐H, Random, 95% CI) | 51.79 [14.92, 179.86] |
| 1.3 by 20 months | 2 | 306 | Risk Ratio (M‐H, Random, 95% CI) | 67.69 [9.48, 483.15] |
| 1.4 by 24 months | 1 | 118 | Risk Ratio (M‐H, Random, 95% CI) | 39.77 [2.47, 639.78] |
| 2 Hospital use: 2. Repeat admissions including index admission Show forest plot | 3 | Risk Ratio (M‐H, Random, 95% CI) | Subtotals only | |
| 2.1 by 12 months | 3 | 465 | Risk Ratio (M‐H, Random, 95% CI) | 0.71 [0.31, 1.61] |
| 2.2 by 20 months | 1 | 188 | Risk Ratio (M‐H, Random, 95% CI) | 1.10 [0.75, 1.60] |
| 3 Hospital Use: 3. Number of repeat admissions per participant Show forest plot | Other data | No numeric data | ||
| 3.1 By 6 months | Other data | No numeric data | ||
| 4 Hospital use: 4. Repeat admissions excluding index admission Show forest plot | 2 | Risk Ratio (M‐H, Random, 95% CI) | Subtotals only | |
| 4.1 by 3 months | 1 | 260 | Risk Ratio (M‐H, Random, 95% CI) | 0.53 [0.41, 0.68] |
| 4.2 by 6 months | 2 | 369 | Risk Ratio (M‐H, Random, 95% CI) | 0.75 [0.50, 1.13] |
| 5 Hospital use: 5. Repeat admissions excluding index admission ‐ compulsory detentions only Show forest plot | 1 | Risk Ratio (M‐H, Random, 95% CI) | Subtotals only | |
| 5.1 by 3 months | 1 | 260 | Risk Ratio (M‐H, Random, 95% CI) | 0.62 [0.34, 1.11] |
| 5.2 by 6 months | 1 | 258 | Risk Ratio (M‐H, Random, 95% CI) | 0.69 [0.43, 1.11] |
| 6 Hospital use: 6. Treatment failure Show forest plot | 1 | Risk Ratio (M‐H, Random, 95% CI) | Subtotals only | |
| 6.1 By 6 months | 1 | 119 | Risk Ratio (M‐H, Random, 95% CI) | 3.26 [0.74, 14.44] |
| 7 Hospital use: 7. Days in acute care Show forest plot | 2 | Mean Difference (IV, Random, 95% CI) | Subtotals only | |
| 7.1 By 3 months | 1 | 260 | Mean Difference (IV, Random, 95% CI) | ‐10.3 [‐14.77, ‐5.83] |
| 7.2 By 6 months | 2 | 365 | Mean Difference (IV, Random, 95% CI) | ‐10.54 [‐26.49, 5.42] |
| 8 Hospital use: 8. Home or outpatient visits (data likely to be skewed) Show forest plot | Other data | No numeric data | ||
| 8.1 6 ‐ 12 months | Other data | No numeric data | ||
| 8.2 by 12 months | Other data | No numeric data | ||
| 9 Leaving the study early (unwilling or unable to provide infomation): 1. Patients Show forest plot | 8 | Risk Ratio (M‐H, Random, 95% CI) | Subtotals only | |
| 9.1 by 3 months | 3 | 463 | Risk Ratio (M‐H, Random, 95% CI) | 0.80 [0.55, 1.15] |
| 9.2 by 6 months | 5 | 718 | Risk Ratio (M‐H, Random, 95% CI) | 0.73 [0.55, 0.97] |
| 9.3 by 12 months | 4 | 594 | Risk Ratio (M‐H, Random, 95% CI) | 0.74 [0.56, 0.98] |
| 9.4 by 20 months | 3 | 475 | Risk Ratio (M‐H, Random, 95% CI) | 0.78 [0.57, 1.06] |
| 10 Leaving the study early (unwilling or unable to provide information) 2. Relatives Show forest plot | 2 | Risk Ratio (M‐H, Random, 95% CI) | Subtotals only | |
| 10.1 total in study | 1 | 120 | Risk Ratio (M‐H, Random, 95% CI) | 1.09 [0.52, 2.28] |
| 10.2 subgroup of those living with patient | 1 | 76 | Risk Ratio (M‐H, Random, 95% CI) | 0.71 [0.43, 1.17] |
| 11 Death: 1. Any cause Show forest plot | 6 | 980 | Risk Ratio (M‐H, Random, 95% CI) | 0.88 [0.37, 2.07] |
| 12 Death: 2. By cause Show forest plot | 6 | Risk Ratio (M‐H, Random, 95% CI) | Subtotals only | |
| 12.1 natural causes | 6 | 980 | Risk Ratio (M‐H, Random, 95% CI) | 0.63 [0.18, 2.24] |
| 12.2 suicide or death in suspicious circumstances | 6 | 980 | Risk Ratio (M‐H, Random, 95% CI) | 1.06 [0.36, 3.11] |
| 13 Harm to self or others Show forest plot | 5 | Risk Ratio (M‐H, Random, 95% CI) | Subtotals only | |
| 13.1 attempted suicide | 3 | 369 | Risk Ratio (M‐H, Random, 95% CI) | 2.62 [0.21, 32.02] |
| 13.2 homicide | 3 | 568 | Risk Ratio (M‐H, Random, 95% CI) | 2.96 [0.31, 28.28] |
| 14 Global state: 1. GAS (endpoint score, range 1‐100, low=poor) (loss in some cases is greater than 30%) Show forest plot | 2 | Mean Difference (IV, Random, 95% CI) | Subtotals only | |
| 14.1 By 3 months | 1 | 27 | Mean Difference (IV, Random, 95% CI) | 0.0 [‐12.82, 12.82] |
| 14.2 by 6 months | 1 | 129 | Mean Difference (IV, Random, 95% CI) | 5.10 [‐0.86, 11.06] |
| 14.3 by 12 months | 1 | 131 | Mean Difference (IV, Random, 95% CI) | 3.5 [‐3.15, 10.15] |
| 14.4 by 20 months | 1 | 142 | Mean Difference (IV, Random, 95% CI) | 5.70 [‐0.26, 11.66] |
| 15 Global state: 2. SAS (endpoint score, high=poor) (loss in some cases in greater than 30%) Show forest plot | 1 | Mean Difference (IV, Random, 95% CI) | Subtotals only | |
| 15.1 by 6 months | 1 | 130 | Mean Difference (IV, Random, 95% CI) | ‐0.20 [‐0.75, 0.35] |
| 15.2 by 12 months | 1 | 120 | Mean Difference (IV, Random, 95% CI) | ‐0.30 [‐0.85, 0.25] |
| 15.3 by 20 months | 1 | 139 | Mean Difference (IV, Random, 95% CI) | ‐0.60 [‐1.15, ‐0.05] |
| 16 Global state: 3. GAS scale change data by 3 months (+ve change=good, data likely to be skewed) Show forest plot | 2 | 156 | Mean Difference (IV, Random, 95% CI) | 4.17 [‐1.56, 9.89] |
| 17 Global state: 4. SAS change data by 3 months (‐ve change=good, data likely to be skewed) Show forest plot | 1 | 127 | Mean Difference (IV, Random, 95% CI) | ‐0.09 [‐0.31, 0.13] |
| 18 Mental state ‐ general: 1. Unwell by 12 months Show forest plot | 1 | 120 | Risk Ratio (M‐H, Random, 95% CI) | 0.65 [0.40, 1.07] |
| 19 Mental state ‐ general: 2. BPRS (endpoint score, range 24‐168, high=poor) (loss in standard group >30% for 6 months or more) Show forest plot | 3 | Mean Difference (IV, Random, 95% CI) | Subtotals only | |
| 19.1 by 3 months | 2 | 248 | Mean Difference (IV, Random, 95% CI) | ‐4.03 [‐8.18, 0.12] |
| 19.2 by 6 months | 1 | 129 | Mean Difference (IV, Random, 95% CI) | ‐2.10 [‐6.40, 2.20] |
| 19.3 by 12 months | 1 | 131 | Mean Difference (IV, Random, 95% CI) | ‐2.0 [‐6.03, 2.03] |
| 19.4 by 20 months | 1 | 142 | Mean Difference (IV, Random, 95% CI) | ‐4.5 [‐8.68, ‐0.32] |
| 20 Mental state ‐ general: 3. PEF (endpoint score, range 0‐5, high=poor) (loss is greater than 30%) Show forest plot | 1 | Mean Difference (IV, Random, 95% CI) | Subtotals only | |
| 20.1 by 3 months | 1 | 118 | Mean Difference (IV, Random, 95% CI) | 0.20 [‐0.22, 0.62] |
| 20.2 by 6 months | 1 | 111 | Mean Difference (IV, Random, 95% CI) | 0.10 [‐0.42, 0.62] |
| 20.3 by 12 months | 1 | 97 | Mean Difference (IV, Random, 95% CI) | ‐0.40 [‐0.84, 0.04] |
| 20.4 by 20 months | 1 | 100 | Mean Difference (IV, Random, 95% CI) | 0.10 [‐0.47, 0.67] |
| 21 Mental state ‐ general: 4. PSE (endpoint score, high score=poor, data likely to be skewed) Show forest plot | Other data | No numeric data | ||
| 21.1 by 6 months | Other data | No numeric data | ||
| 21.2 by 12 months | Other data | No numeric data | ||
| 21.3 by 20 months | Other data | No numeric data | ||
| 22 Mental state ‐ general: 5. BPRS scale change data by 3 months (‐ve change=good, data likely to be skewed) Show forest plot | 1 | 129 | Mean Difference (IV, Random, 95% CI) | ‐3.5 [‐8.92, 1.92] |
| 23 Mental state ‐ general: 6. PSE scale change data by 3 months (‐ve change=good, data likely to be skewed). Show forest plot | 1 | 129 | Mean Difference (IV, Random, 95% CI) | ‐2.70 [‐7.69, 2.29] |
| 24 Mental state: general PANSS (endpoint score, range 30‐210, high=poor) Show forest plot | 1 | 111 | Mean Difference (IV, Fixed, 95% CI) | 4.0 [‐3.45, 11.45] |
| 24.1 By 6 months | 1 | 111 | Mean Difference (IV, Fixed, 95% CI) | 4.0 [‐3.45, 11.45] |
| 25 Mental state ‐ specific: 1. Unsociable (reported by relatives) Show forest plot | 1 | Risk Ratio (M‐H, Random, 95% CI) | Subtotals only | |
| 25.1 by 3 months | 1 | 120 | Risk Ratio (M‐H, Random, 95% CI) | 0.86 [0.66, 1.12] |
| 25.2 by 6 months | 1 | 120 | Risk Ratio (M‐H, Random, 95% CI) | 0.43 [0.30, 0.64] |
| 26 Mental state ‐ specific: 2. Aggression (reported by relatives) Show forest plot | 1 | Risk Ratio (M‐H, Random, 95% CI) | Subtotals only | |
| 26.1 by 3 months | 1 | 120 | Risk Ratio (M‐H, Random, 95% CI) | 0.97 [0.72, 1.31] |
| 26.2 by 6 months | 1 | 120 | Risk Ratio (M‐H, Random, 95% CI) | 0.7 [0.39, 1.25] |
| 27 Mental state ‐ specific: 3. Various problems at 4 months (reported by relatives) Show forest plot | 1 | Risk Ratio (M‐H, Random, 95% CI) | Subtotals only | |
| 27.1 agitation | 1 | 120 | Risk Ratio (M‐H, Random, 95% CI) | 0.59 [0.36, 0.95] |
| 27.2 depression | 1 | 120 | Risk Ratio (M‐H, Random, 95% CI) | 0.8 [0.57, 1.13] |
| 27.3 disorientation | 1 | 120 | Risk Ratio (M‐H, Random, 95% CI) | 0.47 [0.28, 0.79] |
| 27.4 psychotic behaviour | 1 | 120 | Risk Ratio (M‐H, Random, 95% CI) | 0.58 [0.30, 1.11] |
| 27.5 substance abuse | 1 | 120 | Risk Ratio (M‐H, Random, 95% CI) | 0.67 [0.33, 1.36] |
| 27.6 withdrawal | 1 | 120 | Risk Ratio (M‐H, Random, 95% CI) | 0.72 [0.48, 1.07] |
| 28 Burden ‐ family: 1. Disruption to daily routine Show forest plot | 2 | Risk Ratio (M‐H, Random, 95% CI) | Subtotals only | |
| 28.1 by 3 months | 2 | 220 | Risk Ratio (M‐H, Random, 95% CI) | 0.76 [0.59, 0.97] |
| 28.2 by 6 months | 2 | 220 | Risk Ratio (M‐H, Random, 95% CI) | 0.67 [0.37, 1.21] |
| 29 Burden ‐ family: 2. Disruption to social life Show forest plot | 2 | Risk Ratio (M‐H, Random, 95% CI) | Subtotals only | |
| 29.1 by 3 months | 2 | 220 | Risk Ratio (M‐H, Random, 95% CI) | 0.69 [0.53, 0.91] |
| 29.2 by 6 months | 2 | 220 | Risk Ratio (M‐H, Random, 95% CI) | 0.72 [0.43, 1.22] |
| 30 Burden ‐ family: 3. Financial strain Show forest plot | 1 | Risk Ratio (M‐H, Random, 95% CI) | Subtotals only | |
| 30.1 by 3 months | 1 | 120 | Risk Ratio (M‐H, Random, 95% CI) | 0.76 [0.52, 1.10] |
| 30.2 by 6 months | 1 | 120 | Risk Ratio (M‐H, Random, 95% CI) | 0.84 [0.53, 1.33] |
| 31 Burden ‐ family: 4. Physical illness due to patient's illness Show forest plot | 1 | Risk Ratio (M‐H, Random, 95% CI) | Subtotals only | |
| 31.1 by 3 months | 1 | 100 | Risk Ratio (M‐H, Random, 95% CI) | 0.78 [0.65, 0.95] |
| 31.2 by 6 months | 1 | 100 | Risk Ratio (M‐H, Random, 95% CI) | 0.71 [0.55, 0.92] |
| 32 Burden ‐ family: 5. Overall burden is great Show forest plot | 1 | Risk Ratio (M‐H, Random, 95% CI) | Subtotals only | |
| 32.1 by 3 months | 1 | 120 | Risk Ratio (M‐H, Random, 95% CI) | 0.57 [0.41, 0.80] |
| 32.2 by 6 months | 1 | 120 | Risk Ratio (M‐H, Random, 95% CI) | 0.34 [0.20, 0.59] |
| 33 Burden ‐ community: 1. Not employed by 20 months Show forest plot | 1 | 189 | Risk Ratio (M‐H, Random, 95% CI) | 0.97 [0.85, 1.12] |
| 34 Burden ‐ community: 1a. In paid work by 6 months Show forest plot | 1 | 112 | Risk Ratio (M‐H, Random, 95% CI) | 1.41 [0.65, 3.04] |
| 34.1 By 6 months | 1 | 112 | Risk Ratio (M‐H, Random, 95% CI) | 1.41 [0.65, 3.04] |
| 35 Burden ‐ community: 2. Various outcomes by 12 months Show forest plot | 1 | Risk Ratio (M‐H, Random, 95% CI) | Subtotals only | |
| 35.1 at least one arrest | 1 | 120 | Risk Ratio (M‐H, Random, 95% CI) | 0.71 [0.46, 1.12] |
| 35.2 at least one use of emergency services | 1 | 120 | Risk Ratio (M‐H, Random, 95% CI) | 0.81 [0.43, 1.54] |
| 36 Burden ‐ community: 3. Arrested Show forest plot | 1 | 111 | Risk Ratio (M‐H, Random, 95% CI) | 5.36 [0.28, 101.35] |
| 36.1 By 6 months | 1 | 111 | Risk Ratio (M‐H, Random, 95% CI) | 5.36 [0.28, 101.35] |
| 37 Burden ‐ community: 4. Homelessness Show forest plot | 1 | 113 | Risk Ratio (M‐H, Random, 95% CI) | 1.23 [0.59, 2.57] |
| 37.1 By 6 months | 1 | 113 | Risk Ratio (M‐H, Random, 95% CI) | 1.23 [0.59, 2.57] |
| 38 Satisfaction ‐ patient: 1. Various outcomes by 12 months Show forest plot | 1 | Risk Ratio (M‐H, Random, 95% CI) | Subtotals only | |
| 38.1 feels unimproved | 1 | 119 | Risk Ratio (M‐H, Random, 95% CI) | 0.48 [0.31, 0.74] |
| 38.2 dissatisfied with treatment received | 1 | 119 | Risk Ratio (M‐H, Random, 95% CI) | 0.66 [0.50, 0.88] |
| 38.3 prefered to get other treatment | 1 | 119 | Risk Ratio (M‐H, Random, 95% CI) | 0.46 [0.27, 0.77] |
| 38.4 feels less able to cope | 1 | 119 | Risk Ratio (M‐H, Random, 95% CI) | 0.36 [0.21, 0.62] |
| 38.5 feels will need more help outside working hours in the future | 1 | 119 | Risk Ratio (M‐H, Random, 95% CI) | 1.48 [0.88, 2.48] |
| 39 Satisfaction ‐ patient: 2. Patient satisitfied with care: Satisfaction Scale (endpoint score, range 0 ‐32, low=poor) Show forest plot | 2 | Mean Difference (IV, Random, 95% CI) | Subtotals only | |
| 39.1 by 3 months | 1 | 226 | Mean Difference (IV, Random, 95% CI) | 1.60 [‐0.22, 3.42] |
| 39.2 by 6 months | 1 | 115 | Mean Difference (IV, Random, 95% CI) | 5.10 [3.16, 7.04] |
| 39.3 by 12 months | 1 | 121 | Mean Difference (IV, Random, 95% CI) | 4.80 [3.11, 6.49] |
| 39.4 by 20 months | 1 | 137 | Mean Difference (IV, Random, 95% CI) | 5.40 [3.91, 6.89] |
| 40 Satisfaction: Patient: 3. VSSS Scale (low=poor) Show forest plot | 1 | 24 | Mean Difference (IV, Random, 95% CI) | 0.20 [‐0.20, 0.60] |
| 41 Satisfaction ‐ relatives: 1. Feels patient is not improved Show forest plot | 1 | Risk Ratio (M‐H, Random, 95% CI) | Subtotals only | |
| 41.1 by 3 months | 1 | 120 | Risk Ratio (M‐H, Random, 95% CI) | 0.79 [0.60, 1.04] |
| 41.2 by 6 months | 1 | 120 | Risk Ratio (M‐H, Random, 95% CI) | 0.71 [0.53, 0.97] |
| 42 Satisfaction ‐ relatives: 4. Various outcomes by 12 months Show forest plot | 1 | Risk Ratio (M‐H, Random, 95% CI) | Subtotals only | |
| 42.1 feel themselves less able to cope | 1 | 120 | Risk Ratio (M‐H, Random, 95% CI) | 0.57 [0.42, 0.78] |
| 42.2 feel themsleves to need more help outside working hours in the future | 1 | 120 | Risk Ratio (M‐H, Random, 95% CI) | 1.21 [0.91, 1.60] |
| 43 Satisfaction ‐ relatives: 3. Would have preferred patient to have received other treatment Show forest plot | 1 | Risk Ratio (M‐H, Random, 95% CI) | Subtotals only | |
| 43.1 by 3 months | 1 | 120 | Risk Ratio (M‐H, Random, 95% CI) | 1.27 [0.63, 2.57] |
| 43.2 by 6 months | 1 | 120 | Risk Ratio (M‐H, Random, 95% CI) | 1.11 [0.49, 2.54] |
| 43.3 by 12 months | 1 | 120 | Risk Ratio (M‐H, Random, 95% CI) | 0.81 [0.43, 1.54] |
| 44 Satisfaction ‐ relatives: 2. Dissatisfied with treatment received Show forest plot | 1 | Risk Ratio (M‐H, Random, 95% CI) | Subtotals only | |
| 44.1 by 3 months | 1 | 120 | Risk Ratio (M‐H, Random, 95% CI) | 0.63 [0.44, 0.89] |
| 44.2 by 6 months | 1 | 120 | Risk Ratio (M‐H, Random, 95% CI) | 0.57 [0.42, 0.78] |
| 44.3 by 12 months | 1 | 120 | Risk Ratio (M‐H, Random, 95% CI) | 0.46 [0.29, 0.72] |
| 45 Economic cost per patient (data likely to be skewed) Show forest plot | Other data | No numeric data | ||
| 45.1 total cost for trial period ‐ as assessed by researchers | Other data | No numeric data | ||
| 45.2 total cost for trial period ‐ as assessed by finance department | Other data | No numeric data | ||
| 45.3 per week | Other data | No numeric data | ||
| 46 Quality of Life MANSA patient endpoint score, range 0 ‐ 88, low=poor Show forest plot | 1 | 226 | Mean Difference (IV, Random, 95% CI) | ‐1.5 [‐5.15, 2.15] |
| 47 Quality of Life MANSA‐short form patient endpoint score, low=poor Show forest plot | 1 | 28 | Mean Difference (IV, Random, 95% CI) | 0.70 [0.14, 1.26] |
| 48 Quality of life: EQ‐5D range 0 to 1, low=poor Show forest plot | 1 | 26 | Mean Difference (IV, Fixed, 95% CI) | 0.01 [‐0.32, 0.34] |
| 48.1 By 3 months | 1 | 26 | Mean Difference (IV, Fixed, 95% CI) | 0.01 [‐0.32, 0.34] |
| 49 Social contacts Show forest plot | 1 | 107 | Mean Difference (IV, Random, 95% CI) | 0.43 [‐0.30, 1.16] |
| 49.1 By 6 months | 1 | 107 | Mean Difference (IV, Random, 95% CI) | 0.43 [‐0.30, 1.16] |
| 50 Social functioning: LSP‐staff endpoint score, range 0‐156, low=poor Show forest plot | 1 | Mean Difference (IV, Random, 95% CI) | Subtotals only | |
| 50.1 by 3 months | 1 | 260 | Mean Difference (IV, Random, 95% CI) | 3.0 [‐0.72, 6.72] |
| 50.2 by 6 months | 1 | 260 | Mean Difference (IV, Random, 95% CI) | 1.0 [‐2.76, 4.76] |
| 51 Clinical and social problems HoNOS ‐ staff endpoint score, range 0‐48, high=poor Show forest plot | 1 | Mean Difference (IV, Random, 95% CI) | Subtotals only | |
| 51.1 by 3 months | 1 | 257 | Mean Difference (IV, Random, 95% CI) | ‐1.90 [‐3.20, ‐0.60] |
| 51.2 by 6 months | 1 | 255 | Mean Difference (IV, Random, 95% CI) | ‐0.60 [‐2.07, 0.87] |
| 52 Unmet needs: CAN scale range 0‐22, high=poor Show forest plot | Other data | No numeric data | ||