Intervención para las crisis en personas con enfermedades mentales graves
Appendices
Appendix 1. Previous search strategies
1.1 Search in 1998
1.1.1 Biological Abstracts on Silver Platter (1985 to February 1998)
Using the Cochrane Schizophrenia Group's terms for randomised controlled trials and the Cochrane Schizophrenia Group's terms for schizophrenia combined with the phrase:
[and (acute or cris* or emergenc* or intensiv* or mobile or outreach or (time near2 limit* or commun* or home)) near3 (care* or interven* or treat* or therap* or management* or model* or programm* or team* or service* or base*) or (hospital* near3 (diversion or alternative*))]
1.1.2 CINAHL on Silver Platter (1982 to February 1998)
Using the Cochrane Schizophrenia Group's terms for randomised controlled trials and the Cochrane Schizophrenia Group's terms for schizophrenia combined with the phrase:
[and (acute or cris* or emergenc* or intensiv* or mobile or outreach or (time near2 limit* or commun* or home)) near3 (care* or interven* or treat* or therap* or management* or model* or programm* or team* or service* or base*) or (hospital* near3 (diversion or alternative*)) or explode "CRISIS‐INTERVENTION"/ all topical subheadings / all age subheadings or explode "CRISIS‐THEORY"/ all topical subheadings / all age subheadings or explode "COMMUNITY‐PROGRAMS"/ all topical subheadings / all age subheadings explode "COMMUNITY‐MENTAL‐HEALTH‐NURSING"/ all topical subheadings / all age subheadings or explode "COMMUNITY‐TRIALS"/ all topical subheadings / all age subheadings or explode "COMMUNITY‐MENTAL HEALTH SERVICES"/ all topical subheadings / all age subheadings or explode "COMMUNITY‐SERVICE"/ all topical subheadings / all age subheadings or explode "PSYCHIATRIC‐HOME‐CARE"/ all topical subheadings / all age subheadings or "PSYCHIATRIC‐EMERGENCIES"/ all topical subheadings / all age subheadings or explode "MOBILE‐HEALTH‐UNITS"/ all topical subheadings / all age subheadings]
1.1.3 The Cochrane Library (Issue 3, 1998)
Using the Cochrane Schizophrenia Group's terms for schizophrenia combined with the phrase:
[and (acute or cris* or emergenc* or intensiv* or mobile or outreach or (time near limit* or commun* or home)) and (care* or interven* or treat* or therap* or management* or model* or programm* or team* or service* or base*) or (hospital* near diversion) or (hospital* near alternative*) or explode "CRISIS‐INTERVENTION"/ all subheadings or explode "COMMUNITY‐MENTAL‐HEALTH‐SERVICES"/ all subheadings or explode "COMMUNITY‐INSTITUTIONAL‐RELATIONS"/ all subheadings or explode "COMMUNITY‐PSYCHIATRY"/ all subheadings or explode "HOME‐CARE‐SERVICES"/ all subheadings or explode "MOBILE‐HEALTH‐UNITS"/ all subheadings or "EMERGENCY‐SERVICES,‐PSYCHIATRIC"/ all subheadings]
1.1.4 EMBASE (January 1980 to February 1998)
Using the Cochrane Schizophrenia Group's terms for randomised controlled trials and the CSGs' terms for schizophrenia combined with the phrase:
[and (acute or cris* or emergenc* or intensiv* or mobile or outreach or (time near2 limit* or commun* or home)) near3 (care* or interven* or treat* or therap* or management* or model* or programm* or team* or service* or base*) or (hospital* near3 (diversion or alternative*)) or explode "COMMUNITY‐CARE"/ all subheadings or explode "COMMUNITY‐MENTAL‐HEALTH/ all subheadings or explode "CRISIS‐INTERVENTION"/ all subheadings or explode "HOME‐CARE"/ all subheadings or "EMERGENCY‐HEALTH‐SERVICE"/ all subheadings or explode "PREVENTIVE‐HEALTH‐SERVICE"/ all subheadings or explode "SOCIAL‐PSYCHIATRY"/ all subheadings]
1.1.5 MEDLINE on Silver Platter (January 1966 to February 1998)
Using the Cochrane Schizophrenia Group's terms for randomised controlled trials and the Cochrane Schizophrenia Group's terms for schizophrenia combined with the phrase:
[and (acute or cris* or emergenc* or intensiv* or mobile or outreach or (time near2 limit* or commun* or home)) near3 (care* or interven* or treat* or therap* or management* or model* or programm* or team* or service* or base*) or (hospital* near3 (diversion or alternative*)) or explode "CRISIS‐INTERVENTION"/ all subheadings or explode "COMMUNITY‐MENTAL‐HEALTH‐SERVICES"/ all subheadings or explode "COMMUNITY‐INSTITUTIONAL‐RELATIONS"/ all subheadings or explode "COMMUNITY‐PSYCHIATRY"/ all subheadings or explode "HOME‐CARE‐SERVICES"/ all subheadings or explode "MOBILE‐HEALTH‐UNITS"/ all subheadings or "EMERGENCY‐SERVICES,‐PSYCHIATRIC"/ all subheadings]
1.1.6 PsycLIT on Silver Platter (January 1974 to February 1998)
Using the Cochrane Schizophrenia Group's terms for randomised controlled trials and the Cochrane Schizophrenia Group's terms for schizophrenia combined with the phrase:
[and (acute or cris* or emergenc* or intensiv* or mobile or outreach or (time near2 limit* or commun* or home)) near3 (care* or interven* or treat* or therap* or management* or model* or programm* or team* or service* or base*) or (hospital* near3 (diversion or alternative*)) or explode "CRISIS‐INTERVENTION" or explode "STRESS‐REACTIONS" or explode
"COMMUNITY‐MENTAL‐HEALTH‐SERVICES" or explode "COMMUNITY‐PSYCHIATRY"
or explode "HOME‐VISITING‐PROGRAMS" or explode "PARTIAL‐HOSPITALIZATION"
or explode "PSYCHIATRIC‐HOSPITAL‐READMISSION" or explode "EMERGENCY‐SERVICES"]
1.1.7 Sociofile on Silver Platter (1974 to February 1998)
Using the Cochrane Schizophrenia Group's terms for randomised controlled trials and the Cochrane Schizophrenia Group's terms for schizophrenia combined with the phrase:
[and (acute or cris* or emergenc* or intensiv* or mobile or outreach or (time near2 limit* or commun* or home)) near3 (care* or interven* or treat* or therap* or management* or model* or programm* or team* or service* or base*) or (hospital* near3 (diversion or alternative*)) or explode "CRISIS‐INTERVENTION" or "COMMUNITY‐MENTAL‐HEALTH" IN DE or "EMERGENCY‐MEDICAL‐SERVICES" IN DE or explode "OUTREACH‐PROGRAMS"]
We inspected all citations identified in this way for additional terms, and if found these will be added to the above searches and the process repeated.
1.2 Search in 2003 and 2006
1.2.1 Cochrane Schizophrenia Group's Register
[and (acute or cris* or emergenc* or intensiv* or mobile or outreach or (time and limit*) or commun* or home) and (care* or interven* or treat* or therap* or management* or model* or programm* or team* or service* or base*) or hospital* and (diversion or alternative*)]
1.2.2 Reference searching
We inspected all citations of newly identified studies for more new relevant trials.
1.3 Search in 2010
1.3.1 Electronic searching
Cochrane Schizophrenia Group Trials Register (March 2010)
The register was searched using the phrase:
[(acute* or cris?s* or emergenc* or intensiv* or mobile* or outreach* or (time* and limit*) or commun* or home*) and (* care* or interven* or treat* or therap* or managem* or model* or programm* or team* or service* or base*) * or hospital* and (diversion* or alternative*) in title and *acute* or *cris?s* or *emergenc* or *intensiv* or *mobile* or *outreach* or * (time and limit*) or *commun* or *home*) and (*care* or *interven* or *treat* or *therap* or *managem* or *model* or *programm* or *team* or *service* or *base*) * or *hospital* and (diversion* or *alternative*) in title, abstract or Index terms of REFERENCE) or (brief Hosp* OR community mental health service, I* OR community resid* OR crisis* OR critical time int* OR district psychiatric c* OR *brief intensive* in interventions of STUDY field)]
This register is compiled by systematic searches of major databases, handsearches and conference proceedings (see Group's Module)
1.3.2 Searching other resources
1.3.2.1 Reference searching
We inspected references of all identified studies for further relevant studies.
1.3.2.2 Personal contact
We contacted the first author of each included study for information regarding unpublished trials.
Appendix 2. Previous data collection section
1. Study selection
CJ inspected all reports of studies identified as above. A randomly selected (computer‐generated list) sample of 10% of all reports was re‐inspected by KR in order to allow selection to be reliable. We resolved disagreement by discussion, and if there was still doubt, the full article was acquired for further inspection. Once we obtained the full articles, we independently decided whether the studies met the review criteria. KR was blinded to the names of the authors, institutions and journal of publication. If we disagreed, these trials were added to the list of those awaiting assessment pending acquisition of further information. For the 2003 and 2006 update CJ inspected all reports identified in the new search. Randomly selected samples of 10% of all new reports were re‐inspected by KR. Again, once full reports were obtained, CJ, CEA and KR resolved disputes over whether studies meet inclusion criteria by discussion. For the 2010 update, SM inspected all citations from the searches and identified relevant abstracts. As only seven studies met the review criteria, 100% of these were checked by RD. Full articles were viewed independently to decide on whether they met review criteria. CI and CA resolved disputes by discussion
2. Quality assessment
We allocated trials to three quality categories, as described in the Cochrane Collaboration Handbook (Higgins 2005). When disputes arose as to which category a trial was allocated, we again attempted resolution by discussion. When this was not possible and further information was necessary to clarify into which category to which to allocate the trial, we did not enter the data and the trial was allocated to the list of those awaiting assessment. We included trials only if they were in Category A or B.
3. Data management
3. 1 Data extraction
We independently extracted data from selected trials. When disputes arose we attempted resolution by discussion. When this was not possible and further information was necessary to resolve the dilemma, we did not enter data and added the trial to the list of those awaiting assessment. For the 2003 and 2006 updates, CJ extracted data and KR checked a random sample of data. For the 2010 update, SM extracted data and RD checked all of this data.
3.2 Intention‐to‐treat analysis
For this review, we excluded both binary and continuous data from studies where more than 30% of participants in any group were lost to follow‐up.
In studies with less than 30% drop‐out rate, we considered people leaving the study early to have a negative outcome (except for the event of death). For continuous, summary data it is not possible to include such an assumption so we presented non intention‐to‐treat data for these outcomes.
4. Data analysis
4.1 Binary data
For binary outcomes, we calculated the random‐effects risk ratio (RR) and its 95% confidence interval (CI). If the relative risk was statistically significant, we also calculated the number needed to treat/harm statistic (NNT/H) using StatsDirect Statistical Software (Buchan 2001).
4.2 Continuous data
4.2.1 Skewed data: continuous data on clinical and social outcomes are often not normally distributed. To avoid the pitfall of applying parametric tests to non‐parametric data we applied the following standards to all data before inclusion: (a) standard deviations and means were reported in the paper or were obtainable from the authors; (b) when a scale starts from a finite number (such as zero), the standard deviation, when multiplied by two, was less than the mean (as otherwise the mean was unlikely to be an appropriate measure of the centre of the distribution ‐ Altman 1996). Endpoint scores on scales often have a finite start and end point and this rule can be applied to them.
4.2.2 Summary statistic: for continuous outcomes, we estimated a weighted mean difference (WMD) between groups. Again, if heterogeneity was found (see section 5) we used a random‐effects model.
4.2.3 Valid scales: we only included continuous data from rating scales that had been described in a peer‐reviewed journal and/or the scale was either a self‐report or completed by an independent rater or relative (not the therapist). Unpublished instruments are more likely to report statistically significant findings than those that have been peer reviewed and published (Marshall 2000).
4.2.4 Endpoint versus change data: where possible we presented endpoint data. If both endpoint and change data were available for the same outcomes then we only reported the former.
4.2.5 Cluster trials: studies increasingly employ 'cluster randomisation' (such as randomisation by clinician or practice) but analysis and pooling of clustered data poses problems. Firstly, authors often fail to account for intra class correlation in clustered studies, leading to a 'unit of analysis' error (Divine 1992) whereby P values are spuriously low, confidence intervals unduly narrow and statistical significance overestimated. This causes type I errors (Bland 1997; Gulliford 1999).
Where clustering was not accounted for in primary studies, we presented the data in a table, with a (*) symbol to indicate the presence of a probable unit of analysis error. In subsequent versions of this review we will seek to contact first authors of studies to obtain intra‐class correlation co‐efficients of their clustered data and to adjust for these using accepted methods (Gulliford 1999). Where clustering has been incorporated into the analysis of primary studies, we will also present these data as if from a non‐cluster randomised study, but adjusted for the clustering effect.
We have sought statistical advice and have been advised that the binary data as presented in a report should be divided by a 'design effect'. This is calculated using the mean number of participants per cluster (m) and the intraclass correlation co‐efficient (ICC) [Design effect=1+(m‐1)*ICC] (Donner 2002). If the ICC was not reported it was assumed to be 0.1 (Ukoumunne 1999).
If cluster studies had been appropriately analysed taking into account intra‐class correlation coefficients and relevant data documented in the report, synthesis with other studies would have been possible using the generic inverse variance technique.
5. Investigation for heterogeneity
Firstly, consideration of all the included studies within any comparison was undertaken to judge clinical heterogeneity. Then we visually inspected graphs to investigate the possibility of statistical heterogeneity. This was supplemented using, primarily, the I‐squared statistic. This provides an estimate of the percentage of variability due to heterogeneity rather than chance alone. Where the I‐squared estimate was greater than or equal to 75%, we interpreted this as indicating the presence of high levels of heterogeneity (Higgins 2003). If inconsistency was high, data were not summated, but presented separately and reasons for heterogeneity investigated.
6. Addressing publication bias
We entered data from all included studies into a funnel graph (trial effect against trial size) in an attempt to investigate the likelihood of overt publication bias (Egger 1997).
7.Sensitivity analyses
The effect of including studies with high attrition rates was analysed in a sensitivity analysis.
8. General
Where possible, we entered data in such a way that the area to the left of the line of no effect indicated a favourable outcome for crisis intervention.

Study flow diagram 2014 search
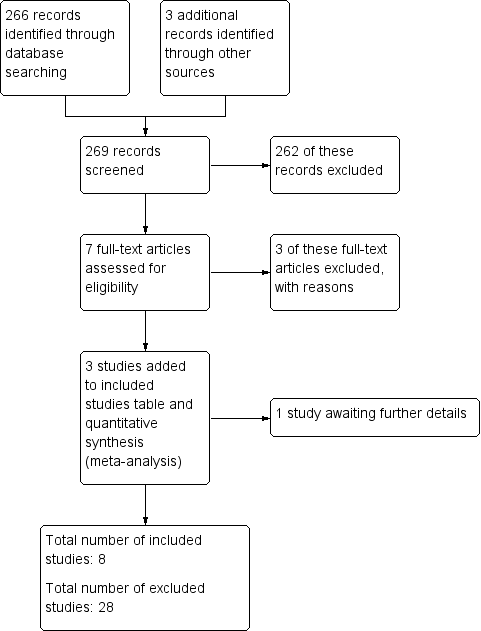
Study flow diagram (2010 UPDATE).
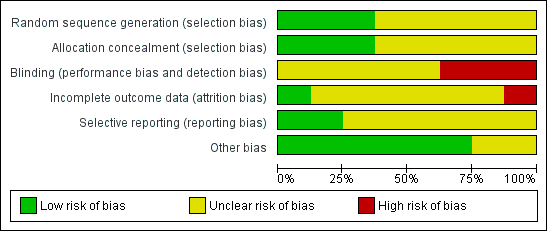
'Risk of bias' graph: review authors' judgements about each risk of bias item presented as percentages across all included studies.
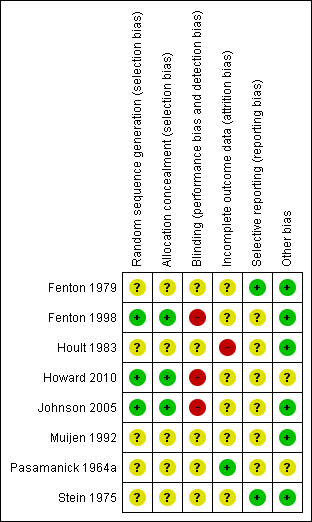
'Risk of bias' summary: review authors' judgements about each risk of bias item for each included study.
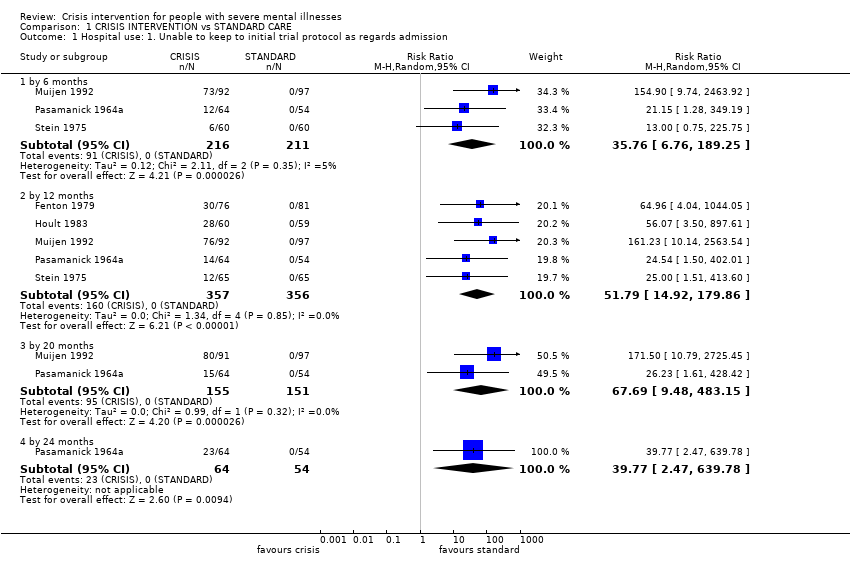
Comparison 1 CRISIS INTERVENTION vs STANDARD CARE, Outcome 1 Hospital use: 1. Unable to keep to initial trial protocol as regards admission.

Comparison 1 CRISIS INTERVENTION vs STANDARD CARE, Outcome 2 Hospital use: 2. Repeat admissions including index admission.
| Study | Interventions | Mean | SD | N | Notes |
| By 6 months | |||||
| Fenton 1998 | Crisis care | 1.30 | 1.88 | 63 | |
| Fenton 1998 | Standard care | 1.77 | 3.32 | 48 | |
Comparison 1 CRISIS INTERVENTION vs STANDARD CARE, Outcome 3 Hospital Use: 3. Number of repeat admissions per participant.

Comparison 1 CRISIS INTERVENTION vs STANDARD CARE, Outcome 4 Hospital use: 4. Repeat admissions excluding index admission.

Comparison 1 CRISIS INTERVENTION vs STANDARD CARE, Outcome 5 Hospital use: 5. Repeat admissions excluding index admission ‐ compulsory detentions only.
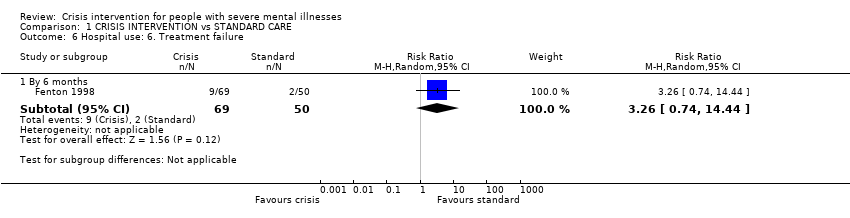
Comparison 1 CRISIS INTERVENTION vs STANDARD CARE, Outcome 6 Hospital use: 6. Treatment failure.

Comparison 1 CRISIS INTERVENTION vs STANDARD CARE, Outcome 7 Hospital use: 7. Days in acute care.
| Study | Interventions | Mean | SD | N | Notes |
| 6 ‐ 12 months | |||||
| Fenton 1979 | Crisis/home group | 2.1 | 3.4 | 76 | Difference favouring home group (two tailed t‐test, p=0.005) |
| Fenton 1979 | Standard care group | 6.3 | 12.3 | 79 | |
| by 12 months | |||||
| Fenton 1979 | Crisis/home group | 16.5 | 11.7 | 76 | No difference between the groups (two tailed t test p> 0.05) |
| Fenton 1979 | Standard care group | 13.0 | 19.2 | 79 | |
Comparison 1 CRISIS INTERVENTION vs STANDARD CARE, Outcome 8 Hospital use: 8. Home or outpatient visits (data likely to be skewed).

Comparison 1 CRISIS INTERVENTION vs STANDARD CARE, Outcome 9 Leaving the study early (unwilling or unable to provide infomation): 1. Patients.

Comparison 1 CRISIS INTERVENTION vs STANDARD CARE, Outcome 10 Leaving the study early (unwilling or unable to provide information) 2. Relatives.

Comparison 1 CRISIS INTERVENTION vs STANDARD CARE, Outcome 11 Death: 1. Any cause.

Comparison 1 CRISIS INTERVENTION vs STANDARD CARE, Outcome 12 Death: 2. By cause.

Comparison 1 CRISIS INTERVENTION vs STANDARD CARE, Outcome 13 Harm to self or others.

Comparison 1 CRISIS INTERVENTION vs STANDARD CARE, Outcome 14 Global state: 1. GAS (endpoint score, range 1‐100, low=poor) (loss in some cases is greater than 30%).

Comparison 1 CRISIS INTERVENTION vs STANDARD CARE, Outcome 15 Global state: 2. SAS (endpoint score, high=poor) (loss in some cases in greater than 30%).

Comparison 1 CRISIS INTERVENTION vs STANDARD CARE, Outcome 16 Global state: 3. GAS scale change data by 3 months (+ve change=good, data likely to be skewed).

Comparison 1 CRISIS INTERVENTION vs STANDARD CARE, Outcome 17 Global state: 4. SAS change data by 3 months (‐ve change=good, data likely to be skewed).
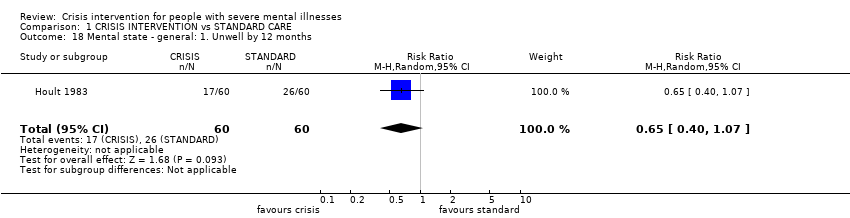
Comparison 1 CRISIS INTERVENTION vs STANDARD CARE, Outcome 18 Mental state ‐ general: 1. Unwell by 12 months.

Comparison 1 CRISIS INTERVENTION vs STANDARD CARE, Outcome 19 Mental state ‐ general: 2. BPRS (endpoint score, range 24‐168, high=poor) (loss in standard group >30% for 6 months or more).

Comparison 1 CRISIS INTERVENTION vs STANDARD CARE, Outcome 20 Mental state ‐ general: 3. PEF (endpoint score, range 0‐5, high=poor) (loss is greater than 30%).
| Study | Interventions | Mean | SD | N | Notes |
| by 6 months | |||||
| Muijen 1992 | Crisis group | 13.5 | 11.5 | 67 | No difference between groups (ANCOVA, p=not reported). |
| Muijen 1992 | Standard care group | 16.5 | 12.1 | 61 | |
| by 12 months | |||||
| Muijen 1992 | Crisis group | 11.8 | 12.0 | 64 | No difference between groups (ANCOVA, p=not reported). |
| Muijen 1992 | Standard care group | 13.8 | 14.4 | 64 | |
| by 20 months | |||||
| Muijen 1992 | Crisis group | 8.2 | 9.3 | 72 | Result not statistically significant (p=0.09) |
| Muijen 1992 | Standard care group | 12.2 | 15.0 | 70 | |
Comparison 1 CRISIS INTERVENTION vs STANDARD CARE, Outcome 21 Mental state ‐ general: 4. PSE (endpoint score, high score=poor, data likely to be skewed).

Comparison 1 CRISIS INTERVENTION vs STANDARD CARE, Outcome 22 Mental state ‐ general: 5. BPRS scale change data by 3 months (‐ve change=good, data likely to be skewed).

Comparison 1 CRISIS INTERVENTION vs STANDARD CARE, Outcome 23 Mental state ‐ general: 6. PSE scale change data by 3 months (‐ve change=good, data likely to be skewed)..

Comparison 1 CRISIS INTERVENTION vs STANDARD CARE, Outcome 24 Mental state: general PANSS (endpoint score, range 30‐210, high=poor).

Comparison 1 CRISIS INTERVENTION vs STANDARD CARE, Outcome 25 Mental state ‐ specific: 1. Unsociable (reported by relatives).
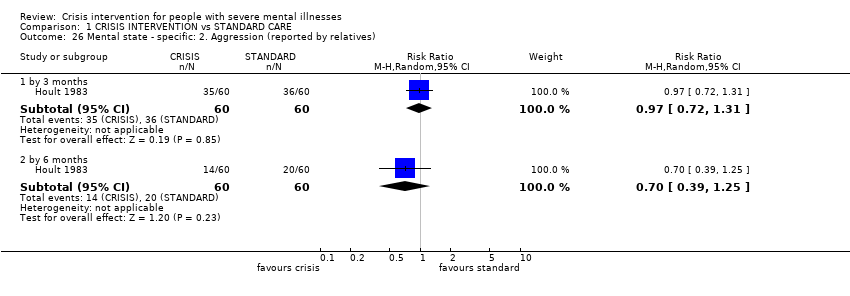
Comparison 1 CRISIS INTERVENTION vs STANDARD CARE, Outcome 26 Mental state ‐ specific: 2. Aggression (reported by relatives).
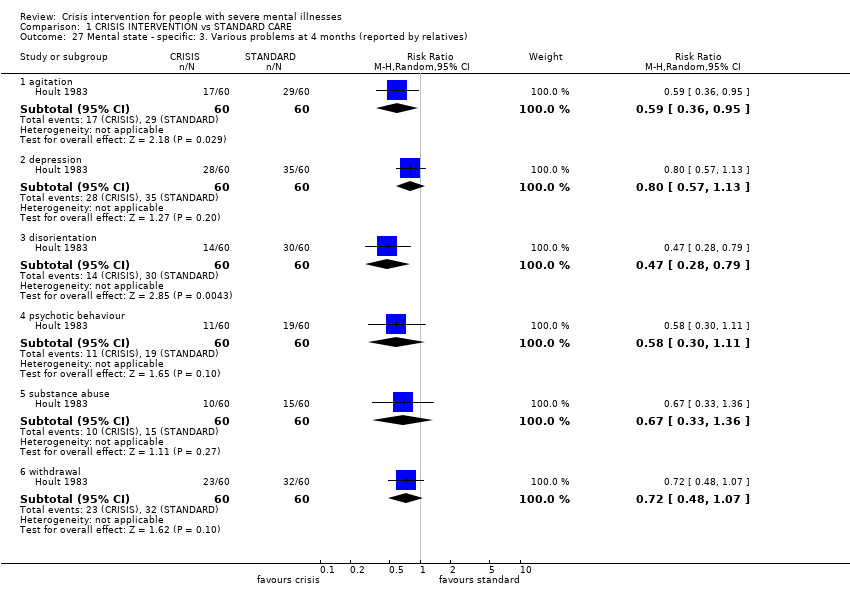
Comparison 1 CRISIS INTERVENTION vs STANDARD CARE, Outcome 27 Mental state ‐ specific: 3. Various problems at 4 months (reported by relatives).

Comparison 1 CRISIS INTERVENTION vs STANDARD CARE, Outcome 28 Burden ‐ family: 1. Disruption to daily routine.
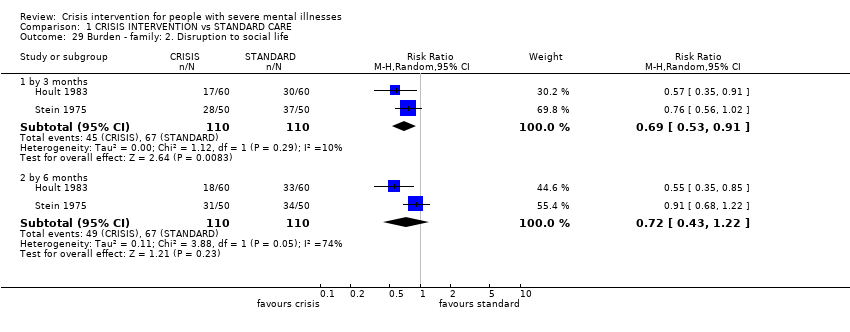
Comparison 1 CRISIS INTERVENTION vs STANDARD CARE, Outcome 29 Burden ‐ family: 2. Disruption to social life.
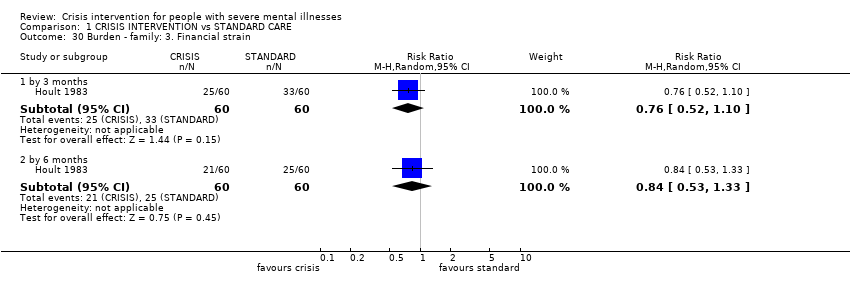
Comparison 1 CRISIS INTERVENTION vs STANDARD CARE, Outcome 30 Burden ‐ family: 3. Financial strain.

Comparison 1 CRISIS INTERVENTION vs STANDARD CARE, Outcome 31 Burden ‐ family: 4. Physical illness due to patient's illness.

Comparison 1 CRISIS INTERVENTION vs STANDARD CARE, Outcome 32 Burden ‐ family: 5. Overall burden is great.

Comparison 1 CRISIS INTERVENTION vs STANDARD CARE, Outcome 33 Burden ‐ community: 1. Not employed by 20 months.
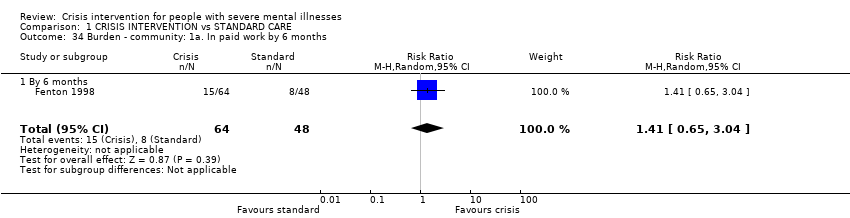
Comparison 1 CRISIS INTERVENTION vs STANDARD CARE, Outcome 34 Burden ‐ community: 1a. In paid work by 6 months.
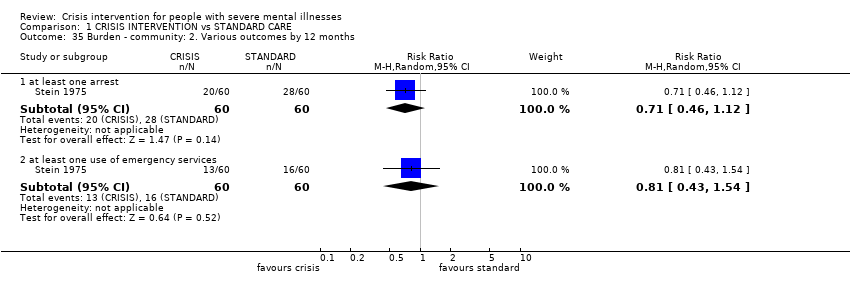
Comparison 1 CRISIS INTERVENTION vs STANDARD CARE, Outcome 35 Burden ‐ community: 2. Various outcomes by 12 months.
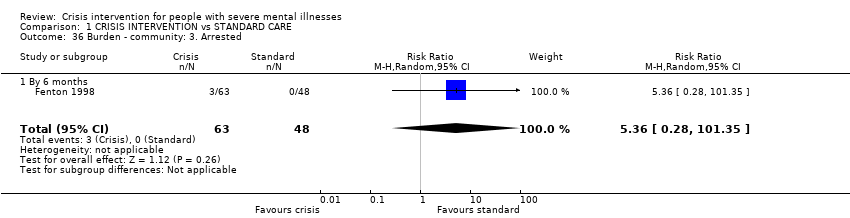
Comparison 1 CRISIS INTERVENTION vs STANDARD CARE, Outcome 36 Burden ‐ community: 3. Arrested.
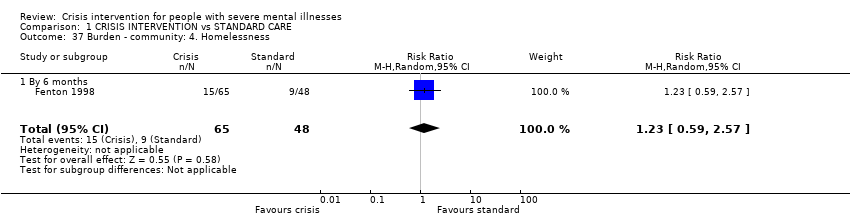
Comparison 1 CRISIS INTERVENTION vs STANDARD CARE, Outcome 37 Burden ‐ community: 4. Homelessness.

Comparison 1 CRISIS INTERVENTION vs STANDARD CARE, Outcome 38 Satisfaction ‐ patient: 1. Various outcomes by 12 months.
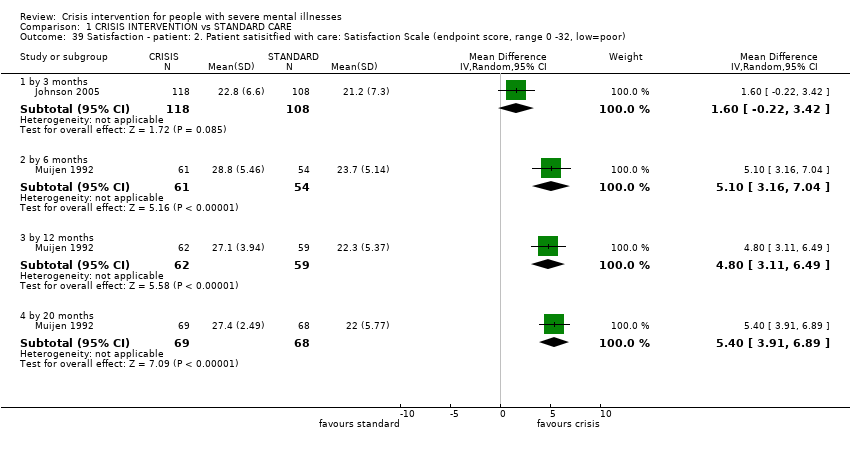
Comparison 1 CRISIS INTERVENTION vs STANDARD CARE, Outcome 39 Satisfaction ‐ patient: 2. Patient satisitfied with care: Satisfaction Scale (endpoint score, range 0 ‐32, low=poor).

Comparison 1 CRISIS INTERVENTION vs STANDARD CARE, Outcome 40 Satisfaction: Patient: 3. VSSS Scale (low=poor).

Comparison 1 CRISIS INTERVENTION vs STANDARD CARE, Outcome 41 Satisfaction ‐ relatives: 1. Feels patient is not improved.
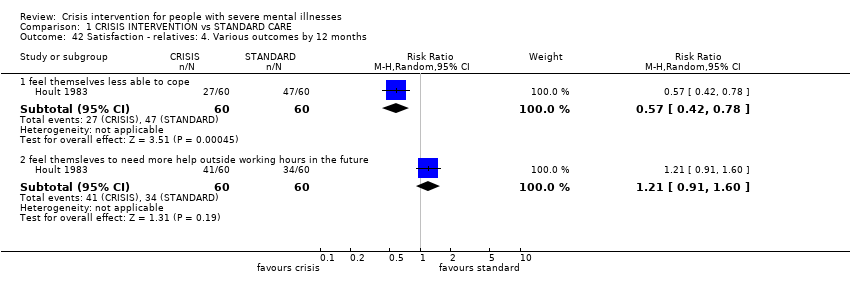
Comparison 1 CRISIS INTERVENTION vs STANDARD CARE, Outcome 42 Satisfaction ‐ relatives: 4. Various outcomes by 12 months.

Comparison 1 CRISIS INTERVENTION vs STANDARD CARE, Outcome 43 Satisfaction ‐ relatives: 3. Would have preferred patient to have received other treatment.

Comparison 1 CRISIS INTERVENTION vs STANDARD CARE, Outcome 44 Satisfaction ‐ relatives: 2. Dissatisfied with treatment received.
| Study | Interventions | Mean | SD | N | Notes |
| total cost for trial period ‐ as assessed by researchers | |||||
| Fenton 1979 | Crisis/home care group | $1980 | $1850 | 79 | Difference favouring home group stated (2 tailed t‐test p< 0.001) |
| Fenton 1979 | Standard care group | $3250 | $2410 | 76 | |
| total cost for trial period ‐ as assessed by finance department | |||||
| Fenton 1979 | Crisis/home care group | $3230 | $5120 | 79 | Difference favouring home group (2 tailed t‐test p=0.001) |
| Fenton 1979 | Standard care group | $6750 | $7180 | 76 | |
| per week | |||||
| Muijen 1992 | Crisis/home care group | £196 | £97 | 55 | Over 20 month trial period |
| Muijen 1992 | Standard care group | £358 | £241 | 48 | Difference favouring home group (p=0.000) |
Comparison 1 CRISIS INTERVENTION vs STANDARD CARE, Outcome 45 Economic cost per patient (data likely to be skewed).
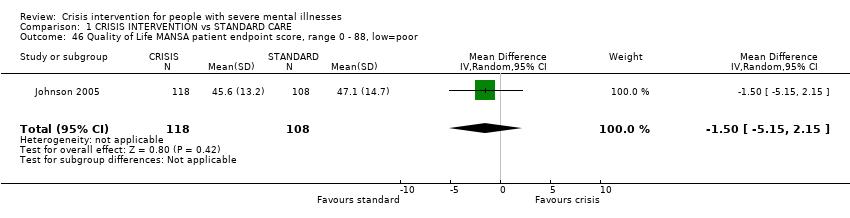
Comparison 1 CRISIS INTERVENTION vs STANDARD CARE, Outcome 46 Quality of Life MANSA patient endpoint score, range 0 ‐ 88, low=poor.
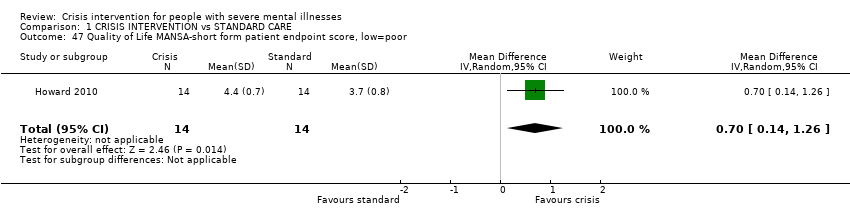
Comparison 1 CRISIS INTERVENTION vs STANDARD CARE, Outcome 47 Quality of Life MANSA‐short form patient endpoint score, low=poor.
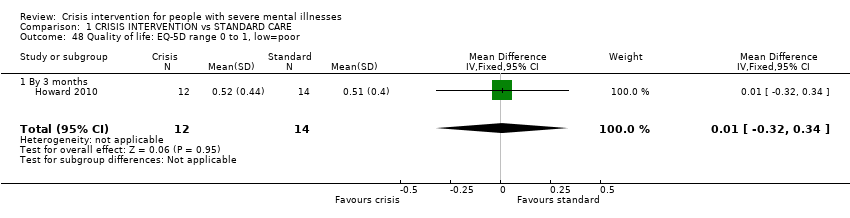
Comparison 1 CRISIS INTERVENTION vs STANDARD CARE, Outcome 48 Quality of life: EQ‐5D range 0 to 1, low=poor.

Comparison 1 CRISIS INTERVENTION vs STANDARD CARE, Outcome 49 Social contacts.
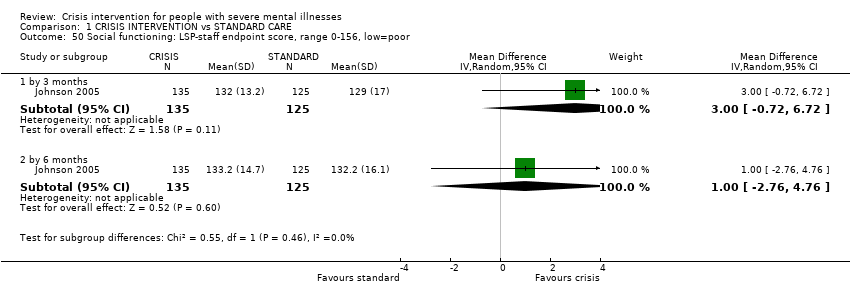
Comparison 1 CRISIS INTERVENTION vs STANDARD CARE, Outcome 50 Social functioning: LSP‐staff endpoint score, range 0‐156, low=poor.

Comparison 1 CRISIS INTERVENTION vs STANDARD CARE, Outcome 51 Clinical and social problems HoNOS ‐ staff endpoint score, range 0‐48, high=poor.
| Study | Interventions | Mean | SD | N | Notes |
| Howard 2010 | Crisis group | 4.1 | 2.4 | 13 | |
| Howard 2010 | Standard care group | 6.4 | 4.5 | 12 | |
Comparison 1 CRISIS INTERVENTION vs STANDARD CARE, Outcome 52 Unmet needs: CAN scale range 0‐22, high=poor.
| Methods | Allocation: randomised, with sequence generation and concealment of allocation clearly described. |
| Participants | Diagnosis: schizophrenia or related psychoses. |
| Interventions | 1. Mobile crisis team, providing treatment in patients' homes, multidisciplinary, 24‐hour service, drug treatment, psychotherapy, instruction in living skills. N = 150. 2. Crisis houses, providing treatment in residential areas, multidisciplinary, 24‐hour service, drug treatment, psychotherapy, instruction in living skills. N = 150. 3. Admission to psychiatric wards N = 150. In all three treatment arms, continuing treatment likely to be given by community mental health teams after initial crisis. |
| Outcomes | Death. Quality of life. |
| Notes | * Size of study with sufficient power to highlight about a 10% difference between groups for primary outcome. |
| CGI: Clinical Global Impression | |
| CRISIS INTERVENTION compared with STANDARD CARE for people with severe mental illnesses | ||||||
| Patient or population: patients with people with severe mental illnesses | ||||||
| Outcomes | Illustrative comparative risks* (95% CI) | Relative effect | No of Participants | Quality of the evidence | Comments | |
| Assumed risk | Corresponding risk | |||||
| STANDARD CARE | CRISIS INTERVENTION | |||||
| Global state | The mean global state in the control groups was | The mean global state in the intervention groups was | 142 | ⊕ ⊕ ⊕ ⊝ | Outcome measure favours crisis intervention over standard care, although not to a significant extent | |
| Mental state ‐ general | The mean mental state ‐ general in the control groups was | The mean mental state ‐ general in the intervention groups was | 248 | ⊕ ⊕ ⊝ ⊝ | Outcome measure favours crisis intervention, although not to a significant extent | |
| Patient Satisfaction | The mean patient satisfaction in the control groups was | The mean patient satisfaction in the intervention groups was | 137 | ⊕ ⊕ ⊕ ⊝ | Outcome favours crisis intervention to a significant extent | |
| Quality of Life | The mean quality of life in the control groups was | The mean quality of life in the intervention groups was | 226 | ⊕ ⊕ ⊝ ⊝ | Outcome favours standard care although not to a significant extent | |
| Burden on family | 583 per 1000 | 198 per 1000 | RR 0.34 | 120 | ⊕ ⊕ ⊝ ⊝ | Outcome significantly favours crisis intervention |
| Hospital use | 758 per 1000 | 470 per 1000 | RR 0.75 | 369 | ⊕ ⊕ ⊕ ⊕ | Outcome significantly favours crisis intervention |
| *The basis for the assumed risk (e.g. the median control group risk across studies) is provided in footnotes. The corresponding risk (and its 95% confidence interval) is based on the assumed risk in the comparison group and the relative effect of the intervention (and its 95% CI). | ||||||
| GRADE Working Group grades of evidence | ||||||
| 1 Details of randomisation not described. | ||||||
| Title | Stage | Reference | Cochrane Editorial Group |
| Crisis intervention for people with severe mental illnesses | Review | This review | Cochrane Schizophrenia Group |
| Crisis interventions for people with borderline personality disorder | Review | Cochrane Developmental, Psychosocial and Learning Problems Group. | |
| Alternatives to inpatient mental health care for children and | Review | Cochrane Effective Practice and Organisation of Care Group |
| Outcome or subgroup title | No. of studies | No. of participants | Statistical method | Effect size |
| 1 Hospital use: 1. Unable to keep to initial trial protocol as regards admission Show forest plot | 5 | Risk Ratio (M‐H, Random, 95% CI) | Subtotals only | |
| 1.1 by 6 months | 3 | 427 | Risk Ratio (M‐H, Random, 95% CI) | 35.76 [6.76, 189.25] |
| 1.2 by 12 months | 5 | 713 | Risk Ratio (M‐H, Random, 95% CI) | 51.79 [14.92, 179.86] |
| 1.3 by 20 months | 2 | 306 | Risk Ratio (M‐H, Random, 95% CI) | 67.69 [9.48, 483.15] |
| 1.4 by 24 months | 1 | 118 | Risk Ratio (M‐H, Random, 95% CI) | 39.77 [2.47, 639.78] |
| 2 Hospital use: 2. Repeat admissions including index admission Show forest plot | 3 | Risk Ratio (M‐H, Random, 95% CI) | Subtotals only | |
| 2.1 by 12 months | 3 | 465 | Risk Ratio (M‐H, Random, 95% CI) | 0.71 [0.31, 1.61] |
| 2.2 by 20 months | 1 | 188 | Risk Ratio (M‐H, Random, 95% CI) | 1.10 [0.75, 1.60] |
| 3 Hospital Use: 3. Number of repeat admissions per participant Show forest plot | Other data | No numeric data | ||
| 3.1 By 6 months | Other data | No numeric data | ||
| 4 Hospital use: 4. Repeat admissions excluding index admission Show forest plot | 2 | Risk Ratio (M‐H, Random, 95% CI) | Subtotals only | |
| 4.1 by 3 months | 1 | 260 | Risk Ratio (M‐H, Random, 95% CI) | 0.53 [0.41, 0.68] |
| 4.2 by 6 months | 2 | 369 | Risk Ratio (M‐H, Random, 95% CI) | 0.75 [0.50, 1.13] |
| 5 Hospital use: 5. Repeat admissions excluding index admission ‐ compulsory detentions only Show forest plot | 1 | Risk Ratio (M‐H, Random, 95% CI) | Subtotals only | |
| 5.1 by 3 months | 1 | 260 | Risk Ratio (M‐H, Random, 95% CI) | 0.62 [0.34, 1.11] |
| 5.2 by 6 months | 1 | 258 | Risk Ratio (M‐H, Random, 95% CI) | 0.69 [0.43, 1.11] |
| 6 Hospital use: 6. Treatment failure Show forest plot | 1 | Risk Ratio (M‐H, Random, 95% CI) | Subtotals only | |
| 6.1 By 6 months | 1 | 119 | Risk Ratio (M‐H, Random, 95% CI) | 3.26 [0.74, 14.44] |
| 7 Hospital use: 7. Days in acute care Show forest plot | 2 | Mean Difference (IV, Random, 95% CI) | Subtotals only | |
| 7.1 By 3 months | 1 | 260 | Mean Difference (IV, Random, 95% CI) | ‐10.3 [‐14.77, ‐5.83] |
| 7.2 By 6 months | 2 | 365 | Mean Difference (IV, Random, 95% CI) | ‐10.54 [‐26.49, 5.42] |
| 8 Hospital use: 8. Home or outpatient visits (data likely to be skewed) Show forest plot | Other data | No numeric data | ||
| 8.1 6 ‐ 12 months | Other data | No numeric data | ||
| 8.2 by 12 months | Other data | No numeric data | ||
| 9 Leaving the study early (unwilling or unable to provide infomation): 1. Patients Show forest plot | 8 | Risk Ratio (M‐H, Random, 95% CI) | Subtotals only | |
| 9.1 by 3 months | 3 | 463 | Risk Ratio (M‐H, Random, 95% CI) | 0.80 [0.55, 1.15] |
| 9.2 by 6 months | 5 | 718 | Risk Ratio (M‐H, Random, 95% CI) | 0.73 [0.55, 0.97] |
| 9.3 by 12 months | 4 | 594 | Risk Ratio (M‐H, Random, 95% CI) | 0.74 [0.56, 0.98] |
| 9.4 by 20 months | 3 | 475 | Risk Ratio (M‐H, Random, 95% CI) | 0.78 [0.57, 1.06] |
| 10 Leaving the study early (unwilling or unable to provide information) 2. Relatives Show forest plot | 2 | Risk Ratio (M‐H, Random, 95% CI) | Subtotals only | |
| 10.1 total in study | 1 | 120 | Risk Ratio (M‐H, Random, 95% CI) | 1.09 [0.52, 2.28] |
| 10.2 subgroup of those living with patient | 1 | 76 | Risk Ratio (M‐H, Random, 95% CI) | 0.71 [0.43, 1.17] |
| 11 Death: 1. Any cause Show forest plot | 6 | 980 | Risk Ratio (M‐H, Random, 95% CI) | 0.88 [0.37, 2.07] |
| 12 Death: 2. By cause Show forest plot | 6 | Risk Ratio (M‐H, Random, 95% CI) | Subtotals only | |
| 12.1 natural causes | 6 | 980 | Risk Ratio (M‐H, Random, 95% CI) | 0.63 [0.18, 2.24] |
| 12.2 suicide or death in suspicious circumstances | 6 | 980 | Risk Ratio (M‐H, Random, 95% CI) | 1.06 [0.36, 3.11] |
| 13 Harm to self or others Show forest plot | 5 | Risk Ratio (M‐H, Random, 95% CI) | Subtotals only | |
| 13.1 attempted suicide | 3 | 369 | Risk Ratio (M‐H, Random, 95% CI) | 2.62 [0.21, 32.02] |
| 13.2 homicide | 3 | 568 | Risk Ratio (M‐H, Random, 95% CI) | 2.96 [0.31, 28.28] |
| 14 Global state: 1. GAS (endpoint score, range 1‐100, low=poor) (loss in some cases is greater than 30%) Show forest plot | 2 | Mean Difference (IV, Random, 95% CI) | Subtotals only | |
| 14.1 By 3 months | 1 | 27 | Mean Difference (IV, Random, 95% CI) | 0.0 [‐12.82, 12.82] |
| 14.2 by 6 months | 1 | 129 | Mean Difference (IV, Random, 95% CI) | 5.10 [‐0.86, 11.06] |
| 14.3 by 12 months | 1 | 131 | Mean Difference (IV, Random, 95% CI) | 3.5 [‐3.15, 10.15] |
| 14.4 by 20 months | 1 | 142 | Mean Difference (IV, Random, 95% CI) | 5.70 [‐0.26, 11.66] |
| 15 Global state: 2. SAS (endpoint score, high=poor) (loss in some cases in greater than 30%) Show forest plot | 1 | Mean Difference (IV, Random, 95% CI) | Subtotals only | |
| 15.1 by 6 months | 1 | 130 | Mean Difference (IV, Random, 95% CI) | ‐0.20 [‐0.75, 0.35] |
| 15.2 by 12 months | 1 | 120 | Mean Difference (IV, Random, 95% CI) | ‐0.30 [‐0.85, 0.25] |
| 15.3 by 20 months | 1 | 139 | Mean Difference (IV, Random, 95% CI) | ‐0.60 [‐1.15, ‐0.05] |
| 16 Global state: 3. GAS scale change data by 3 months (+ve change=good, data likely to be skewed) Show forest plot | 2 | 156 | Mean Difference (IV, Random, 95% CI) | 4.17 [‐1.56, 9.89] |
| 17 Global state: 4. SAS change data by 3 months (‐ve change=good, data likely to be skewed) Show forest plot | 1 | 127 | Mean Difference (IV, Random, 95% CI) | ‐0.09 [‐0.31, 0.13] |
| 18 Mental state ‐ general: 1. Unwell by 12 months Show forest plot | 1 | 120 | Risk Ratio (M‐H, Random, 95% CI) | 0.65 [0.40, 1.07] |
| 19 Mental state ‐ general: 2. BPRS (endpoint score, range 24‐168, high=poor) (loss in standard group >30% for 6 months or more) Show forest plot | 3 | Mean Difference (IV, Random, 95% CI) | Subtotals only | |
| 19.1 by 3 months | 2 | 248 | Mean Difference (IV, Random, 95% CI) | ‐4.03 [‐8.18, 0.12] |
| 19.2 by 6 months | 1 | 129 | Mean Difference (IV, Random, 95% CI) | ‐2.10 [‐6.40, 2.20] |
| 19.3 by 12 months | 1 | 131 | Mean Difference (IV, Random, 95% CI) | ‐2.0 [‐6.03, 2.03] |
| 19.4 by 20 months | 1 | 142 | Mean Difference (IV, Random, 95% CI) | ‐4.5 [‐8.68, ‐0.32] |
| 20 Mental state ‐ general: 3. PEF (endpoint score, range 0‐5, high=poor) (loss is greater than 30%) Show forest plot | 1 | Mean Difference (IV, Random, 95% CI) | Subtotals only | |
| 20.1 by 3 months | 1 | 118 | Mean Difference (IV, Random, 95% CI) | 0.20 [‐0.22, 0.62] |
| 20.2 by 6 months | 1 | 111 | Mean Difference (IV, Random, 95% CI) | 0.10 [‐0.42, 0.62] |
| 20.3 by 12 months | 1 | 97 | Mean Difference (IV, Random, 95% CI) | ‐0.40 [‐0.84, 0.04] |
| 20.4 by 20 months | 1 | 100 | Mean Difference (IV, Random, 95% CI) | 0.10 [‐0.47, 0.67] |
| 21 Mental state ‐ general: 4. PSE (endpoint score, high score=poor, data likely to be skewed) Show forest plot | Other data | No numeric data | ||
| 21.1 by 6 months | Other data | No numeric data | ||
| 21.2 by 12 months | Other data | No numeric data | ||
| 21.3 by 20 months | Other data | No numeric data | ||
| 22 Mental state ‐ general: 5. BPRS scale change data by 3 months (‐ve change=good, data likely to be skewed) Show forest plot | 1 | 129 | Mean Difference (IV, Random, 95% CI) | ‐3.5 [‐8.92, 1.92] |
| 23 Mental state ‐ general: 6. PSE scale change data by 3 months (‐ve change=good, data likely to be skewed). Show forest plot | 1 | 129 | Mean Difference (IV, Random, 95% CI) | ‐2.70 [‐7.69, 2.29] |
| 24 Mental state: general PANSS (endpoint score, range 30‐210, high=poor) Show forest plot | 1 | 111 | Mean Difference (IV, Fixed, 95% CI) | 4.0 [‐3.45, 11.45] |
| 24.1 By 6 months | 1 | 111 | Mean Difference (IV, Fixed, 95% CI) | 4.0 [‐3.45, 11.45] |
| 25 Mental state ‐ specific: 1. Unsociable (reported by relatives) Show forest plot | 1 | Risk Ratio (M‐H, Random, 95% CI) | Subtotals only | |
| 25.1 by 3 months | 1 | 120 | Risk Ratio (M‐H, Random, 95% CI) | 0.86 [0.66, 1.12] |
| 25.2 by 6 months | 1 | 120 | Risk Ratio (M‐H, Random, 95% CI) | 0.43 [0.30, 0.64] |
| 26 Mental state ‐ specific: 2. Aggression (reported by relatives) Show forest plot | 1 | Risk Ratio (M‐H, Random, 95% CI) | Subtotals only | |
| 26.1 by 3 months | 1 | 120 | Risk Ratio (M‐H, Random, 95% CI) | 0.97 [0.72, 1.31] |
| 26.2 by 6 months | 1 | 120 | Risk Ratio (M‐H, Random, 95% CI) | 0.7 [0.39, 1.25] |
| 27 Mental state ‐ specific: 3. Various problems at 4 months (reported by relatives) Show forest plot | 1 | Risk Ratio (M‐H, Random, 95% CI) | Subtotals only | |
| 27.1 agitation | 1 | 120 | Risk Ratio (M‐H, Random, 95% CI) | 0.59 [0.36, 0.95] |
| 27.2 depression | 1 | 120 | Risk Ratio (M‐H, Random, 95% CI) | 0.8 [0.57, 1.13] |
| 27.3 disorientation | 1 | 120 | Risk Ratio (M‐H, Random, 95% CI) | 0.47 [0.28, 0.79] |
| 27.4 psychotic behaviour | 1 | 120 | Risk Ratio (M‐H, Random, 95% CI) | 0.58 [0.30, 1.11] |
| 27.5 substance abuse | 1 | 120 | Risk Ratio (M‐H, Random, 95% CI) | 0.67 [0.33, 1.36] |
| 27.6 withdrawal | 1 | 120 | Risk Ratio (M‐H, Random, 95% CI) | 0.72 [0.48, 1.07] |
| 28 Burden ‐ family: 1. Disruption to daily routine Show forest plot | 2 | Risk Ratio (M‐H, Random, 95% CI) | Subtotals only | |
| 28.1 by 3 months | 2 | 220 | Risk Ratio (M‐H, Random, 95% CI) | 0.76 [0.59, 0.97] |
| 28.2 by 6 months | 2 | 220 | Risk Ratio (M‐H, Random, 95% CI) | 0.67 [0.37, 1.21] |
| 29 Burden ‐ family: 2. Disruption to social life Show forest plot | 2 | Risk Ratio (M‐H, Random, 95% CI) | Subtotals only | |
| 29.1 by 3 months | 2 | 220 | Risk Ratio (M‐H, Random, 95% CI) | 0.69 [0.53, 0.91] |
| 29.2 by 6 months | 2 | 220 | Risk Ratio (M‐H, Random, 95% CI) | 0.72 [0.43, 1.22] |
| 30 Burden ‐ family: 3. Financial strain Show forest plot | 1 | Risk Ratio (M‐H, Random, 95% CI) | Subtotals only | |
| 30.1 by 3 months | 1 | 120 | Risk Ratio (M‐H, Random, 95% CI) | 0.76 [0.52, 1.10] |
| 30.2 by 6 months | 1 | 120 | Risk Ratio (M‐H, Random, 95% CI) | 0.84 [0.53, 1.33] |
| 31 Burden ‐ family: 4. Physical illness due to patient's illness Show forest plot | 1 | Risk Ratio (M‐H, Random, 95% CI) | Subtotals only | |
| 31.1 by 3 months | 1 | 100 | Risk Ratio (M‐H, Random, 95% CI) | 0.78 [0.65, 0.95] |
| 31.2 by 6 months | 1 | 100 | Risk Ratio (M‐H, Random, 95% CI) | 0.71 [0.55, 0.92] |
| 32 Burden ‐ family: 5. Overall burden is great Show forest plot | 1 | Risk Ratio (M‐H, Random, 95% CI) | Subtotals only | |
| 32.1 by 3 months | 1 | 120 | Risk Ratio (M‐H, Random, 95% CI) | 0.57 [0.41, 0.80] |
| 32.2 by 6 months | 1 | 120 | Risk Ratio (M‐H, Random, 95% CI) | 0.34 [0.20, 0.59] |
| 33 Burden ‐ community: 1. Not employed by 20 months Show forest plot | 1 | 189 | Risk Ratio (M‐H, Random, 95% CI) | 0.97 [0.85, 1.12] |
| 34 Burden ‐ community: 1a. In paid work by 6 months Show forest plot | 1 | 112 | Risk Ratio (M‐H, Random, 95% CI) | 1.41 [0.65, 3.04] |
| 34.1 By 6 months | 1 | 112 | Risk Ratio (M‐H, Random, 95% CI) | 1.41 [0.65, 3.04] |
| 35 Burden ‐ community: 2. Various outcomes by 12 months Show forest plot | 1 | Risk Ratio (M‐H, Random, 95% CI) | Subtotals only | |
| 35.1 at least one arrest | 1 | 120 | Risk Ratio (M‐H, Random, 95% CI) | 0.71 [0.46, 1.12] |
| 35.2 at least one use of emergency services | 1 | 120 | Risk Ratio (M‐H, Random, 95% CI) | 0.81 [0.43, 1.54] |
| 36 Burden ‐ community: 3. Arrested Show forest plot | 1 | 111 | Risk Ratio (M‐H, Random, 95% CI) | 5.36 [0.28, 101.35] |
| 36.1 By 6 months | 1 | 111 | Risk Ratio (M‐H, Random, 95% CI) | 5.36 [0.28, 101.35] |
| 37 Burden ‐ community: 4. Homelessness Show forest plot | 1 | 113 | Risk Ratio (M‐H, Random, 95% CI) | 1.23 [0.59, 2.57] |
| 37.1 By 6 months | 1 | 113 | Risk Ratio (M‐H, Random, 95% CI) | 1.23 [0.59, 2.57] |
| 38 Satisfaction ‐ patient: 1. Various outcomes by 12 months Show forest plot | 1 | Risk Ratio (M‐H, Random, 95% CI) | Subtotals only | |
| 38.1 feels unimproved | 1 | 119 | Risk Ratio (M‐H, Random, 95% CI) | 0.48 [0.31, 0.74] |
| 38.2 dissatisfied with treatment received | 1 | 119 | Risk Ratio (M‐H, Random, 95% CI) | 0.66 [0.50, 0.88] |
| 38.3 prefered to get other treatment | 1 | 119 | Risk Ratio (M‐H, Random, 95% CI) | 0.46 [0.27, 0.77] |
| 38.4 feels less able to cope | 1 | 119 | Risk Ratio (M‐H, Random, 95% CI) | 0.36 [0.21, 0.62] |
| 38.5 feels will need more help outside working hours in the future | 1 | 119 | Risk Ratio (M‐H, Random, 95% CI) | 1.48 [0.88, 2.48] |
| 39 Satisfaction ‐ patient: 2. Patient satisitfied with care: Satisfaction Scale (endpoint score, range 0 ‐32, low=poor) Show forest plot | 2 | Mean Difference (IV, Random, 95% CI) | Subtotals only | |
| 39.1 by 3 months | 1 | 226 | Mean Difference (IV, Random, 95% CI) | 1.60 [‐0.22, 3.42] |
| 39.2 by 6 months | 1 | 115 | Mean Difference (IV, Random, 95% CI) | 5.10 [3.16, 7.04] |
| 39.3 by 12 months | 1 | 121 | Mean Difference (IV, Random, 95% CI) | 4.80 [3.11, 6.49] |
| 39.4 by 20 months | 1 | 137 | Mean Difference (IV, Random, 95% CI) | 5.40 [3.91, 6.89] |
| 40 Satisfaction: Patient: 3. VSSS Scale (low=poor) Show forest plot | 1 | 24 | Mean Difference (IV, Random, 95% CI) | 0.20 [‐0.20, 0.60] |
| 41 Satisfaction ‐ relatives: 1. Feels patient is not improved Show forest plot | 1 | Risk Ratio (M‐H, Random, 95% CI) | Subtotals only | |
| 41.1 by 3 months | 1 | 120 | Risk Ratio (M‐H, Random, 95% CI) | 0.79 [0.60, 1.04] |
| 41.2 by 6 months | 1 | 120 | Risk Ratio (M‐H, Random, 95% CI) | 0.71 [0.53, 0.97] |
| 42 Satisfaction ‐ relatives: 4. Various outcomes by 12 months Show forest plot | 1 | Risk Ratio (M‐H, Random, 95% CI) | Subtotals only | |
| 42.1 feel themselves less able to cope | 1 | 120 | Risk Ratio (M‐H, Random, 95% CI) | 0.57 [0.42, 0.78] |
| 42.2 feel themsleves to need more help outside working hours in the future | 1 | 120 | Risk Ratio (M‐H, Random, 95% CI) | 1.21 [0.91, 1.60] |
| 43 Satisfaction ‐ relatives: 3. Would have preferred patient to have received other treatment Show forest plot | 1 | Risk Ratio (M‐H, Random, 95% CI) | Subtotals only | |
| 43.1 by 3 months | 1 | 120 | Risk Ratio (M‐H, Random, 95% CI) | 1.27 [0.63, 2.57] |
| 43.2 by 6 months | 1 | 120 | Risk Ratio (M‐H, Random, 95% CI) | 1.11 [0.49, 2.54] |
| 43.3 by 12 months | 1 | 120 | Risk Ratio (M‐H, Random, 95% CI) | 0.81 [0.43, 1.54] |
| 44 Satisfaction ‐ relatives: 2. Dissatisfied with treatment received Show forest plot | 1 | Risk Ratio (M‐H, Random, 95% CI) | Subtotals only | |
| 44.1 by 3 months | 1 | 120 | Risk Ratio (M‐H, Random, 95% CI) | 0.63 [0.44, 0.89] |
| 44.2 by 6 months | 1 | 120 | Risk Ratio (M‐H, Random, 95% CI) | 0.57 [0.42, 0.78] |
| 44.3 by 12 months | 1 | 120 | Risk Ratio (M‐H, Random, 95% CI) | 0.46 [0.29, 0.72] |
| 45 Economic cost per patient (data likely to be skewed) Show forest plot | Other data | No numeric data | ||
| 45.1 total cost for trial period ‐ as assessed by researchers | Other data | No numeric data | ||
| 45.2 total cost for trial period ‐ as assessed by finance department | Other data | No numeric data | ||
| 45.3 per week | Other data | No numeric data | ||
| 46 Quality of Life MANSA patient endpoint score, range 0 ‐ 88, low=poor Show forest plot | 1 | 226 | Mean Difference (IV, Random, 95% CI) | ‐1.5 [‐5.15, 2.15] |
| 47 Quality of Life MANSA‐short form patient endpoint score, low=poor Show forest plot | 1 | 28 | Mean Difference (IV, Random, 95% CI) | 0.70 [0.14, 1.26] |
| 48 Quality of life: EQ‐5D range 0 to 1, low=poor Show forest plot | 1 | 26 | Mean Difference (IV, Fixed, 95% CI) | 0.01 [‐0.32, 0.34] |
| 48.1 By 3 months | 1 | 26 | Mean Difference (IV, Fixed, 95% CI) | 0.01 [‐0.32, 0.34] |
| 49 Social contacts Show forest plot | 1 | 107 | Mean Difference (IV, Random, 95% CI) | 0.43 [‐0.30, 1.16] |
| 49.1 By 6 months | 1 | 107 | Mean Difference (IV, Random, 95% CI) | 0.43 [‐0.30, 1.16] |
| 50 Social functioning: LSP‐staff endpoint score, range 0‐156, low=poor Show forest plot | 1 | Mean Difference (IV, Random, 95% CI) | Subtotals only | |
| 50.1 by 3 months | 1 | 260 | Mean Difference (IV, Random, 95% CI) | 3.0 [‐0.72, 6.72] |
| 50.2 by 6 months | 1 | 260 | Mean Difference (IV, Random, 95% CI) | 1.0 [‐2.76, 4.76] |
| 51 Clinical and social problems HoNOS ‐ staff endpoint score, range 0‐48, high=poor Show forest plot | 1 | Mean Difference (IV, Random, 95% CI) | Subtotals only | |
| 51.1 by 3 months | 1 | 257 | Mean Difference (IV, Random, 95% CI) | ‐1.90 [‐3.20, ‐0.60] |
| 51.2 by 6 months | 1 | 255 | Mean Difference (IV, Random, 95% CI) | ‐0.60 [‐2.07, 0.87] |
| 52 Unmet needs: CAN scale range 0‐22, high=poor Show forest plot | Other data | No numeric data | ||