Scolaris Content Display Scolaris Content Display

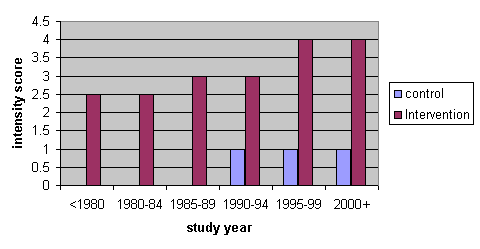
Median intensity score over time
Figuras y tablas -
Figure 1

Median intensity score over time

Comparison 1 All trials, Outcome 1 Continued smoking in late pregnancy.
Figuras y tablas -
Analysis 1.1

Comparison 1 All trials, Outcome 1 Continued smoking in late pregnancy.

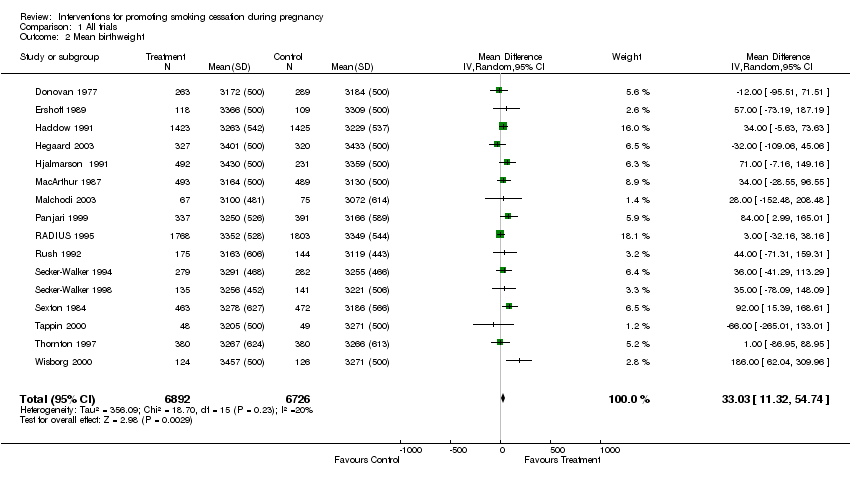
Comparison 1 All trials, Outcome 2 Mean birthweight.
Figuras y tablas -
Analysis 1.2

Comparison 1 All trials, Outcome 2 Mean birthweight.

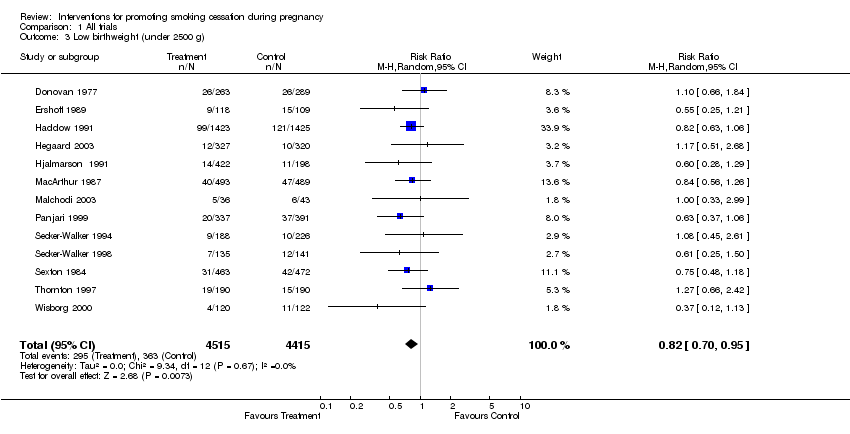
Comparison 1 All trials, Outcome 3 Low birthweight (under 2500 g).
Figuras y tablas -
Analysis 1.3

Comparison 1 All trials, Outcome 3 Low birthweight (under 2500 g).

Comparison 1 All trials, Outcome 4 Very low birthweight (under 1500 g).
Figuras y tablas -
Analysis 1.4

Comparison 1 All trials, Outcome 4 Very low birthweight (under 1500 g).

Comparison 1 All trials, Outcome 5 Preterm birth (under 37 or under 36 weeks).
Figuras y tablas -
Analysis 1.5

Comparison 1 All trials, Outcome 5 Preterm birth (under 37 or under 36 weeks).

Comparison 1 All trials, Outcome 7 Stillbirths.
Figuras y tablas -
Analysis 1.7

Comparison 1 All trials, Outcome 7 Stillbirths.

Comparison 1 All trials, Outcome 8 Neonatal deaths.
Figuras y tablas -
Analysis 1.8

Comparison 1 All trials, Outcome 8 Neonatal deaths.

Comparison 1 All trials, Outcome 9 Perinatal deaths.
Figuras y tablas -
Analysis 1.9

Comparison 1 All trials, Outcome 9 Perinatal deaths.

Comparison 2 Trials with biochemically validated smoking cessation, Outcome 1 Continued smoking in late pregnancy.
Figuras y tablas -
Analysis 2.1

Comparison 2 Trials with biochemically validated smoking cessation, Outcome 1 Continued smoking in late pregnancy.

Comparison 3 Interventions with high quality scores, Outcome 1 Continued smoking in late pregnancy.
Figuras y tablas -
Analysis 3.1

Comparison 3 Interventions with high quality scores, Outcome 1 Continued smoking in late pregnancy.

Comparison 4 Interventions of high intensity with high quality scores and biochemically validated smoking cessation, Outcome 1 Continued smoking in late pregnancy.
Figuras y tablas -
Analysis 4.1

Comparison 4 Interventions of high intensity with high quality scores and biochemically validated smoking cessation, Outcome 1 Continued smoking in late pregnancy.

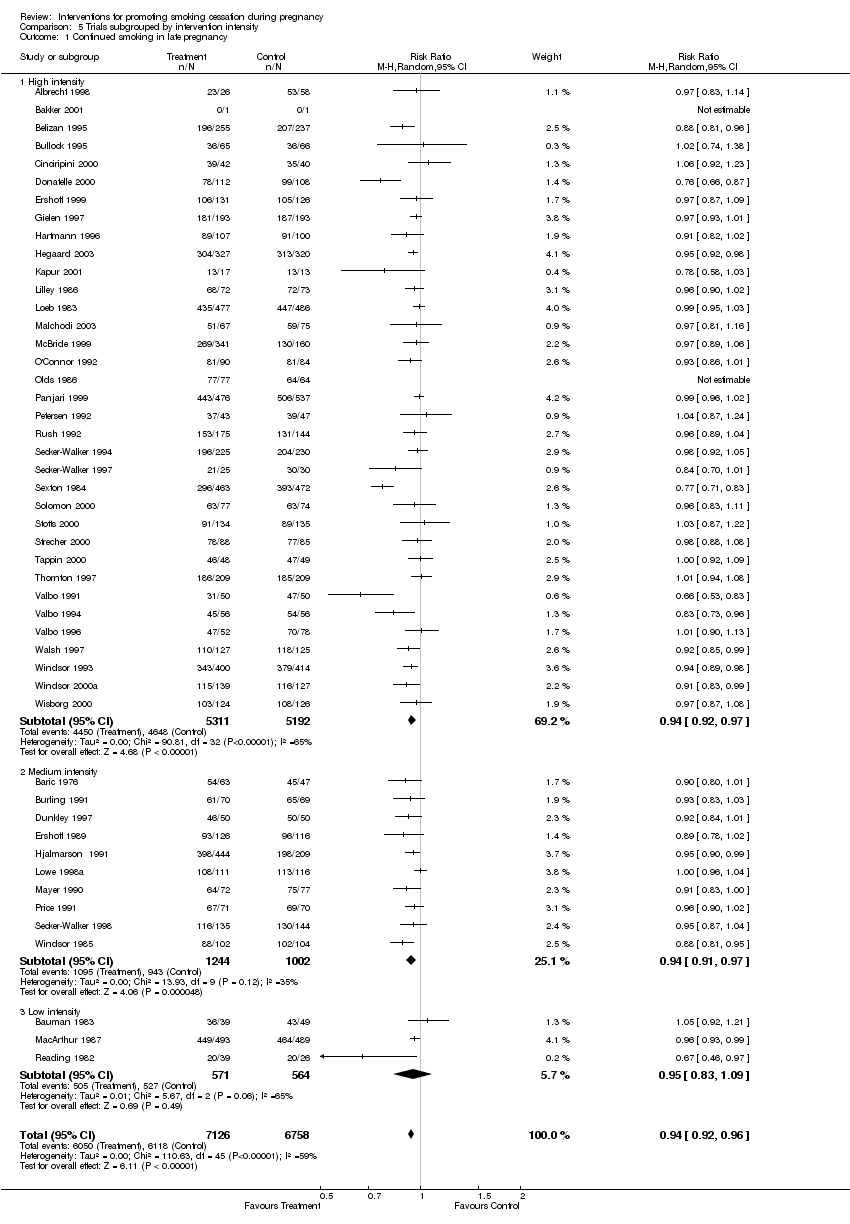
Comparison 5 Trials subgrouped by intervention intensity, Outcome 1 Continued smoking in late pregnancy.
Figuras y tablas -
Analysis 5.1

Comparison 5 Trials subgrouped by intervention intensity, Outcome 1 Continued smoking in late pregnancy.

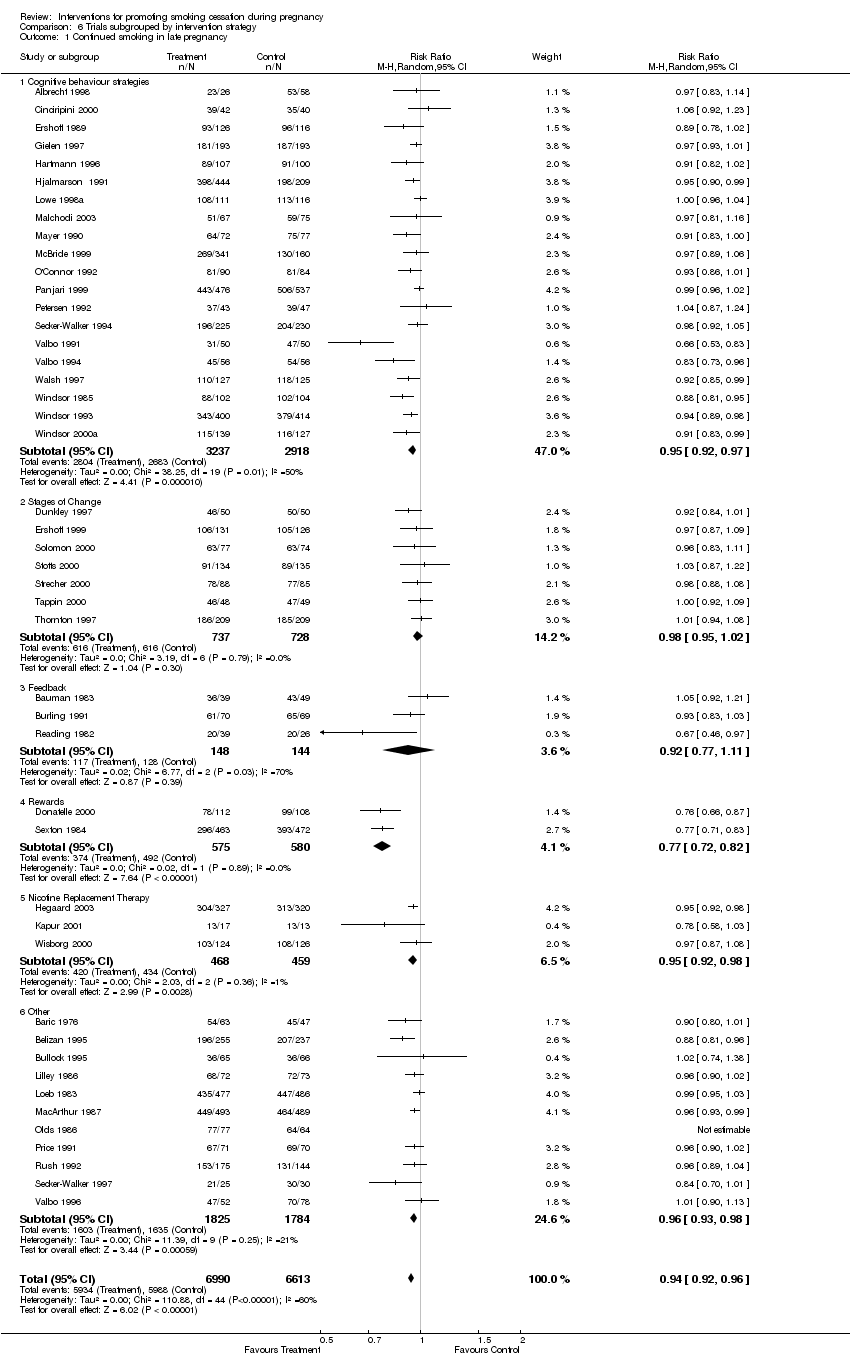
Comparison 6 Trials subgrouped by intervention strategy, Outcome 1 Continued smoking in late pregnancy.
Figuras y tablas -
Analysis 6.1

Comparison 6 Trials subgrouped by intervention strategy, Outcome 1 Continued smoking in late pregnancy.

Comparison 7 Trials to prevent smoking relapse in women who stopped smoking in early pregnancy, Outcome 1 Smoking in late pregnancy.
Figuras y tablas -
Analysis 7.1

Comparison 7 Trials to prevent smoking relapse in women who stopped smoking in early pregnancy, Outcome 1 Smoking in late pregnancy.

Table 1. Randomised cluster trials: summary of effect

Trial ID

Outcome measurement

Adjustment

Effect

95% CI

Kendrick 1995

Biochemically validated smoking cessation at 8 months of pregnancy

Odds ratio adjusted

1.0

0.69‐1.6

Manfredi 1999

Self reported smoking cessation at 5‐8 weeks post birth

Odds ratio Z‐score adjusted

0.67

0.38‐1.15 p = 0.006

Bakker 2000b

Self reported smoking cessation at 6 weeks post birth

Odds ratio adjusted

0.42

0.18‐0.97

Hajek 2001

Biochemically validated smoking cessation at birth

Odds ratio

0.86

0.48‐1.57

Moore 2002

Biochemically validated smoking cessation at 6‐7 months of pregnancy

Odds ratio adjusted

0.89

0.48‐1.57

Lawrence 2003

Biochemically validated smoking cessation at 10 days post birth

Odds ratio adjusted

0.58

0.26‐1.33

Figuras y tablas -
Table 1. Randomised cluster trials: summary of effect
Comparison 1. All trials

Outcome or subgroup title

No. of studies

No. of participants

Statistical method

Effect size

1 Continued smoking in late pregnancy Show forest plot

47

13882

Risk Ratio (M‐H, Random, 95% CI)

0.94 [0.92, 0.96]

2 Mean birthweight Show forest plot

16

13618

Mean Difference (IV, Random, 95% CI)

33.03 [11.32, 54.74]

3 Low birthweight (under 2500 g) Show forest plot

13

8930

Risk Ratio (M‐H, Random, 95% CI)

0.82 [0.70, 0.95]

4 Very low birthweight (under 1500 g) Show forest plot

3

4765

Risk Ratio (M‐H, Random, 95% CI)

1.26 [0.69, 2.32]

5 Preterm birth (under 37 or under 36 weeks) Show forest plot

11

10932

Risk Ratio (M‐H, Random, 95% CI)

0.84 [0.72, 0.98]

7 Stillbirths Show forest plot

5

4525

Risk Ratio (M‐H, Random, 95% CI)

1.16 [0.71, 1.88]

8 Neonatal deaths Show forest plot

3

4143

Risk Ratio (M‐H, Random, 95% CI)

1.17 [0.34, 4.01]

9 Perinatal deaths Show forest plot

3

4335

Risk Ratio (M‐H, Random, 95% CI)

1.13 [0.72, 1.77]

Figuras y tablas -
Comparison 1. All trials
Comparison 2. Trials with biochemically validated smoking cessation

Outcome or subgroup title

No. of studies

No. of participants

Statistical method

Effect size

1 Continued smoking in late pregnancy Show forest plot

35

10362

Risk Ratio (M‐H, Random, 95% CI)

0.94 [0.92, 0.97]

Figuras y tablas -
Comparison 2. Trials with biochemically validated smoking cessation
Comparison 3. Interventions with high quality scores

Outcome or subgroup title

No. of studies

No. of participants

Statistical method

Effect size

1 Continued smoking in late pregnancy Show forest plot

25

7819

Risk Ratio (M‐H, Random, 95% CI)

0.95 [0.93, 0.97]

Figuras y tablas -
Comparison 3. Interventions with high quality scores
Comparison 4. Interventions of high intensity with high quality scores and biochemically validated smoking cessation

Outcome or subgroup title

No. of studies

No. of participants

Statistical method

Effect size

1 Continued smoking in late pregnancy Show forest plot

17

5252

Risk Ratio (M‐H, Random, 95% CI)

0.96 [0.94, 0.98]

Figuras y tablas -
Comparison 4. Interventions of high intensity with high quality scores and biochemically validated smoking cessation
Comparison 5. Trials subgrouped by intervention intensity

Outcome or subgroup title

No. of studies

No. of participants

Statistical method

Effect size

1 Continued smoking in late pregnancy Show forest plot

48

13884

Risk Ratio (M‐H, Random, 95% CI)

0.94 [0.92, 0.96]

1.1 High intensity

35

10503

Risk Ratio (M‐H, Random, 95% CI)

0.94 [0.92, 0.97]

1.2 Medium intensity

10

2246

Risk Ratio (M‐H, Random, 95% CI)

0.94 [0.91, 0.97]

1.3 Low intensity

3

1135

Risk Ratio (M‐H, Random, 95% CI)

0.95 [0.83, 1.09]

Figuras y tablas -
Comparison 5. Trials subgrouped by intervention intensity
Comparison 6. Trials subgrouped by intervention strategy

Outcome or subgroup title

No. of studies

No. of participants

Statistical method

Effect size

1 Continued smoking in late pregnancy Show forest plot

46

13603

Risk Ratio (M‐H, Random, 95% CI)

0.94 [0.92, 0.96]

1.1 Cognitive behaviour strategies

20

6155

Risk Ratio (M‐H, Random, 95% CI)

0.95 [0.92, 0.97]

1.2 Stages of Change

7

1465

Risk Ratio (M‐H, Random, 95% CI)

0.98 [0.95, 1.02]

1.3 Feedback

3

292

Risk Ratio (M‐H, Random, 95% CI)

0.92 [0.77, 1.11]

1.4 Rewards

2

1155

Risk Ratio (M‐H, Random, 95% CI)

0.77 [0.72, 0.82]

1.5 Nicotine Replacement Therapy

3

927

Risk Ratio (M‐H, Random, 95% CI)

0.95 [0.92, 0.98]

1.6 Other

11

3609

Risk Ratio (M‐H, Random, 95% CI)

0.96 [0.93, 0.98]

Figuras y tablas -
Comparison 6. Trials subgrouped by intervention strategy
Comparison 7. Trials to prevent smoking relapse in women who stopped smoking in early pregnancy

Outcome or subgroup title

No. of studies

No. of participants

Statistical method

Effect size

1 Smoking in late pregnancy Show forest plot

5

843

Risk Ratio (M‐H, Random, 95% CI)

0.81 [0.63, 1.04]

Figuras y tablas -
Comparison 7. Trials to prevent smoking relapse in women who stopped smoking in early pregnancy