Therapeutic hypothermia for head injury
Referencias
References to studies included in this review
References to studies excluded from this review
References to studies awaiting assessment
References to ongoing studies
Randomisation begins after run‐in period..
Additional references
Characteristics of studies
Characteristics of included studies [ordered by study ID]
| Methods | Randomised controlled trial. Allocation concealment unclear. | |
| Participants | Patients aged 4 to 76 with traumatic brain injury and Glasgow coma scale from 3 to 8. | |
| Interventions | Hypothermia patients: Cooling to 32‐33C within 4 hours on injury for 3‐4 days. Rewarming at 1C per day. | |
| Outcomes | Death and GOS at 6 months. | |
| Notes | GOS assessed by "independent neurosurgeon who were not aware of the study". | |
| Risk of bias | ||
| Bias | Authors' judgement | Support for judgement |
| Allocation concealment? | Unclear risk | B ‐ Unclear |
| Methods | Randomised controlled trial. | |
| Participants | Twenty‐one children up to 18 years old, with closed traumatic brain injury and a GCS of 8 or less. | |
| Interventions | Hypothermia patients (n=10?): cooled to 32 to 34 degress celsius for 48 hours. Rewarming over a period of 12 hours. | |
| Outcomes | Death. | |
| Notes | GOS assessed blind to allocation. | |
| Risk of bias | ||
| Bias | Authors' judgement | Support for judgement |
| Allocation concealment? | Unclear risk | D ‐ Not used |
| Methods | Randomised controlled trial. Allocation by 'sealed envelopes'. | |
| Participants | Patients with GCS 4‐8 with closed head injury but no major systemic injuries, in whom cooling could begin within 6 hours of injury. | |
| Interventions | Hypothermia patients: cooling to 30‐32C for 24 hours using cooling blankets and iced saline stomach lavage. Rewarming over a period of 24 hours. | |
| Outcomes | Death and GOS at 3 months. | |
| Notes | GOS not assessed blind to treatment allocation. | |
| Risk of bias | ||
| Bias | Authors' judgement | Support for judgement |
| Allocation concealment? | Low risk | A ‐ Adequate |
| Methods | Randomised controlled trial. Allocation by 'sealed envelopes'. | |
| Participants | Patients age 16 to 60, GCS 4‐7 with closed head injury but no major systemic injuries, in whom cooling could begin within 6 hours of injury. | |
| Interventions | Hypothermia patients: cooling to 32‐33C for 48 hours using cooling blankets. Rewarming over a period of 48 hours. | |
| Outcomes | Death and GOS at 3 months. | |
| Notes | GOS assessed blind to treatment allocation. | |
| Risk of bias | ||
| Bias | Authors' judgement | Support for judgement |
| Allocation concealment? | Low risk | A ‐ Adequate |
| Methods | Randomised controlled trial. | |
| Participants | Patients aged 16 to 65 with a non‐penetrating head injury and a Glasgow coma scale of 3 to 8 after resuscitation. | |
| Interventions | Hypothermia patients: cooling to 32.5‐34C for 48 hours using ice, cold gastric lavage, unwarmed ventilator gases, and then temperature control pads. Rewarming at rate of up to 0.5C in 2 hours. | |
| Outcomes | Death and GOS at 6 months. | |
| Notes | GOS assessed blind to treatment allocation. | |
| Risk of bias | ||
| Bias | Authors' judgement | Support for judgement |
| Allocation concealment? | Low risk | A ‐ Adequate |
| Methods | Randomised controlled trial. Allocation method not stated. | |
| Participants | Patients age 18 to 81, GCS 3‐7 with closed head injury. | |
| Interventions | Hypothermia patients: cooling to 32‐33C for 48 hours using cooling blankets. Rewarming over a period of 48 hours. | |
| Outcomes | Death and GOS at 3 months. | |
| Notes | Blinding of outcome assessment not stated. | |
| Risk of bias | ||
| Bias | Authors' judgement | Support for judgement |
| Allocation concealment? | Unclear risk | B ‐ Unclear |
| Methods | Randomised controlled trial. Allocation by 'random sampling'. | |
| Participants | Patients with GCS 3‐8 with closed head injury. | |
| Interventions | 'Moderate hypothermia' without any details. | |
| Outcomes | Thrombopoetin levels during treatment. | |
| Notes | Abstract only. | |
| Risk of bias | ||
| Bias | Authors' judgement | Support for judgement |
| Allocation concealment? | Unclear risk | B ‐ Unclear |
| Methods | Randomised controlled trial. Allocation method not clear. | |
| Participants | Patients with mean age of 41 years, GCS 3‐8. | |
| Interventions | Hypothermia patients: 'Mild hypothermia' induced using cooling blankets until ICP within 'normal range' for 24 hours. | |
| Outcomes | Death and GOS at 12 months. | |
| Notes | Assesment by MD blinded to treatment allocation. | |
| Risk of bias | ||
| Bias | Authors' judgement | Support for judgement |
| Allocation concealment? | Low risk | A ‐ Adequate |
| Methods | Randomised controlled trial. Allocation by 'sealed envelopes'. | |
| Participants | Patients age 16 to 75, GCS 3‐7 with closed head injury, in whom cooling could begin within 6 hours of injury. | |
| Interventions | Hypothermia patients: Cooling to 32‐33C for 24 hours using cooling blankets and nasogastric lavage. Rewarming over a period of 12 hours. | |
| Outcomes | Death and GOS at 3, 6 and 12 months. | |
| Notes | GOS assessment by psychiatrist blinded to treatment allocation. | |
| Risk of bias | ||
| Bias | Authors' judgement | Support for judgement |
| Allocation concealment? | Low risk | A ‐ Adequate |
| Methods | Randomised controlled trial. Allocation by 'sealed envelopes'. | |
| Participants | Patients with severe blunt head injury, in whom cooling could begin within 8 hours of injury. | |
| Interventions | Hypothermia patients: Cooling to 32‐33C for 48 hours. | |
| Outcomes | Death. | |
| Notes | GOS assessed at 6 months by non‐blinded assessor, but not yet available. | |
| Risk of bias | ||
| Bias | Authors' judgement | Support for judgement |
| Allocation concealment? | Low risk | A ‐ Adequate |
| Methods | ||
| Participants | ||
| Interventions | ||
| Outcomes | ||
| Notes | ||
| Risk of bias | ||
| Bias | Authors' judgement | Support for judgement |
| Allocation concealment? | Unclear risk | D ‐ Not used |
| Methods | ||
| Participants | ||
| Interventions | ||
| Outcomes | ||
| Notes | ||
| Risk of bias | ||
| Bias | Authors' judgement | Support for judgement |
| Allocation concealment? | Unclear risk | D ‐ Not used |
| Methods | Randomised controlled trial. Allocation 'by lot'. | |
| Participants | Patients age 10 or over, GCS 8 or less with head injury, in whom ICP could not be controlled by high‐dose barbituate therapy. | |
| Interventions | Hypothermia patients: cooling to 33.5‐34.5C using water‐circulating cooling blankets for a minimum of 48 hours and until ICP was below 20 mmHg for 24 hours. Rewarming over a period of 24 hours. | |
| Outcomes | Death and GOS at 6 months. | |
| Notes | GOS assessed blind to treatment allocation. | |
| Risk of bias | ||
| Bias | Authors' judgement | Support for judgement |
| Allocation concealment? | Unclear risk | B ‐ Unclear |
| Methods | Randomised controlled trial. Allocation concealment not clear. | |
| Participants | Patients with traumatic brain injury, a Glasgow coma scale of 8 or less, and ICP under 20mmHg on treatment with hyperventilation, barbiturates and fluid restriction. | |
| Interventions | Hypothermia patients: cooling to 33.5‐34.5C for 48 hours, using water circulating blankets. Rewarming at 1C per day. | |
| Outcomes | Death and GOS at 6 months. | |
| Notes | Blinding of outcome assessment not stated. | |
| Risk of bias | ||
| Bias | Authors' judgement | Support for judgement |
| Allocation concealment? | Unclear risk | B ‐ Unclear |
| Methods | Randomised controlled trial. | |
| Participants | Patients with traumatic brain injury, a Glasgow coma scale of 8 or less, and ICP of under 25mmHg with other therapies. | |
| Interventions | Hypothermia patients: Cooling to 33.5‐34.5C for 48 hours, using cooling blankets and gastric lavage. Rewarming at 1C per day. | |
| Outcomes | Death and GOS at 3 months. | |
| Notes | Blinding of outcome assessment not stated. | |
| Risk of bias | ||
| Bias | Authors' judgement | Support for judgement |
| Allocation concealment? | Unclear risk | B ‐ Unclear |
| Methods | Randomised controlled trial. | |
| Participants | Patients with traumatic brain injury within 10 hours of injury and a Glasgow Coma Scale of 3 to 8 on initial assesment. | |
| Interventions | Hypothermia patients: Cooling to 32‐34C for 3‐5 days, using a cooling bed and, in some, ice blocks. 'Natural' rewarming. | |
| Outcomes | Death, follow up period unclear. | |
| Notes | Blinding of outcome assessment not stated. | |
| Risk of bias | ||
| Bias | Authors' judgement | Support for judgement |
| Allocation concealment? | Unclear risk | B ‐ Unclear |
| Methods | Randomised controlled trial. | |
| Participants | Patients aged under 65 with traumatic brain injury and a Glasgow Coma Scale of 3‐8 on admission to hospital. | |
| Interventions | Hypothermia patients: Cooling to 32‐33C for 3‐8 days. | |
| Outcomes | Death, follow up period unclear. | |
| Notes | Blinding of outcome assessment not stated. | |
| Risk of bias | ||
| Bias | Authors' judgement | Support for judgement |
| Allocation concealment? | Unclear risk | B ‐ Unclear |
Characteristics of excluded studies [ordered by study ID]
| Study | Reason for exclusion |
| Randomized trial of rewarming therapy after accidental hypothermia in trauma. | |
| Unable to find sufficient information on study design. | |
| Not a randomised comparison, and hypothermia confounded with barbituate therapy | |
| Not a randomised study; hypothermia group GCS 4‐6, normothermia group GCS 8‐10. |
Characteristics of ongoing studies [ordered by study ID]
| Trial name or title | National Acute Brain Injury Study: Hypothermia II (NABISH II) |
| Methods | |
| Participants | Patients aged 16 to 45 years inclusive who have a closed head injury, present to the Emergency Dept. with a Glasgow Coma Score between 3‐8, have a body temperature (bladder or rectal) of 35 degrees Celsius or less, and with an Abbreviated Injury Score (AIS) of 4 or less for the rest of the body. |
| Interventions | The patients will be randomly allocated to either the hypothermia group or the normothermia group. A cooling suit will be used to cool the hypothermia patients down to a body temperature of 33 degrees celsius. This temperature of 33 degrees will be maintained in the hypothermia patients for 48 hours. After 48 hours, the study nurses will gradually re‐warm the hypothermia patients no faster than one degree every four hours. This takes at least 16 hours sometimes longer depending upon the stability of the patient's vital signes. The control group ‐ normothermia will be allowed to re‐warm gradually upon arrival to the hospital with no medical intervention to raise or lower the body temperature. |
| Outcomes | Mortality and GOS. ICP and complications. |
| Starting date | Run‐in period 21st October 2002 to 21st April 2003. |
| Contact information | Guy.L.Clifton, MD Emmy R. Miller, RN, PhD, Co‐investigator NABISH II |
| Notes | There are other study sites participating in NABISH II. They are: |
Data and analyses
| Outcome or subgroup title | No. of studies | No. of participants | Statistical method | Effect size |
| 1 Death at final follow‐up Show forest plot | 13 | 1063 | Odds Ratio (M‐H, Fixed, 95% CI) | 0.80 [0.61, 1.04] |
| Analysis 1.1  Comparison 1 Immediate hypothermia versus normothermia, Outcome 1 Death at final follow‐up. | ||||
| 2 Death or severe disability at final follow‐up Show forest plot | 9 | 746 | Odds Ratio (M‐H, Fixed, 95% CI) | 0.75 [0.56, 1.00] |
| Analysis 1.2  Comparison 1 Immediate hypothermia versus normothermia, Outcome 2 Death or severe disability at final follow‐up. | ||||
| 3 Death or severe disability stratified by quality Show forest plot | 9 | Odds Ratio (M‐H, Fixed, 95% CI) | Subtotals only | |
| Analysis 1.3  Comparison 1 Immediate hypothermia versus normothermia, Outcome 3 Death or severe disability stratified by quality. | ||||
| 3.1 Concealed allocation, blinded outcome assessment | 3 | 494 | Odds Ratio (M‐H, Fixed, 95% CI) | 0.80 [0.56, 1.14] |
| 3.2 Concealed allocation, non‐blinded outcome assessment | 1 | 10 | Odds Ratio (M‐H, Fixed, 95% CI) | 0.38 [0.02, 6.35] |
| 3.3 Non‐concealed allocation, blinded outcome assessment | 2 | 113 | Odds Ratio (M‐H, Fixed, 95% CI) | 0.34 [0.16, 0.76] |
| 3.4 Non‐concealed allocation, non‐blinded outcome assessment | 3 | 129 | Odds Ratio (M‐H, Fixed, 95% CI) | 1.17 [0.58, 2.35] |
| 4 Death or severe disability stratified by treatment duration Show forest plot | 7 | Odds Ratio (M‐H, Fixed, 95% CI) | Subtotals only | |
| Analysis 1.4  Comparison 1 Immediate hypothermia versus normothermia, Outcome 4 Death or severe disability stratified by treatment duration. | ||||
| 4.1 24 hours | 2 | 91 | Odds Ratio (M‐H, Fixed, 95% CI) | 0.38 [0.16, 0.90] |
| 4.2 48 hours | 5 | 542 | Odds Ratio (M‐H, Fixed, 95% CI) | 0.97 [0.69, 1.36] |
| 5 Death or severe disability at various times during follow‐up Show forest plot | 9 | Odds Ratio (M‐H, Fixed, 95% CI) | Subtotals only | |
| Analysis 1.5  Comparison 1 Immediate hypothermia versus normothermia, Outcome 5 Death or severe disability at various times during follow‐up. | ||||
| 5.1 3 months | 5 | 250 | Odds Ratio (M‐H, Fixed, 95% CI) | 0.72 [0.43, 1.21] |
| 5.2 6 months | 4 | 492 | Odds Ratio (M‐H, Fixed, 95% CI) | 0.79 [0.55, 1.13] |
| 5.3 12 months | 2 | 168 | Odds Ratio (M‐H, Fixed, 95% CI) | 0.41 [0.22, 0.77] |
| 6 Pneumonia during the treatment period Show forest plot | 8 | 283 | Odds Ratio (M‐H, Fixed, 95% CI) | 1.95 [1.18, 3.23] |
| Analysis 1.6  Comparison 1 Immediate hypothermia versus normothermia, Outcome 6 Pneumonia during the treatment period. | ||||
| Outcome or subgroup title | No. of studies | No. of participants | Statistical method | Effect size |
| 1 Death at final follow‐up Show forest plot | 1 | 33 | Odds Ratio (M‐H, Fixed, 95% CI) | 0.21 [0.04, 1.05] |
| Analysis 2.1  Comparison 2 Deferred hypothermia versus normothermia, Outcome 1 Death at final follow‐up. | ||||
| 2 Death or severe disability at final follow‐up Show forest plot | 1 | 33 | Odds Ratio (M‐H, Fixed, 95% CI) | 0.10 [0.01, 1.00] |
| Analysis 2.2  Comparison 2 Deferred hypothermia versus normothermia, Outcome 2 Death or severe disability at final follow‐up. | ||||
| 3 Death or severe disability at various times during follow‐up Show forest plot | 1 | Odds Ratio (M‐H, Fixed, 95% CI) | Subtotals only | |
| Analysis 2.3  Comparison 2 Deferred hypothermia versus normothermia, Outcome 3 Death or severe disability at various times during follow‐up. | ||||
| 3.1 3 months | 0 | 0 | Odds Ratio (M‐H, Fixed, 95% CI) | 0.0 [0.0, 0.0] |
| 3.2 6 months | 1 | 33 | Odds Ratio (M‐H, Fixed, 95% CI) | 0.10 [0.01, 1.00] |
| 3.3 12 months | 0 | 0 | Odds Ratio (M‐H, Fixed, 95% CI) | 0.0 [0.0, 0.0] |
| 4 Death or severe disability stratified by quality Show forest plot | 1 | Odds Ratio (M‐H, Fixed, 95% CI) | Subtotals only | |
| Analysis 2.4  Comparison 2 Deferred hypothermia versus normothermia, Outcome 4 Death or severe disability stratified by quality. | ||||
| 4.1 Concealed allocation, blinded outcome assessment | 0 | 0 | Odds Ratio (M‐H, Fixed, 95% CI) | 0.0 [0.0, 0.0] |
| 4.2 Concealed allocation, non‐blinded outcome assessment | 0 | 0 | Odds Ratio (M‐H, Fixed, 95% CI) | 0.0 [0.0, 0.0] |
| 4.3 Non‐concealed allocation, blinded outcome assessment | 1 | 33 | Odds Ratio (M‐H, Fixed, 95% CI) | 0.10 [0.01, 1.00] |
| 4.4 Non‐concealed allocation, non‐blinded outcome assessment | 0 | 0 | Odds Ratio (M‐H, Fixed, 95% CI) | 0.0 [0.0, 0.0] |
| 5 Death or severe disability stratified by treatment duration Show forest plot | 1 | Odds Ratio (M‐H, Fixed, 95% CI) | Subtotals only | |
| Analysis 2.5  Comparison 2 Deferred hypothermia versus normothermia, Outcome 5 Death or severe disability stratified by treatment duration. | ||||
| 5.1 24 hours | 0 | 0 | Odds Ratio (M‐H, Fixed, 95% CI) | 0.0 [0.0, 0.0] |
| 5.2 48 hours | 1 | 33 | Odds Ratio (M‐H, Fixed, 95% CI) | 0.10 [0.01, 1.00] |
| 6 Pneumonia during the treatment period Show forest plot | 1 | 22 | Odds Ratio (M‐H, Fixed, 95% CI) | 1.13 [0.18, 6.93] |
| Analysis 2.6  Comparison 2 Deferred hypothermia versus normothermia, Outcome 6 Pneumonia during the treatment period. | ||||
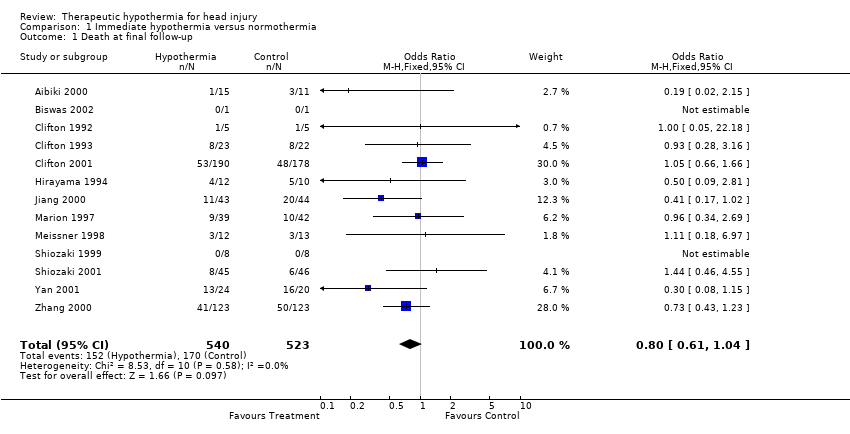
Comparison 1 Immediate hypothermia versus normothermia, Outcome 1 Death at final follow‐up.

Comparison 1 Immediate hypothermia versus normothermia, Outcome 2 Death or severe disability at final follow‐up.
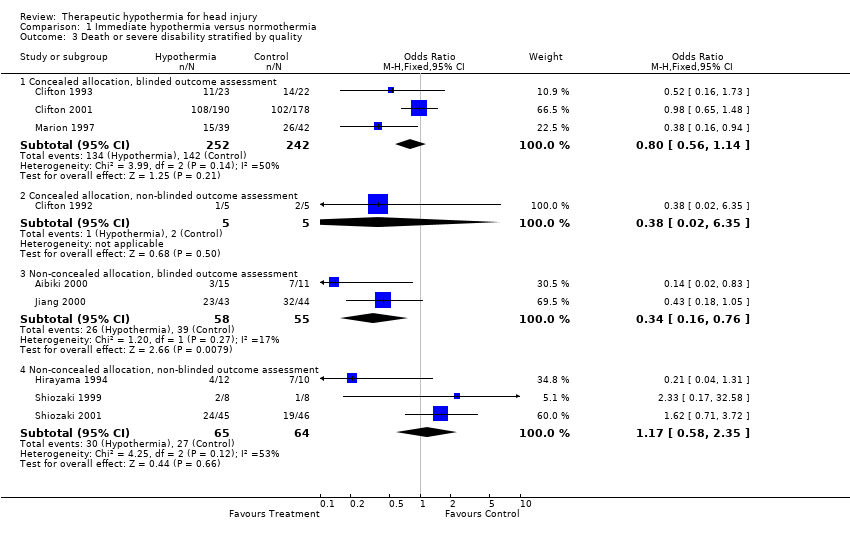
Comparison 1 Immediate hypothermia versus normothermia, Outcome 3 Death or severe disability stratified by quality.
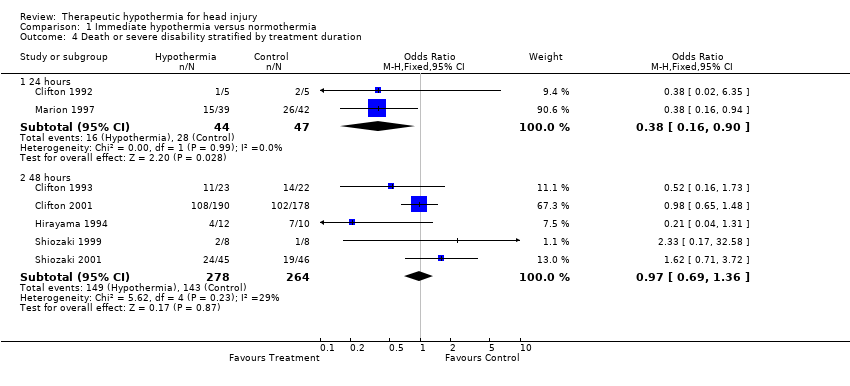
Comparison 1 Immediate hypothermia versus normothermia, Outcome 4 Death or severe disability stratified by treatment duration.
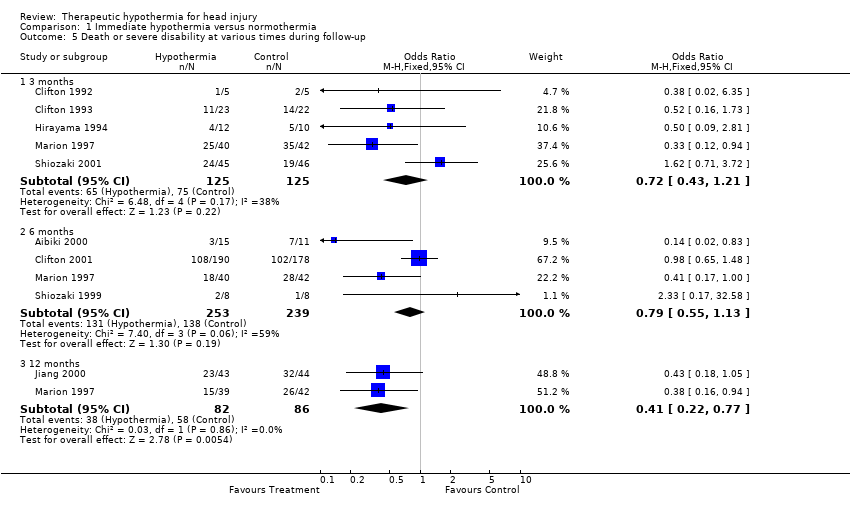
Comparison 1 Immediate hypothermia versus normothermia, Outcome 5 Death or severe disability at various times during follow‐up.
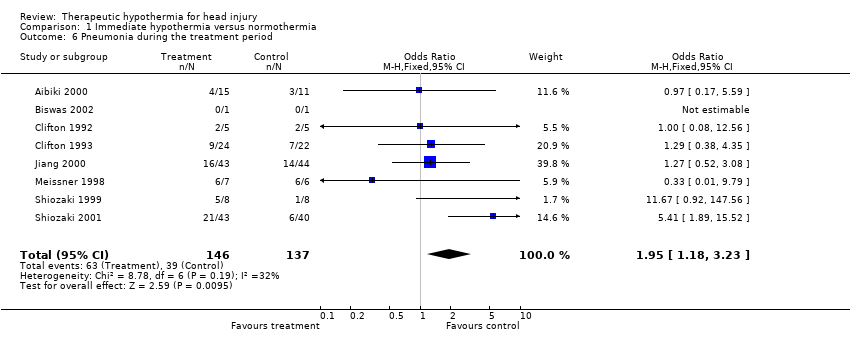
Comparison 1 Immediate hypothermia versus normothermia, Outcome 6 Pneumonia during the treatment period.

Comparison 2 Deferred hypothermia versus normothermia, Outcome 1 Death at final follow‐up.
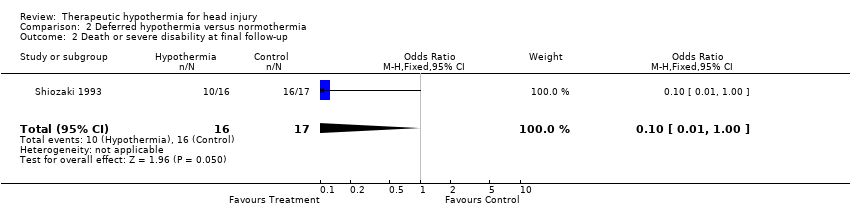
Comparison 2 Deferred hypothermia versus normothermia, Outcome 2 Death or severe disability at final follow‐up.

Comparison 2 Deferred hypothermia versus normothermia, Outcome 3 Death or severe disability at various times during follow‐up.

Comparison 2 Deferred hypothermia versus normothermia, Outcome 4 Death or severe disability stratified by quality.

Comparison 2 Deferred hypothermia versus normothermia, Outcome 5 Death or severe disability stratified by treatment duration.

Comparison 2 Deferred hypothermia versus normothermia, Outcome 6 Pneumonia during the treatment period.
| Outcome or subgroup title | No. of studies | No. of participants | Statistical method | Effect size |
| 1 Death at final follow‐up Show forest plot | 13 | 1063 | Odds Ratio (M‐H, Fixed, 95% CI) | 0.80 [0.61, 1.04] |
| 2 Death or severe disability at final follow‐up Show forest plot | 9 | 746 | Odds Ratio (M‐H, Fixed, 95% CI) | 0.75 [0.56, 1.00] |
| 3 Death or severe disability stratified by quality Show forest plot | 9 | Odds Ratio (M‐H, Fixed, 95% CI) | Subtotals only | |
| 3.1 Concealed allocation, blinded outcome assessment | 3 | 494 | Odds Ratio (M‐H, Fixed, 95% CI) | 0.80 [0.56, 1.14] |
| 3.2 Concealed allocation, non‐blinded outcome assessment | 1 | 10 | Odds Ratio (M‐H, Fixed, 95% CI) | 0.38 [0.02, 6.35] |
| 3.3 Non‐concealed allocation, blinded outcome assessment | 2 | 113 | Odds Ratio (M‐H, Fixed, 95% CI) | 0.34 [0.16, 0.76] |
| 3.4 Non‐concealed allocation, non‐blinded outcome assessment | 3 | 129 | Odds Ratio (M‐H, Fixed, 95% CI) | 1.17 [0.58, 2.35] |
| 4 Death or severe disability stratified by treatment duration Show forest plot | 7 | Odds Ratio (M‐H, Fixed, 95% CI) | Subtotals only | |
| 4.1 24 hours | 2 | 91 | Odds Ratio (M‐H, Fixed, 95% CI) | 0.38 [0.16, 0.90] |
| 4.2 48 hours | 5 | 542 | Odds Ratio (M‐H, Fixed, 95% CI) | 0.97 [0.69, 1.36] |
| 5 Death or severe disability at various times during follow‐up Show forest plot | 9 | Odds Ratio (M‐H, Fixed, 95% CI) | Subtotals only | |
| 5.1 3 months | 5 | 250 | Odds Ratio (M‐H, Fixed, 95% CI) | 0.72 [0.43, 1.21] |
| 5.2 6 months | 4 | 492 | Odds Ratio (M‐H, Fixed, 95% CI) | 0.79 [0.55, 1.13] |
| 5.3 12 months | 2 | 168 | Odds Ratio (M‐H, Fixed, 95% CI) | 0.41 [0.22, 0.77] |
| 6 Pneumonia during the treatment period Show forest plot | 8 | 283 | Odds Ratio (M‐H, Fixed, 95% CI) | 1.95 [1.18, 3.23] |
| Outcome or subgroup title | No. of studies | No. of participants | Statistical method | Effect size |
| 1 Death at final follow‐up Show forest plot | 1 | 33 | Odds Ratio (M‐H, Fixed, 95% CI) | 0.21 [0.04, 1.05] |
| 2 Death or severe disability at final follow‐up Show forest plot | 1 | 33 | Odds Ratio (M‐H, Fixed, 95% CI) | 0.10 [0.01, 1.00] |
| 3 Death or severe disability at various times during follow‐up Show forest plot | 1 | Odds Ratio (M‐H, Fixed, 95% CI) | Subtotals only | |
| 3.1 3 months | 0 | 0 | Odds Ratio (M‐H, Fixed, 95% CI) | 0.0 [0.0, 0.0] |
| 3.2 6 months | 1 | 33 | Odds Ratio (M‐H, Fixed, 95% CI) | 0.10 [0.01, 1.00] |
| 3.3 12 months | 0 | 0 | Odds Ratio (M‐H, Fixed, 95% CI) | 0.0 [0.0, 0.0] |
| 4 Death or severe disability stratified by quality Show forest plot | 1 | Odds Ratio (M‐H, Fixed, 95% CI) | Subtotals only | |
| 4.1 Concealed allocation, blinded outcome assessment | 0 | 0 | Odds Ratio (M‐H, Fixed, 95% CI) | 0.0 [0.0, 0.0] |
| 4.2 Concealed allocation, non‐blinded outcome assessment | 0 | 0 | Odds Ratio (M‐H, Fixed, 95% CI) | 0.0 [0.0, 0.0] |
| 4.3 Non‐concealed allocation, blinded outcome assessment | 1 | 33 | Odds Ratio (M‐H, Fixed, 95% CI) | 0.10 [0.01, 1.00] |
| 4.4 Non‐concealed allocation, non‐blinded outcome assessment | 0 | 0 | Odds Ratio (M‐H, Fixed, 95% CI) | 0.0 [0.0, 0.0] |
| 5 Death or severe disability stratified by treatment duration Show forest plot | 1 | Odds Ratio (M‐H, Fixed, 95% CI) | Subtotals only | |
| 5.1 24 hours | 0 | 0 | Odds Ratio (M‐H, Fixed, 95% CI) | 0.0 [0.0, 0.0] |
| 5.2 48 hours | 1 | 33 | Odds Ratio (M‐H, Fixed, 95% CI) | 0.10 [0.01, 1.00] |
| 6 Pneumonia during the treatment period Show forest plot | 1 | 22 | Odds Ratio (M‐H, Fixed, 95% CI) | 1.13 [0.18, 6.93] |