Les interventions dans les médias de masse pour la prévention du tabagisme chez les jeunes
Appendices
Appendix 1. Current search strategies
MEDLINE (most recent search via OVID, to 2016 May week 4)
1 exp Mass Media/
2 (mass adj1 media).ab,ti.
3 (radio or television or tv or campaign or advert$).ab,ti.
4 Newspapers/
5 advertising as topic.sh.
6 adverti#ing.mp.
7 Videotape Recording/
8 exp Telecommunications/
9 Radio/
10 Motion Pictures/
11 exp Audiovisual Aids/
12 1 or 2 or 3 or 4 or 5 or 6 or 7 or 8 or 9 or 10 or 11 [Review topic terms]
13 exp Smoking/ or exp Smoking Cessation/ or exp "Tobacco Use Disorder"/
14 exp Tobacco Smoke Pollution/ or exp Tobacco, Smokeless/
15 exp Tobacco Industry/
16 (smok$ or tobacco or cigarette$).mp.
17 (tobacco or cigarette$).mp.
18 17 or 13 or 15 or 14 [Smoking related terms]
19 18 and 12
20 limit 19 to ("child (6 to 12 years)" or "adolescent (13 to 18 years)" or "young adult (19 to 24 years)") [Limiting to young people]
21 limit 20 to yr="1997 ‐Current"
22 from 21 keep 1‐1131
23 RANDOMIZED‐CONTROLLED‐TRIAL.pt.
24 CONTROLLED‐CLINICAL‐TRIAL.pt.
25 CLINICAL‐TRIAL.pt.
26 Meta analysis.pt.
27 exp Clinical Trial/
28 Random‐Allocation/
29 randomized‐controlled trials/
30 double‐blind‐method/
31 single‐blind‐method/
32 placebos/
33 Research‐Design/
34 ((clin$ adj5 trial$) or placebo$ or random$).ti,ab
35 ((singl$ or doubl$ or trebl$ or tripl$) adj5 (blind$ or mask$)).ti,ab
36 (volunteer$ or prospectiv$).ti,ab
37 exp Follow‐Up‐Studies/
38 exp Retrospective‐Studies/
39 exp Prospective‐Studies/
40 exp Evaluation‐Studies/ or Program‐Evaluation.mp
41 exp Cross‐Sectional‐Studies/
42 exp Behavior‐therapy/
43 exp Health‐Promotion/
44 exp Community‐Health‐Services/
45 exp Health‐Education/
46 exp Health‐Behavior/
47 23 or 24 or 25 or 26 or 27 or 28 or 29 or 30 or 31 or 32 or 33 or 34 or 35 or 36 or 37 or 38 or 39 or 40 or 41 or 42 or 43 or 44 or 45 or 46 [Design related terms]
48 22 and 47
EMBASE (most recent search via OVID, 2016 week 22)
1 random$.ti,ab
2 factorial$.ti,ab
3 (cross over$ or crossover$ or cross‐over$).ti,ab
4 placebo$.ti,ab
5 (double$ adj blind$).ti,ab
6 (single$ adj blind$).ti,ab
7 assign$.ti,ab
8 allocat$.ti,ab
9 volunteer$.ti,ab
10 CROSSOVER PROCEDURE.sh
11 DOUBLE‐BLIND PROCEDURE.sh
12 RANDOMIZED CONTROLLED TRIAL.sh
13 SINGLE‐BLIND PROCEDURE.sh
14 or/1‐13 [Design related terms]
15 smoking cessation.mp
16 exp smoking cessation/
17 exp smoking‐/
18 ((quit$ or stop$ or ceas$ or giv$ or prevent$) adj smok$).mp
19 exp passive smoking/
20 exp smoking habit/
21 exp cigarette smoking/
22 or/15‐21 [Smoking related terms]
23 14 and 22
24 exp Mass Media/
25 (mass adj1 media).ab,ti
26 (radio or television or tv or campaign or advert$).ab,ti
27 Newspapers/
28 adverti#ing.mp
29 Videotape Recording/
30 exp Telecommunications/
31 Radio/
32 Motion Pictures/
33 exp Audiovisual Aids/
34 24 or 25 or 26 or 27 or 28 or 29 or 30 or 31 or 32 or 33 [Review topic terms]
35 exp Smoking/ or exp Smoking Cessation/ or exp "Tobacco Use Disorder"/
36 exp Tobacco Smoke Pollution/ or exp Tobacco, Smokeless/
37 exp Tobacco Industry/
38 (smok$ or tobacco or cigarette$).mp
39 (tobacco or cigarette$).mp
40 39 or 35 or 37 or 36 [Smoking related terms]
41 40 and 34
42 limit 41 to (infant <to one year> or child <unspecified age> or preschool child <1 to 6 years> or school child <7 to 12 years> or adolescent <13 to 17 years>) [Limiting to young people]
43 limit 42 to yr="1997 ‐Current"
44 23 and 43
Appendix 2. Search strategies for earlier versions of the review
Databases searched
Medline (1966‐1998), Healthstar (1975‐1998), Sociofile (1974‐1998), Econlit (1969‐1998), Psyclit (1967‐1998), CAB health (1973‐1998), DHSS‐Data (1983‐1998), Directory of Published Proceedings (1990‐1998), Management and Marketing Abstracts (1975‐1998), ABI Inform (August 1971 to 1998), ASSIA (Applied Social Sciences Index and Abstracts) (1987‐1998), Cancerlit (1963 to 1998), NTIS (1964‐1998), Diogenes (1976‐1998), Business and Industry (July 1994‐1998), PAIS (1972‐1998), Harvard Business Review (1971‐1998), Dissertation Abstracts (1861‐1998), Embase (1974‐1998), ERIC (1966‐1998), AV‐online (1964‐1998), LC‐MARC (1968‐1998), IBSS (1980‐1998), ECRI's International Health and Technology Assessment database (1990‐1998), British Humanities Index (1984‐1998), SIGLE (1980‐1998), CINAHL (1982‐1998), Conference Papers Index (1973‐1998), ASH (Action on Smoking and Health) Database (1987‐1998).
Search strategies
The following search strategy was used via Dialog OneSearch (Knight‐Ridder‐Info) on these databases: MEDLINE, Cancerlit, HealthSTAR, NTIS, DIOGENES, Business & Industry, Criminal Justice Periodical Index, PAIS INT (Public Affairs Information Service), Harvard Business Review, EMBASE:
S1 SMOKING!/DE
S2 SMOKING/DE
S3 SMOKING OR TOBACCO OR TOBACCO USE DISORDER/DE
S4 CIGARETTE?
S5 TOBACCO/DE OR DC=I1.825.710.810?
S6 S1‐S5
S7 YOUNG()PEOPLE OR CHILDREN OR JUVENILES OR GIRLS OR BOYS OR TEENAGER?
S8 ADOLESCEN? OR MINORS OR UNDER()AGE
S9 CHILD/DE OR ADOLESCENCE/DE OR DC=G1.360.35.20?
S10 TC=0017 OR TC=0016 OR TC=0022
S11 DC=G1.360.35.150? OR DC=L3.30? OR DC=L1.10.40? OR DC=L1.40‐
S12 DC=L3.10? OR DC=L1.10? OR DC=L1.40?
S13 S7‐S12
S15 RADIO OR TELEVISION OR TELEVISED OR AUDIOVISUAL OR MULTI()MEDIA
S16 TELECOMMUNICATIONS OR TV OR FILMS OR BROADCAST OR BROADCASTING
S17 MASS()MEDIA OR COMMUNICATIONS()MEDIA OR MOTION()PICTURES
S18 BROADCAST OR VIDEO?
S19 S15‐S18
S20 S6 AND S13 AND S19
The following basic search strategy was used on DataStar for these databases: PsycLit, CAB Health, ABI Inform, DHSS‐DATA, ASSI (Applied Social Science Index and Abstracts), Directory of Published Proceedings, Management and Marketing Abstracts.
1 smoking OR tobacco OR cigarette$ S
2 smokeless ADJ tobacco.DE. S
3 smoking ADJ cessation.DE. S
4 tobacco ADJ smoking.DE. S
5 nicotine.DE. S
6 1 OR 2 OR 3 OR 4 OR 5 S
7 children.DE. S
8 school ADJ age ADJ children.DE. S
9 adolescence.DE. S
10 adolescents.DE. S
11 preadolescents.DE. S
12 young ADJ people OR juveniles OR girls OR boys OR teenager$ OR kids S
13 adolescen$ OR minors OR under ADJ age S
14 7 OR 8 OR 9 OR 10 OR 11 OR 12 OR 13 S
15 mass ADJ media OR communications ADJ media OR motion ADJ pictures S
16 printed ADJ communications ADJ media OR radio OR television OR televised ADJ in
struction S
17 audiovisual ADJ instruction OR educational ADJ audiovisual ADJ aids OR educational ADJ television OR telecommunications ADJ media S
18 tv OR media OR multi ADJ media OR films S
19 television OR broadcast OR broadcasting S
20 15 OR 16 OR 17 OR 18 OR 19 S
21 6 AND 14 AND 20
The following search was used on ERIC via DIALOG
S1 (SMOK??? OR CIGARETTE? OR CIGAR? OR TOBACCO) (5N)(CESSATION OR PREVENT??? OR REDUCE OR REDUCTION OR DETER OR DETERRENCE)
S2 (SMOK??? OR CIGARETTE? OR CIGAR? OR TOBACCO)(5N)(AVERT OR AVOIDANCE OR QUIT OR QUITTING OR STOP OR STOPPING)
S3 (SMOK??? OR CIGARETTE? OR CIGAR? OR TOBACCO) (5N)(MODIFYING OR MODIFY OR MODIFICATION)
S4 S1 OR S2 OR S3
S5 ADOLESCENT? OR TEENAGER? OR CHILDREN OR CHILD OR YOUNG()PEOPLE OR YOUNG()ADULT?
S6 S4 AND S5
Similar combinations of tobacco and smoking related, child and age related, and media related free text and keyword terms were used for the other individual databases listed.
Additional searches
Some journals identified from the original review's reference lists of retrieved papers or books were searched individually on the Social Science Citation Index (on the BIDS service) (1981 to July 1998) as special case journals. The journal title was searched and results were combined with the following search terms: smoking or cigarette or tobacco. The special case journals included: Health Communication; Journal of Consumer Research; Journal of Broadcasting and Electronic Media; Journal of Communication; Media, Culture and Society. The journal Tobacco Control was hand searched (1992 to Summer 1997). References were also located through the bibliographies of related papers, and through personal contact with content area specialists.
Appendix 3. Summary of intervention effectiveness
| Study ID/ n‐values | Intervention description: | Outcome Results: | |||||
| Smoking | Behaviours | Attitudes | Perceptions | Knowledge | Self‐efficacy | ||
| Clusters n = 2 (SMSAs) Individuals n = 1637 | RADIO: 30‐second radio messages (4 times during 4 weeks) covering 7 consequence messages RPEER: 60‐second radio messages and sweepstakes covering 7 consequence messages RTVPEER: 60‐second radio messages and TV broadcast of sweepstakes covering 3 consequence messages | No evidence of an effect | ‐ | No evidence of an effect | ‐ | ‐ | ‐ |
| Clusters n = 33 (nightclubs/bars) Individuals n = 3348 | Social Media: over 17,000 people attended a HAVOC event, > 11,000 likes on the HAVOC Facebook page, with over 17 direct mailings, 38 e‐mails and 41 text messages to the > 2950 unique addresses, 3000 e‐mail addresses and 1850 cell phones; The estimated reach of the campaign was 42,500 ‐ 45,000 individual occasions with almost 85,000 impressions by e‐mail | No evidence of an effect | ‐ | ‐ | ‐ | ‐ | ‐ |
| Clusters n = 47 (schools) Individuals n = 4134 | CR+TV: 2 x 1‐week TV segments (during evening news) separated by a 3‐week gap, plus classroom and homework activities for 2 weeks plus brochure from TV station CR‐Only: classroom and homework activities for 2 x 1‐week blocks separated by a 3‐week gap TV Only: 2 x 1‐week TV segments (during evening news) separated by a 3‐week gap plus brochure from TV station | No evidence of an effect | No evidence of an effect | Favours campaign | Favours campaign | Favours control | Favours control |
| Clusters n=2 (communities) Individuals n=2860 | 4‐year duration of 15 different TV spots, 8 different radio spots. (average of 190 TV, 350 cable and 350 radio broadcasts) Plus school‐based curriculum in fall of each year | Favours campaign | Favours campaign | Favours campaign | Favours campaign | ‐ | ‐ |
| Clusters n=98 (schools) Individuals n=23, 246 | 4‐year duration of 30‐ and 60‐second TV or radio messages were broadcast using purchased time with approximately 3 ‐ 4 exposures per week. Approximately 10 messages were chosen for each campaign in 2002. 5 additional messages were developed annually for each campaign in 2003 ‐ 2005 (60 total) | No evidence of an effect | No evidence of an effect | No evidence of an effect | No evidence of an effect | ‐ | ‐ |
| Clusters n = 2 (counties) Individuals n = 6234 | 3 annual blocks, first ‐years for 3 weeks, third year for 4 weeks of media messages via TV spots, cinema advertising (167 times), 3 different full‐time pages of newspaper ads and school posters (1140) | Favours campaign | Favours campaign | ‐ | ‐ | ‐ | ‐ |
| Clusters n = 100 (schools) Individuals ALERT n = 4276 ALERT Plus n = 4015 | ALERT: 6 months of intermittent school curricula, with 8 lessons in 7th grade and 3 lessons in 8th grade (2 more lessons were later added in 8th grade). Plus exposure to the NYADMC media campaign running from Jan ‐ June 1998 and Sept 1998 ‐ Spring 2004 ALERT Plus: Same school and media components as for ALERT, but with the addition of 5 booster class lessons in 9th grade and 5 in 10th grade | Favours campaign | ‐ | No evidence of an effect | No evidence of an effect | ‐ | No evidence of an effect |
| Clusters n = 93 (schools) Individuals n = 4005 | 3 blocks of 13‐week periods with 3‐month breaks in between, delivering 7 different 30‐second smoking prevention messages during after‐school hours and Saturday mornings (10 TV spots were purchased) | No evidence of an effect | ‐ | ‐ | ‐ | ‐ | ‐ |
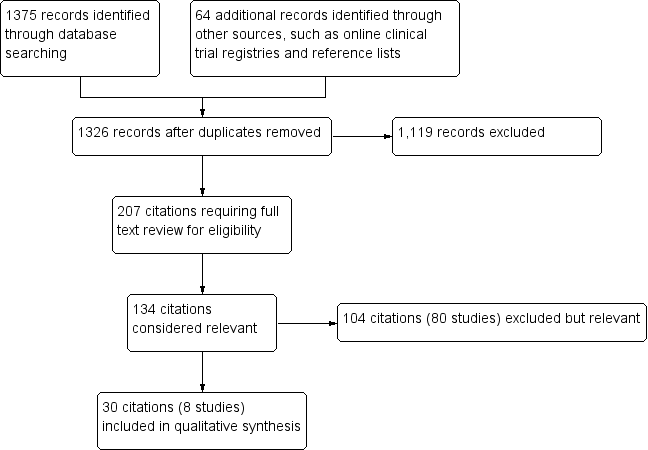
Study flow diagram.

Methodological quality graph: review authors' judgements about each methodological quality item presented as percentages across all included studies.
| Study | Sample size at follow‐up | Outcomes analyzed | Results |
| Bauman 1991 | Clusters n = 2 (SMSAs) Individuals n = 1637 | Weekly and ever‐smoking | Overall outcome ‐ No evidence of an effect Means of all smoking variables changed significantly in the direction of more smoking. No P values are significant (authors state that F > 1.00 in all instances). Data consistent with the conclusion that the campaign did not influence smoking. |
| Fallin 2015 | Clusters n = 33 (nightclubs/bars) Individuals n = 3348 | Daily and non‐daily smoking | Overall outcome ‐ No evidence of an effect Smoking rates did not change across the 3 time periods (P = 0.17), but partiers who recalled the HAVOC intervention had lower daily smoking (OR 0.30, 95% CI 0.10 to 0.95; P < 0.05), compared to those who did not recall the intervention |
| Flay 1995 | Clusters n = 47 (schools) Individuals n = 4134 | Smoker (No quantity) | Overall outcome ‐ No evidence of an effect There were no consistent programme effects on smoking outcomes, suggesting that the treatment was no more or less effective for different groups |
| Flynn 1995 | Clusters n = 2 (communities) Individuals n = 2860 | Daily, weekly and smokeless tobacco | Overall outcome ‐ Favours intervention Significant difference in the school‐and‐media group only within the final 2 years, a consistent trend toward less smoking was noted prior to this. In the 5th year the relative differences for daily smoking was 34% and for weekly smoking 35% between school‐and‐media and school‐only groups. For smokeless tobacco behaviour the 2 groups did not differ significantly, except in the 4th year when the school‐only group was more likely to report use. |
| Flynn 2010 | Clusters n = 98 (schools) Individuals n = 23,246 | Weekly and monthly | Overall outcome ‐ No evidence of an effect The 30‐day smoking rates appeared to decline over the 4‐year interval between baseline and follow‐up surveys for participants in both conditions, but this trend was not significant. Similar results were obtained for 7‐day prevalence. |
| Hafstad 1997 | Clusters n = 2 (counties) Individuals n = 6234 | Daily, weekly, monthly, non‐smoker and smoker (No quantity) | Overall outcome ‐ Favours intervention Among non‐smokers, a significantly lower proportion of adolescents of both genders had started to smoke in the intervention county compared to the proportion in the control county. Among those who were smokers at baseline, significantly more girls in the intervention county had stopped than in the control county, while no significant differences were detected among boys. |
| Longshore 2006 | Clusters n = 100 (schools) Individuals: ALERT n = 4276 ALERT Plus n = 4015 | Weekly and monthly | Overall outcome ‐ Favours intervention ALERT Plus held down current (past month) and regular (weekly) smoking producing a 23% reduction in both measures of use, P < 0.01. Project ALERT curbed current use among the high‐risk experimenters and the even higher‐risk baseline smokers (users) by approximately 20% (P < 0.03), and cut regular (weekly) cigarette use across all 3 groups by anywhere from 19% (P < 0.06) to 39% (P < 0.02). |
| Worden 1983 | Clusters n = 93 (schools) Individuals n = 4005 | Weekly | Overall outcome ‐ No evidence of an effect There were no significant differences in smoking between intervention and control groups. A trend (non‐significant) favouring the intervention group toward a lower level of smoking was noted. P values were not provided. |
Comparison 1 Primary outcomes for Mass media smoking prevention programmes, Outcome 1 Smoking outcomes.
| Study | Sample size at follow‐up | Outcomes analyzed | Results |
| Bauman 1991 | Clusters n = 2 (SMSAs) Individuals n = 1637 | Attitudes toward smoking (total), perceived peer attitudes | Overall outcome ‐ No evidence of an effect No statistically significant post‐campaign differences in attitudes, suggesting that the peer‐involvement component did not impact on those characteristics. |
| Flay 1995 | Clusters n = 47 (schools) Individuals n = 4134 | Disadvantages/negatives (toward parental smoking) | Overall outcome ‐ Favours intervention Marginally significant overall effect (P < 0.06), but there was a significant interaction between television and social resistance conditions at immediate post‐test, (P < 0.03). In San Diego there was more positive change in the social resistance condition, (P < 0.003) toward disapproval of parental smoking (Intervention description 4 in Characteristics of included studies table). |
| Flynn 1995 | Clusters n = 2 (communities) Individuals n = 2860 | Attitude toward smoking (total), advantages/positives, disadvantages/negatives | Overall outcome ‐ Favours intervention A significant difference in change over time was found between girls in the 2 treatment groups with scores increasing less among girls in the media‐school communities, for positive attitudes toward smoking (P < 0.02). |
| Flynn 2010 | Clusters n = 98 (schools) Individuals n = 23,246 | Advantages/positives, disadvantages/negatives | Overall outcome ‐ Favours control Positive outcome expectation scores increased significantly over time in both study groups, an unfavourable change. Negative outcome expectation scores may have decreased in the comparison but not in the intervention group, although this difference was not significant. |
| Longshore 2006 | Clusters n = 100 (schools) Individuals ALERT n = 4276 ALERT Plus n = 4015 | Advantages/positives, disadvantages/negatives, perceived peer attitudes | Overall outcome ‐ No evidence of an effect Neither boys nor girls exhibited significant differences for tobacco cognitions. |
Comparison 2 Intermediate outcomes for Mass media smoking prevention programmes, Outcome 1 Smoking attitudes.
| Study | Sample size at follow‐up | Outcomes analyzed | Results |
| Flay 1995 | Clusters n = 47 (schools) Individuals n = 4134 | Intentions to smoke | Overall outcome ‐ No evidence of an effect There were no significant condition‐related differences at any wave in Los Angeles or San Diego. No consistent programme effects on behaviours |
| Flynn 1995 | Clusters n = 2 (communities) Individuals n = 2860 | Intentions to smoke | Overall outcomes ‐ Favours intervention A significant difference in change over time was found between girls in the 2 treatment groups, with a lower increase among girls in the media‐school communities in intentions to smoke cigarettes (P < 0.01). |
| Flynn 2010 | Clusters n = 98 (schools) Individuals n = 23,246 | Intentions to smoke | Overall outcome ‐ No evidence of an effect Intentions to smoke appeared to decline over the 4‐year interval between baseline and follow‐up surveys for participants in both conditions, but this trend was not significant. |
| Hafstad 1997 | Clusters n = 2 (counties) Individuals n = 6234 | Intentions to smoke | Overall outcomes ‐ Favours intervention A significant difference between the intervention and the control counties was detected regarding expectation of future smoking habits measured in 1995. In the intervention county, 9% expected to be smokers in 3 years, with 13% in the control county (P < 0.01). No significant gender difference was revealed. |
Comparison 2 Intermediate outcomes for Mass media smoking prevention programmes, Outcome 2 Smoking intentions.
| Study | Sample size at follow‐up | Outcomes analyzed | Results |
| Flay 1995 | Clusters n = 47 (schools) Individuals n = 4134 | Tobacco and health knowledge (overall) | Overall outcome ‐ Favours control Tobacco and health knowledge was significantly higher in the attention control group than in any of the other conditions in Los Angeles at the immediate post‐test (P < 0.001), 1‐year follow‐up (P < 0.001) and 2‐year follow‐up (P < 0.001). However, both smokers and non‐smokers in the attention control condition learned more than students in any of the other conditions. Unexpectedly, tobacco and health knowledge also increased in the social resistances programme in San Diego at the immediate post‐test (P < 0.001). However, this effect was not statistically significant at the 1‐ and 2‐year follow‐ups. There were significant differences in the social influences and resistance skills knowledge scale between conditions in Los Angeles at the immediate post‐test (P < 0.001), 1‐year follow‐up (P < 0.001) and 2‐year follow‐up (P < 0.001). The combined television and social resistance condition did not improve as much, relative to the control conditions, as the social resistance condition. |
Comparison 2 Intermediate outcomes for Mass media smoking prevention programmes, Outcome 3 Smoking knowledge.
| Study | Sample size at follow‐up | Outcomes analyzed | Results |
| Flay 1995 | Clusters n = 47 (schools) Individuals n = 4134 (whole sample) n = 2245 for control sample only | Self‐efficacy | Overall outcome ‐ No evidence of an effect Refusal self‐efficacy did not differ significantly between groups for the primary population comparison. In Los Angeles, there were no significant condition‐related effects at any of the waves. In San Diego, refusal/self‐efficacy was unexpectedly improved in the control condition, relative to the social resistance condition, at the immediate post‐test, (P < 0.004). |
| Longshore 2006 | Clusters n=100 (schools) Individuals ALERT n=4276 ALERT Plus n=4015 | Self‐efficacy | Overall outcome ‐ No evidence of an effect Neither group exhibited significant differences for tobacco cognitions. |
Comparison 2 Intermediate outcomes for Mass media smoking prevention programmes, Outcome 4 Self‐esteem/self‐efficacy.
| Study | Sample size at follow‐up | Outcomes analyzed | Results |
| Flay 1995 | Clusters n = 47 (schools) Individuals n = 4134 | Perceived adult smoking, perceived peer smoking | Overall outcome ‐ Favours intervention There were significantly lower prevalence estimates, (peer) for the social resistance, (P < 0.001) and television (P < 0.006) conditions, and at 2 years the main effect of the social resistance conditions remained. However, the presence of a significant interaction between the television and social resistance conditions (P < 0.05) indicated that the lower prevalence estimates of the social resistance condition was increased in the television plus social resistance condition. |
| Flynn 1995 | Clusters n = 2 (communities) Individuals n = 2860 | Perceived norms, perceived adult smoking, perceived peer smoking, perceived sibling smoking. | Overall outcome ‐ Favours intervention A significant difference in change over time was found between girls in the 2 treatment groups with scores increasing less among girls in the media‐school communities, for perceived peer smoking (P < 0.01). This difference was likely due to the slightly older age and greater representation of boys in the school‐only group. A significant difference was evident at grades 5 to 7, that persisted at grades 8 to 10, for perceived norms (P < 0.01). |
| Flynn 2010 | Clusters n = 98 (schools) Individuals n = 23,246 | Perceived norms, perceived peer smoking | Overall outcome ‐ No evidence of an effect Significant favourable changes in both study groups for perceived prevalence and peer norms, but there were no between‐group differences |
| Longshore 2006 | Clusters n = 100 (schools) Individuals ALERT n = 4276 ALERT Plus n = 4015 | Perceived norms | Overall outcome ‐ No evidence of an effect Neither group exhibited significant differences for tobacco cognitions. |
Comparison 2 Intermediate outcomes for Mass media smoking prevention programmes, Outcome 5 Smoking perceptions.
| Mass media interventions for preventing smoking in young people | ||||
| Patient or population: Young people aged less than 25 years Settings: Schools, community groups, television, radio, newspapers, billboards, posters, leaflets or booklets Intervention: Mass media channels of communication intended to reach large numbers of people and which are not dependent on person‐to‐person contact Comparison: Usual care, minimal education, no intervention or co‐interventions | ||||
| Outcomes | Impact | No of Participants | Quality of the evidence | Comments |
| Smoking rates (follow‐up 18 months to 6 years) | 3 (n = 17,385), 1 which compared a mass media intervention to no intervention and 2 which evaluated mass media interventions as adjuncts to school‐based interventions, found that the mass media interventions reduced the smoking behaviour of young people. The remaining 5 studies (n = 72,740) did not detect a significant effect on smoking behaviour. These included 3 studies comparing a mass media intervention with no intervention, 1 study evaluating a mass media intervention as an adjunct to a school‐based intervention, and 1 interrupted time‐series study of a social media intervention. | 90,125 (8 studies) | ⊕⊝⊝⊝ | The 3 campaigns for which a significant effect was detected described a theoretical basis, used formative research in designing the campaign messages, and used message broadcast of reasonable intensity over extensive periods of time. However, some of the campaigns which did not detect an effect also exhibited these characteristics. |
| *The basis for the assumed risk (e.g. the median control group risk across studies) is provided in footnotes. The corresponding risk (and its 95% confidence interval) is based on the assumed risk in the comparison group and the relative effect of the intervention (and its 95% CI). | ||||
| GRADE Working Group grades of evidence | ||||
| 1Downgraded two levels due to serious risk of bias: all included studies were rated high risk of bias in at least four domains. | ||||
| Outcome or subgroup title | No. of studies | No. of participants | Statistical method | Effect size |
| 1 Smoking outcomes Show forest plot | Other data | No numeric data | ||
| Outcome or subgroup title | No. of studies | No. of participants | Statistical method | Effect size |
| 1 Smoking attitudes Show forest plot | Other data | No numeric data | ||
| 2 Smoking intentions Show forest plot | Other data | No numeric data | ||
| 3 Smoking knowledge Show forest plot | Other data | No numeric data | ||
| 4 Self‐esteem/self‐efficacy Show forest plot | Other data | No numeric data | ||
| 5 Smoking perceptions Show forest plot | Other data | No numeric data | ||