Amnioinfusión para la ruptura prematura de membranas en el tercer trimestre
Información
- DOI:
- https://doi.org/10.1002/14651858.CD000942.pub3Copiar DOI

- Base de datos:
-
- Cochrane Database of Systematic Reviews
- Versión publicada:
-
- 30 marzo 2014see what's new
- Tipo:
-
- Intervention
- Etapa:
-
- Review
- Grupo Editorial Cochrane:
-
Grupo Cochrane de Embarazo y parto
- Copyright:
-
- Copyright © 2014 The Cochrane Collaboration. Published by John Wiley & Sons, Ltd.
Cifras del artículo
Altmetric:
Citado por:
Autores
Contributions of authors
GJ Hofmeyr prepared the review and maintains it. For the 2011 update, G Essilfie‐Appiah assisted with the selection of studies and data extraction. T Lawrie assisted with study selection, data extraction and the text of the updated review. For the 2014 update, AC Eke assisted with the selection of studies, data extraction and the text of the updated review.
Sources of support
Internal sources
-
University of the Witwatersrand, South Africa.
External sources
-
South African Medical research Council, South Africa.
-
UNDP/UNFPA/WHO/World Bank (HRP), Switzerland.
Declarations of interest
None known.
Acknowledgements
Sara Roden‐Scott, Julieta Mattera and Nadia Bondarczuk for providing a translation for the Spanish trial report of Mino 1999.
Version history
| Published | Title | Stage | Authors | Version |
| 2014 Mar 30 | Amnioinfusion for third trimester preterm premature rupture of membranes | Review | G Justus Hofmeyr, Ahizechukwu C Eke, Theresa A Lawrie | |
| 2011 Dec 07 | Amnioinfusion for preterm premature rupture of membranes | Review | G Justus Hofmeyr, George Essilfie‐Appiah, Theresa A Lawrie | |
| 1998 Jan 26 | Amnioinfusion for preterm rupture of membranes | Review | G Justus Hofmeyr | |
Differences between protocol and review
In order to eliminate overlap between this review and a separate review (Van Teeffelen 2013), the title of this review has been changed from "Amnioinfusion for preterm premature rupture of membranes" to "Amnioinfusion for third trimester preterm premature rupture of membranes".
Keywords
MeSH
Medical Subject Headings (MeSH) Keywords
Medical Subject Headings Check Words
Female; Humans; Pregnancy;
PICO
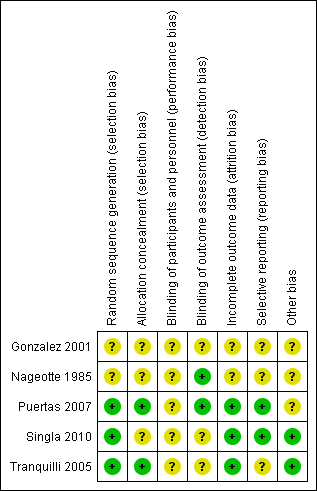
'Risk of bias' summary: review authors' judgements about each risk of bias item for each included study.

'Risk of bias' graph: review authors' judgements about each risk of bias item presented as percentages across all included studies.
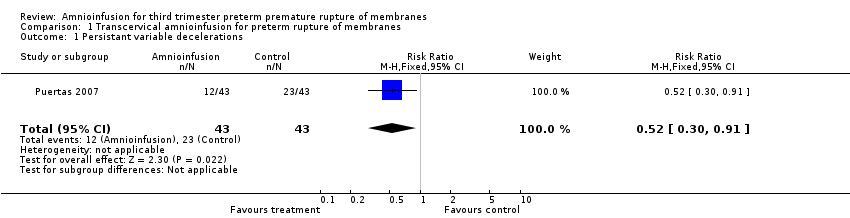
Comparison 1 Transcervical amnioinfusion for preterm rupture of membranes, Outcome 1 Persistant variable decelerations.

Comparison 1 Transcervical amnioinfusion for preterm rupture of membranes, Outcome 2 Severe variable decelerations per hour in first stage.
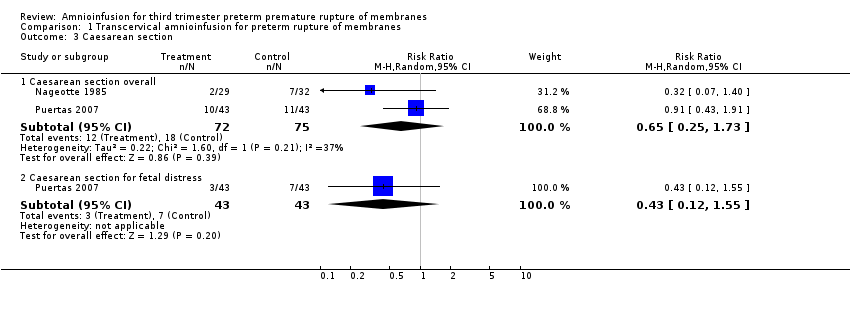
Comparison 1 Transcervical amnioinfusion for preterm rupture of membranes, Outcome 3 Caesarean section.

Comparison 1 Transcervical amnioinfusion for preterm rupture of membranes, Outcome 4 Forceps/vacuum assisted delivery.

Comparison 1 Transcervical amnioinfusion for preterm rupture of membranes, Outcome 5 1 minute Apgar score < 4.
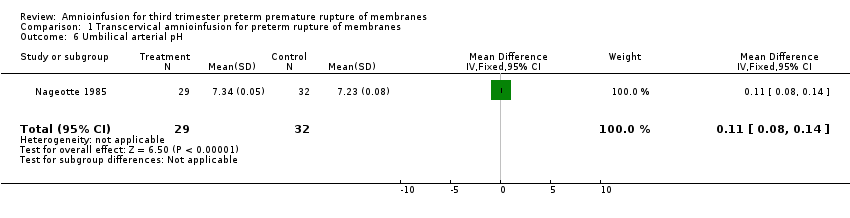
Comparison 1 Transcervical amnioinfusion for preterm rupture of membranes, Outcome 6 Umbilical arterial pH.

Comparison 1 Transcervical amnioinfusion for preterm rupture of membranes, Outcome 7 Umbilical pH ≤ 7.20.

Comparison 1 Transcervical amnioinfusion for preterm rupture of membranes, Outcome 8 Neonatal morbidity.

Comparison 1 Transcervical amnioinfusion for preterm rupture of membranes, Outcome 9 Neonatal death.
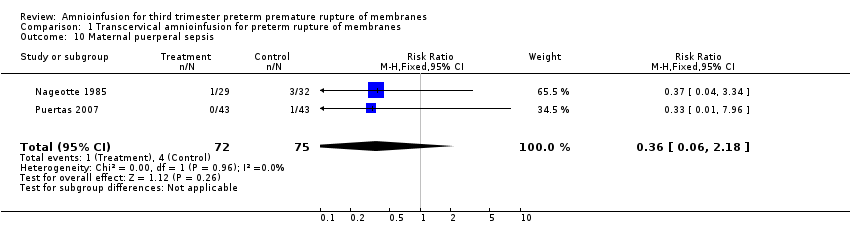
Comparison 1 Transcervical amnioinfusion for preterm rupture of membranes, Outcome 10 Maternal puerperal sepsis.
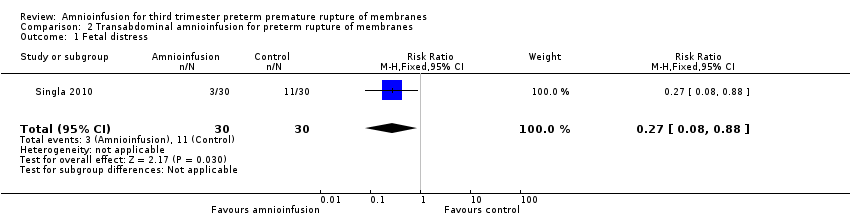
Comparison 2 Transabdominal amnioinfusion for preterm rupture of membranes, Outcome 1 Fetal distress.

Comparison 2 Transabdominal amnioinfusion for preterm rupture of membranes, Outcome 2 Gestational age at delivery (weeks).
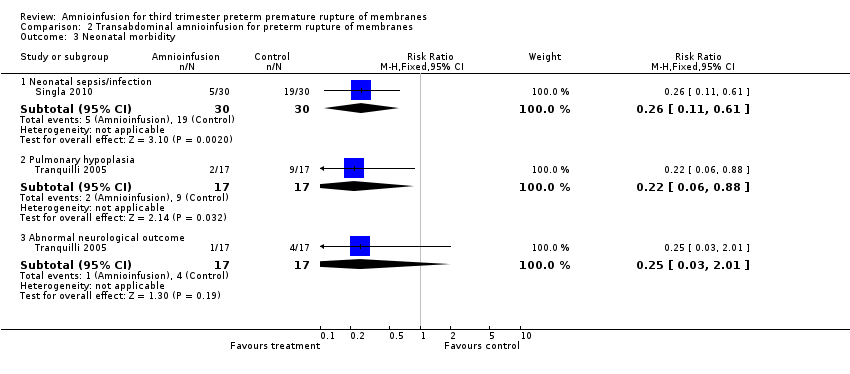
Comparison 2 Transabdominal amnioinfusion for preterm rupture of membranes, Outcome 3 Neonatal morbidity.
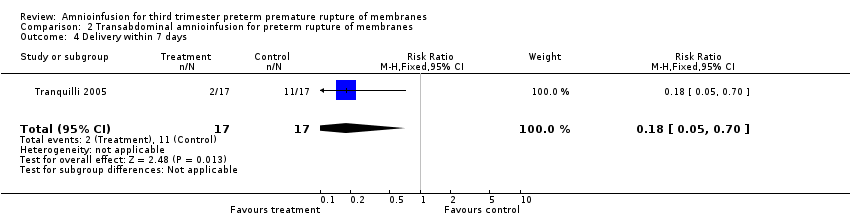
Comparison 2 Transabdominal amnioinfusion for preterm rupture of membranes, Outcome 4 Delivery within 7 days.

Comparison 2 Transabdominal amnioinfusion for preterm rupture of membranes, Outcome 5 Time to delivery (days).

Comparison 2 Transabdominal amnioinfusion for preterm rupture of membranes, Outcome 6 Admission to neonatal intensive care unit.
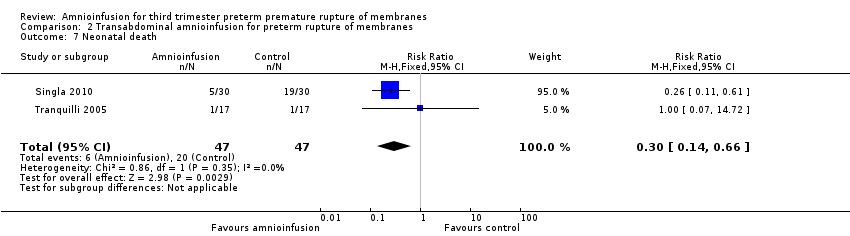
Comparison 2 Transabdominal amnioinfusion for preterm rupture of membranes, Outcome 7 Neonatal death.
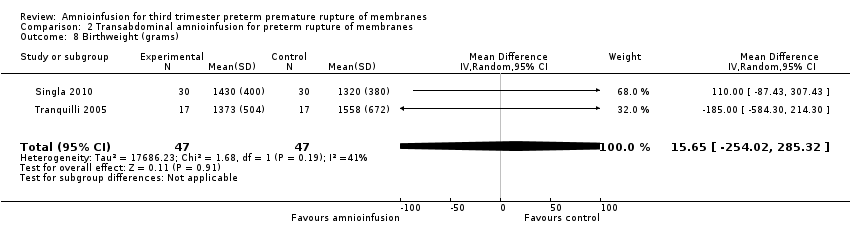
Comparison 2 Transabdominal amnioinfusion for preterm rupture of membranes, Outcome 8 Birthweight (grams).

Comparison 2 Transabdominal amnioinfusion for preterm rupture of membranes, Outcome 9 Maternal puerperal sepsis.
| Transabdominal amnioinfusion compared with no amnioinfusion for preterm rupture of membranes (PROM) | ||||
| Patient or population: pregnant women with PROM Settings: hospital Intervention: transabdominal amnioinfusion Comparison: no amnioinfusion | ||||
| Outcomes | Relative effect | No of Participants | Quality of the evidence | Comments |
| Neonatal death | RR 0.30 (0.14 ‐ 0.66) | 94 (two studies) | ⊕⊕⊕⊝ | Risk of neonatal death in the amnioinfusion group was 127 per 1000 compared to 426 per 1000 in the control group. |
| Neonatal sepsis/infection | RR 0.26 (0.11 ‐ 0.61) | 60 (one study*) | ⊕⊕⊕⊝ | *Sepsis defined as micro‐erythrocyte sedimentation rate > 5 mm, total leucocyte count < 5000, CRP > 6 mg/dL, platelet count < 100,000 or a positive blood culture within the first 48 hours. |
| Pulmonary hypoplasia | RR 0.22 (0.06 ‐ 0.88) | 34 (one study) | ⊕⊕⊝⊝ | Pulmonary hypoplasia was diagnosed according to strict clinical and radiological criteria, however, this study was small and blinding to group allocation was not described and so we downgraded this evidence from moderate to low. More evidence is needed. |
| Maternal puerperal sepsis | RR 0.20 (0.05 ‐ 0.84) | 60 (one study**) | ⊕⊕⊕⊝ | **Defined as fever > 38° C and a positive high vaginal swab culture. |
| GRADE Working Group grades of evidence CI: confidence interval; CRP: C‐reactive protein; RR: risk ratio | ||||
| Outcome or subgroup title | No. of studies | No. of participants | Statistical method | Effect size |
| 1 Persistant variable decelerations Show forest plot | 1 | 86 | Risk Ratio (M‐H, Fixed, 95% CI) | 0.52 [0.30, 0.91] |
| 2 Severe variable decelerations per hour in first stage Show forest plot | 1 | 61 | Mean Difference (IV, Fixed, 95% CI) | ‐1.2 [‐1.83, ‐0.57] |
| 3 Caesarean section Show forest plot | 2 | Risk Ratio (M‐H, Random, 95% CI) | Subtotals only | |
| 3.1 Caesarean section overall | 2 | 147 | Risk Ratio (M‐H, Random, 95% CI) | 0.65 [0.25, 1.73] |
| 3.2 Caesarean section for fetal distress | 1 | 86 | Risk Ratio (M‐H, Random, 95% CI) | 0.43 [0.12, 1.55] |
| 4 Forceps/vacuum assisted delivery Show forest plot | 1 | Risk Ratio (M‐H, Fixed, 95% CI) | Subtotals only | |
| 4.1 Overall | 1 | 86 | Risk Ratio (M‐H, Fixed, 95% CI) | 1.2 [0.58, 2.48] |
| 4.2 For fetal distress | 1 | 86 | Risk Ratio (M‐H, Fixed, 95% CI) | 0.11 [0.01, 2.00] |
| 5 1 minute Apgar score < 4 Show forest plot | 1 | 61 | Risk Ratio (M‐H, Fixed, 95% CI) | 0.28 [0.03, 2.33] |
| 6 Umbilical arterial pH Show forest plot | 1 | 61 | Mean Difference (IV, Fixed, 95% CI) | 0.11 [0.08, 0.14] |
| 7 Umbilical pH ≤ 7.20 Show forest plot | 1 | 86 | Risk Ratio (M‐H, Fixed, 95% CI) | 0.25 [0.06, 1.11] |
| 8 Neonatal morbidity Show forest plot | 1 | Risk Ratio (M‐H, Fixed, 95% CI) | Subtotals only | |
| 8.1 Overall | 1 | 86 | Risk Ratio (M‐H, Fixed, 95% CI) | 0.5 [0.19, 1.34] |
| 9 Neonatal death Show forest plot | 1 | 61 | Risk Ratio (M‐H, Fixed, 95% CI) | 0.55 [0.05, 5.77] |
| 10 Maternal puerperal sepsis Show forest plot | 2 | 147 | Risk Ratio (M‐H, Fixed, 95% CI) | 0.36 [0.06, 2.18] |
| Outcome or subgroup title | No. of studies | No. of participants | Statistical method | Effect size |
| 1 Fetal distress Show forest plot | 1 | 60 | Risk Ratio (M‐H, Fixed, 95% CI) | 0.27 [0.08, 0.88] |
| 2 Gestational age at delivery (weeks) Show forest plot | 2 | 94 | Mean Difference (IV, Random, 95% CI) | ‐0.49 [‐2.63, 1.65] |
| 3 Neonatal morbidity Show forest plot | 2 | Risk Ratio (M‐H, Fixed, 95% CI) | Subtotals only | |
| 3.1 Neonatal sepsis/infection | 1 | 60 | Risk Ratio (M‐H, Fixed, 95% CI) | 0.26 [0.11, 0.61] |
| 3.2 Pulmonary hypoplasia | 1 | 34 | Risk Ratio (M‐H, Fixed, 95% CI) | 0.22 [0.06, 0.88] |
| 3.3 Abnormal neurological outcome | 1 | 34 | Risk Ratio (M‐H, Fixed, 95% CI) | 0.25 [0.03, 2.01] |
| 4 Delivery within 7 days Show forest plot | 1 | 34 | Risk Ratio (M‐H, Fixed, 95% CI) | 0.18 [0.05, 0.70] |
| 5 Time to delivery (days) Show forest plot | 1 | 60 | Mean Difference (IV, Fixed, 95% CI) | 0.57 [‐2.86, 4.00] |
| 6 Admission to neonatal intensive care unit Show forest plot | 1 | 34 | Risk Ratio (M‐H, Fixed, 95% CI) | 1.0 [0.90, 1.12] |
| 7 Neonatal death Show forest plot | 2 | 94 | Risk Ratio (M‐H, Fixed, 95% CI) | 0.3 [0.14, 0.66] |
| 8 Birthweight (grams) Show forest plot | 2 | 94 | Mean Difference (IV, Random, 95% CI) | 15.65 [‐254.02, 285.32] |
| 9 Maternal puerperal sepsis Show forest plot | 1 | 60 | Risk Ratio (M‐H, Fixed, 95% CI) | 0.2 [0.05, 0.84] |