Derivaciones portosistémicas versus tratamiento endoscópico para las nuevas hemorragias por varices en pacientes con cirrosis
Información
- DOI:
- https://doi.org/10.1002/14651858.CD000553.pub2Copiar DOI

- Base de datos:
-
- Cochrane Database of Systematic Reviews
- Versión publicada:
-
- 18 octubre 2006see what's new
- Tipo:
-
- Intervention
- Etapa:
-
- Review
- Grupo Editorial Cochrane:
-
Grupo Cochrane de Hepatobiliar
- Copyright:
-
- Copyright © 2009 The Cochrane Collaboration. Published by John Wiley & Sons, Ltd.
Cifras del artículo
Altmetric:
Citado por:
Autores
Contributions of authors
SK designed and co‐ordinated the project, performed the literature search, wrote to authors, screened and identified relevant trials, developed the data extraction protocol, extracted data from eligible trials, performed quality assessment, entered data into Review Manager, and led the writing of the review.
CTS performed quality assessment, extracted data independently from eligible trials, provided statistical support, performed the survival analyses, and contributed to writing the review.
PW supervised the survival calculations, provided a methodological perspective, and contributed to writing the review.
RS conceived and supervised the project, secured funding, identified relevant trials, established consensus where there was initial divergence of opinion, provided an experienced clinical perspective, and finalised the writing of the review.
Sources of support
Internal sources
-
University Department of Surgery, University of Liverpool, UK.
External sources
-
European Commission (BMH4‐CT96‐0373), Belgium.
Declarations of interest
None known.
Acknowledgements
We are deeply indebted to Christian Gluud, Dimitrinka Nikolova, and Anne Gethe Hee of The Cochrane Hepato‐Biliary Group for their patience, help, and support.
Version history
| Published | Title | Stage | Authors | Version |
| 2020 Oct 22 | Portosystemic shunts versus endoscopic intervention with or without medical treatment for prevention of rebleeding in people with cirrhosis | Review | Rosa G Simonetti, Giovanni Perricone, Helen L Robbins, Narendra R Battula, Martin O Weickert, Robert Sutton, Saboor Khan | |
| 2006 Oct 18 | Portosystemic shunts versus endoscopic therapy for variceal rebleeding in patients with cirrhosis | Review | Saboor A Khan, Catrin Tudur Smith, Paula R Williamson, Robert Sutton | |
| 1997 Oct 20 | Portosystemic shunts versus endoscopic therapy for variceal rebleeding in patients with cirrhosis | Protocol | Saboor A Khan, Paula R Williamson, Robert Sutton, C Tudur, Catrin Tudur Smith | |
Notes
The protocol for this review was published under the title 'Shunts versus endoscopic therapy for long‐term management of variceal haemorrhage'. The authors find the new title 'Portosystemic shunts versus endoscopic therapy for variceal rebleeding in patients with cirrhosis' to better reflect the contents of the review.
Keywords
MeSH
Medical Subject Headings (MeSH) Keywords
- Endoscopy [*methods];
- Esophageal and Gastric Varices [prevention & control, *therapy];
- Gastrointestinal Hemorrhage [prevention & control, *therapy];
- Hepatic Encephalopathy [etiology];
- Liver Cirrhosis [*complications];
- Portasystemic Shunt, Surgical [adverse effects, *methods];
- Portasystemic Shunt, Transjugular Intrahepatic [adverse effects];
- Randomized Controlled Trials as Topic;
- Secondary Prevention;
- Splenorenal Shunt, Surgical [adverse effects];
Medical Subject Headings Check Words
Humans;
PICO

Funnel plot of shunt therapy versus endoscopic therapy, showing bias in favour of shunt therapy.

Funnel plot of shunt therapy versus endoscopic therapy, showing no bias in favour of shunt therapy on hepatic encephalopathy.
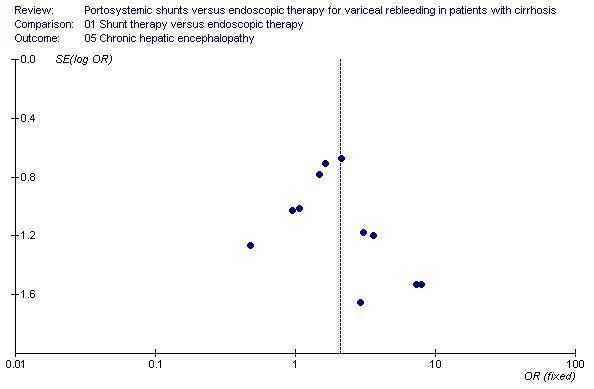
Funnel plot of shunt therapy versus endoscopic therapy, showing no bias in favour of shunt therapy on chronic hepatic encephalopathy.

Funnel plot of shunt therapy versus endoscopic therapy, showing no bias in favour of shunt therapy on mortality.
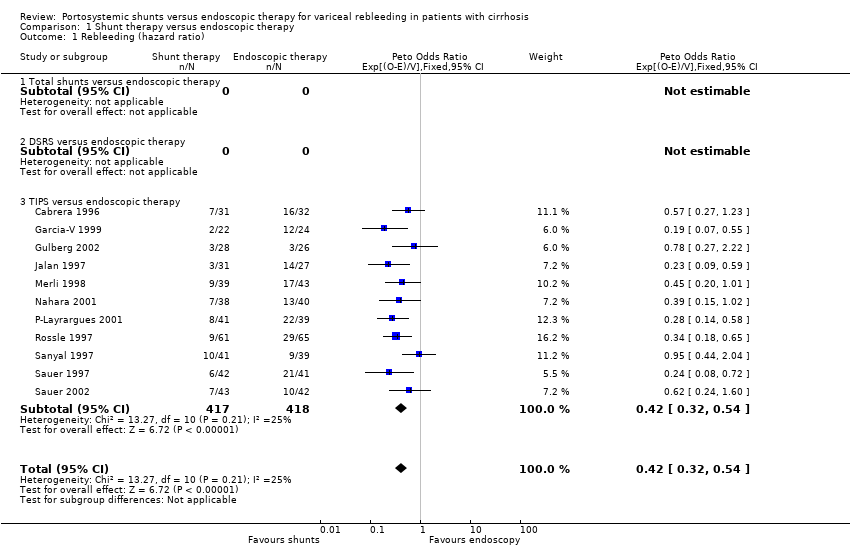
Comparison 1 Shunt therapy versus endoscopic therapy, Outcome 1 Rebleeding (hazard ratio).
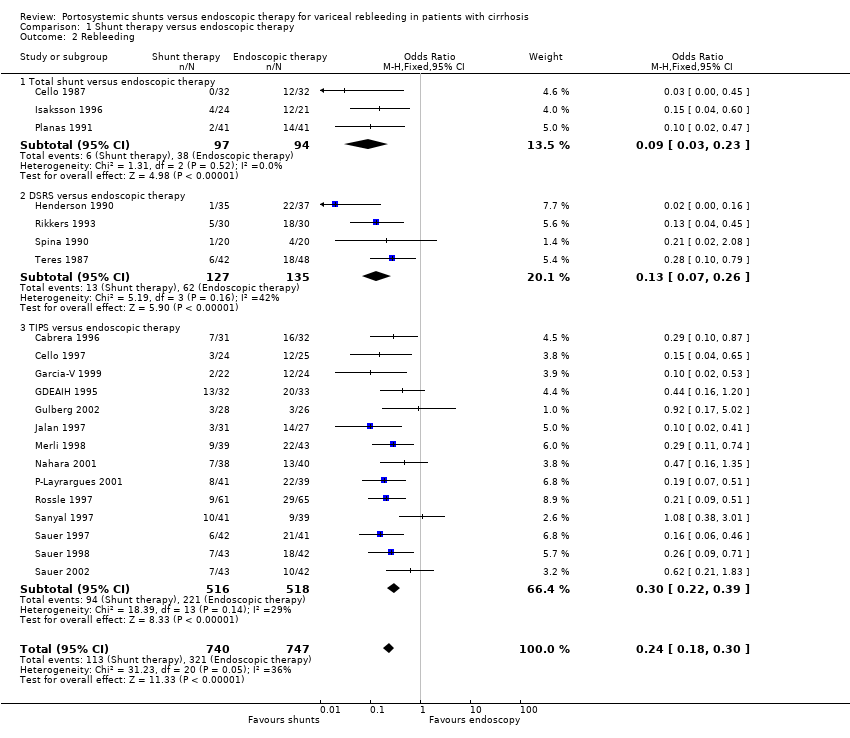
Comparison 1 Shunt therapy versus endoscopic therapy, Outcome 2 Rebleeding.

Comparison 1 Shunt therapy versus endoscopic therapy, Outcome 3 Development of hepatic encephalopathy (hazard ratio).

Comparison 1 Shunt therapy versus endoscopic therapy, Outcome 4 Hepatic encephaloapthy.

Comparison 1 Shunt therapy versus endoscopic therapy, Outcome 5 Chronic hepatic encephalopathy.
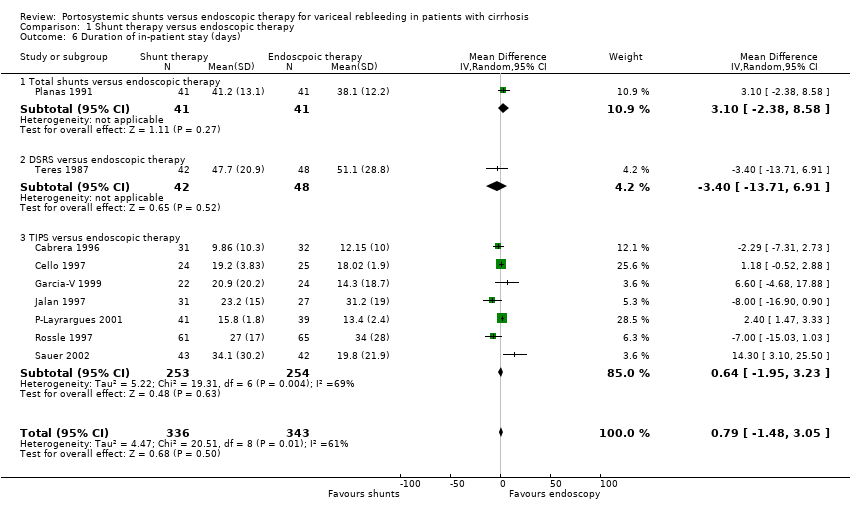
Comparison 1 Shunt therapy versus endoscopic therapy, Outcome 6 Duration of in‐patient stay (days).
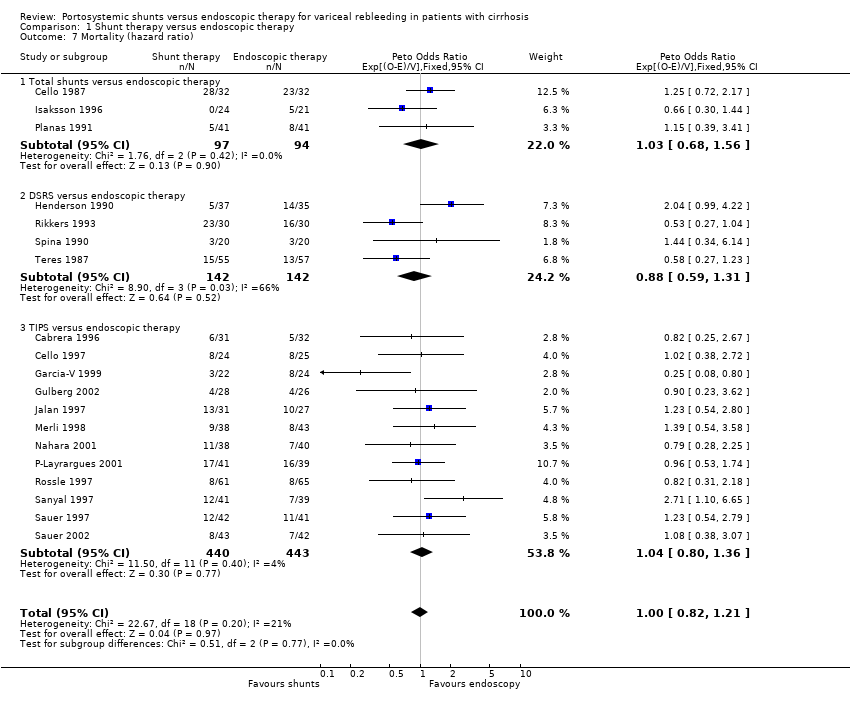
Comparison 1 Shunt therapy versus endoscopic therapy, Outcome 7 Mortality (hazard ratio).
| Trial | SH surveillance | SH dysfunction | SH complications | ET complications |
| Planas 1991 | Angiography or ultrasound 3‐10 months later or at the time of rebleeding. | 1/41 [percentage and 95% CI: 2(0.4 to 13)%] | Wound abscess 2, Sepsis 1, pneumonia 2, chylous pleural effusion 1, cholestasis 1 | Ulcers 3, stenosis 1, pneumonia 1, dysphagia 4. |
| Isaksson 1996 | Angiography at 4 months then annual ultrasound. | 1/24 [percentage and 95% CI: 4(0.7 to 20)%] | Oesophagitis 8. | Oesophageal stenosis 2, oesophagitis 7. |
| Cello 1987 | Not mentioned. | Not mentioned. | Not mentioned. | Not mentioned. |
| Trial | SH surveillance | SH dysfunction | SH complications | ET complications |
| Henderson 1990 | Not mentioned. | 1/35 [percentage and 95% CI: 3(0.5 to 15)%] | Not mentioned. | Not mentioned. |
| Rikkers 1993 | Angiography 3 months and then 1, 3, and 6 years. | 3/30 [percentage and 95% CI: 10(4 to 26)%] | Not mentioned. | Stenosis 2. |
| Spina 1990 | Angiography 10th day, 1, 3, and 6 months and then 6 monthly for 2 years. | 0/20 [percentage and 95% CI: 0(0 to 16)%] | Intestinal obstruction (one death). | Ulcers 2, stenosis 2, dysphagia 5. |
| Teres 1987 | Angiography or ultrasound or splenoportography 7 to 10 months after surgery or when rebleeding. | 6/43 [percentage and 95% CI: 14(7 to 27)%] | Not mentioned. | Ulcers 2, stenosis 3, dysphagia 15. |
| Trial | SH surveillance | SH dysfunction | SH complications | ET complications |
| Cabrera 1996 | Angiography 6 monthly. | 15/26 [percentage and 95% CI: 58(39 to 75)%] | Portal thrombosis 2, spontaneous bacterial peritonitis 2, haemobilia 1, sepsis 1. | Ulcers 5, stenosis 4, pneumonia 2, sepsis 1, spontaneous bacterial peritonitis 2. |
| Cello 1997 | Duplex ultrasound. | 4/22 [percentage and 95% CI: 18(7 to 39)%] | Not mentioned. | Not mentioned. |
| Garcia‐V 1999 | Angiography at 1 and 6 months. | 13/18 [percentage and 95% CI: 72(49 to 88)%] | Not mentioned. | Ulcers 5, stenosis 1. |
| Jalan 1997 | Duplex ultrasound at 1 week, angiography at 1 and 6 months, and then 6 monthly. | 9/28 [percentage and 95% CI: 32(18 to 51)%] | Sepsis 3, perforation of the capscule 1 (death). | Ulcers 12, sepsis 4, pneumonia 2. |
| Merli 1998 | Duplex ultrasound 6 monthly and angiography 6 monthly. | 21/33 [percentage and 95% CI: 64(47 to 78)%] | Haemolysis 1, intra‐hepatic haematoma 1, cardiac arrest 1, pulmonary embolism 1. | Ulcers 2, stenosis 2, pneumonia 1, stroke 1. |
| Rossle 1997 | Duplex ultrasound at 1, 3, 6, 9, and 12 months and then 6 monthly. | 18/60 [percentage and 95% CI: 30(20 to 43)%] | Stent migration 1, haemobilia 3, haemoperitoneum 2, bleeding in the liver 1 and sepsis 1. | Ulcers 8, dysphagia 5, mediastinitis 1, hypopyon 1. |
| Sanyal 1997 | Duplex ultrasound at day 1, first week, 1 and 3 months and then 3 monthly. | 20/34 [percentage and 95% CI: 59(42 to 74)%] | Haemolysis 5. | Ulcers 22, stenosis 3, dysphagia 5. |
| Sauer 1997 | Duplex ultrasound every 3 months and angiography every 3 months. | 29/42 [percentage and 95% CI: 69(54 to 81)%] | Shunt dislocation 4. | Ulcers 19, haemorrhage 5. |
| G‐P Layrargues 2001 | Duplex ultrasound at 24 hours and then 3 monthly for two years. | 24/41 [percentage and 95% CI: 59(43 to 72)%] | Haemoperitoneum causing death 1, 30 episodes of shunt dysfunction in 24. patients. | Sepsis 2. |
| GDEAIH 1995 | Information not reported in abstract. | Information not reported. | Information not reported. | Information not reported. |
| Sauer 1998 | Information not reported in abstract. | Reported as 56% after one year'. | Information not reported. | Information not reported. |
| Sauer 2002 | Angiography or Duplex scanning every 3 months. | Cumulative dysfunction 89% during follow‐up, re‐intervention rate 62%. | pneumonia (4 patients), haemobilia (2 patients), stent dislocation (1 patient). | Dysphagia 3, pneumonia 3, septicaemia 2, post‐therapeutic haemorrhage 2. |
| Gulberg 2002 | Three monthly doppler sonography. | Not mentioned. | Perforation of liver capsule 1 (death). | Perforation of oesophagus 1. |
| Nahara 2001 | Three monthly duplex scanning. | Shunt dysfunction 71%. | Haemobilia 2, segmental hepatic infarction 1. | Dysphagia 2, pleural effusion 6, oesophageal stenosis requiring dilatation 1. |
| Outcome or subgroup title | No. of studies | No. of participants | Statistical method | Effect size |
| 1 Rebleeding (hazard ratio) Show forest plot | 11 | 835 | Peto Odds Ratio (95% CI) | 0.42 [0.32, 0.54] |
| 1.1 Total shunts versus endoscopic therapy | 0 | 0 | Peto Odds Ratio (95% CI) | 0.0 [0.0, 0.0] |
| 1.2 DSRS versus endoscopic therapy | 0 | 0 | Peto Odds Ratio (95% CI) | 0.0 [0.0, 0.0] |
| 1.3 TIPS versus endoscopic therapy | 11 | 835 | Peto Odds Ratio (95% CI) | 0.42 [0.32, 0.54] |
| 2 Rebleeding Show forest plot | 21 | 1487 | Odds Ratio (M‐H, Fixed, 95% CI) | 0.24 [0.18, 0.30] |
| 2.1 Total shunt versus endoscopic therapy | 3 | 191 | Odds Ratio (M‐H, Fixed, 95% CI) | 0.09 [0.03, 0.23] |
| 2.2 DSRS versus endoscopic therapy | 4 | 262 | Odds Ratio (M‐H, Fixed, 95% CI) | 0.13 [0.07, 0.26] |
| 2.3 TIPS versus endoscopic therapy | 14 | 1034 | Odds Ratio (M‐H, Fixed, 95% CI) | 0.30 [0.22, 0.39] |
| 3 Development of hepatic encephalopathy (hazard ratio) Show forest plot | 10 | 725 | Peto Odds Ratio (95% CI) | 1.96 [1.47, 2.61] |
| 3.1 Total shunts versus endoscopic therapy | 0 | 0 | Peto Odds Ratio (95% CI) | 0.0 [0.0, 0.0] |
| 3.2 DSRS versus endoscopic therapy | 0 | 0 | Peto Odds Ratio (95% CI) | 0.0 [0.0, 0.0] |
| 3.3 TIPS versus endoscopic therapy | 10 | 725 | Peto Odds Ratio (95% CI) | 1.96 [1.47, 2.61] |
| 4 Hepatic encephaloapthy Show forest plot | 19 | 1338 | Odds Ratio (M‐H, Fixed, 95% CI) | 2.07 [1.59, 2.69] |
| 4.1 Total shunt versus endoscopic therapy | 3 | 179 | Odds Ratio (M‐H, Fixed, 95% CI) | 1.54 [0.67, 3.54] |
| 4.2 DSRS versus endoscopic therapy | 3 | 190 | Odds Ratio (M‐H, Fixed, 95% CI) | 1.75 [0.83, 3.69] |
| 4.3 TIPS versus endoscopic therapy | 13 | 969 | Odds Ratio (M‐H, Fixed, 95% CI) | 2.20 [1.63, 2.98] |
| 5 Chronic hepatic encephalopathy Show forest plot | 14 | 991 | Odds Ratio (M‐H, Fixed, 95% CI) | 2.09 [1.20, 3.62] |
| 5.1 Total shunts versus endoscopic therapy | 1 | 69 | Odds Ratio (M‐H, Fixed, 95% CI) | 7.89 [0.39, 158.73] |
| 5.2 DSRS versus endoscopic therapy | 4 | 245 | Odds Ratio (M‐H, Fixed, 95% CI) | 1.29 [0.51, 3.29] |
| 5.3 TIPS versus endoscopic therapy | 9 | 677 | Odds Ratio (M‐H, Fixed, 95% CI) | 2.45 [1.19, 5.03] |
| 6 Duration of in‐patient stay (days) Show forest plot | 9 | 679 | Mean Difference (IV, Random, 95% CI) | 0.79 [‐1.48, 3.05] |
| 6.1 Total shunts versus endoscopic therapy | 1 | 82 | Mean Difference (IV, Random, 95% CI) | 3.10 [‐2.38, 8.58] |
| 6.2 DSRS versus endoscopic therapy | 1 | 90 | Mean Difference (IV, Random, 95% CI) | ‐3.40 [‐13.71, 6.91] |
| 6.3 TIPS versus endoscopic therapy | 7 | 507 | Mean Difference (IV, Random, 95% CI) | 0.64 [‐1.95, 3.23] |
| 7 Mortality (hazard ratio) Show forest plot | 19 | 1358 | Peto Odds Ratio (95% CI) | 1.00 [0.82, 1.21] |
| 7.1 Total shunts versus endoscopic therapy | 3 | 191 | Peto Odds Ratio (95% CI) | 1.03 [0.68, 1.56] |
| 7.2 DSRS versus endoscopic therapy | 4 | 284 | Peto Odds Ratio (95% CI) | 0.88 [0.59, 1.31] |
| 7.3 TIPS versus endoscopic therapy | 12 | 883 | Peto Odds Ratio (95% CI) | 1.04 [0.80, 1.36] |