Bloqueadores de los canales de calcio para el fenómeno de Raynaud primario y secundario
Información
- DOI:
- https://doi.org/10.1002/14651858.CD000467.pub2Copiar DOI

- Base de datos:
-
- Cochrane Database of Systematic Reviews
- Versión publicada:
-
- 13 diciembre 2017see what's new
- Tipo:
-
- Intervention
- Etapa:
-
- Review
- Grupo Editorial Cochrane:
-
Grupo Cochrane de Salud musculoesquelética
- Copyright:
-
- Copyright © 2017 The Cochrane Collaboration. Published by John Wiley & Sons, Ltd.
Cifras del artículo
Altmetric:
Citado por:
Autores
Contributions of authors
Pope J ‐ Guarantor, coordinator; conceiving the review, designing search strategies, screening search results, obtaining and screening data on unpublished studies, providing general advice on the review, securing funding for the review, performing previous work that was the foundation of the current review.
Rirash F‐ collected data, assisted in designing the review, undertook searches, organized retrieval of papers, screened retrieved papers against inclusion criteria, appraised quality of papers, extracted data from papers, obtained and screened data on unpublished studies, managed data, entered data into RevMan version 5 (2014), analyzed and interpreted data, participated in writing the review.
Tingey P ‐ collected data, assisted in designing the review, undertook searches, organized retrieval of papers, screened retrieved papers against inclusion criteria, appraised quality of papers, extracted data from papers, obtained and screened data on unpublished studies, managed data, entered data into RevMan version 5 (2014), analyzed and interpreted data, participated in writing the review.
Harding S ‐ collected data, assisted in designing the review, undertook searches, organized retrieval of papers, screened retrieved papers against inclusion criteria, appraised quality of papers, extracted data from papers, obtained and screened data on unpublished studies, managed data, entered data into RevMan version 5 (2014), analyzed and interpreted data, participated in writing the review.
Maxwell L ‐ advised on and assisted with methods, data extraction, and calculations; commented on draft versions of the review.
Ghogomu E ‐ advised on and assisted with methods, data extraction, and calculations; commented on draft versions of the review.
Wells GA ‐ advised on methods, commented on draft versions of the review.
Tugwell P ‐ advised on methods, interpreted data, commented on draft versions of the review.
Sources of support
Internal sources
-
St. Joseph's Hospital, London, Ontario, Canada.
Pope Research Corporation
External sources
-
No sources of support supplied
Declarations of interest
JP: has consulted for Actelion, Mediquest, Pfizer, and United Therapeutics in the area of Raynaud's phenomenon and/or digital ulcers.
PTu: grants/honoraria from Bristol Myers and UCB.
FR: none known.
PTi: none known.
SH: none known.
LM: none known.
EG: none known.
GW: none known.
Acknowledgements
We are grateful to Ingrid Tows and the German Cochrane Centre for their services in translating a German study.
We also thank our reviewers for their valuable feedback and contributions to this review.
Version history
| Published | Title | Stage | Authors | Version |
| 2017 Dec 13 | Calcium channel blockers for primary and secondary Raynaud's phenomenon | Review | Fadumo Rirash, Paul C Tingey, Sarah E Harding, Lara J Maxwell, Elizabeth Tanjong Ghogomu, George A Wells, Peter Tugwell, Janet Pope | |
| 1996 Apr 22 | Calcium channel blockers for Raynaud's phenomenon in patients with scleroderma | Protocol | Janet Pope, D Fenlon, A Thompson, Dan Furst, Alan Silman, George A Wells, Paul C Tingey, Sarah E Harding | |
Differences between protocol and review
We used a generic protocol for pharmacological interventions for Raynaud's (Pope 2015). We have adjusted the text to reflect the specific interventions and controls assessed in this review. We added some post hoc analyses in this review that were not included in the registered protocol. We did plan to study: primary vs. secondary RP and RP from systemic sclerosis (as the scleroderma patients are more difficult to treat and have more severe and complicated RP), we planned to study subsets of CCBs (dihydropyridines and nifedipine in particular as we knew the bulk of the data was from nifedipine). All other subgroup analysis were post‐hoc.
Keywords
MeSH
Medical Subject Headings (MeSH) Keywords
- Calcium Channel Blockers [administration & dosage, *therapeutic use];
- Dihydropyridines [administration & dosage, therapeutic use];
- Nifedipine [administration & dosage, therapeutic use];
- Pain Management;
- Placebos [therapeutic use];
- Publication Bias;
- Randomized Controlled Trials as Topic;
- Raynaud Disease [*drug therapy, etiology];
- Severity of Illness Index;
Medical Subject Headings Check Words
Humans;
PICO

Flow diagram of study.
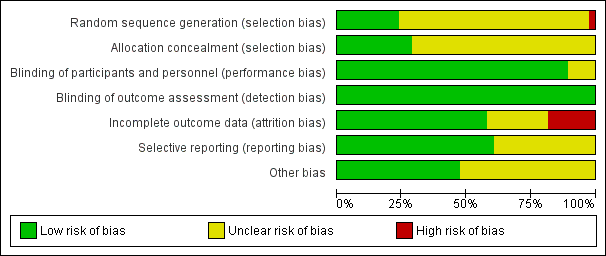
Risk of bias graph: review authors' judgements about each risk of bias item presented as percentages across all included studies.
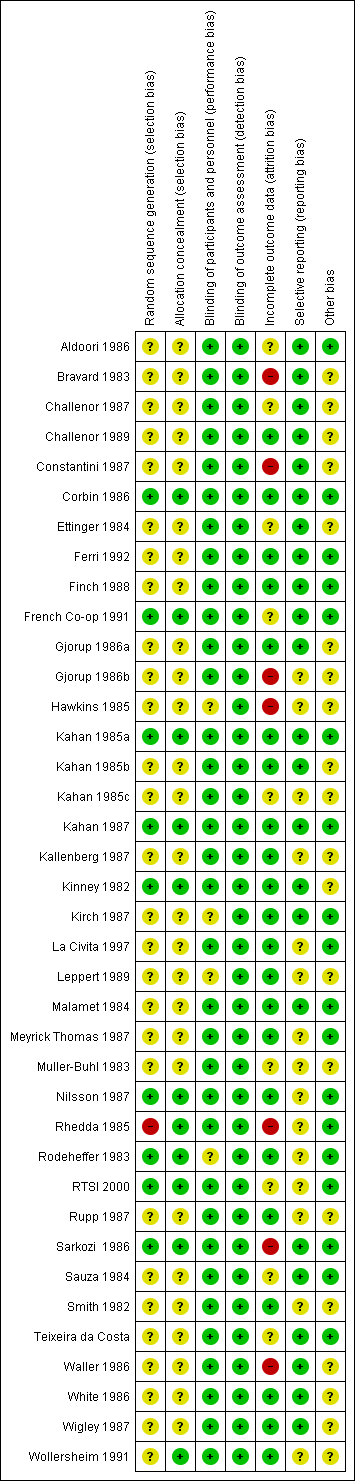
Risk of bias summary: review authors' judgements about each risk of bias item for each included study.
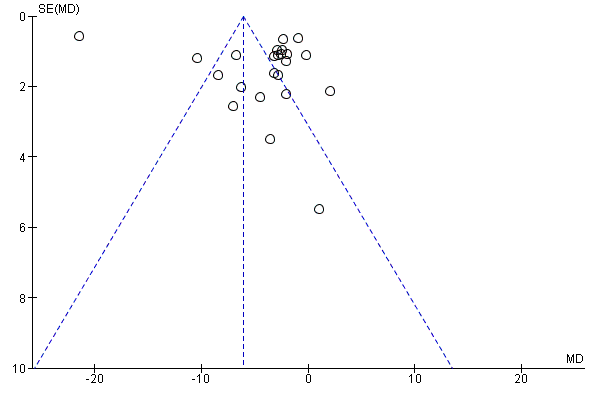
Funnel plot of comparison: 1 CCBs vs placebo (generic inverse variance method), outcome: 1.1 Frequency of attacks (average/week).
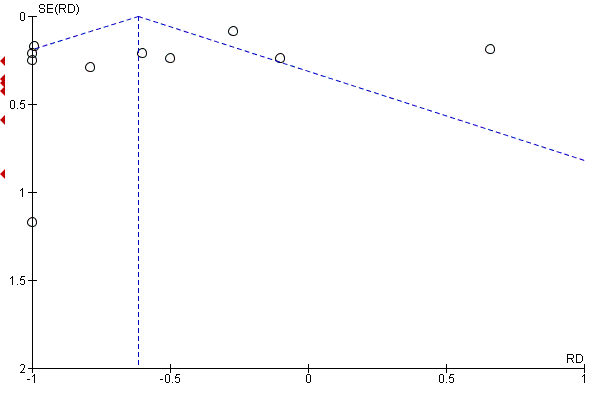
Funnel plot of comparison: 11 CCBs vs placebo (generic inverse variance method), outcome: 11.4 Severity of attacks (average, on a 10‐cm VAS).

Comparison 1 CCBs vs placebo (generic inverse variance method), Outcome 1 Frequency of attacks (average/week).
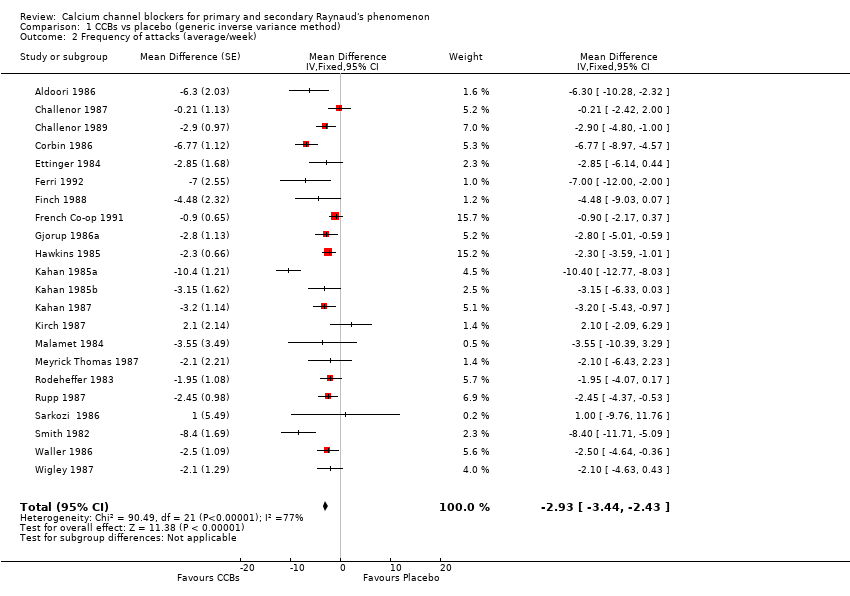
Comparison 1 CCBs vs placebo (generic inverse variance method), Outcome 2 Frequency of attacks (average/week).

Comparison 1 CCBs vs placebo (generic inverse variance method), Outcome 3 Duration of attacks (minutes).

Comparison 1 CCBs vs placebo (generic inverse variance method), Outcome 4 Severity of attacks (average, on a 10‐cm VAS).
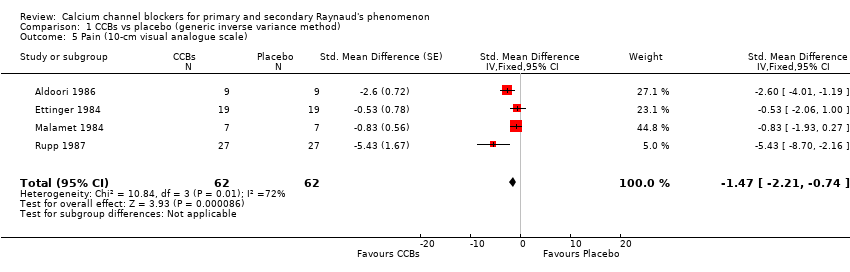
Comparison 1 CCBs vs placebo (generic inverse variance method), Outcome 5 Pain (10‐cm visual analogue scale).

Comparison 1 CCBs vs placebo (generic inverse variance method), Outcome 6 Patient global.
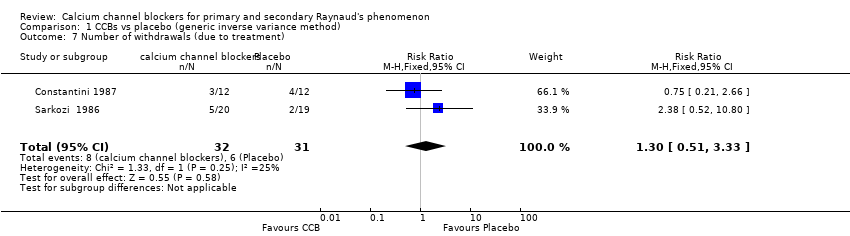
Comparison 1 CCBs vs placebo (generic inverse variance method), Outcome 7 Number of withdrawals (due to treatment).
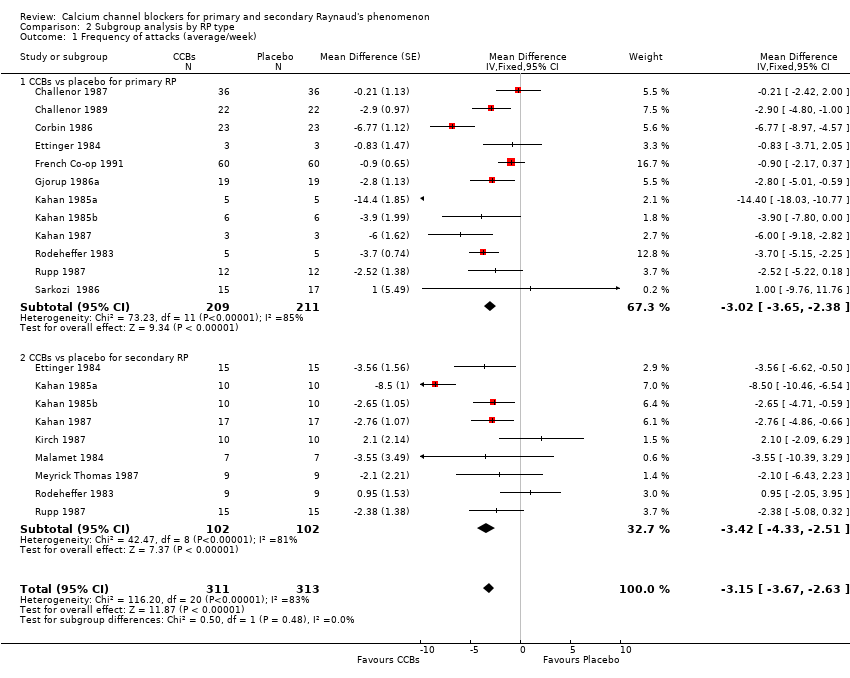
Comparison 2 Subgroup analysis by RP type, Outcome 1 Frequency of attacks (average/week).
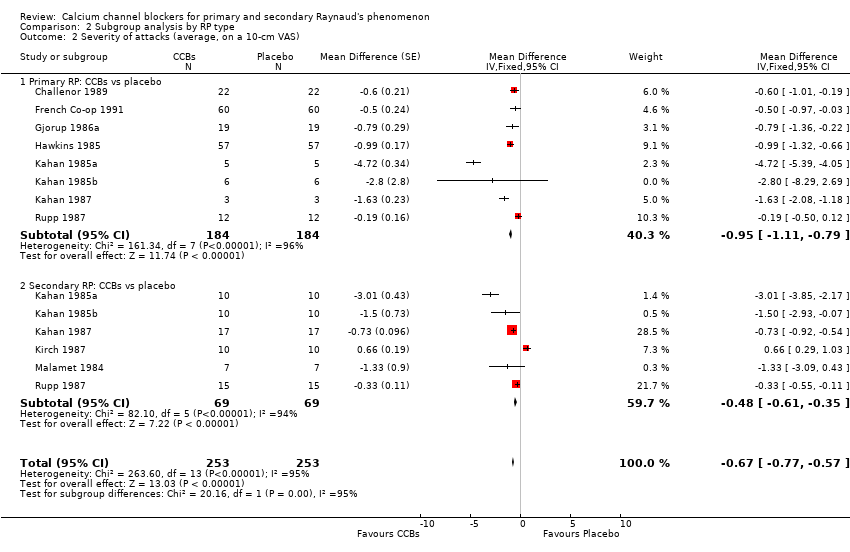
Comparison 2 Subgroup analysis by RP type, Outcome 2 Severity of attacks (average, on a 10‐cm VAS).

Comparison 3 Subgroup analysis: nifedipine versus placebo by RP type, Outcome 1 Frequency of attacks: nifedipine vs placebo by RP type.

Comparison 3 Subgroup analysis: nifedipine versus placebo by RP type, Outcome 2 Severity of attacks: nifedipine vs placebo by RP type.
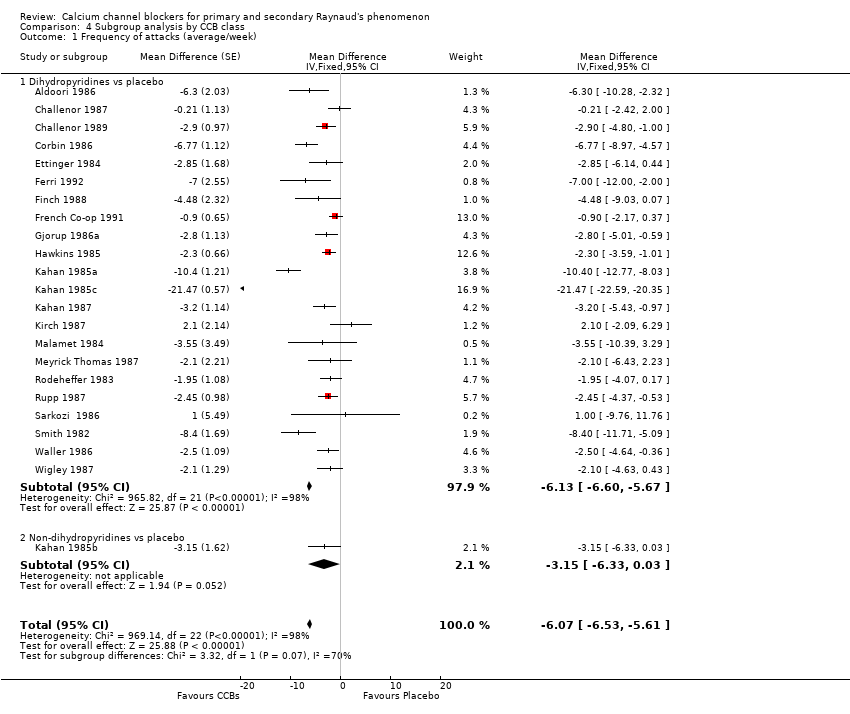
Comparison 4 Subgroup analysis by CCB class, Outcome 1 Frequency of attacks (average/week).
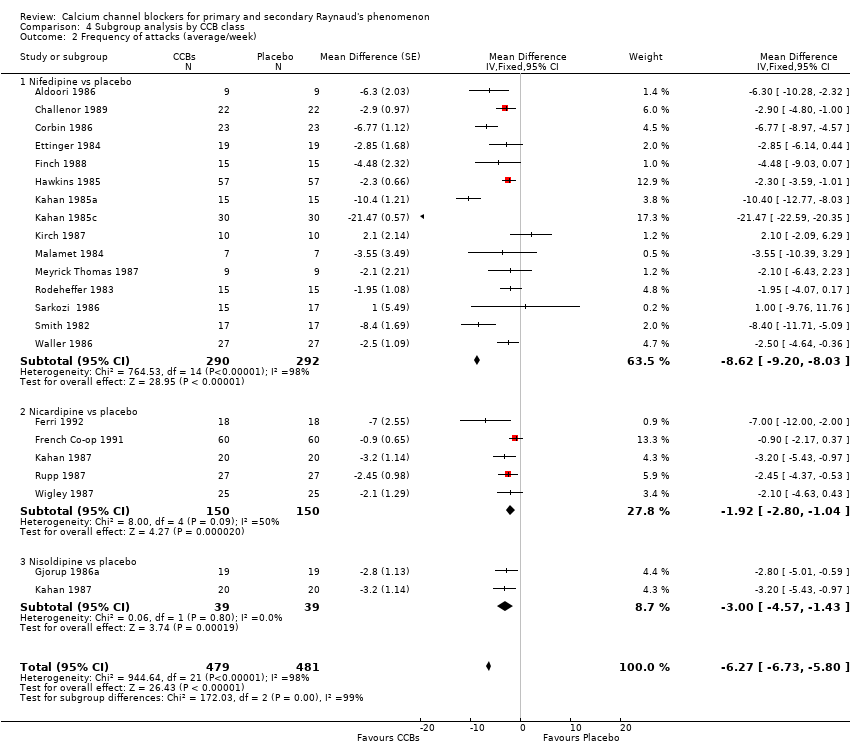
Comparison 4 Subgroup analysis by CCB class, Outcome 2 Frequency of attacks (average/week).
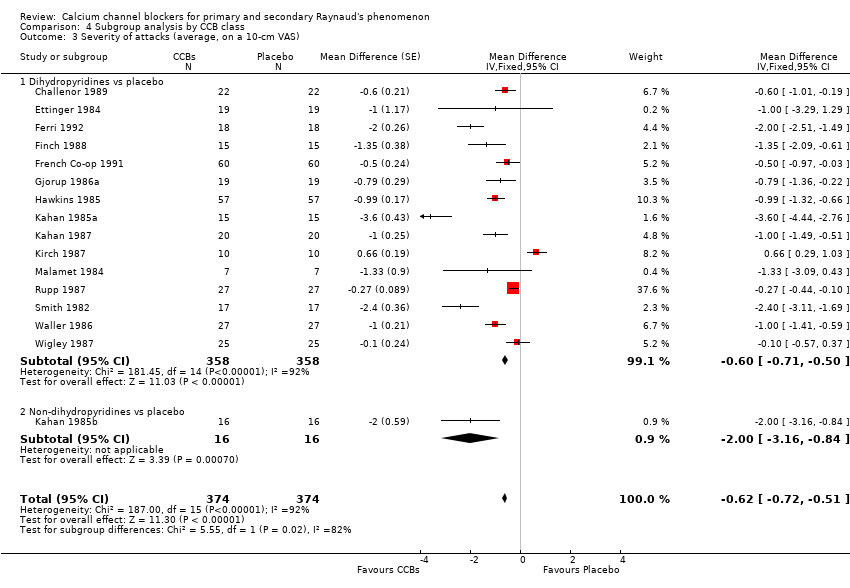
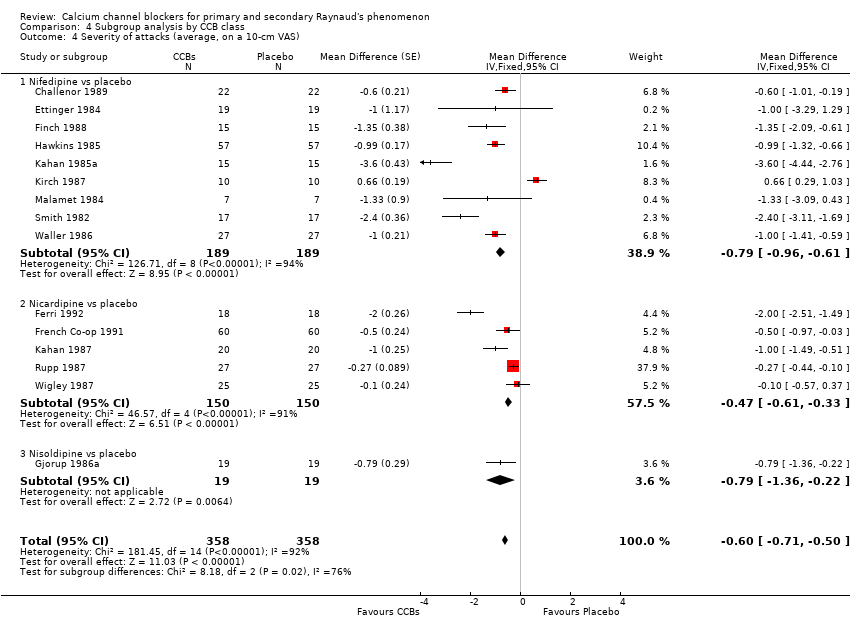
Comparison 4 Subgroup analysis by CCB class, Outcome 3 Severity of attacks (average, on a 10‐cm VAS).
Comparison 4 Subgroup analysis by CCB class, Outcome 4 Severity of attacks (average, on a 10‐cm VAS).

Comparison 5 Subgroup analysis by CCB dose, Outcome 1 Frequency of attacks (average/week).
Comparison 5 Subgroup analysis by CCB dose, Outcome 2 Duration of attacks (minutes).

Comparison 5 Subgroup analysis by CCB dose, Outcome 3 Severity of attacks (average, on a 10‐cm VAS).
Comparison 5 Subgroup analysis by CCB dose, Outcome 4 Pain (10‐cm visual analogue scale).

Comparison 5 Subgroup analysis by CCB dose, Outcome 5 Patient global.

Comparison 6 Minor outcomes, Outcome 1 Number of participants with improvement.
Comparison 6 Minor outcomes, Outcome 2 Side effects.
| Calcium channel blockers (CCBs) compared with placebo for treatment of Raynaud's phenomenon | ||||||
| Patient or population: patients with Raynaud's phenomenon | ||||||
| Outcomes | Illustrative comparative risks* (95% CI) | Relative effect | No. of participants | Quality of the evidence | Comments | |
| Assumed risk | Corresponding risk | |||||
| Placebo | CCBs (all) | |||||
| Frequency of attacks | Mean frequency of attacks in control groups: 13.7 attacksa | Mean frequency of attacks in intervention groups: 6.13 lower (6.60 to 5.67 lower)b | 528 | ⊕⊕⊕⊝ moderatec | Note: Excluding a study with a very large reduction in frequency of attacks changed the mean difference to ‐2.93 per week (95% CI ‐3.44 to ‐2.43). Absolute risk difference: N/Ad Relative percent change: ‐44% (95% CI ‐48% to ‐41%) | |
| Duration of attacks Average duration per attack measured in minutes | Mean duration of attacks in control groups: | Mean duration of attacks in intervention groups: (‐3.29 to 0) | 69 | ⊕⊕⊝⊝ lowc,e | NNTB: N/Ad Absolute risk difference: N/Ad Relative percent change: ‐9% (95% CI ‐18% to 0%) | |
| Severity of attacks | Mean severity of attacks in control groups: | Mean severity of attacks in intervention groups: | 415 | ⊕⊕⊕⊝ moderatec | NNTB: N/Ad Absolute risk difference: ‐6% (95% CI ‐7% to ‐5%) Relative percent change: ‐9% (95% CI ‐11% to ‐8%) | |
| Pain Average pain per attack, measured on a 10‐cm visual analogue scale (0 = no pain, 10 = maximal pain) | Mean pain in control groups: | Mean pain in intervention groups: | 62 | ⊕⊕⊝⊝ lowc,e | N/Ad Absolute risk difference: ‐15% (95% CI ‐22% to ‐7%) Relative percent change: ‐47% (95% CI ‐71% to ‐24%) | |
| Patient global Follow‐up: 5 weeks | Mean patient global in control group: 3.9 cma | Mean patient global in intervention groups: | 92 | ⊕⊕⊕⊝ moderatee | NNTB: N/Af Absolute risk difference: ‐4% (95% CI ‐7% to 0%) Relative percent change: ‐9% (95% CI ‐19% to 0%) | |
| Number of withdrawals due to adverse events | 194 per 1000 | 252 per 1000 | RR 1.30 | 63 | ⊕⊕⊝⊝ lowe,g | NNTH: N/Af Absolute risk reduction: 6% (95% CI ‐14% to 26%) Relative percent change: 30% (95% CI ‐49% to 233%) |
| Serious adverse events | See comment. | See comment. | Not estimable | 0 | See comment. | No serious adverse events reported |
| *The basis for the assumed risk (eg, median control group risk across studies) is provided in footnotes. The corresponding risk (and its 95% confidence interval) is based on the assumed risk in the comparison group and the relative effect of the intervention (and its 95% CI). | ||||||
| GRADE Working Group grades of evidence. | ||||||
| aFinal value: weighted mean of scores in placebo group across studies in the meta‐analysis. | ||||||
| Outcome or subgroup title | No. of studies | No. of participants | Statistical method | Effect size |
| 1 Frequency of attacks (average/week) Show forest plot | 23 | 1024 | Mean Difference (Fixed, 95% CI) | ‐6.07 [‐6.53, ‐5.61] |
| 2 Frequency of attacks (average/week) Show forest plot | 22 | Mean Difference (Fixed, 95% CI) | ‐2.93 [‐3.44, ‐2.43] | |
| 3 Duration of attacks (minutes) Show forest plot | 6 | 138 | Mean Difference (Fixed, 95% CI) | ‐1.67 [‐3.29, ‐0.04] |
| 4 Severity of attacks (average, on a 10‐cm VAS) Show forest plot | 16 | 748 | Risk Difference (Fixed, 95% CI) | ‐0.62 [‐0.72, ‐0.51] |
| 5 Pain (10‐cm visual analogue scale) Show forest plot | 4 | 124 | Std. Mean Difference (Fixed, 95% CI) | ‐1.47 [‐2.21, ‐0.74] |
| 6 Patient global Show forest plot | 2 | 192 | Std. Mean Difference (Fixed, 95% CI) | ‐0.37 [‐0.73, ‐0.02] |
| 7 Number of withdrawals (due to treatment) Show forest plot | 2 | 63 | Risk Ratio (M‐H, Fixed, 95% CI) | 1.30 [0.51, 3.33] |
| Outcome or subgroup title | No. of studies | No. of participants | Statistical method | Effect size |
| 1 Frequency of attacks (average/week) Show forest plot | 15 | 624 | Mean Difference (Fixed, 95% CI) | ‐3.15 [‐3.67, ‐2.63] |
| 1.1 CCBs vs placebo for primary RP | 12 | 420 | Mean Difference (Fixed, 95% CI) | ‐3.02 [‐3.65, ‐2.38] |
| 1.2 CCBs vs placebo for secondary RP | 9 | 204 | Mean Difference (Fixed, 95% CI) | ‐3.42 [‐4.33, ‐2.51] |
| 2 Severity of attacks (average, on a 10‐cm VAS) Show forest plot | 10 | 506 | Mean Difference (Fixed, 95% CI) | ‐0.67 [‐0.77, ‐0.57] |
| 2.1 Primary RP: CCBs vs placebo | 8 | 368 | Mean Difference (Fixed, 95% CI) | ‐0.95 [‐1.11, ‐0.79] |
| 2.2 Secondary RP: CCBs vs placebo | 6 | 138 | Mean Difference (Fixed, 95% CI) | ‐0.48 [‐0.61, ‐0.35] |
| Outcome or subgroup title | No. of studies | No. of participants | Statistical method | Effect size |
| 1 Frequency of attacks: nifedipine vs placebo by RP type Show forest plot | 9 | 268 | Mean Difference (Fixed, 95% CI) | ‐4.34 [‐5.09, ‐3.59] |
| 1.1 Nifedipine vs placebo for primary RP | 6 | 148 | Mean Difference (Fixed, 95% CI) | ‐4.42 [‐5.35, ‐3.50] |
| 1.2 Nifedipine vs placebo for secondary RP | 6 | 120 | Mean Difference (Fixed, 95% CI) | ‐4.19 [‐5.47, ‐2.91] |
| 2 Severity of attacks: nifedipine vs placebo by RP type Show forest plot | 4 | 108 | Mean Difference (Fixed, 95% CI) | ‐0.82 [‐1.07, ‐0.58] |
| 2.1 Primary RP | 2 | 54 | Mean Difference (Fixed, 95% CI) | ‐1.74 [‐2.09, ‐1.39] |
| 2.2 Secondary RP | 3 | 54 | Mean Difference (Fixed, 95% CI) | 0.01 [‐0.32, 0.34] |
| Outcome or subgroup title | No. of studies | No. of participants | Statistical method | Effect size |
| 1 Frequency of attacks (average/week) Show forest plot | 23 | Mean Difference (Fixed, 95% CI) | ‐6.07 [‐6.53, ‐5.61] | |
| 1.1 Dihydropyridines vs placebo | 22 | Mean Difference (Fixed, 95% CI) | ‐6.13 [‐6.60, ‐5.67] | |
| 1.2 Non‐dihydropyridines vs placebo | 1 | Mean Difference (Fixed, 95% CI) | ‐3.15 [‐6.33, 0.03] | |
| 2 Frequency of attacks (average/week) Show forest plot | 21 | 960 | Mean Difference (Fixed, 95% CI) | ‐6.27 [‐6.73, ‐5.80] |
| 2.1 Nifedipine vs placebo | 15 | 582 | Mean Difference (Fixed, 95% CI) | ‐8.62 [‐9.20, ‐8.03] |
| 2.2 Nicardipine vs placebo | 5 | 300 | Mean Difference (Fixed, 95% CI) | ‐1.92 [‐2.80, ‐1.04] |
| 2.3 Nisoldipine vs placebo | 2 | 78 | Mean Difference (Fixed, 95% CI) | ‐1.00 [‐4.57, ‐1.43] |
| 3 Severity of attacks (average, on a 10‐cm VAS) Show forest plot | 16 | 748 | Mean Difference (Fixed, 95% CI) | ‐0.62 [‐0.72, ‐0.51] |
| 3.1 Dihydropyridines vs placebo | 15 | 716 | Mean Difference (Fixed, 95% CI) | ‐0.60 [‐0.71, ‐0.50] |
| 3.2 Non‐dihydropyridines vs placebo | 1 | 32 | Mean Difference (Fixed, 95% CI) | ‐2.0 [‐3.16, ‐0.84] |
| 4 Severity of attacks (average, on a 10‐cm VAS) Show forest plot | 15 | 716 | Mean Difference (Fixed, 95% CI) | ‐0.60 [‐0.71, ‐0.50] |
| 4.1 Nifedipine vs placebo | 9 | 378 | Mean Difference (Fixed, 95% CI) | ‐0.79 [‐0.96, ‐0.61] |
| 4.2 Nicardipine vs placebo | 5 | 300 | Mean Difference (Fixed, 95% CI) | ‐0.47 [‐0.61, ‐0.33] |
| 4.3 Nisoldipine vs placebo | 1 | 38 | Mean Difference (Fixed, 95% CI) | ‐0.79 [‐1.36, ‐0.22] |
| Outcome or subgroup title | No. of studies | No. of participants | Statistical method | Effect size |
| 1 Frequency of attacks (average/week) Show forest plot | 23 | 1024 | Mean Difference (Fixed, 95% CI) | ‐6.07 [‐6.53, ‐5.61] |
| 1.1 Low‐dose CCBs vs placebo | 14 | 620 | Mean Difference (Fixed, 95% CI) | ‐1.00 [‐3.63, ‐2.37] |
| 1.2 Medium/high‐dose CCBs vs placebo | 9 | 404 | Mean Difference (Fixed, 95% CI) | ‐9.50 [‐10.17, ‐8.83] |
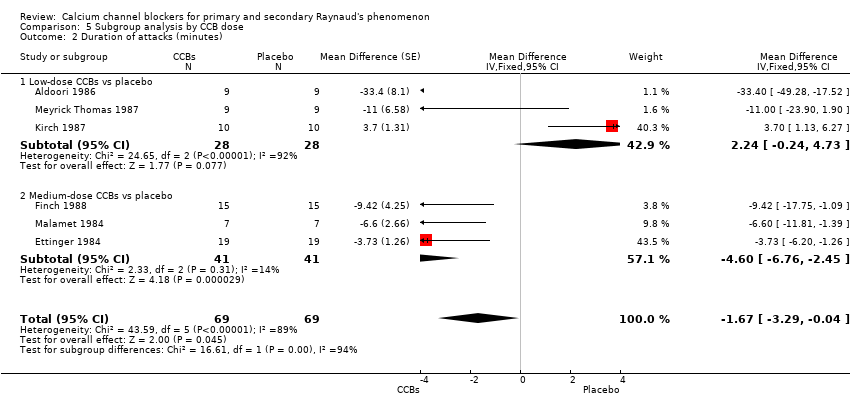
| 2 Duration of attacks (minutes) Show forest plot | 6 | 138 | Mean Difference (Fixed, 95% CI) | ‐1.67 [‐3.29, ‐0.04] |
| 2.1 Low‐dose CCBs vs placebo | 3 | 56 | Mean Difference (Fixed, 95% CI) | 2.24 [‐0.24, 4.73] |
| 2.2 Medium‐dose CCBs vs placebo | 3 | 82 | Mean Difference (Fixed, 95% CI) | ‐4.60 [‐6.76, ‐2.45] |
| 3 Severity of attacks (average, on a 10‐cm VAS) Show forest plot | 16 | 748 | Mean Difference (Fixed, 95% CI) | ‐0.62 [‐0.72, ‐0.51] |
| 3.1 Low‐dose CCBs vs placebo | 9 | 434 | Mean Difference (Fixed, 95% CI) | ‐0.56 [‐0.68, ‐0.45] |
| 3.2 Medium/high‐dose CCBs vs placebo | 7 | 314 | Mean Difference (Fixed, 95% CI) | ‐0.91 [‐1.18, ‐0.64] |
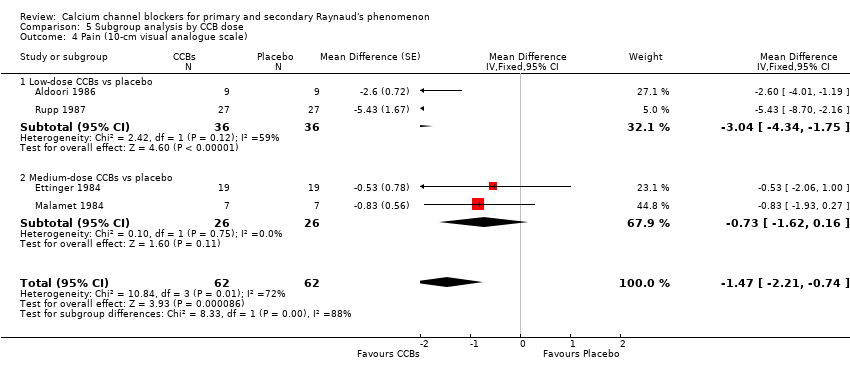
| 4 Pain (10‐cm visual analogue scale) Show forest plot | 4 | 124 | Mean Difference (Fixed, 95% CI) | ‐1.47 [‐2.21, ‐0.74] |
| 4.1 Low‐dose CCBs vs placebo | 2 | 72 | Mean Difference (Fixed, 95% CI) | ‐3.04 [‐4.34, ‐1.75] |
| 4.2 Medium‐dose CCBs vs placebo | 2 | 52 | Mean Difference (Fixed, 95% CI) | ‐0.73 [‐1.62, 0.16] |
| 5 Patient global Show forest plot | 2 | 192 | Mean Difference (Fixed, 95% CI) | ‐0.37 [‐0.73, ‐0.02] |
| 5.1 Low‐dose CCBs vs placebo | 1 | 72 | Mean Difference (Fixed, 95% CI) | ‐0.2 [‐0.63, 0.23] |
| 5.2 High‐dose CCBs vs placebo | 1 | 120 | Mean Difference (Fixed, 95% CI) | ‐0.74 [‐1.37, ‐0.11] |
| Outcome or subgroup title | No. of studies | No. of participants | Statistical method | Effect size |
| 1 Number of participants with improvement Show forest plot | 3 | 59 | Risk Ratio (M‐H, Fixed, 95% CI) | 2.38 [1.35, 4.20] |
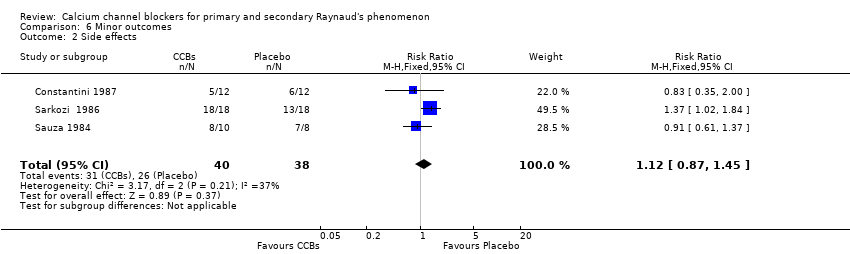
| 2 Side effects Show forest plot | 3 | 78 | Risk Ratio (M‐H, Fixed, 95% CI) | 1.12 [0.87, 1.45] |