| Calcium channel blockers (CCBs) compared with placebo for treatment of Raynaud's phenomenon |
| Patient or population: patients with Raynaud's phenomenon
Settings: outpatient settings
Intervention: calcium channel blockers (CCBs) (all)
Comparison: placebo |
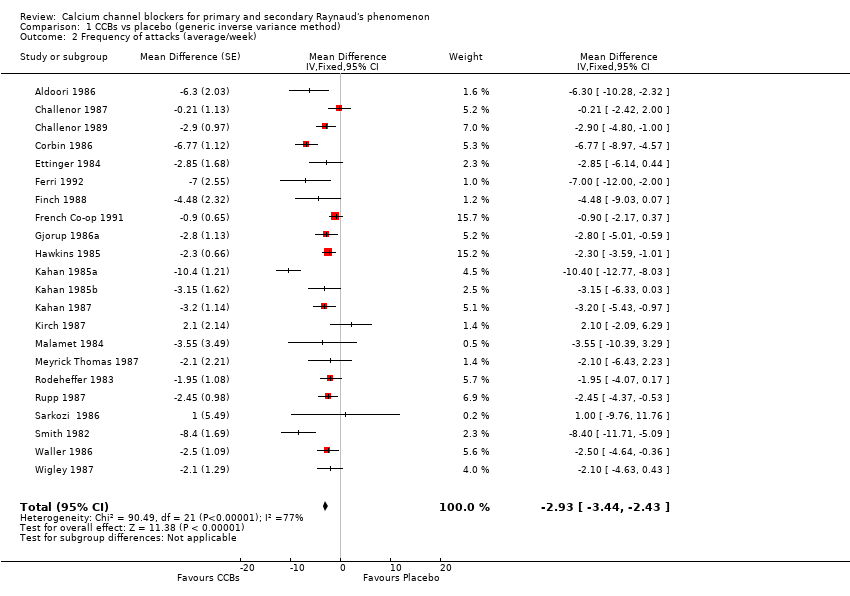
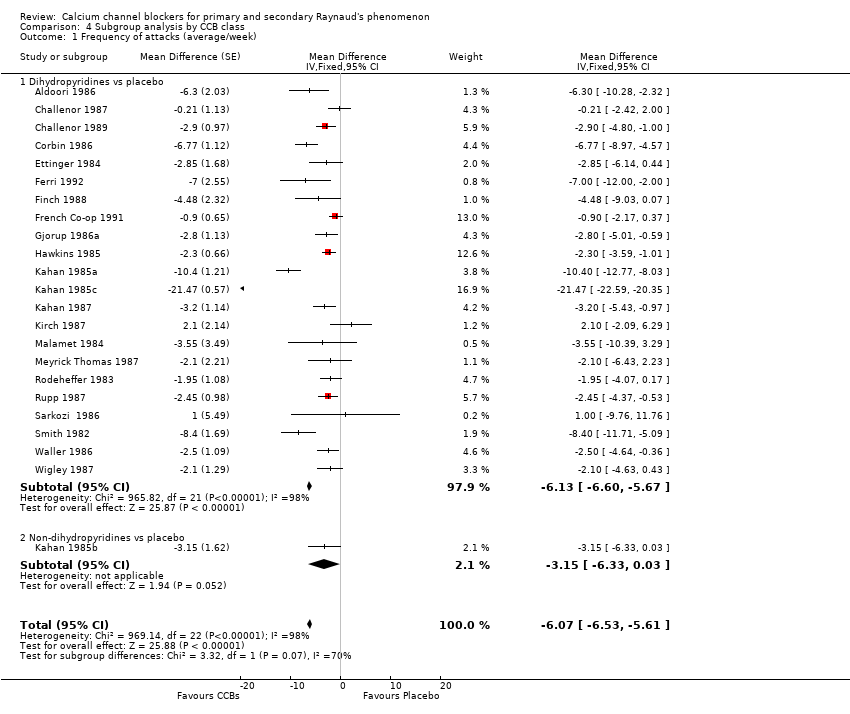
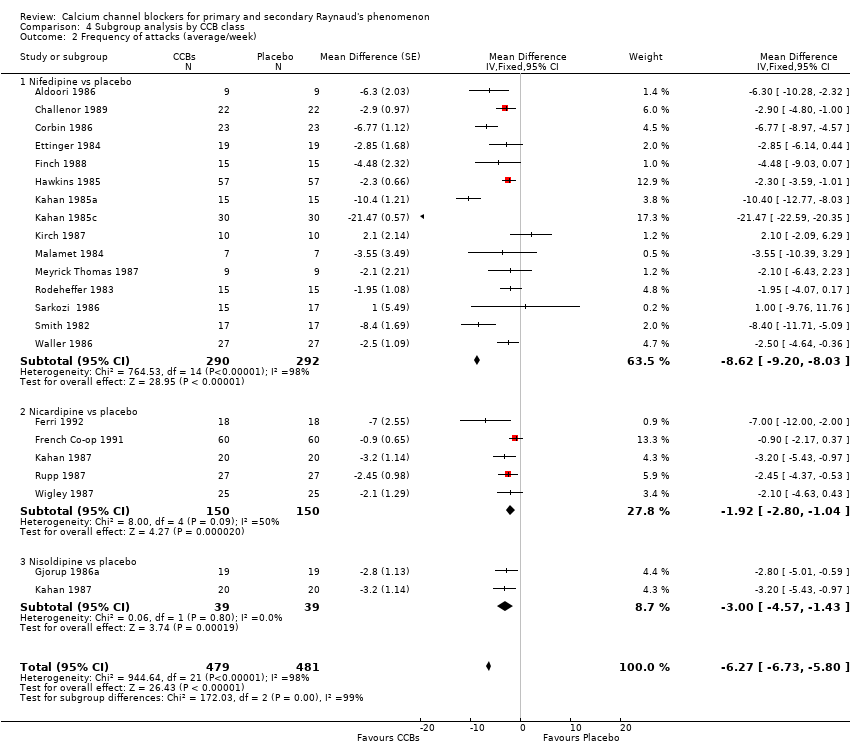
| Frequency of attacks
Average number of attacks/week
Follow‐up: 4 to 20 weeks | Mean frequency of attacks in control groups: 13.7 attacksa | Mean frequency of attacks in intervention groups: 6.13 lower (6.60 to 5.67 lower)b | | 528
(23 studies) | ⊕⊕⊕⊝ moderatec | Note: Excluding a study with a very large reduction in frequency of attacks changed the mean difference to ‐2.93 per week (95% CI ‐3.44 to ‐2.43).
NNTB: N/Ad Absolute risk difference: N/Ad Relative percent change: ‐44% (95% CI ‐48% to ‐41%) |
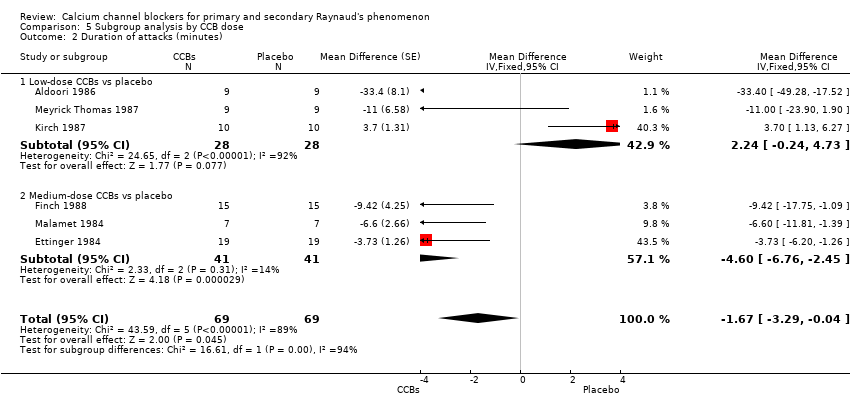
| Duration of attacks Average duration per attack measured in minutes
Follow‐up: 2 to 20 weeks | Mean duration of attacks in control groups:
18.8 minutesa | Mean duration of attacks in intervention groups:
1.67 fewer minutes (‐3.29 to 0) | | 69
(6 studies) | ⊕⊕⊝⊝ lowc,e | NNTB: N/Ad Absolute risk difference: N/Ad Relative percent change: ‐9% (95% CI ‐18% to 0%) |
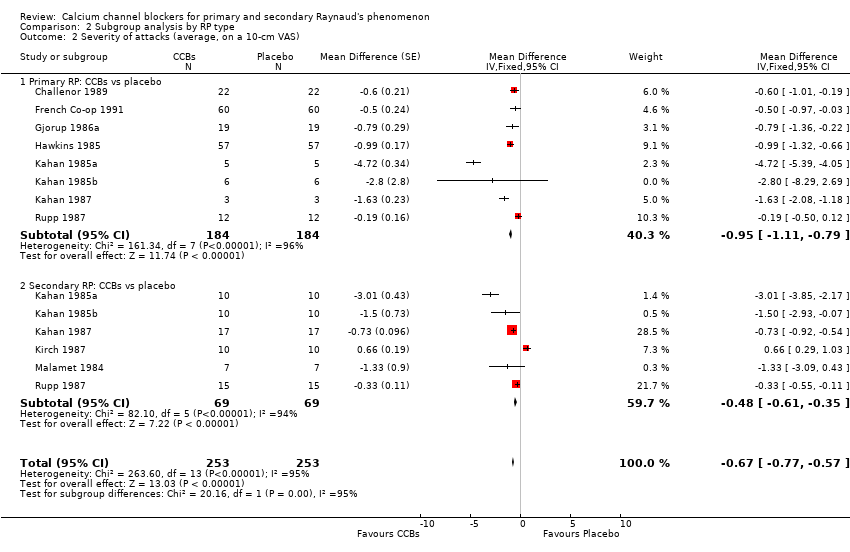
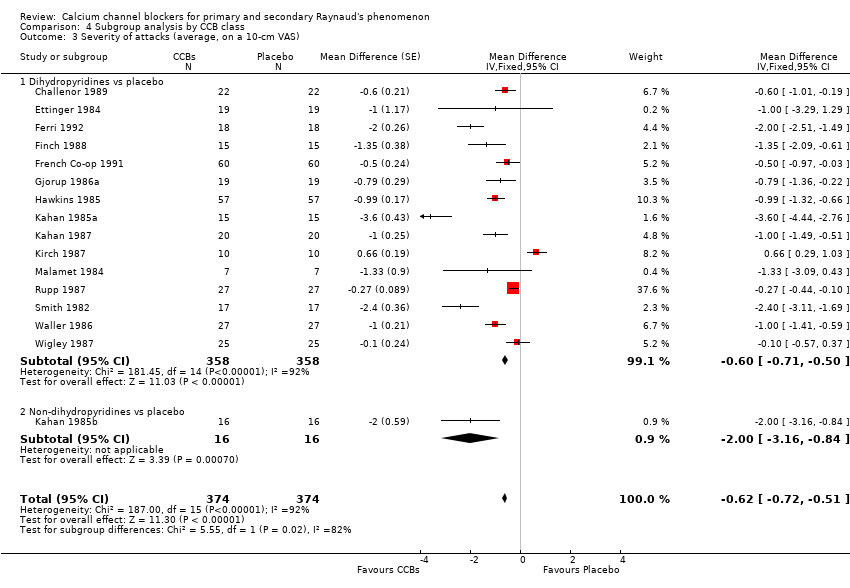
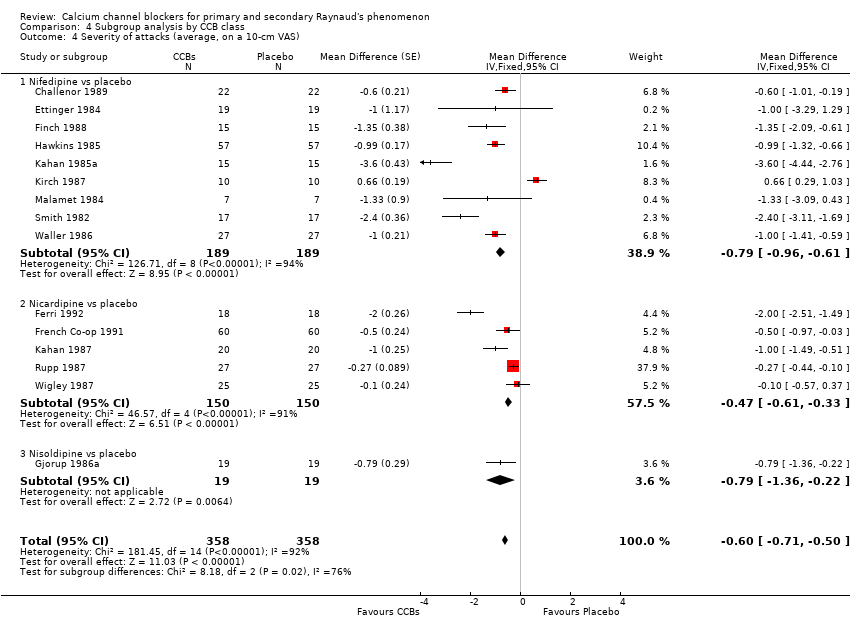
| Severity of attacks
Average severity per attack assessed on a 10‐cm visual analogue scale (0 = no symptoms, 10 = maximal severity)
Follow‐up: 2 to 12 weeks | Mean severity of attacks in control groups:
6.7 cma | Mean severity of attacks in intervention groups:
0.62 lower
(0.72 to 0.51 lower) | | 415
(18 studies) | ⊕⊕⊕⊝ moderatec | NNTB: N/Ad Absolute risk difference: ‐6% (95% CI ‐7% to ‐5%) Relative percent change: ‐9% (95% CI ‐11% to ‐8%) |
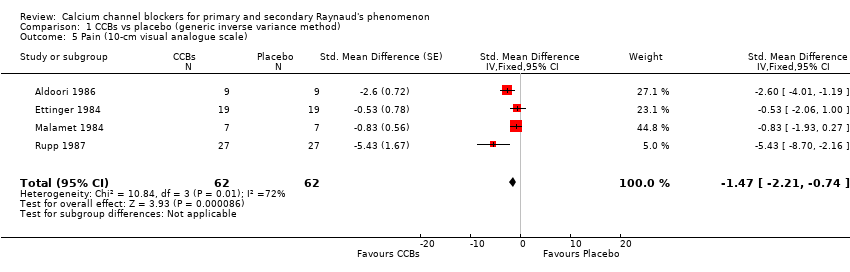
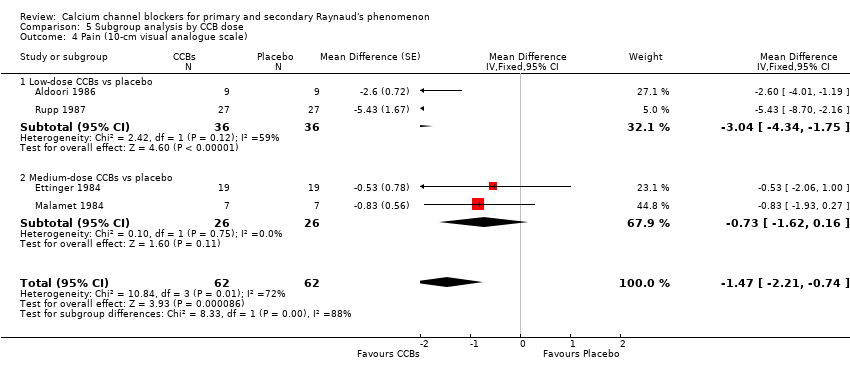
| Pain Average pain per attack, measured on a 10‐cm visual analogue scale (0 = no pain, 10 = maximal pain)
Follow‐up: 2 to 10 weeks | Mean pain in control groups:
3.13 cma | Mean pain in intervention groups:
1.47 lower
(2.21 to 0.74 lower) | | 62
(4 studies) | ⊕⊕⊝⊝ lowc,e | N/Ad Absolute risk difference: ‐15% (95% CI ‐22% to ‐7%) Relative percent change: ‐47% (95% CI ‐71% to ‐24%) |
| Patient global
Disability due to Raynaud's assessed on a 10‐cm visual analogue scale (0 = no disability, 10 = maximal disability) Follow‐up: 5 weeks | Mean patient global in control group: 3.9 cma | Mean patient global in intervention groups:
0.37 lower
(0.73 lower to 0) | | 92
(2) | ⊕⊕⊕⊝ moderatee | NNTB: N/Af Absolute risk difference: ‐4% (95% CI ‐7% to 0%) Relative percent change: ‐9% (95% CI ‐19% to 0%) |
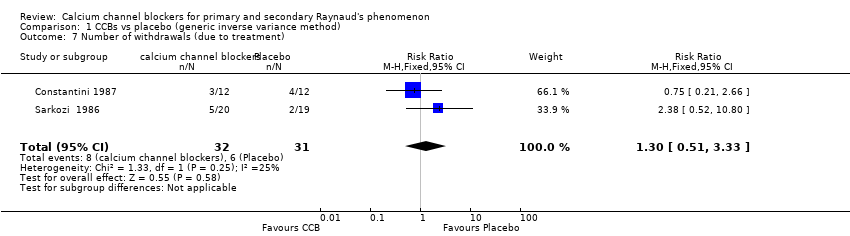
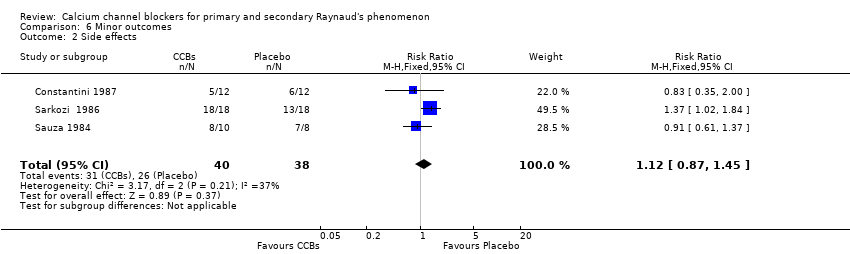
| Number of withdrawals due to adverse events
Number of participants who dropped out of studies owing to adverse treatment effects
Follow‐up: 2 to 20 weeks | 194 per 1000 | 252 per 1000
(99 to 645) | RR 1.30
(0.51 to 3.33) | 63
(2 studies) | ⊕⊕⊝⊝ lowe,g | NNTH: N/Af Absolute risk reduction: 6% (95% CI ‐14% to 26%) Relative percent change: 30% (95% CI ‐49% to 233%) |
| Serious adverse events
Number of participants who died or withdrew and were hospitalized as a result of adverse effects of treatment | See comment. | See comment. | Not estimable | 0
(0) | See comment. | No serious adverse events reported |
| *The basis for the assumed risk (eg, median control group risk across studies) is provided in footnotes. The corresponding risk (and its 95% confidence interval) is based on the assumed risk in the comparison group and the relative effect of the intervention (and its 95% CI).
CCB: calcium channel blocker; CI: confidence interval; NNTB: number needed to treat for an additional beneficial outcome; NNTH: number needed to treat for an additional harmful outcome; RR: risk ratio. |
| GRADE Working Group grades of evidence.
High quality: Further research is very unlikely to change our confidence in the estimate of effect.
Moderate quality: Further research is likely to have an important impact on our confidence in the estimate of effect and may change the estimate.
Low quality: Further research is very likely to have an important impact on our confidence in the estimate of effect and is likely to change the estimate.
Very low quality: We are very uncertain about the estimate. |