Inhibiteurs des canaux calciques pour le phénomène de Raynaud primitif et secondaire
Appendices
Appendix 1. Appendix 1: search methods
Appendix 1: search methods
| Raynaud's phenomenon | |||
| Database and coverage | Search date | Number of references retrieved | With duplicates removed |
| The Cochrane Library CENTRAL Methods studies Technology assessments Economic evaluation | December 2, 2015 | 14 1011 5 2 3 | 8 358 2 3 3 |
| Ovid MEDLINE(R) 1946‐present | 1027 | 1005 | |
| Ovid Embase Classic + Embase 1947‐present | 1251 | 884 | |
| Clinicaltrials.gov | 50 | 48 | |
| WHO portal (who.int/trialsearch, all years) | 0 | 0 | |
| Totals | 3389 | 2337 | |
Cochrane Library – Issue 6, 2014
Search name: Raynaud's
Last saved: 02/12/2015 13:58:12.787
Description:
ID search:
#1 MeSH descriptor: [Raynaud Disease] explode all trees
#2 raynaud*:ti,ab,kw
#3 vasospasm:ti,ab,kw
#4 #1 or #2 or #3
Database: Ovid MEDLINE(R) In‐Process & Other Non‐Indexed Citations and Ovid MEDLINE(R) <1946 to present>
Search strategy:
‐‐‐‐‐‐‐‐‐‐‐‐‐‐‐‐‐‐‐‐‐‐‐‐‐‐‐‐‐‐‐‐‐‐‐‐‐‐‐‐‐‐‐‐‐‐‐‐‐‐‐‐‐‐‐‐‐‐‐‐‐‐‐‐‐‐‐‐‐‐‐‐‐‐‐‐‐‐‐‐
1 Raynaud Disease/ (5811)
2 Vasospasm.ti,ab. (9022)
3 raynaud$.tiw. (5879)
4 or/1‐3 (16735)
5 randomized controlled trial.pt. (376269)
6 controlled clinical trial.pt. (88551)
7 randomized.ab. (296657)
8 placebo.ab. (154994)
9 clinical trials as topic.sh. (170411)
10 randomly.ab. (214652)
11 trial.ti. (127683)
12 or/5‐11 (909747)
13 exp animals/ not humans.sh. (3951755)
14 12 not 13 (839533)
15 4 and 14 (1027)
Database: Embase Classic + Embase <1947 to June 20, 2014>
Search strategy:
‐‐‐‐‐‐‐‐‐‐‐‐‐‐‐‐‐‐‐‐‐‐‐‐‐‐‐‐‐‐‐‐‐‐‐‐‐‐‐‐‐‐‐‐‐‐‐‐‐‐‐‐‐‐‐‐‐‐‐‐‐‐‐‐‐‐‐‐‐‐‐‐‐‐‐‐‐‐‐‐
1 Raynaud phenomenon/ (11646)
2 vasospasm/ (7831)
3 raynaud$.tiw. (8895)
4 or/1‐3 (20897)
5 random$.tiw. (900126)
6 factorial$.tiw. (23754)
7 crossover$.tiw. (50156)
8 cross over.tw. (22510)
9 cross‐over.tw. (22510)
10 placebo$.tiw. (207490)
11 (doubl$ adj blind$).tiw. (150810)
12 (singl$ adj blind$).tiw. (14649)
13 assign$.tiw. (244100)
14 allocate$.tiw. (85325)
15 volunteer$.tiw. (186103)
16 crossover procedure/ (39529)
17 double blind procedure/ (118455)
18 randomized controlled trial/ (346367)
19 single blind procedure/ (18431)
20 or/5‐19 (1457107)
21 4 and 20 (1251)
Clinicaltrials.gov
Advanced search screen
Condition=raynaud
Updated search performed on May 19, 2017
| Raynaud's phenomenon | |||
| Database and coverage | Search date | Number of references retrieved | With duplicates removed |
| EBM Reviews ‐ CENTRAL (via OVID) | May 19, 2017 | 101 | |
| Ovid Medline(R) 1946‐present | May 19, 2017 | 50 | |
| Ovid Embase Classic + Embase 1947‐present | May 19, 2017 | 104 | |
| Totals | 255 | ||
CENTRAL
Search name: Raynaud's
Last saved: May 19, 2017
Description:
ID search:
C1 ‐ Database: EBM Reviews ‐ Cochrane Central Register of Controlled Trials <April 2017>
Search Strategy:
‐‐‐‐‐‐‐‐‐‐‐‐‐‐‐‐‐‐‐‐‐‐‐‐‐‐‐‐‐‐‐‐‐‐‐‐‐‐‐‐‐‐‐‐‐‐‐‐‐‐‐‐‐‐‐‐‐‐‐‐‐‐‐‐‐‐‐‐‐‐‐‐‐‐‐‐‐‐‐‐
1 Raynaud Disease/ (267)
2 Vasospasm.ti,ab. (570)
3 raynaud$.tiw. (524)
4 or/1‐3 (1084)
5 limit 4 to yr="2015 ‐Current" (101)
C1 ‐ Database: Ovid MEDLINE(R) In‐Process & Other Non‐Indexed Citations and Ovid MEDLINE(R) <1946 to present>
Search strategy:
‐‐‐‐‐‐‐‐‐‐‐‐‐‐‐‐‐‐‐‐‐‐‐‐‐‐‐‐‐‐‐‐‐‐‐‐‐‐‐‐‐‐‐‐‐‐‐‐‐‐‐‐‐‐‐‐‐‐‐‐‐‐‐‐‐‐‐‐‐‐‐‐‐‐‐‐‐‐‐‐
1 Raynaud Disease/ (6394)
2 Vasospasm.ti,ab. (10215)
3 raynaud$.tiw. (6728)
4 or/1‐3 (18859)
5 randomized controlled trial.pt. (462560)
6 controlled clinical trial.pt. (94063)
7 randomized.ab. (395329)
8 placebo.ab. (186432)
9 clinical trials as topic.sh. (185904)
10 randomly.ab. (275397)
11 trial.ti. (177271)
12 or/5‐11 (1120634)
13 exp animals/ not humans.sh. (4399234)
14 12 not 13 (1032602)
15 4 and 14 (1163)
16 limit 15 to ed=20151202‐20170519 (50)
C1 ‐ Database: Embase <1974 to May 18, 2017>
Search strategy:
‐‐‐‐‐‐‐‐‐‐‐‐‐‐‐‐‐‐‐‐‐‐‐‐‐‐‐‐‐‐‐‐‐‐‐‐‐‐‐‐‐‐‐‐‐‐‐‐‐‐‐‐‐‐‐‐‐‐‐‐‐‐‐‐‐‐‐‐‐‐‐‐‐‐‐‐‐‐‐‐
1 Raynaud phenomenon/ (11924)
2 vasospasm/ (7993)
3 raynaud$.tiw. (9084)
4 or/1‐3 (21611)
5 random$.tiw. (1188308)
6 factorial$.tiw. (30059)
7 crossover$.tiw. (61652)
8 cross over.tw. (27084)
9 cross‐over.tw. (27084)
10 placebo$.tiw. (254043)
11 (doubl$ adj blind$).tiw. (177952)
12 (singl$ adj blind$).tiw. (19292)
13 assign$.tiw. (311284)
14 allocate$.tiw. (115199)
15 volunteer$.tiw. (219603)
16 crossover procedure/ (51208)
17 double blind procedure/ (138220)
18 randomized controlled trial/ (449401)
19 single blind procedure/ (26863)
20 or/5‐19 (1850737)
21 4 and 20 (1495)
22 Raynaud phenomenon/ (11924)
23 vasospasm/ (7993)
24 raynaud$.tiw. (9084)
25 or/22‐24 (21611)
26 random$.tiw. (1188308)
27 factorial$.tiw. (30059)
28 crossover$.tiw. (61652)
29 cross over.tw. (27084)
30 cross‐over.tw. (27084)
31 placebo$.tiw. (254043)
32 (doubl$ adj blind$).tiw. (177952)
33 (singl$ adj blind$).tiw. (19292)
34 assign$.tiw. (311284)
35 allocate$.tiw. (115199)
36 volunteer$.tiw. (219603)
37 crossover procedure/ (51208)
38 double blind procedure/ (138220)
39 randomized controlled trial/ (449401)
40 single blind procedure/ (26863)
41 or/26‐40 (1850737)
42 25 and 41 (1495)
43 limit 42 to dd=20151202‐20170519 (104)
Appendix 2. Appendix 2: dosage guidelines
Dosage guidelines*
| Calcium channel blocker | Low dose (daily dose) | Medium dose (daily dose) | High dose (daily dose) |
| Amlodipine | 2.5 mg | 5 mg | 10 mg |
| Isradipine | 5 mg | 10 mg | ‐ |
| Nicardipine | 60 mg | 90 mg | 120 mg |
| Nifedipine | < or = 30 mg | >30 mg | 90 mg |
| Nisoldipine | 20 mg | 30 mg | 60 mg |
| Diltiazem | 180 mg | 240 mg | 360 mg |
| Verapamil | 180 mg | 240 mg | 360 mg |
*Dosage based on Greater Rochester Independent Practice Association (GRIPA) guidelines.
Appendix 3. Appendix 3: Dichotomous outcomes from cross‐over trials
| Study | General improvement | Treatment preference | Side effects | Withdrawals | ||||||||||||
| Treatment | Placebo | Treatment | Placebo | Treatment | Placebo | Treatment | Placebo | |||||||||
| Events | Total | Events | Total | Events | Total | Events | Total | Events | Total | Events | Total | Events | Total | Events | Total | |
| Aldoori 1986 | 10 | 13 | 4 | 13 | ||||||||||||
| Bravard 1983 | 5 | 5 | 3 | 5 | ||||||||||||
| Challenor 1989 | 16 | 24 | 5 | 24 | 2 | 24 | 0 | 24 | ||||||||
| Corbin 1986 | 15 | 22 | 2 | 22 | 14 | 23 | 2 | 23 | 3 | 22 | 0 | 22 | ||||
| Ettinger 1984 | 15 | 19 | 12 | 19 | 12 | 22 | 1 | 22 | ||||||||
| Ferri 1992 | 2 | 21 | 0 | 21 | ||||||||||||
| French Co‐op 1991 | 19 | 69 | 7 | 69 | 2 | 69 | 5 | 69 | ||||||||
| Gjorup 1986a | 12 | 19 | 4 | 19 | 5 | 19 | 0 | 19 | ||||||||
| Gjorup 1986b | 19 | 21 | 0 | 21 | 16 | 21 | 0 | 21 | 4 | 26 | 0 | 26 | ||||
| Hawkins 1985 | 19 | 57 | 6 | 57 | 7 | 57 | 1 | 57 | ||||||||
| Kahan 1985a | 12 | 15 | 1 | 15 | 6 | 15 | 2 | 15 | ||||||||
| Kahan 1985b | 9 | 16 | 3 | 16 | 6 | 16 | 2 | 16 | ||||||||
| Kahan 1985c | 9 | 30 | 3 | 30 | ||||||||||||
| Kahan 1987 | 7 | 20 | 2 | 20 | 7 | 20 | 2 | 20 | ||||||||
| Kallenberg 1987 | 14 | 15 | 0 | 15 | ||||||||||||
| Kinney 1982 | 3 | 14 | 10 | 14 | ||||||||||||
| Kirch 1987 | 8 | 10 | 2 | 10 | 2 | 10 | 2 | 10 | ||||||||
| La Civita 1997 | 11 | 20 | 0 | 20 | ||||||||||||
| Leppert 1989 | 5 | 10 | 3 | 10 | ||||||||||||
| Meyrick Thomas 1987 | 1 | 9 | 2 | 9 | 1 | 10 | 0 | 10 | ||||||||
| Nilsson 1987 | 20 | 28 | 8 | 28 | 1 | 28 | 0 | 28 | ||||||||
| Rhedda 1985 | 2 | 19 | 1 | 19 | ||||||||||||
| Rodeheffer 1983 | 9 | 15 | 2 | 15 | 15 | 27 | 11 | 27 | 12 | 15 | 3 | 15 | ||||
| Rupp 1987 | 15 | 27 | 9 | 27 | ||||||||||||
| Smith 1982 | 15 | 17 | 1 | 17 | ||||||||||||
| Taixeira Da Costa 1987 | 4 | 14 | 6 | 14 | ||||||||||||
| Waller 1986 | 26 | 29 | 5 | 29 | ||||||||||||
| Wigley 1987 | 12 | 25 | 7 | 25 | 12 | 25 | 7 | 25 | ||||||||
| White 1982 | 9 | 11 | 1 | 11 | ||||||||||||
| Wollersheim 1991 | 2 | 25 | 1 | 25 | ||||||||||||
| Total | 76 | 109 | 29 | 109 | 61 | 89 | 17 | 89 | 265 | 573 | 85 | 573 | 39 | 281 | 15 | 281 |

Flow diagram of study.
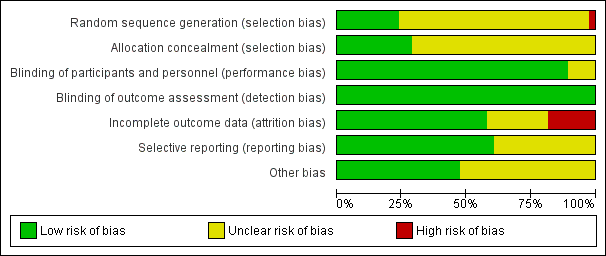
Risk of bias graph: review authors' judgements about each risk of bias item presented as percentages across all included studies.
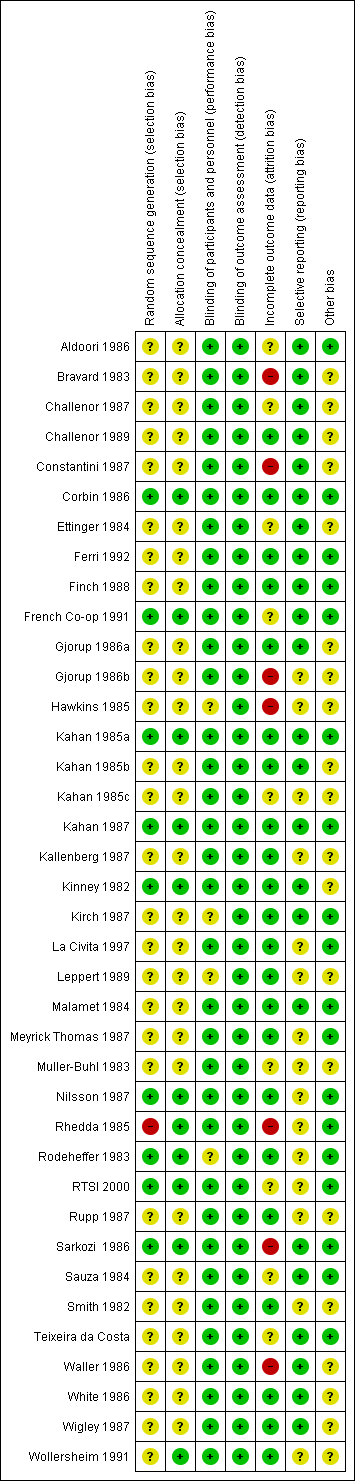
Risk of bias summary: review authors' judgements about each risk of bias item for each included study.
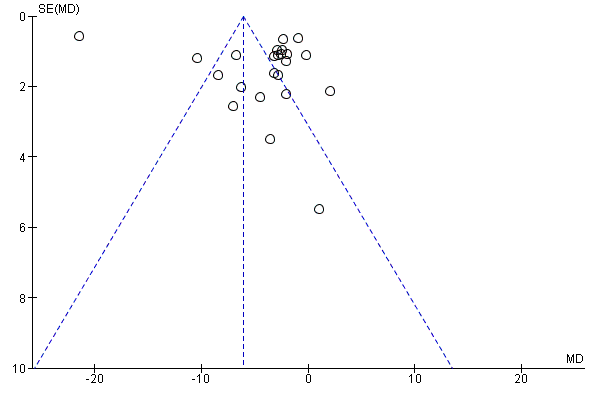
Funnel plot of comparison: 1 CCBs vs placebo (generic inverse variance method), outcome: 1.1 Frequency of attacks (average/week).
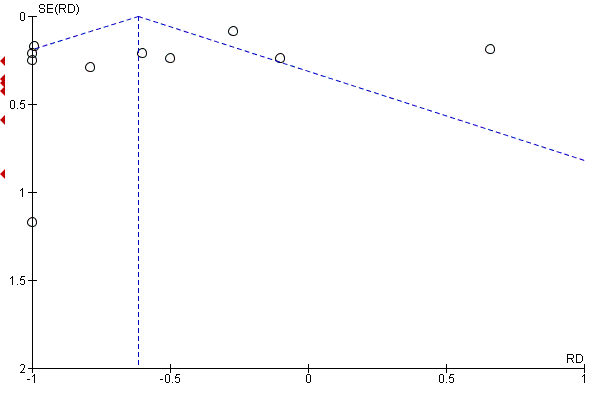
Funnel plot of comparison: 11 CCBs vs placebo (generic inverse variance method), outcome: 11.4 Severity of attacks (average, on a 10‐cm VAS).

Comparison 1 CCBs vs placebo (generic inverse variance method), Outcome 1 Frequency of attacks (average/week).
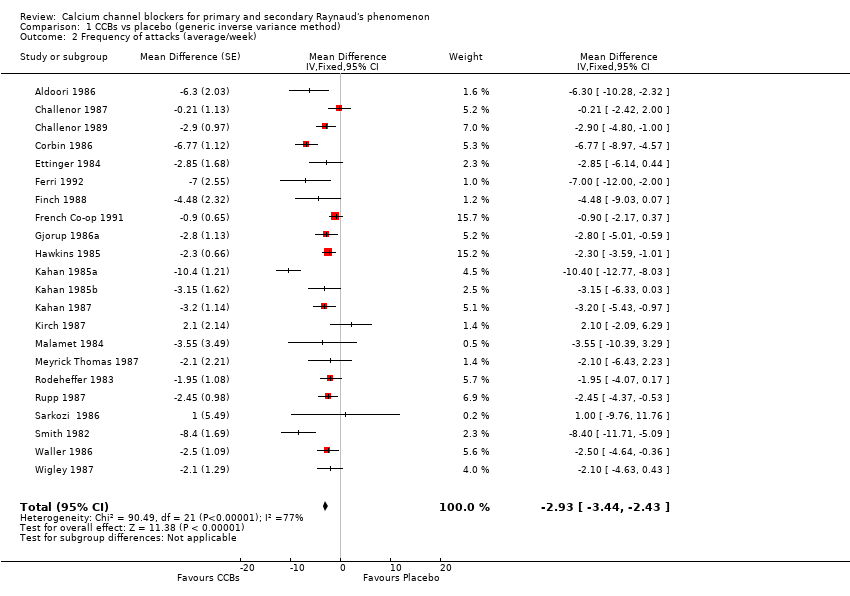
Comparison 1 CCBs vs placebo (generic inverse variance method), Outcome 2 Frequency of attacks (average/week).

Comparison 1 CCBs vs placebo (generic inverse variance method), Outcome 3 Duration of attacks (minutes).

Comparison 1 CCBs vs placebo (generic inverse variance method), Outcome 4 Severity of attacks (average, on a 10‐cm VAS).
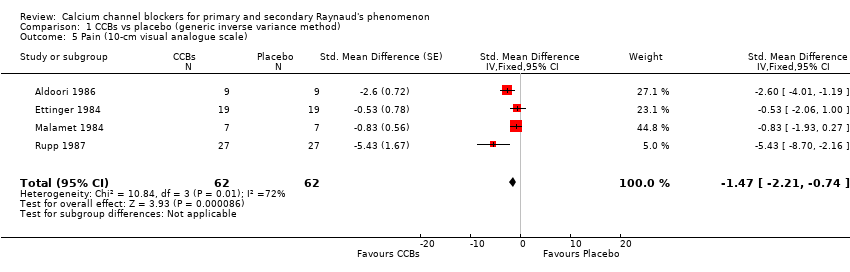
Comparison 1 CCBs vs placebo (generic inverse variance method), Outcome 5 Pain (10‐cm visual analogue scale).

Comparison 1 CCBs vs placebo (generic inverse variance method), Outcome 6 Patient global.
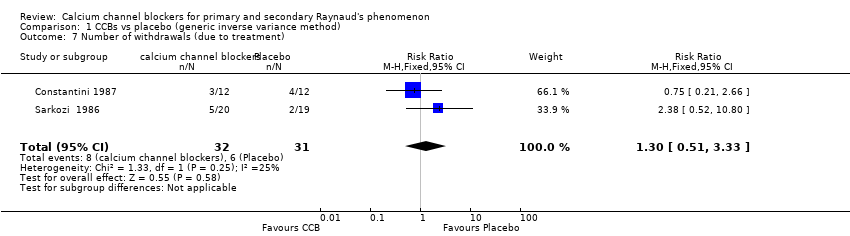
Comparison 1 CCBs vs placebo (generic inverse variance method), Outcome 7 Number of withdrawals (due to treatment).
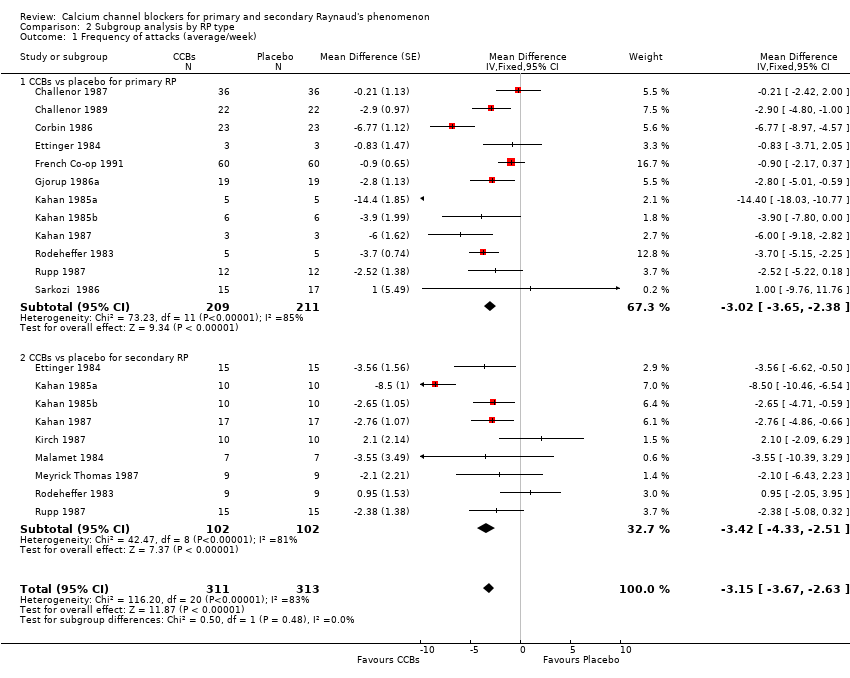
Comparison 2 Subgroup analysis by RP type, Outcome 1 Frequency of attacks (average/week).
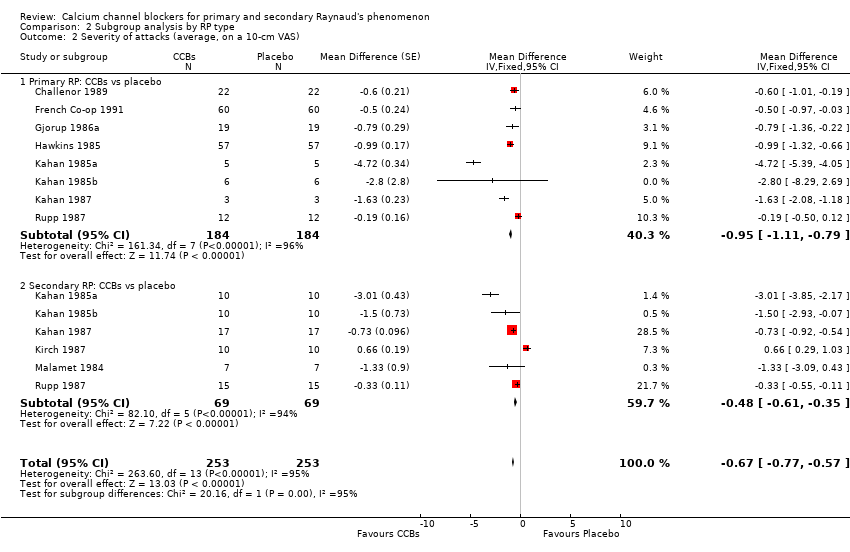
Comparison 2 Subgroup analysis by RP type, Outcome 2 Severity of attacks (average, on a 10‐cm VAS).

Comparison 3 Subgroup analysis: nifedipine versus placebo by RP type, Outcome 1 Frequency of attacks: nifedipine vs placebo by RP type.

Comparison 3 Subgroup analysis: nifedipine versus placebo by RP type, Outcome 2 Severity of attacks: nifedipine vs placebo by RP type.
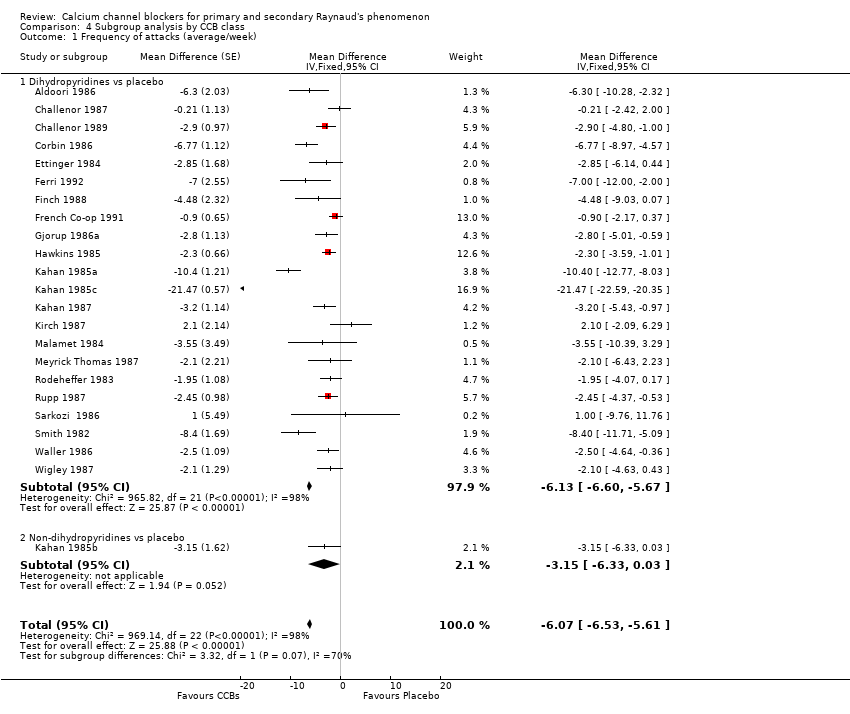
Comparison 4 Subgroup analysis by CCB class, Outcome 1 Frequency of attacks (average/week).
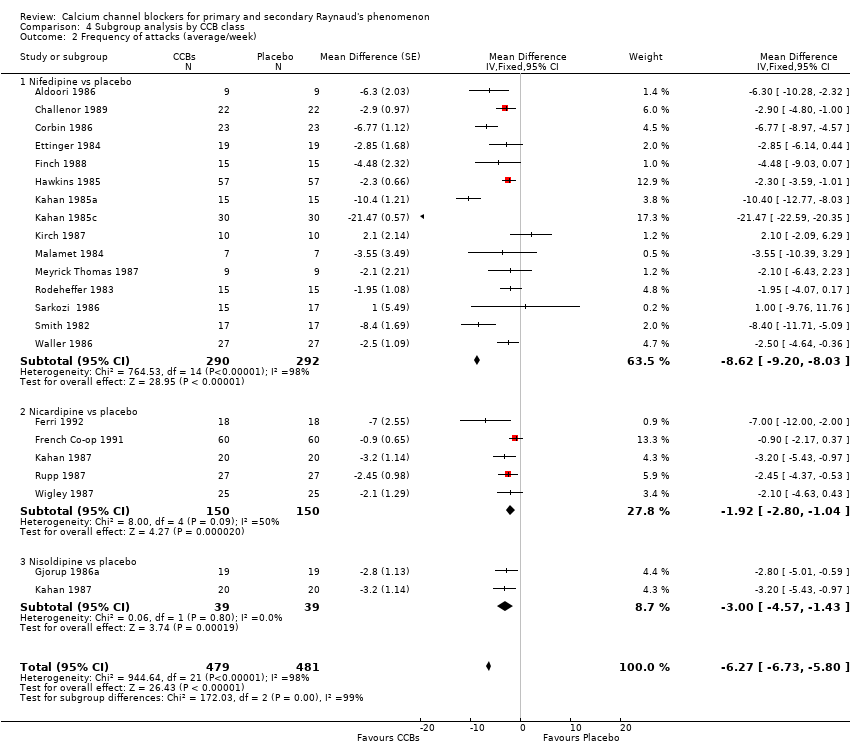
Comparison 4 Subgroup analysis by CCB class, Outcome 2 Frequency of attacks (average/week).
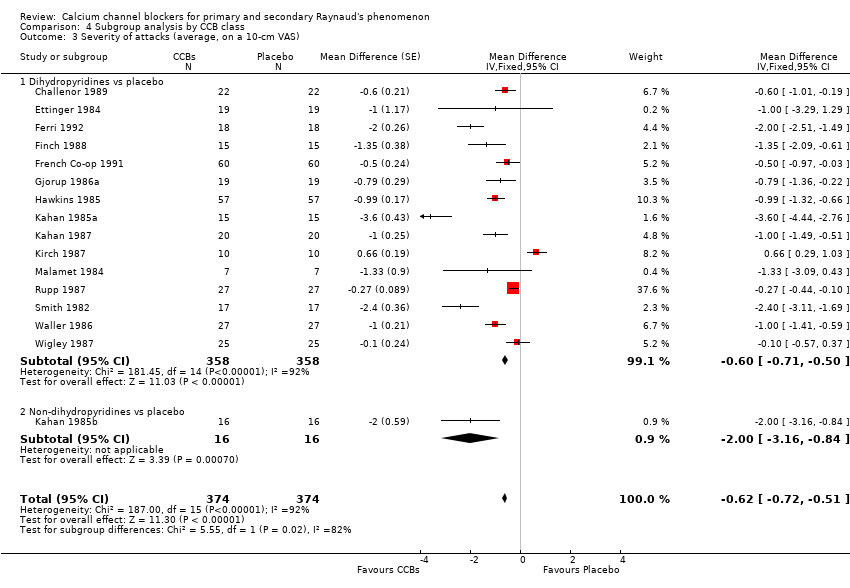
Comparison 4 Subgroup analysis by CCB class, Outcome 3 Severity of attacks (average, on a 10‐cm VAS).
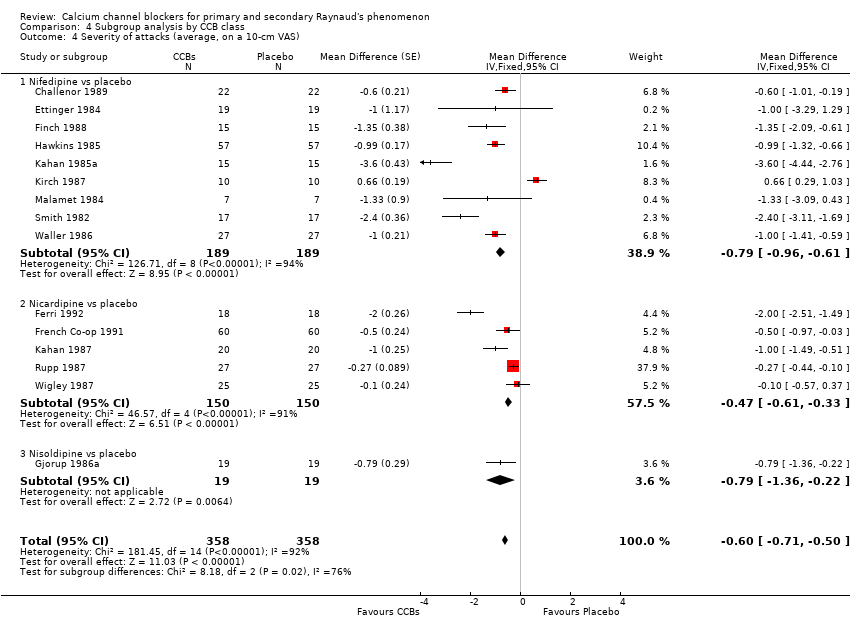
Comparison 4 Subgroup analysis by CCB class, Outcome 4 Severity of attacks (average, on a 10‐cm VAS).

Comparison 5 Subgroup analysis by CCB dose, Outcome 1 Frequency of attacks (average/week).
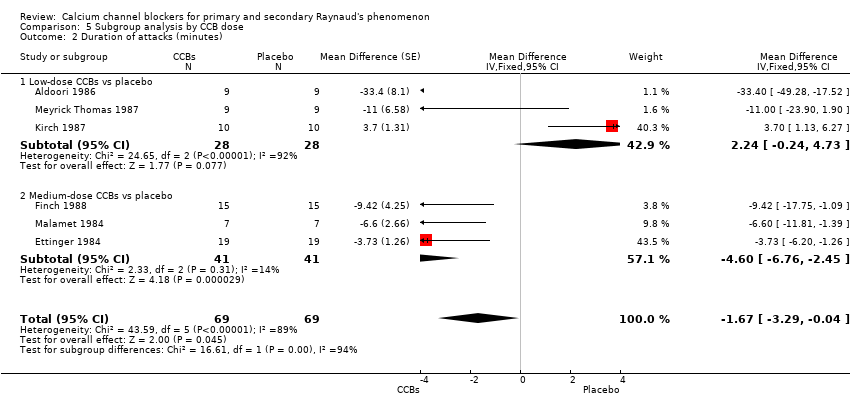
Comparison 5 Subgroup analysis by CCB dose, Outcome 2 Duration of attacks (minutes).

Comparison 5 Subgroup analysis by CCB dose, Outcome 3 Severity of attacks (average, on a 10‐cm VAS).
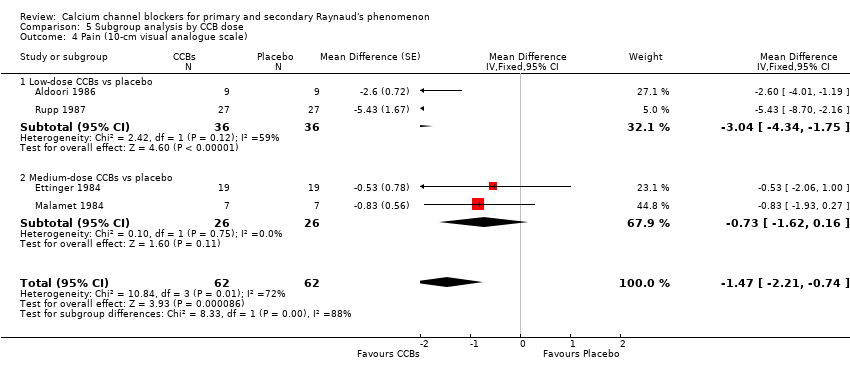
Comparison 5 Subgroup analysis by CCB dose, Outcome 4 Pain (10‐cm visual analogue scale).

Comparison 5 Subgroup analysis by CCB dose, Outcome 5 Patient global.

Comparison 6 Minor outcomes, Outcome 1 Number of participants with improvement.
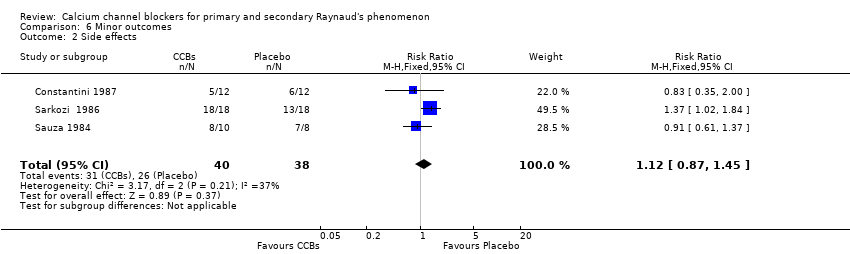
Comparison 6 Minor outcomes, Outcome 2 Side effects.
| Calcium channel blockers (CCBs) compared with placebo for treatment of Raynaud's phenomenon | ||||||
| Patient or population: patients with Raynaud's phenomenon | ||||||
| Outcomes | Illustrative comparative risks* (95% CI) | Relative effect | No. of participants | Quality of the evidence | Comments | |
| Assumed risk | Corresponding risk | |||||
| Placebo | CCBs (all) | |||||
| Frequency of attacks | Mean frequency of attacks in control groups: 13.7 attacksa | Mean frequency of attacks in intervention groups: 6.13 lower (6.60 to 5.67 lower)b | 528 | ⊕⊕⊕⊝ moderatec | Note: Excluding a study with a very large reduction in frequency of attacks changed the mean difference to ‐2.93 per week (95% CI ‐3.44 to ‐2.43). Absolute risk difference: N/Ad Relative percent change: ‐44% (95% CI ‐48% to ‐41%) | |
| Duration of attacks Average duration per attack measured in minutes | Mean duration of attacks in control groups: | Mean duration of attacks in intervention groups: (‐3.29 to 0) | 69 | ⊕⊕⊝⊝ lowc,e | NNTB: N/Ad Absolute risk difference: N/Ad Relative percent change: ‐9% (95% CI ‐18% to 0%) | |
| Severity of attacks | Mean severity of attacks in control groups: | Mean severity of attacks in intervention groups: | 415 | ⊕⊕⊕⊝ moderatec | NNTB: N/Ad Absolute risk difference: ‐6% (95% CI ‐7% to ‐5%) Relative percent change: ‐9% (95% CI ‐11% to ‐8%) | |
| Pain Average pain per attack, measured on a 10‐cm visual analogue scale (0 = no pain, 10 = maximal pain) | Mean pain in control groups: | Mean pain in intervention groups: | 62 | ⊕⊕⊝⊝ lowc,e | N/Ad Absolute risk difference: ‐15% (95% CI ‐22% to ‐7%) Relative percent change: ‐47% (95% CI ‐71% to ‐24%) | |
| Patient global Follow‐up: 5 weeks | Mean patient global in control group: 3.9 cma | Mean patient global in intervention groups: | 92 | ⊕⊕⊕⊝ moderatee | NNTB: N/Af Absolute risk difference: ‐4% (95% CI ‐7% to 0%) Relative percent change: ‐9% (95% CI ‐19% to 0%) | |
| Number of withdrawals due to adverse events | 194 per 1000 | 252 per 1000 | RR 1.30 | 63 | ⊕⊕⊝⊝ lowe,g | NNTH: N/Af Absolute risk reduction: 6% (95% CI ‐14% to 26%) Relative percent change: 30% (95% CI ‐49% to 233%) |
| Serious adverse events | See comment. | See comment. | Not estimable | 0 | See comment. | No serious adverse events reported |
| *The basis for the assumed risk (eg, median control group risk across studies) is provided in footnotes. The corresponding risk (and its 95% confidence interval) is based on the assumed risk in the comparison group and the relative effect of the intervention (and its 95% CI). | ||||||
| GRADE Working Group grades of evidence. | ||||||
| aFinal value: weighted mean of scores in placebo group across studies in the meta‐analysis. | ||||||
| Outcome or subgroup title | No. of studies | No. of participants | Statistical method | Effect size |
| 1 Frequency of attacks (average/week) Show forest plot | 23 | 1024 | Mean Difference (Fixed, 95% CI) | ‐6.07 [‐6.53, ‐5.61] |
| 2 Frequency of attacks (average/week) Show forest plot | 22 | Mean Difference (Fixed, 95% CI) | ‐2.93 [‐3.44, ‐2.43] | |
| 3 Duration of attacks (minutes) Show forest plot | 6 | 138 | Mean Difference (Fixed, 95% CI) | ‐1.67 [‐3.29, ‐0.04] |
| 4 Severity of attacks (average, on a 10‐cm VAS) Show forest plot | 16 | 748 | Risk Difference (Fixed, 95% CI) | ‐0.62 [‐0.72, ‐0.51] |
| 5 Pain (10‐cm visual analogue scale) Show forest plot | 4 | 124 | Std. Mean Difference (Fixed, 95% CI) | ‐1.47 [‐2.21, ‐0.74] |
| 6 Patient global Show forest plot | 2 | 192 | Std. Mean Difference (Fixed, 95% CI) | ‐0.37 [‐0.73, ‐0.02] |
| 7 Number of withdrawals (due to treatment) Show forest plot | 2 | 63 | Risk Ratio (M‐H, Fixed, 95% CI) | 1.30 [0.51, 3.33] |
| Outcome or subgroup title | No. of studies | No. of participants | Statistical method | Effect size |
| 1 Frequency of attacks (average/week) Show forest plot | 15 | 624 | Mean Difference (Fixed, 95% CI) | ‐3.15 [‐3.67, ‐2.63] |
| 1.1 CCBs vs placebo for primary RP | 12 | 420 | Mean Difference (Fixed, 95% CI) | ‐3.02 [‐3.65, ‐2.38] |
| 1.2 CCBs vs placebo for secondary RP | 9 | 204 | Mean Difference (Fixed, 95% CI) | ‐3.42 [‐4.33, ‐2.51] |
| 2 Severity of attacks (average, on a 10‐cm VAS) Show forest plot | 10 | 506 | Mean Difference (Fixed, 95% CI) | ‐0.67 [‐0.77, ‐0.57] |
| 2.1 Primary RP: CCBs vs placebo | 8 | 368 | Mean Difference (Fixed, 95% CI) | ‐0.95 [‐1.11, ‐0.79] |
| 2.2 Secondary RP: CCBs vs placebo | 6 | 138 | Mean Difference (Fixed, 95% CI) | ‐0.48 [‐0.61, ‐0.35] |
| Outcome or subgroup title | No. of studies | No. of participants | Statistical method | Effect size |
| 1 Frequency of attacks: nifedipine vs placebo by RP type Show forest plot | 9 | 268 | Mean Difference (Fixed, 95% CI) | ‐4.34 [‐5.09, ‐3.59] |
| 1.1 Nifedipine vs placebo for primary RP | 6 | 148 | Mean Difference (Fixed, 95% CI) | ‐4.42 [‐5.35, ‐3.50] |
| 1.2 Nifedipine vs placebo for secondary RP | 6 | 120 | Mean Difference (Fixed, 95% CI) | ‐4.19 [‐5.47, ‐2.91] |
| 2 Severity of attacks: nifedipine vs placebo by RP type Show forest plot | 4 | 108 | Mean Difference (Fixed, 95% CI) | ‐0.82 [‐1.07, ‐0.58] |
| 2.1 Primary RP | 2 | 54 | Mean Difference (Fixed, 95% CI) | ‐1.74 [‐2.09, ‐1.39] |
| 2.2 Secondary RP | 3 | 54 | Mean Difference (Fixed, 95% CI) | 0.01 [‐0.32, 0.34] |
| Outcome or subgroup title | No. of studies | No. of participants | Statistical method | Effect size |
| 1 Frequency of attacks (average/week) Show forest plot | 23 | Mean Difference (Fixed, 95% CI) | ‐6.07 [‐6.53, ‐5.61] | |
| 1.1 Dihydropyridines vs placebo | 22 | Mean Difference (Fixed, 95% CI) | ‐6.13 [‐6.60, ‐5.67] | |
| 1.2 Non‐dihydropyridines vs placebo | 1 | Mean Difference (Fixed, 95% CI) | ‐3.15 [‐6.33, 0.03] | |
| 2 Frequency of attacks (average/week) Show forest plot | 21 | 960 | Mean Difference (Fixed, 95% CI) | ‐6.27 [‐6.73, ‐5.80] |
| 2.1 Nifedipine vs placebo | 15 | 582 | Mean Difference (Fixed, 95% CI) | ‐8.62 [‐9.20, ‐8.03] |
| 2.2 Nicardipine vs placebo | 5 | 300 | Mean Difference (Fixed, 95% CI) | ‐1.92 [‐2.80, ‐1.04] |
| 2.3 Nisoldipine vs placebo | 2 | 78 | Mean Difference (Fixed, 95% CI) | ‐1.00 [‐4.57, ‐1.43] |
| 3 Severity of attacks (average, on a 10‐cm VAS) Show forest plot | 16 | 748 | Mean Difference (Fixed, 95% CI) | ‐0.62 [‐0.72, ‐0.51] |
| 3.1 Dihydropyridines vs placebo | 15 | 716 | Mean Difference (Fixed, 95% CI) | ‐0.60 [‐0.71, ‐0.50] |
| 3.2 Non‐dihydropyridines vs placebo | 1 | 32 | Mean Difference (Fixed, 95% CI) | ‐2.0 [‐3.16, ‐0.84] |
| 4 Severity of attacks (average, on a 10‐cm VAS) Show forest plot | 15 | 716 | Mean Difference (Fixed, 95% CI) | ‐0.60 [‐0.71, ‐0.50] |
| 4.1 Nifedipine vs placebo | 9 | 378 | Mean Difference (Fixed, 95% CI) | ‐0.79 [‐0.96, ‐0.61] |
| 4.2 Nicardipine vs placebo | 5 | 300 | Mean Difference (Fixed, 95% CI) | ‐0.47 [‐0.61, ‐0.33] |
| 4.3 Nisoldipine vs placebo | 1 | 38 | Mean Difference (Fixed, 95% CI) | ‐0.79 [‐1.36, ‐0.22] |
| Outcome or subgroup title | No. of studies | No. of participants | Statistical method | Effect size |
| 1 Frequency of attacks (average/week) Show forest plot | 23 | 1024 | Mean Difference (Fixed, 95% CI) | ‐6.07 [‐6.53, ‐5.61] |
| 1.1 Low‐dose CCBs vs placebo | 14 | 620 | Mean Difference (Fixed, 95% CI) | ‐1.00 [‐3.63, ‐2.37] |
| 1.2 Medium/high‐dose CCBs vs placebo | 9 | 404 | Mean Difference (Fixed, 95% CI) | ‐9.50 [‐10.17, ‐8.83] |
| 2 Duration of attacks (minutes) Show forest plot | 6 | 138 | Mean Difference (Fixed, 95% CI) | ‐1.67 [‐3.29, ‐0.04] |
| 2.1 Low‐dose CCBs vs placebo | 3 | 56 | Mean Difference (Fixed, 95% CI) | 2.24 [‐0.24, 4.73] |
| 2.2 Medium‐dose CCBs vs placebo | 3 | 82 | Mean Difference (Fixed, 95% CI) | ‐4.60 [‐6.76, ‐2.45] |
| 3 Severity of attacks (average, on a 10‐cm VAS) Show forest plot | 16 | 748 | Mean Difference (Fixed, 95% CI) | ‐0.62 [‐0.72, ‐0.51] |
| 3.1 Low‐dose CCBs vs placebo | 9 | 434 | Mean Difference (Fixed, 95% CI) | ‐0.56 [‐0.68, ‐0.45] |
| 3.2 Medium/high‐dose CCBs vs placebo | 7 | 314 | Mean Difference (Fixed, 95% CI) | ‐0.91 [‐1.18, ‐0.64] |
| 4 Pain (10‐cm visual analogue scale) Show forest plot | 4 | 124 | Mean Difference (Fixed, 95% CI) | ‐1.47 [‐2.21, ‐0.74] |
| 4.1 Low‐dose CCBs vs placebo | 2 | 72 | Mean Difference (Fixed, 95% CI) | ‐3.04 [‐4.34, ‐1.75] |
| 4.2 Medium‐dose CCBs vs placebo | 2 | 52 | Mean Difference (Fixed, 95% CI) | ‐0.73 [‐1.62, 0.16] |
| 5 Patient global Show forest plot | 2 | 192 | Mean Difference (Fixed, 95% CI) | ‐0.37 [‐0.73, ‐0.02] |
| 5.1 Low‐dose CCBs vs placebo | 1 | 72 | Mean Difference (Fixed, 95% CI) | ‐0.2 [‐0.63, 0.23] |
| 5.2 High‐dose CCBs vs placebo | 1 | 120 | Mean Difference (Fixed, 95% CI) | ‐0.74 [‐1.37, ‐0.11] |
| Outcome or subgroup title | No. of studies | No. of participants | Statistical method | Effect size |
| 1 Number of participants with improvement Show forest plot | 3 | 59 | Risk Ratio (M‐H, Fixed, 95% CI) | 2.38 [1.35, 4.20] |
| 2 Side effects Show forest plot | 3 | 78 | Risk Ratio (M‐H, Fixed, 95% CI) | 1.12 [0.87, 1.45] |