Early supported discharge services for people with acute stroke
Abstract
Background
People with stroke conventionally receive a substantial part of their rehabilitation in hospital. Services have now been developed that offer people in hospital an early discharge with rehabilitation at home (early supported discharge: ESD).
Objectives
To establish if, in comparison with conventional care, services that offer people in hospital with stroke a policy of early discharge with rehabilitation provided in the community (ESD) can: 1) accelerate return home, 2) provide equivalent or better patient and carer outcomes, 3) be acceptable satisfactory to patients and carers, and 4) have justifiable resource implications use.
Search methods
We searched the Cochrane Stroke Group Trials Register (January 2017), Cochrane Central Register of Controlled Trials (CENTRAL 2017, Issue 1) in the Cochrane Library (searched January 2017), MEDLINE in Ovid (searched January 2017), Embase in Ovid (searched January 2017), CINAHL in EBSCO (Cumulative Index to Nursing and Allied Health Literature; 1937 to December 2016), and Web of Science (to January 2017). In an effort to identify further published, unpublished, and ongoing trials we searched six trial registries (March 2017). We also performed citation tracking of included studies, checked reference lists of relevant articles, and contacted trialists.
Selection criteria
Randomised controlled trials (RCTs) recruiting stroke patients in hospital to receive either conventional care or any service intervention that has provided rehabilitation and support in a community setting with an aim of reducing the duration of hospital care.
Data collection and analysis
The primary patient outcome was the composite end‐point of death or long‐term dependency recorded at the end of scheduled follow‐up. Two review authors scrutinised trials, categorised them on their eligibility and extracted data. Where possible we sought standardised data from the primary trialists. We analysed the results for all trials and for subgroups of patients and services, in particular whether the intervention was provided by a co‐ordinated multidisciplinary team (co‐ordinated ESD team) or not. We assessed risk of bias for the included trials and used GRADE to assess the quality of the body of evidence.
Main results
We included 17 trials, recruiting 2422 participants, for which outcome data are currently available. Participants tended to be a selected elderly group of stroke survivors with moderate disability. The ESD group showed reductions in the length of hospital stay equivalent to approximately six days (mean difference (MD) ‐5.5; 95% confidence interval (CI) ‐3 to ‐8 days; P < 0.0001; moderate‐grade evidence). The primary outcome was available for 16 trials (2359 participants). Overall, the odds ratios (OR) for the outcome of death or dependency at the end of scheduled follow‐up (median 6 months; range 3 to 12) was OR 0.80 (95% CI 0.67 to 0.95, P = 0.01, moderate‐grade evidence) which equates to five fewer adverse outcomes per 100 patients receiving ESD. The results for death (16 trials; 2116 participants) and death or requiring institutional care (12 trials; 1664 participants) were OR 1.04 (95% CI 0.77 to 1.40, P = 0.81, moderate‐grade evidence) and OR 0.75 (95% CI 0.59 to 0.96, P = 0.02, moderate‐grade evidence), respectively. Small improvements were also seen in participants' extended activities of daily living scores (standardised mean difference (SMD) 0.14, 95% CI 0.03 to 0.25, P = 0.01, low‐grade evidence) and satisfaction with services (OR 1.60, 95% CI 1.08 to 2.38, P = 0.02, low‐grade evidence). We saw no clear differences in participants' activities of daily living scores, patients subjective health status or mood, or the subjective health status, mood or satisfaction with services of carers. We found low‐quality evidence that the risk of readmission to hospital was similar in the ESD and conventional care group (OR 1.09, 95% CI 0.79 to 1.51, P = 0.59, low‐grade evidence). The evidence for the apparent benefits were weaker at one‐ and five‐year follow‐up. Estimated costs from six individual trials ranged from 23% lower to 15% greater for the ESD group in comparison to usual care.
In a series of pre‐planned analyses, the greatest reductions in death or dependency were seen in the trials evaluating a co‐ordinated ESD team with a suggestion of poorer results in those services without a co‐ordinated team (subgroup interaction at P = 0.06). Stroke patients with mild to moderate disability at baseline showed greater reductions in death or dependency than those with more severe stroke (subgroup interaction at P = 0.04).
Authors' conclusions
Appropriately resourced ESD services with co‐ordinated multidisciplinary team input provided for a selected group of stroke patients can reduce long‐term dependency and admission to institutional care as well as reducing the length of hospital stay. Results are inconclusive for services without co‐ordinated multidisciplinary team input. We observed no adverse impact on the mood or subjective health status of patients or carers, nor on readmission to hospital.
PICO
Plain language summary
Services for reducing duration of hospital care in people with acute stroke
Review question
We aimed to establish if Early Supported Discharge (ESD) services can result in a better patient recovery and if they are as acceptable and affordable as usual services.
Background
Services that try to offer stroke patients an earlier discharge from hospital with rehabilitation provided in the community have been termed Early Supported Discharge (ESD) services. ESD services are usually provided by multidisciplinary teams of therapists, nurses, and doctors who work in a co‐ordinated manner through regular meetings. They aim to allow patients to return home from hospital earlier than usual and also to receive more rehabilitation in the familiar environment of their own home.
Study characteristics
We identified 17 clinical trials recruiting 2422 stroke patients (searching completed to January 2017). Patients who were recruited tended to have a moderate degree of disability (able to walk with assistance) and be sufficiently well to consider returning home. We categorised services as those based on a multidisciplinary ESD team (with different levels of co‐ordination and delivery) and those with no multidisciplinary team co‐ordination (no ESD team).
Key results
The length of initial stay in hospital was reduced by approximately five days for the ESD group. At an average of six months after their stroke ESD patients were more likely to be living at home (an extra five patients living at home for every 100 receiving ESD services; moderate‐quality evidence). They were also more likely to be independent in daily activities (an extra six patients independent for every 100 receiving ESD services; moderate‐quality evidence). We identified no apparent hazards in terms of patient mood or quality of life, carer mood or quality of life, or the risk of readmission to hospital. The greatest reductions in disability seemed to be present in trials based around a co‐ordinated ESD team. When compared with usual care, costs of ESD services ranged from a reduction to a modest increase.
Quality of the evidence
The quality of the evidence was downgraded to 'moderate' for the main outcomes of death, discharge home or disability. This was because it was impossible to hide the treating service from participants or healthcare workers. These conclusions were not dependent on trials judged to be lower quality because of poor design or missing data. More information was missing for some of the other outcome measures, which we have downgraded to low‐quality evidence.
Conclusion
Appropriately resourced ESD services with co‐ordinated multidisciplinary team input can reduce disability and the length of time in hospital at least for a selected group of people with stroke. Results are unclear for services that are not based on a co‐ordinated multidisciplinary team input. We did not identify any substantial harmful effects.
Authors' conclusions
Summary of findings
| ESD service compared with usual care for stroke | ||||||
| Patient or population: people with stroke Settings: Hospital Intervention: Early supported discharge (ESD) service ‐ any type Comparison: Usual care | ||||||
| Outcomes | Illustrative comparative risks* (95% CI) | Relative effect | No of Participants | Quality of the evidence | Comments | |
| Assumed risk | Corresponding risk | |||||
| Usual care | ESD service | |||||
| Death or dependency at end of scheduled follow‐up (median 6 months) | Medium risk population | OR 0.80 (0.67 to 0.95) | 2359 | ⊕⊕⊕⊝ | Assumed risk from baseline in included trials. Corresponding risk estimated from risk difference (95% CI). | |
| 450 per 1000 | 400 per 1000 | |||||
| Death at end of scheduled follow‐up (median 6 months) | Medium risk population | OR 1.04 (0.77 to 1.40) | 2116 | ⊕⊕⊕⊝ | As above | |
| 90 per 1000 | 90 per 1000 | |||||
| Death or institution care at end of scheduled follow‐up (median 6 months) | Medium risk population | OR 0.75 (0.59 to 0.96) | 1664 (12) | ⊕⊕⊕⊝ | As above | |
| 270 per 1000 | 220 per 1000 | |||||
| Extended activities of daily living (EADL) score at end of scheduled follow‐up (median 6 months) | The mean EADL score ranged across control groups depending on the measure used (see Analysis 1.5) | The mean EADL score in the intervention groups was on average higher than usual care. | SMD 0.14 (0.03 to 0.25) | 1262 | ⊕⊕⊝⊝ | Range of scores used to measure EADL (high score means better outcome) therefore comparison is within scores. |
| Satisfaction with services at end of scheduled follow‐up (median 6 months) | Medium risk population | OR 1.60 (1.08 to 2.38) | 513 | ⊕⊕⊝⊝ | Stated satisfaction of patients with service received. | |
| 610 per 1000 | 690 per 1000 | |||||
| Length of initial hospital stay (days) | The mean length of stay in hospital and/or institution ranged across control groups from 10 to 50 days. | The mean length of stay in the intervention groups was | MD ‐ 5.5 (2.9 to 8.2) days | 2161 | ⊕⊕⊕⊝ | Length of stay in a hospital and/or institution. Most trials reported initial hospital stay. |
| Readmission to hospital at end of scheduled follow‐up (median 6 months) | Medium risk population | OR 1.09 (0.79 to 1.51) | 784 | ⊕⊕⊝⊝ | ||
| 250 per 1000 | 270 per 1000 | |||||
| *The basis for the assumed risk (e.g. the median control group risk across studies) is provided in footnotes. The corresponding risk (and its 95% confidence interval) is based on the assumed risk in the comparison group and the relative effect of the intervention (and its 95% CI). | ||||||
| GRADE Working Group grades of evidence | ||||||
| The trials on average focused on a middle band of stroke patients with moderate levels of disability. a) Downgraded once for risk of performance bias. Sensitivity analyses indicate little risk from other potential biases. b) Downgraded twice for risk of performance bias and potential risk of missing data. c) Downgraded for risk of performance bias. Substantial heterogeneity of results are present but unlikely to alter direction of effect. | ||||||
Background
Description of the condition
Stroke is a global healthcare problem and in most countries is one of the leading causes of death and acquired adult disability (Warlow 2008). Stroke is also expensive and consumes 5% of all health service resources within the UK National Health Service (Saka 2009). Despite major advances in the medical management of stroke, the majority of people with continue to rely on post‐stroke rehabilitation interventions (Langhorne 2011). Conventionally, rehabilitation after stroke is provided in hospital. Thus, in‐patient care of disabled stroke patients accounts for much of the substantial economic costs (Warlow 2008).
Rehabiliation in hospital can achieve good clinical outcomes. A recent updated systematic review evaluating in‐patient stroke care has indicated that organised in‐patient (stroke unit) care is effective in reducing death and disability (SUTC 2013). However, many important questions about stroke service provision remain unanswered. In particular, are there effective alternatives to in‐patient care and how can care be best provided after discharge from hospital?
Description of the intervention
A previous review focused on those systems of care which have been set up as complete alternatives to in‐patient care, that is, services such as 'hospital at home', which aim to prevent stroke patients being admitted to hospital (Langhorne 1999). A second approach has been to develop services that may accelerate the discharge of patients already admitted to hospital. These services have variously been termed 'early supported discharge (ESD) schemes', 'early home supported discharge services', 'accelerated discharge schemes' and 'post‐discharge support services', and form the basis of this review. This review focuses on the effectiveness of such early supported discharge services.
How the intervention might work
One of the main areas of concern to patients and carers is the organisation of discharge from hospital (Warlow 2008); moving from being cared for in hospital by a team of professionals, to being at home and the responsibility of themselves and their carers. ESD services were developed to try and improve the transition between hospital and community by accelerating discharge home from hospital but providing more continuity of rehabilitation in the home setting. Some arguments in favour of ESD services are summarised as better partnership between the patient and therapist, helping patient motivation by focusing on more realistic rehabilitation goals, providing rehabilitation in a more relevant context, encouraging more focus on self‐directed activities, and fostering a more realistic understanding of future recovery (Langhorne 2007).
Why it is important to do this review
Although arguments have been made for and against ESD services (Langhorne 2007), the basic question ‐ whether a policy of early hospital discharge with support is as effective and efficient as conventional hospital care, discharge planning, and post‐discharge care ‐ needs to be tested in rigorous trials and systematic reviews. This remains an area of great clinical interest that features in clinical practice guidelines (ESO 2008; RCP 2008), and is the subject of ongoing trials.
Objectives
To establish if, in comparison with conventional care, services that offer people in hospital with stroke a policy of early discharge with rehabilitation provided in the community (ESD) can: 1) accelerate return home, 2) provide equivalent or better patient and carer outcomes, 3) be satisfactory to patients and carers, and 4) have justifiable resource implications use.
Methods
Criteria for considering studies for this review
Types of studies
We included all randomised trials that allocated individual patients to either conventional hospital care and discharge procedures or alternative services that aimed to accelerate the patient's discharge from hospital. Therefore, randomisation will have taken place relatively early after hospital admission and before hospital discharge.
Types of participants
Any patient who has been admitted to hospital with a clinical diagnosis of stroke (defined as an acute focal neurological deficit caused by cerebrovascular disease). Where possible, we tried to record stroke severity (level of disability) at randomisation using activities of daily living (ADL) status.
Types of interventions
We included trials evaluating any intervention that aimed to accelerate discharge from hospital with the provision of support (with or without a 'therapeutic' rehabilitation intervention) in a community setting (ESD). We recorded the specific type of intervention, but this was not used as an exclusion criterion. We aimed to include trials that focused largely or entirely on stroke patients. We derived prespecified subgroups from recognised indicators of in‐patient stroke service quality, in particular whether care was planned and provided by a specialist team whose work was co‐ordinated through regular multidisciplinary team meetings.
Types of outcome measures
Primary outcomes
The main focus of the analysis was on the patient outcomes of: death, physical dependency (i.e. dependent on help for transfers, mobility, washing, dressing or toileting), and place of residence (home, residential home, nursing home, hospital).
The primary patient outcome was the composite end‐point of death or long‐term dependency recorded at the end of scheduled follow‐up.
We also analysed death or requiring institutional care (residential home, nursing home, hospital) at the end of scheduled follow‐up, and death at the end of scheduled follow‐up.
The main resource outcome was the length of the index hospital stay. We planned to record other resource outcomes (i.e. readmission to hospital, number of readmissions, number of readmission days, cost of in‐patient stay, total cost of service interventions), but in the end were limited to length of the index hospital stay, readmission to hospital, and total cost of service interventions.
Secondary outcomes
-
Activities of daily living (ADL) score.
-
Extended ADL score.
-
Subjective health status.
-
Mood (mood or depression score).
-
Carer outcomes (carer mood and subjective health status).
-
Patient and carer satisfaction and/or service preference.
Search methods for identification of studies
See the 'Specialized register' section in the Cochrane Stroke Group module. We searched for trials in all languages and arranged translation of relevant papers where necessary.
Electronic searches
In collaboration with the Cochrane Stroke Group Information Specialist, we searched:
-
Cochrane Stroke Group Trials Register (to January 2017);
-
Cochrane Central Register of Controlled Trials (CENTRAL; 2017, Issue 1) in the Cochrane Library (searched January 2017) (Appendix 1);
-
MEDLINE in Ovid (searched January 2017) (Appendix 2);
-
Embase in Ovid (searched January 2017) (Appendix 3);
-
CINAHL in EBSCO (Cumulative Index to Nursing and Allied Health Literature; 1937 to January 2017) (Appendix 4);
-
Web of Science (searched January 2017).
We aimed to identify all relevant randomised controlled trials (RCTs) regardless of language or publication status (published, unpublished, in press, or in progress). We used the search strategy for MEDLINE with the assistance of the Cochrane Stroke Group Information Specialist and modified it to suit other databases (Appendix 2). To avoid duplication of effort, we restricted the searches of MEDLINE and Embase from January 2008 as these databases have already been searched to that date for all stroke trials and relevant trials added to the Cochrane Stroke Group Trials Register.
In March 2017, using the keywords 'stroke' and 'discharge', we searched:
-
US National Institutes of Health Ongoing Trials Register ClinicalTrials.gov (https://clinicaltrials.gov/);
-
World Health Organization (WHO) International Clinical Trials Registry Platform (ICTRP) (http://apps.who.int/trialsearch/);
-
ISRCTN Registry (www.isrctn.com) (formerly Current Controlled Trials metaRegister of Controlled Trialls (mRCT)) active and archived registers (www.controlledtrials.com/mrct) and International Standard Randomised Controlled Trial Number Register (www.controlledtrials.com/isrctn/);
-
CenterWatch Clinical Trials Listing Service (http://www.centerwatch.com/);
-
Community Research & Development Information Service (of the European Union) (http://cordis.europa.eu/home_en.html);
-
Hong Kong clinical trials register (http://www.hkuctr.com/)
Searching other resources
In an effort to identify further published, unpublished, and ongoing trials we also performed citation tracking of included studies, checked reference lists of relevant articles, and contacted trialists.
Data collection and analysis
Selection of studies
One review author (PL) read the titles and abstracts of the records obtained from the electronic searches and excluded obviously irrelevant studies. We obtained the full copy of the remaining studies and two review authors (PL, SB) independently selected studies for inclusion based on the following eligibility criteria (ESD trialists 2012).
-
RCT.
-
Service intervention providing rehabilitation or physical support, or both, in a community setting.
-
Service aim is to accelerate discharge home from hospital (i.e. randomisation takes place during hospital admission).
-
Trial of stroke patients.
We previously contacted the trialists and invited them to join an individual patient data review of all comparable trials. This update is largely based on published trial data but we hope to include further individual patient data in future updates.
Data extraction and management
For the previous version of this review our primary aim was to obtain individual patient data from the trialists (ESD trialists 2012). We contacted the co‐ordinators of the eligible trials and invited them to join a collaborative group. We asked them to provide a detailed description of their intervention and control services and also to provide basic individual patient data particularly concerning the primary patient outcomes and pre‐planned subgroup analyses. Where these were not available in an appropriate format, we sought standardised (tabular) outcome data. Where data had to be taken from published sources, two review authors independently extracted the data using a standard data extraction form. We collected descriptive information about service characteristics using a standard questionnaire prior to the identification and analysis of outcome data.
For the current update two review authors (PL, SB) independently extracted the data using a standard data extraction form. We then cross‐checked our interpretation with the primary authors.
Assessment of risk of bias in included studies
We assessed risk of bias using Cochrane's 'Risk of bias' tool as described in Chapter 8 of the Cochrane Handbook for Systematic Reviews of Interventions (Higgins 2011). We identified the method of concealment of treatment allocation, the presence of an intention‐to‐treat analysis, and the presence of blinding of outcome assessment as potentially important factors for sensitivity analyses, but we did not use them as exclusion criteria.
Measures of treatment effect
The primary patient outcome was the composite end‐point of death or long‐term dependency recorded at the end of scheduled follow‐up. Where death, dependency or institutionalisation after the end of scheduled follow‐up were reported, we analysed these using the odds ratio (OR) and 95% confidence interval (CI).
We sought data on initial stroke severity using the most widely available marker of functional ability (Activities of Daily Living (ADL) score during the first week post stroke). Most trials could easily provide this as the Barthel Index at randomisation. However, in three trials randomisation frequently took place later (occasionally up to six weeks post stroke) (Adelaide 2000; Adelaide 2016; London 1997). Where possible, we estimated the baseline Barthel assuming a typical recovery of one Barthel point per week, e.g. Barthel of 14/20 at week four indicates an initial score of 10/20.
Many secondary outcomes were expressed as continuous outcome scores. We aimed to analyse these as the mean and standard deviation of the score. Where only medians were available we assumed these were approximate to the mean. Where only interquartile ranges (IQR) were reported we inferred the standard deviation as follows: the IQR will incorporate 50% of the distribution of data compared with standard deviation, which can be expected to include 70% (+ or ‐ 35%) of the distribution. Therefore, assuming a normal distribution then one standard deviation should equal the IQR/(2 x 0.7). Where no other data were provided with the mean value, we inferred the standard deviation as being at least as large as the comparable trials using the same measure. We used sensitivity analyses to check the impact of data assumptions.
Unit of analysis issues
For this update we planned to conduct all analyses at the level of the individual randomised participant. As a result of this modification, we removed one previously included cluster‐randomised trial from the analysis (Glostrup 2006).
Dealing with missing data
Where data were missing for the primary outcome, we assumed the patient to be alive, independent, and living at home. We explored the implications of this in a sensitivity analysis.
Assessment of heterogeneity
We planned to determine heterogeneity using the I2 statistic. We defined significant heterogeneity as an I2 of greater than 50%. Where significant heterogeneity occurred, we explored potential sources using pre‐planned sensitivity analyses and carried out funnel plots.
Assessment of reporting biases
We employed a comprehensive search strategy in an effort to avoid reporting biases. To identify unpublished studies, we searched trial registers and contacted trialists and other experts in the field.
Data synthesis
We checked all patient data for internal consistency and consistency with published reports. One review author entered data into Review Manager 5 (RevMan 2014), and a second review author checked the entries. We analysed binary outcome data using the OR and 95% CI. We used a fixed‐effect model first but replaced this with a random‐effects model if there was significant heterogeneity. If possible, we analysed continuous outcome data (e.g. ADL scores) using the mean difference (MD) and 95% CI for identical outcomes and the standard mean difference (SMD) where different measurement techniques were used to measure the same outcome domain. We used a fixed‐effect model first but replaced this with a random‐effects model if there was significant heterogeneity. We had to reverse several outcome scores (e.g. mood scores) to ensure all scores compared were operating in the same direction. This was done by subtracting the observed score from the maximum possible score. Where multi‐arm studies were identified we planned to combine the comparable groups. If this was not possible we planned to divide the control group and treat the individual arms as separate studies.
'Summary of findings' and GRADE
We included each of the main analyses in a 'Summary of findings' table and subjected them to a GRADE analysis (summary of findings Table for the main comparison). These included the outcomes of death or dependency, death, death or institutional care, extended activities of daily living score, satisfaction with services, readmission to hospital (all recorded at the at the end of scheduled follow‐up), and length of initial stay in hospital.
Subgroup analysis and investigation of heterogeneity
Previous subgroup analyses were based on patient characteristics of age, gender, presence of carer, and stroke severity (Barthel Index in the first week). We based subgroup analyses of service characteristics on the ESD characteristics (whether based on a co‐ordinated multidisciplinary team), ESD service base (hospital out‐reach or community in‐reach), and the nature of the control service (based on a stroke unit or other service). We aimed to update these if the relevant data were available. We initially trichotomised stroke severity and age but subsequently collapsed these into two groups for simplicity and consistency with previous reviews (SUTC 2013).
Sensitivity analysis
We planned sensitivity analyses around the method of randomisation (concealment of treatment allocation), an intention‐to‐treat analysis (loss to follow‐up), and blinding of outcome assessment.
Results
Description of studies
(See: Characteristics of ongoing studies; Characteristics of studies awaiting classification; Characteristics of excluded studies)
Results of the search
The search strategy for the second version of this review (ESD trialists 2005) identified 29 potentially eligible trials of which three (Ayrshire 2000; Auckland 1999; Cumbria 2004) were in the early stages of planning but never started. The original assessors agreed on the inclusion of 10 trials, the exclusion of 14 trials and disagreed on two trials (Akershus 1998; New York 1986). After discussion and obtaining more information, both these trials were considered eligible but one was excluded (New York 1986) as no outcome information has ever been identified (see below). Therefore, the previous version of this review included 11 trials (ESD trialists 2005).
For the previous update (ESD trialists 2012), we identified three new trials (Copenhagen 2009; Glostrup 2006; Trondheim 2004) plus newly published data for three previously included trials (Montreal 2000; Stockholm 1998; Trondheim 2000). We required further information for two trials (ATTEND pilot 2015; Edirne 2001) to assess eligibility, and an additional five trials (Aveiro 2016; Bergen 2014; Hong Kong; Perth; West Denmark) did not yet have available outcome data. We asked the co‐ordinators of all eligible trials to provide a detailed description of their intervention and control services, which were collected using a standard questionnaire prior to the identification and analysis of outcome data.
For this current update we, identified 9872 titles and excluded 9618 as obviously irrelevant or duplicates (Figure 1). Of the 54 records reviewed as abstracts, 45 were duplicates or referred to previously identified studies. This left nine new reports (four included trials, one awaiting classification, two ongoing trials, two excluded trials), in addition to the 42 from the previous version (ESD trialists 2012); 13 included trials, two awaiting classification, five ongoing trials, and 22 excluded trials (including one cluster trial that was previously included). Therefore, for this update we had: 17 included trials (see Characteristics of included studies), three awaiting assessment (Edirne 2001; Shi 2014; Tian 2015), seven ongoing trials (ATTEND; Care4Stroke; Gothenburg; Hong Kong; Perth; RECOVER; West Denmark), and 24 excluded trials (see Characteristics of excluded studies).

Flow diagram illustrating the results of the updated searches
Included studies
The services under comparison are outlined in detail (Characteristics of included studies). We were particularly interested in establishing the degree of co‐ordination and organisation of the community and hospital services (i.e. whether patients received care from a co‐ordinated multidisciplinary team with some specialist interest in stroke which met on a regular basis). By this definition the following classifications can be made.
Intervention services
-
Early supported discharge (ESD) team co‐ordination and delivery: in nine trials the ESD service comprised a multidisciplinary team which co‐ordinated discharge from hospital, post‐discharge care and provided rehabilitation and patient care at home or in a community setting (Adelaide 2000; Aveiro 2016; Belfast 2004; Copenhagen 2009; London 1997; Manchester 2001; Montreal 2000; Newcastle 1997; Stockholm 1998). The multidisciplinary team met on a regular basis to plan patient care.
-
ESD team co‐ordination: in four trials discharge home and the immediate post‐discharge care was planned and supervised by a co‐ordinated multidisciplinary team (Bergen 2014; Oslo 2000; Trondheim 2000; Trondheim 2004). However, care was subsequently handed over to existing community‐based agencies who provided continuing rehabilitation and support at home. These community‐based agencies did not always provide co‐ordinated multidisciplinary team care (i.e. input from a multidisciplinary team which met on a regular basis to plan patient care). However, in some trials the community teams were also multidisciplinary in nature and focused on working with stroke patients early after discharge (Bergen 2014; Oslo 2000). One recent trial randomised patients to one of two different forms of ESD service (Bergen 2014); based in a community day unit (Bergen 2014 ‐ Day unit) or in their homes with home‐visits from the community health team (Bergen 2014 ‐ Home care). Although both met the definition of an ESD service they have, where possible, been analysed separately to reflect this difference in design.
-
No ESD team: in four trials, patients had access to multidisciplinary team care in hospital, but this ended at hospital discharge (Adelaide 2016; Akershus 1998; ATTEND pilot 2015; Bangkok 2002). Their subsequent care was provided by a range of community stroke services which were; not planned or provided by a co‐ordinated team (Akershus 1998), were provided by trained healthcare volunteers (Bangkok 2002), or provided through supported training by a physiotherapist for patients and family (Adelaide 2016; ATTEND pilot 2015).
The boundary between groups 1 and 2 does not appear clear cut but indicates a spectrum of approaches where an ESD team plans and co‐ordinates discharge, provides early post‐discharge rehabilitation, and then hands over care to other community services.
ESD team structure, practices and procedures
Details of ESD team practices can best be obtained from the original trials. However, we previously developed a summary description of the services to indicate the type of service provided. From recorded staff contact time, we calculated standardised staffing levels (whole time equivalents (WTE) sufficient to manage a notional 100 new patients per year) (Adelaide 2000; Aveiro 2016; London 1997; Montreal 2000; Newcastle 1997; Stockholm 1998), or a typical team caseload (Belfast 2004; Trondheim 2000; Trondheim 2004). We assumed staff would have a 35‐hour working week with 20 hours direct contact time and 10 hours indirect contact time.
Typical ESD teams had approximately 3.1 WTE staff (range 2.6 to 4.6) as follows; medical 0.1, nursing (ranged from 0 to 1.2), physiotherapy 1.0, occupational therapy 1.0, speech and language therapy 0.3, assistant 0.4. Variable levels of social work (0 to 0.5 WTE) and secretarial support were also available (Table 1).
| Trial | Setting | Key features | Control service base | ESD staffing (whole time equivalents for caseload of 100 patients/year; median and range) | |||||||
| Medical | Nursing | Physio | OT | SALT | Assistant | Other | Total | ||||
| ESD team co‐ordination and delivery | |||||||||||
| Urban | PHMR Goals documented | Rehabilitation unit (stroke and neurological) | 0.06 | 0.06 | 0.7 | 1.6 | 0.25
| 0.4
| Social work | 2.6 | |
| Mixed | Tailored | Mixture (stroke unit, case managers in community‐based team) | 0.8 | 0 | 1.0 | 1.5 | 0 | 0 | Psychology | 3.2 | |
| Mixed | PHMR | Mixture (medical, geriatric, stroke unit) | 0.1 | 0 | 1.5
| 1.0
| 0.5
| 1.5 | Secretary Social work | 4.6 | |
| Urban | Tailored | Stroke unit | nd | nd | nd | nd | nd | nd | nd | nd | |
| Urban | Equipment store | Mixture (medical, stroke unit) | 0.1 | 0 | 1 | 1 | 0.5 | 0.5 | ‐ | 3.1 | |
| Urban |
| Mixture (medical, stroke team or unit) | nd | nd | nd | nd | nd | nd | ‐ | nd | |
| Urban |
| Mixture (medical neurology) | 0 | 0.4 | 1.0 | 0.7 | 0.4 | ‐ | Dietitian | 2.7 | |
| Urban | Envt visit Key worker 7‐day input PHMR | Mixture (medical, geriatric) | 0
| 0 | 0.8 | 1.0 | 0.3 | 0.2
| Secretary Social work Carers | 2.8 | |
| Urban | Case manager Patient diary | Stroke unit | 0.03 | 0 | 1.0 | 1.0 | 0.5 | ‐ | ‐ | 2.6 | |
| Mixed | Tailored | Neurorehabilitation centres (3) | ? | 0 | ? | ? | 0 | 0 | 0 | ? | |
| ESD team co‐ordination | |||||||||||
| Urban | Day Unit ESD Home‐based ESD | Stroke unit | nd | nd | nd | nd | nd | nd | nd | nd | |
| Urban | Key worker Community services | Stroke unit | nd | nd | nd | nd | nd | nd | ‐ | nd | |
| Urban | Key worker Team Community services | Stroke unit | 0.12 | 1.2 | 1.2 | 1.2 | 0 | ‐ | ‐ | 3.7 | |
| Rural |
| Stroke unit | 0.12 | 1.2 | 1.2 | 1.2 | 0 | ‐ | ‐ | 3.7 | |
| 10 urban 3 mixed 1 rural | 7 stroke unit 5 mixed service 2 neurorehabilitation unit | 0.10 (0 to 0.12) | 0 (0 to 1.2) | 1.0 (0.7 to 1.5) | 1.0 (0.7 to 1.6) | 0.3 (0 to 0.5) | 0.4 (0 to 1.5) | ‐ | 3.1 (2.6 to 4.6) | ||
| No ESD team | |||||||||||
| Urban | Caregiver‐mediated exercises combined with tele‐rehabilitation services | Stroke unit | nd | nd | nd? | nd | nd | nd | ‐ | nd | |
| Mixed | Range of community rehabilitation services | Stroke unit | nd | nd | nd | nd | nd | nd | ‐ | nd | |
| Mixed | Family‐mediated rehabilitation with mostly remote follow‐up | Stroke unit | nd | nd | < 1.0 | nd | nd | nd | ‐ | nd | |
| Urban | Red Cross volunteers | Stroke unit | nd | nd | nd | nd | nd | nd | ‐ | nd | |
MDT mtg: multidisciplinary team meeting
N: number of participants
nd: no comparable data
OT: occupational therapy
PHMR: patient‐held medical record
physio: physiotherapy
SALT: speech and language therapy
The ESD teams could either have a community (community in‐reach) or hospital base (hospital out‐reach) with experience in stroke rehabilitation/neurological rehabilitation (Adelaide 2000; Aveiro 2016; Belfast 2004; Bergen 2014; Copenhagen 2009; London 1997; Manchester 2001; Montreal 2000; Newcastle 1997; Oslo 2000; Stockholm 1998; Trondheim 2000; Trondheim 2004). All co‐ordinated their work through regular multidisciplinary team meetings. A typical approach would involve the early identification of the patient in hospital and a visit from the key worker (case manager) from the ESD team. Discharge was planned with the patient and carer, often involving a pre‐discharge home visit (attended by the patient) or environmental visit (not attended by the patient). Team input typically began on the day of discharge and could be provided as required. In practice this ranged from daily input to four to five days per week. Typically teams would agree recovery goals with the patient and negotiate the termination of services within three months (which would be tapered off as goals were achieved). Many teams used a patient‐held medical record and provided a formal discharge summary at the end of input.
Control services
These were categorised on whether organised stroke unit care was available to patients prior to discharge (Table 1). In 12 trials, all patients were recruited from a stroke unit or neurological rehabilitation unit staffed by a multidisciplinary team (Adelaide 2000; Adelaide 2016; Akershus 1998; ATTEND pilot 2015; Aveiro 2016; Bergen 2014; Copenhagen 2009; Oslo 2000; Stockholm 1998; Trondheim 2000; Trondheim 2004) or most patients (Belfast 2004). Five trials recruited a minority of patients from a multidisciplinary stroke unit setting (Bangkok 2002; London 1997; Manchester 2001; Montreal 2000; Newcastle 1997). Therefore, the control service was frequently provided in general wards. Discharge arrangements were variable in the control services with a minority undergoing a pre‐discharge home visit and variable follow‐up arrangements.
Settings of services
The trials identified come from nine countries (Australia, Canada, Denmark, India, Norway, Portugal, Sweden, Thailand, UK). Fourteen trials were established in city hospitals servicing largely urban areas while two (Aveiro 2016; Belfast 2004) covered a mixture of rural and urban areas. An additional trial recruited only patients from rural addresses who were admitted to a large urban hospital (Trondheim 2004).
Patient characteristics
Patients had a clinical diagnosis of stroke and the average patient age in the trials ranged from 60 to 80 years. There appeared to be a degree of selection of patients deemed suitable for the ESD services that was based on need (persisting disability), stability of their medical condition, and practicability (living within the local area). The average (mean or median) initial Barthel index (at the time of patient recruitment) in each study ranged from 10/20 to 19/20 with a lower IQR limit of 6 to 16/20 and an upper value of 14 to 19/20. Thus the typical patient population had an initial Barthel index of 14/20 with an IQR of 10 to 18.
We repeated this process to estimate the Barthel index (or equivalent score) at the time of discharge for those trials where the ADL score was recorded within one week prior to discharge (Adelaide 2000; Aveiro 2016; Belfast 2004; Bergen 2014; London 1997; Manchester 2001; Newcastle 1997; Trondheim 2000; Trondheim 2004). The average (mean or median) initial Barthel index (within one week prior to discharge) in each study ranged from 13/20 to 19/20 with a lower IQR limit of 10/20 to 16/20 and an upper value of 15/20 to 19/20. Thus the typical patient population prior to discharge had an initial Barthel index of 15/20 with an IQR of 11/20 to 17/20.
None of the trials recruited more than 70% of hospitalised stroke patients; a median of 33% (range 13% to 70%) of hospitalised stroke patients met the clinical criteria for the early discharge service (NB: in some trials, a further group of patients did not meet research criteria such as an ability to complete research assessments). We have summarised the inclusion and exclusion criteria of the individual trials in the Characteristics of included studies table.
Outcomes
Most trials included our main outcomes of death, residence (institutional care) and dependency (Barthel index, Rankin score or Functional Independence Measure), all recorded at the end of scheduled follow‐up, as well as our primary resource outcome length of initial hospital stay (Table 2). Missing data for the primary outcome are summarised in Table 3. Two trials subsequently reported further outcomes of death and dependency after scheduled follow‐up (at one year and five years) (Stockholm 1998; Trondheim 2000).
| Trial | Death | Institutional care | Dependency | Defined dependent | Length of stay |
| 6 months | 6 months | 6 months | Barthel index < 95/100 | Initial hospital discharge | |
| 3 months | ‐ | 3 months | Barthel index | Initial hospital discharge and up to 12 months | |
| 7 months | 7 months | 7 months | Barthel index < 95/100 | Not used ‐ only available for acute hospital | |
| 6 months | ‐ | 6 months | Rankin score 3 to 5 | Initial hospital discharge (median, IQR) | |
| 6 months | 6 months | 6 months | Functional Independence Measure < 60 points | Initial stroke unit stay (also stay in rehabilitation unit) | |
| 6 months | 6 months | 6 months | Barthel index < 95/100 | Initial hospital discharge | |
| 12 months | 12 months | 12 months | Barthel index < 19/20 | Initial hospital discharge | |
| 6 months | 6 months | 6 months | Rankin score 3 to 5 | Initial hospital stay plus institution up to 6 months | |
| 5 months | 5 months | 3 months | Rankin score 3 to 5 | Initial hospital stay | |
| 12 months | 12 months | 12 months | Barthel index < 19/20 | Initial hospital discharge | |
| 12 months | 12 months | 12 months | Barthel index < 19/20 | Initial hospital stay (acute and rehabilitation wards) | |
| 3 months | 3 months | 3 months | Barthel index < 95/100 | Initial hospital stay | |
| 3 month | 3 month | 3 month | Rankin score 3 to 5 | Initial hospital stay | |
| 6 month | 6 month | 6 month | Rankin score 3 to 5 | Initial hospital stay | |
| 6 month | 6 month | 6 month | Barthel index 95/100 | Initial hospital stay | |
| 6 months | 6 months | 6 months | Barthel index 95/100 | Initial hospital stay | |
| 12 months | 12 months | 12 months | Rankin score 3 to 5 | Initial hospital stay (acute and rehabilitation wards) |
IQR: interquartile range
| Trial | Recruited intervention | Recruited control | Recruited total | Missing intervention | Missing control | Available intervention | Available control | Available total | Comments |
| 885 | 874 | 1759 | 31 | 25 | 854 (96%) | 849 (97%) | 1703 (97%) | ||
| 31 | 32 | 63 | 2 | 2 | 29 (94%) | 30 (94%) | 59 (94%) | Not available as dichotomous outcome | |
| 50 | 54 | 104 | 5 | 9 | 45 (90%) | 45 (83%) | 90 (87%) | ||
| 95 | 95 | 190 | 19 | 17 | 76 (80%) | 78 (82%) | 154 (81%) | ||
| 207 | 99 | 306 | 44 | 33 | 163 (79%) | 66 (67%) | 229 (75%) | ||
| Total | 1268 | 1154 | 2422 | 101 | 86 | 1166 (92%) | 1068 (93%) | 2234 (92%) |
Secondary outcomes included a range of measures, which are summarised in the Characteristics of included studies table and the sampling analysis schedule provided in Table 4 and Table 5.
| Trial | Timing of outcome | ADL score | Extended ADL score | Subjective health | Mood | Service satisfaction | Hospital readmission |
| 6 months | Barthel index (median, IQR) | Adelaide Activities Profile | SF‐36 (General health perceptions) | SF‐36 (mental health) | Satisfied with rehabilitation programme | 6 months | |
| 3 months | Barthel index (mean, 95% CI) | Nottingham extended ADL (mean, 95% CI) | Stroke Impact Scale | Hospital Anxiety and Depression Scale (HADS) | ‐ | 12 months | |
| 7 months | Barthel index (median, imputed SD) | ‐ | SF‐36 (general health perceptions) | SF‐36 (mental health) | ‐ | ‐ | |
| 6 months | ‐ | Nottingham Extended | EQ‐5D | Hospital anxiety and depression scale (category) | ‐ | 6 months | |
| 6 months | FIM (mean, SD) | Frenchay Activities Index | ‐ | ‐ | ‐ | ‐ | |
| ‐ | ‐ | ‐ | ‐ | ‐ | ‐ | ‐ | |
| 12 months | Barthel index | Nottingham extended ADL | SF‐36 (general health perceptions) | SF‐36 (mental health) | Satisfied with outpatient rehabilitation | 6 month | |
| 6 months | Barthel index (median, IQR) | ‐ | ‐ | ‐ | Satisfaction score (mean & SD) | ‐ | |
| 3 months | Barthel Index (median, imputed SD) | ‐ | EQ‐5D | ‐ | 5 months | ||
| 12 months | Barthel index | Rivermead ADL score | Nottingham health profile (score reversed) | Number abnormal on hospital anxiety and depression scale | Satisfied with care in general | 12 month | |
| 12 months | Barthel index | Nottingham extended ADL score | Euroquol scale (0 to 100) | Hospital anxiety and depression scale (depression subscore, score reversed) | ‐ | ‐ | |
| 3 month | Barthel index | Instrumental ADL (OARS) scale | SF‐36 (general health perceptions) | SF‐36 (mental health) | ‐ | ‐ | |
| 3 month | ‐ | Nottingham extended ADL score (median, IQR) | Dartmouth COOP chart overall health section (median, IQR; scale reversed) | Dartmouth COOP chart feelings section (median, IQR; scale reversed) | ‐ | 3 month | |
| 6 month | ‐ | Nottingham extended ADL score (median, IQR) | General Health Questionnaire (reversed score) | MADRS score | Satisfied with care in general | ‐ | |
| 8 months | ‐ | Frenchay Activities index (median, IQR) | Sickness impact profile score (median, IQR) | ‐ | Satisfied with care received | 6 months | |
| 12 months | ‐ | Frenchay social activity index | Nottingham Health Profile (average of sum 1 and 2) | MADRS | ‐ | ‐ | |
| 12 months | Barthel Index | ‐ | Nottingham health profile | ‐ | ‐ | ‐ |
ADL: activities of daily living
COOP: Care Cooperative Information Project
GDS: Geriatric Depression Scale
IQR: interquartile range
MADRS: Montgomery‐Åsberg Depression Rating Scale
OARS: Older Americans Resources and Services scale
SD: standard deviation
SF: short form
| Trial | Timing of outcome | Subjective health | Mood | Service satisfaction |
| 6 months | SF‐36 general health perceptions | SF‐36 mental health | Satisfied with rehabilitation programme | |
| 3 months | Caregiver Strain Index (score reversed) | Hospital Anxiety and Depression Scale (score reversed) | ||
| ‐ | ‐ | ‐ | ‐ | |
| 6 months | Caregiver Burden Scale (category) | ‐ | ‐ | |
| ‐ | ‐ | ‐ | ‐ | |
| ‐ | ‐ | ‐ | ‐ | |
| 6 months | Caregiver strain index (score reversed) | ‐ | Satisfied with outpatient services | |
| ‐ | ‐ | ‐ | ‐ | |
| 3 months | Satisfied with rehabilitation programme | |||
| 12 months | Caregiver strain index (score reversed) | ‐ | Satisfied with care in general | |
| 12 month | ‐ | Hospital Anxiety and Depression Scale (depression subscore, score reversed) | ‐ | |
| 3 months | Caregiver Burden Index | ‐ | ‐ | |
| 3 months | General health questionnaire (median, range; score reversed) | ‐ | ‐ | |
| 6 months | General health questionnaire (score reversed) | ‐ | Satisfied with care in general | |
| ‐ | ‐ | ‐ | ‐ | |
| 12 months | Caregiver Burden score | ‐ | ‐ | |
| 12 months | Caregiver strain index (score reversed) | ‐ | ‐ |
Excluded studies
See the Characteristics of excluded studies table.
Risk of bias in included studies
See the 'Risk of bias' graph (Figure 2), the 'Risk of bias' summary (Figure 3), and the Characteristics of included studies table.
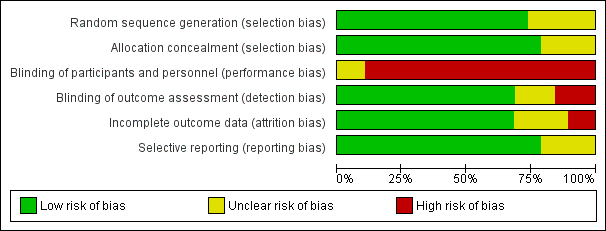
'Risk of bias' graph: review authors' judgements about each risk of bias item presented as percentages across all included studies.

'Risk of bias' summary: review authors' judgements about each risk of bias item for each included study.
Allocation
Fifteen trials used a clearly concealed randomisation procedure (Adelaide 2000; Adelaide 2016; ATTEND pilot 2015; Aveiro 2016; Belfast 2004; Bergen 2014; Copenhagen 2009; London 1997; Manchester 2001; Montreal 2000; Newcastle 1997; Oslo 2000; Stockholm 1998; Trondheim 2000; Trondheim 2004).
Blinding
Performance bias was a potential risk in all included trials as blinding of participants or treating personnel was impossible due to the nature of the intervention.
Thirteen trials clearly reported using an independent (blinded) assessment of outcomes at a fixed time after recruitment (median six months; range three to 12 months) (Adelaide 2000; Adelaide 2016; Akershus 1998; ATTEND pilot 2015; Belfast 2004; Bergen 2014; London 1997; Manchester 2001; Montreal 2000; Oslo 2000; Stockholm 1998; Trondheim 2000; Trondheim 2004).
Incomplete outcome data
Those trials with published outcome data were generally complete, at least for the main outcomes of death, institutionalisation and dependency (see Results). For the primary outcome of death or dependency, data were missing for 101/1236 (8.2%) and 86/1122 (7.7%) of participants at the end of scheduled follow‐up (Table 3). However, one of these trials, which was missing two intervention patients and two controls, could not contribute to the primary analysis of the dichotomous outcome of death or dependency (Adelaide 2016) (Analysis 1.3).
Selective reporting
We judged most trials to be at low risk of reporting bias, at least for the primary outcomes, as the outcomes were sought from, and provided by, the trialists. However, the completeness of reporting of secondary outcomes is less certain.
Other potential sources of bias
The trialists who participated in this review were, in general, the authors of the included trials. However, we ensured that trialists avoided making decisions on trial selection and data extraction for their own trial.
Effects of interventions
See: Summary of findings for the main comparison
We analysed results for all comparisons of ESD services (policy of early discharge with home‐based support and rehabilitation) versus conventional services (policy of hospital rehabilitation and conventional discharge arrangements) at the end of scheduled follow‐up (median six months; range three to 12 months). We divided services into three subgroups to reflect the pre‐specified view that effectiveness of ESD services may be influenced by the multidisciplinary teamwork of the ESD team responsible for post‐discharge care (see Description of studies). Therefore, we presented the analysis in the following subgroups:
-
ESD team co‐ordination and delivery: co‐ordinated multidisciplinary ESD team co‐ordinated and provided post‐discharge care;
-
ESD team co‐ordination: co‐ordinated multidisciplinary ESD team co‐ordinated supervised discharge and immediate post‐discharge care but then handed over to other services;
-
no ESD team: post‐discharge services were not provided by co‐ordinated multidisciplinary ESD team.
The interpretation, timing, and analysis of outcomes are shown in Table 2, Table 4 and Table 5.
1. Patient outcomes
1.1: Death
Outcome data were available for 16 trials (2116 participants). We assumed participants with missing data (57 intervention participants and 53 controls) were alive. Overall, there was no significant difference in case‐fatality between the ESD team and conventional services (odds ratio (OR) 1.04, 95% confidence interval (CI) 0.77 to 1.40, P = 0.81, moderate‐grade evidence). There was no significant degree of statistical heterogeneity but a statistical interaction (P = 0.01) between subgroups suggesting a higher case fatality in the subgroup without a co‐ordinated ESD team (Analysis 1.1).
1.2: Death or requiring institutional care
Outcome data were available for 12 trials (1664 participants). We assumed participants with missing data (24 intervention participants and 19 controls) were alive and living at home. Overall, there was a significant reduction in the odds of patients dying or requiring long‐term institutional care (OR 0.75, 95% CI 0.59 to 0.96, P = 0.02, moderate‐grade evidence) with no significant heterogeneity. This equates to an extra five (one to eight) patients living at home for every 100 treated (Analysis 1.2).
1.3: Death or dependency
Outcome data were available for 16 trials (2359 participants). We assumed participants with missing data (99 intervention participants and 84 controls) were alive and independent. Overall, there was a significant reduction in the odds of the combined adverse outcome of death or dependency (OR 0.80, 95% CI 0.67 to 0.95, P = 0.01, moderate‐grade evidence) with no significant heterogeneity. This equates to an extra five (one to nine) patients regaining independence for every 100 receiving ESD services. There was no substantial degree of statistical heterogeneity (Analysis 1.3).
1.4: Activities of daily living (ADL)
These data were available (in a variety of formats) for 12 trials (1449 participants). Overall, there was no apparent difference in the ADL scores of survivors for whom data were available with no significant heterogeneity (Analysis 1.4).
1.5: Extended activities of daily living
These data were available (in a variety of formats) for 11 trials (1262 participants). Overall, there was an apparent increase in extended ADL scores among survivors receiving ESD services (standardised mean difference (SMD) 0.14, 95% CI 0.03 to 0.25, P = 0.01, low‐grade evidence). These results were largely dependent on data from the two subgroups of trials evaluating an ESD team (Analysis 1.5).
1.6: Subjective health status
These data were available (in a variety of formats) from 11 trials (1202 participants). Overall, there was no apparent difference in the subjective health status scores of both groups. There was no significant degree of heterogeneity (Analysis 1.6).
1.7: Mood status
These data were available (in a variety of formats) from nine trials (915 participants). Overall, there was no apparent difference in mood scores. There was no significant heterogeneity. Additional dichotomous data from one trial (London 1997) indicated that those people in the ESD service group were more likely to express anxiety (P = 0.02) and non‐significant trends towards higher levels of depression (Analysis 1.7).
1.8: Patient satisfaction
These data were available (in a variety of formats) from five trials (513 participants). Overall, there was a pattern of ESD service patients being more likely to report satisfaction with outpatient services or services in general (OR 1.60, 95% CI 1.08 to 2.38, P = 0.02, low‐grade evidence). There was no significant heterogeneity (Analysis 1.8).
2. Duration of follow‐up
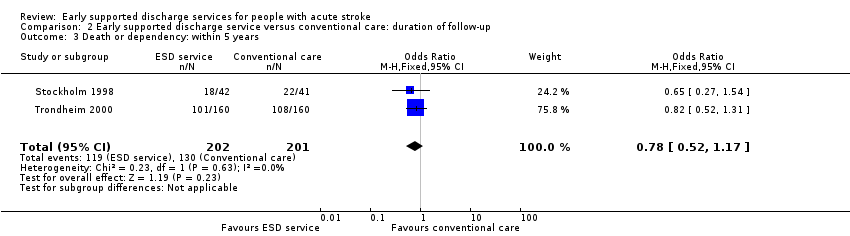
The primary outcome was recorded at the end of scheduled follow‐up (median six months; range three to 12 months). Two trials (403 participants) have reported extended outcome data subsequent to the end of scheduled follow‐up at one year and five years (Stockholm 1998; Trondheim 2000). There was a reduction in the odds of the combined adverse outcome of death or dependency censored by six months (OR 0.70, 95% CI 0.56 to 0.87). Overall, the pattern of a reduction in death or dependency appears to be sustained at one year and five years but included the possibility of no effect (OR 0.84, 95% CI 0.66 to 1.05 and OR 0.78, 95% CI 0.52 to 1.17, respectively) (Analysis 2.1; Analysis 2.2; Analysis 2.3).
3. Carer outcomes
3.1: Subjective health status
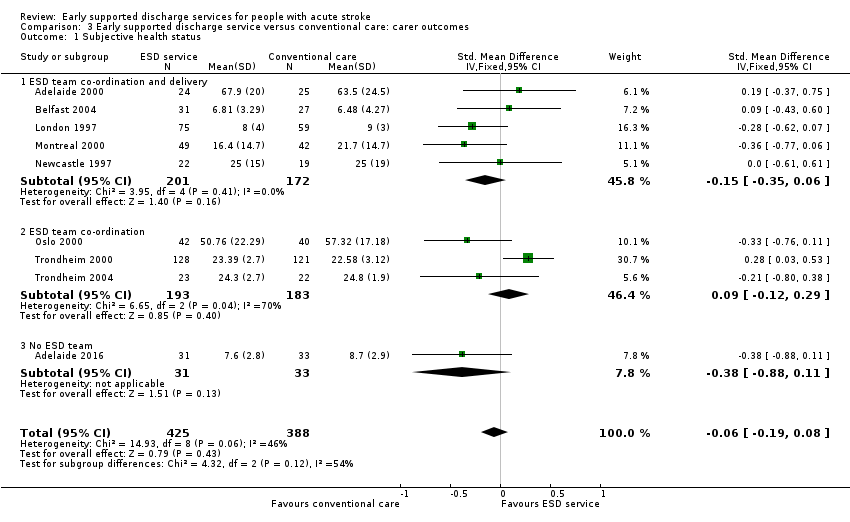
These data were available (in a variety of formats) from nine trials (813 carers). Overall, there was no apparent difference in scores and no significant heterogeneity (Analysis 3.1).
3.2: Mood status
These data were available from only three trials with 122 carers. Overall, there was no apparent reduction in the mood score of carers receiving ESD services, but significant heterogeneity was apparent between trials (Analysis 3.2).
3.3: Carer satisfaction
These data were available (in a variety of formats) from four trials (279 carers). Overall, there was no convincing difference in the odds of carers who received ESD services expressing satisfaction with services (OR 1.56, 95% CI 0.87 to 2.81) (Analysis 3.3).
4. Resource use
(See: Analysis 4.1; Analysis 4.2)
4.1: Length of initial hospital stay
We were able to analyse data on length of initial hospital stay (using the longest available of acute care and rehabilitation for the index admission) for 16 trials (2161 patients) (Analysis 4.1). Across all trials, there was a reduction in the length of hospital stay (MD ‐ 5.5 days, 95% CI 2.9 to 8.2, P < 0.0001, moderate‐grade evidence), which is approximately equivalent to five days. There was, however, considerable heterogeneity, which reduces confidence in the estimates.
Data were incomplete for total length of stay including hospital readmissions. An analysis of the pattern of discharges based on six trials that could provide data (Adelaide 2000, Belfast 2004, London 1997, Manchester 2001, Oslo 2000, Stockholm 1998) is shown in Table 6.
| Time from randomisation | Number (%) discharged | Risk difference (95% CI) | Significance | |
| ESD service (364 patients) | Control (354 patients) | |||
| 2 weeks | 116 (32%) | 77 (22%) | 11 (‐3, 24) | 0.13 |
| 4 weeks | 236 (65%) | 179 (50%) | 19 (4, 35) | 0.01 |
| 6 weeks | 277 (76%) | 249 (70 %) | 8 (1, 15) | 0.02 |
| 8 weeks | 303 (83%) | 275 (78%) | 8 (3, 13) | 0.003 |
| 3 months | 345 (95%) | 324 (92%) | 2 (‐1, 6) | 0.21 |
| 6 months | 363 (100%) | 353 (100%) | 0 (‐2, 1) | 0.71 |
| Data are presented from six trials that could provide relevant data on 718 participants (Adelaide 2000; Belfast 2004; London 1997; Manchester 2001; Oslo 2000; Stockholm 1998). Discharges include deaths and do not include readmissions. The risk difference (95% confidence interval) is calculated taking into account variation between trials | ||||
4.2: Hospital readmissions
Seven trials (784 participants) provided data on the number of participants readmitted to hospital after the index admission. Readmission rates during scheduled follow‐up (27% versus 25%) were very similar (OR 1.09, 95% CI 0.79 to 1.51, P = 0.59, low‐grade evidence) between the ESD service and conventional care groups (Analysis 4.2).
Costs
Costing data are currently available from seven trials (Table 7), which estimated total costs up to three months (Montreal 2000), six months (Adelaide 2000; Newcastle 1997) or one year (London 1997; Stockholm 1998; Trondheim 2000) after randomisation. Estimated costs ranged from 23% less to 15% greater for the ESD group in comparison to controls. These estimates were reported to be stable in sensitivity analyses.
| Trial | Items costed | ESD cost / patient | Control cost / pt | Percent difference |
| Cost minimisation. Direct and indirect | AUD 8040 | AUD 10,054 | ‐ 20% | |
| Direct and indirect to 12 months | GBP 6800 | GBP 7432 | ‐ 9% | |
| Direct and indirect to 3 months | CAD 7784 | CAD 11,065 | ‐30% | |
| Direct and indirect | GBP 7155 | GBP 7480 | ‐ 4% | |
| Hospital, community, private costs | SEK 2806 | SEK 3475 | ‐ 19% | |
| Direct costs to 12 months | EUR 5113 | EUR 6665 | ‐ 23% |
Sensitivity analyses
Analyses by methodological characteristics
Analysis of the primary outcome restricted to the 12 trials that reported concealed randomisation and blinded follow‐up showed a convincing reduction in death or dependency (OR 0.75, 95% CI 0.62 to 0.92, P = 0.005) with no heterogeneity (Adelaide 2000; ATTEND pilot 2015; Belfast 2004; Bergen 2014; Copenhagen 2009; London 1997; Manchester 2001; Montreal 2000; Oslo 2000; Stockholm 1998; Trondheim 2000; Trondheim 2004). Analysis restricted to the 10 trials that reported concealed randomisation and blinded follow‐up plus a very high rate of patient follow‐up for the primary outcome (1277/1318; 3.1% participants missing) showed similar results (OR 0.75, 95% CI 0.60 to 0.93, P = 0.01) with no heterogeneity (Adelaide 2000; ATTEND pilot 2015; Belfast 2004; London 1997; Manchester 2001; Montreal 2000; Oslo 2000; Stockholm 1998; Trondheim 2000; Trondheim 2004).
For the primary outcome of death or dependency, data were missing for 99 (8.0%) intervention participants and 84 controls (7.5%). Our primary analysis assumed they were alive and independent (OR 0.80, 95% CI 0.67 to 0.95) (Analysis 1.3). The result would be similar if all missing participants were assumed to be dead or dependent (OR 0.82, 0.70 to 0.97). The confidence intervals around the apparent effect of ESD services would only cross unity if there was a substantial imbalance in missing data outcomes favouring control services.
Subgroup analyses
Analyses by participant age and gender
Subgroup data for the primary outcome (death or dependency) were available for at least nine trials. Smaller amounts of data were available for death, death or institutionalisation, and length of stay. There was no significant association of participant age or gender with the apparent effect of the ESD service (Analysis 5.1; Analysis 5.2; Analysis 6.1; Analysis 6.2).
Analyses by initial stroke severity
Data were available for 11 trials (1545 participants). Subgroup analysis by initial stroke severity revealed a differential effect in the odds of death or dependency between participants with moderate initial stroke severity (initial Barthel Index of > 9/20) and those in the severe subgroup (initial Barthel Index < 10/20). In the moderate subgroup there was a reduction (OR 0.77, 95% CI 0.61 to 0.98) as opposed to a non‐significant increase in the severe subgroup (OR 1.40, 95% CI 0.83 to 2.36); test for subgroup interaction P = 0.04. Similar patterns of results were seen for the outcome death or institutional care. The reduction in length of hospital stay was much greater (P < 0.0001) for the severe stroke subgroup (MD 28 days, 95% CI 17 to 40) than the moderate group (MD 3 days, 95% CI 1 to 7). Similar results were obtained if the Barthel index at randomisation was used from the two trials that randomised patients up to several weeks after stroke (Adelaide 2000; London 1997: Analysis 7.1; Analysis 7.2). Similar results were obtained if the three most recent trials for which we do not have individual patient data were included but analysed according to the mean Barthel index at randomisation (Adelaide 2016; Aveiro 2016; Bergen 2014).
These results suggest that the greatest benefit in clinical outcomes was with the mild and moderate groups but the greatest reduction in hospital bed days was with the severe subgroup.
Analyses by carer availability
Eleven trials (1341 participants) could provide subgroup data on the availability of a carer. There was no apparent interaction of ESD service effect with the presence of a carer (Analysis 8.1; Analysis 8.2).
Analyses by control service organisation
Subgroup analyses were carried out according to the background (control) service available; stroke unit or other ward. There were no apparent interactions with control service characteristics (Analysis 9.1; Analysis 9.2).
Analyses by ESD service organisation
There was no significant interaction with the background service (stroke unit or other ward) or the base for the ESD team (community in‐reach or hospital out‐reach). The reduction in length of hospital stay was slightly greater in the hospital out‐reach group (MD 5 days, 95% CI 1 to 9) than the community in‐reach group (MD 4 days, 95% CI 1 to 7) but this was not statistically significant (P = 0.74) (Analysis 10.1; Analysis 10.2; Analysis 11.3; Analysis 11.4; Analysis 9.1; Analysis 9.2).
The ESD services studied were classified according to the organisation of the multidisciplinary team (see Description of studies). Using this classification, there was a potential subgroup interaction (P = 0.06) by ESD characteristics. The trials with a co‐ordinated multidisciplinary ESD team (Analysis 11.3) showed an odds of death or dependency of OR 0.73 (95% CI 0.60 to 0.89) compared with OR 1.11 (95% CI 0.75 to 1.62) in those without an ESD team.
The staffing levels of each service did not differ sufficiently to allow meaningful subgroup analyses based on staff mix, service intensity, and supportive versus rehabilitative interventions.
Analysis of 'core' ESD services
Some commentators have criticised the original inclusion of trials that did not incorporate a robust multidisciplinary rehabilitation programme in the community (Akershus 1998; Adelaide 2016; ATTEND pilot 2015; Bangkok 2002). The remaining 13 trials are much more typical of what has become accepted as a 'core' ESD service (Fisher 2011). If the analyses are restricted to those 13 trials the results are more convincing for ESD services: death (OR 0.78, 95% CI 0.54 to 1.11; P = 0.17; Analysis 11.1), death or institutional care (OR 0.65, 95% CI 0.49 to 0.87; P = 0.003; Analysis 11.2), death or dependency (OR 0.73, 95% CI 0.60 to 0.89; P = 0.002; Analysis 11.3) and reduction in length of stay (MD 6 days; 95% CI 3 to 9; P < 0.0001; Analysis 11.4).
Discussion
Summary of main results
It is clear from this analysis of the randomised trials that services aiming to accelerate discharge from hospital can bring about a reduction in the length of hospital stay and that this reduction can be substantial. This updated analysis demonstrates that patients receiving ESD services were more likely to be independent and living at home six months after stroke than those who received conventional services. ESD patients scored better on extended ADL scores and were more likely to express satisfaction with services. Although we have limited information available, we have been unable to confirm earlier concerns about the impact of ESD services on the mood and well‐being of carers (in terms of subjective health score, mood, or satisfaction with services).
Economic analyses were carried out in six trials. Although the underlying costs and assumptions were different for each analysis, all concluded that the opportunity savings from hospital bed days released tended to be greater than, or similar to, the cost of the ESD service. Realising such cost savings in practice can be difficult but ESD services appear to offer one way to manage rising demand for a finite number of hospital beds.
The particular component of an ESD service responsible for the improvement in functional outcome seen remains unclear. Providing rehabilitation in the setting of the patients' own home is thought to be a significant contributing factor. It has also been suggested that patients receiving ESD services overall receive greater input from rehabilitation therapists and for a longer duration than those receiving conventional care. However, any potential increase in rehabilitation input does not appear to affect overall cost‐efficacy of ESD services in economic analyses.
In conclusion, appropriately resourced and co‐ordinated ESD teams can offer a further effective service option for a selected group of people with stroke and should be considered in addition to organised inpatient (stroke unit) care as part of a comprehensive stroke service.
Overall completeness and applicability of evidence
When interpreting the results of this review it is important to remember that the basic question addressed was whether a policy of early hospital discharge with support could be as effective and efficient as conventional care. Therefore, our inclusion criteria were broad and focused on trials that compared two policies of care for stroke patients in hospital: 1) conventional care, that is, the usual hospital care and discharge procedures; and 2) an alternative system of care that aimed to provide an earlier discharge with rehabilitation or support, or both, in a home‐based setting ('early supported discharge': ESD). Within this broad question we had anticipated that a 'core' group of trials would be testing a specialist multidisciplinary ESD team that had been established to provide this form of care to stroke patients. However, we also wished to retain the option of including other trials where a policy of early discharge was tested in other ways. The advantage of this broad approach is that it can allow us to examine both the effectiveness of a reasonably specific co‐ordinated ESD team 'package' of care, and also to explore the broader service factors (both inpatient and outpatient) that may influence patient outcomes. One potential hazard is that it is difficult to conduct such an exercise in a truly a priori and objective manner. The current update has maintained the original review structure.
In developing a clear question to guide this review, we have chosen to focus on the intention of the service intervention and to avoid terms such as 'hospital at home' which may have a different meaning to different people. However, we acknowledge that some services aim to both help avoid hospital admission and accelerate discharge (Wade 1985). We have not excluded any trials from the review solely on the basis of their service having this dual function. We have also focused the review on services for people with stroke. There are several potentially complementary trials that have recruited a mixed geriatric medical patient population. These have been reviewed (Shepperd 2009).
Quality of the evidence
This update identified four new trials (663 participants) and did not alter the main conclusions in comparison with the previous version of the review. While we acknowledge that the total amount of data available is limited (17 trials; 2422 participants), there do appear to be some general conclusions that can be drawn.
-
Most of the evidence of benefit of ESD services come from trials of a multidisciplinary ESD team whose work is co‐ordinated through regular meetings.
-
The typical multidisciplinary ESD team comprised physiotherapy, occupational therapy, and speech and language therapy staff with medical, nursing and social work support.
-
Such services appeared to be effective even in comparison with a standard service based on care in a stroke unit.
-
Although we could not find evidence that the setting of the service (hospital out‐reach or community in‐reach) influenced outcomes, all the ESD teams reported here had a specialist interest in stroke or rehabilitation, or both.
-
All trials recruited a selected subgroup (on average 33%) of people with stroke usually living in an urban setting. There is insufficient evidence to draw conclusions on ESD services for those living in a more dispersed rural setting.
-
Most of the evidence of ESD benefit appears to be for people with moderate disability (initial Barthel index of > 9/20), although the balance of cost and benefit is not clear for this subgroup. For people with more severe disability the substantial saving in bed‐days may well be outweighed by a risk of poorer patient outcomes. We, therefore, cannot exclude the possibility that the clinical benefits enjoyed by the moderate disability subgroup required a net increase in rehabilitation input while the main cost savings (in terms of bed days) came from the severe subgroup.
Although the quality of the evidence in general was good, many of the trials were completed over 10 years ago. In many countries the last decade has seen a significant overhaul of stroke services to enable greater access to hyperacute therapies (e.g. thrombolysis or thrombectomy). However, only a small proportion of people with stroke will be eligible for such therapies, with the great majority continuing to rely on post‐stroke rehabilitation to improve functional outcomes.
The conclusions about the potential benefit of ESD services appear to be robust. The results are strengthened if analyses focus on trials with clearly concealed randomisation, blinded outcome assessment, and near‐complete follow‐up (10 trials; 1318 participants), or on the 'core' group of trials (13 trials; 1902 participants) testing a co‐ordinated ESD team.
Potential biases in the review process
Through a thorough searching process and well‐established personal connections with researchers in this field we are confident that we should have identified all potentially relevant studies. However, for three studies we did not have sufficient information to carry out a preliminary classification according to our inclusion criteria (Edirne 2001; Shi 2014; Tian 2015). We realise the absence of data from these studies in our meta‐analysis may potentially have introduced bias.
As discussed, our inclusion criteria with respect to the service intervention were deliberately broad. We recognise that interpretation of patient and service characteristics raises the potential risk of a post‐hoc explanation of results. However, we tried as far as possible to plan analyses a priori.
A small proportion of patient data was missing for our dichotomous outcomes of death (57 intervention participants; 53 controls), death or institutionalisation (24 intervention participants; 19 controls), and death or dependency (99 intervention participants; 84 controls). In these instances we assumed the participants to be alive and independent. Similarly for continuous outcome data, where standard deviations were not reported they were inferred from the interquartile ranges (IQR) or alternatively estimated as being at least as large as the comparable trials using the same measure (see Measures of treatment effect). Whilst we recognise that this may have introduced potential bias to our results, we believe that including imputed and estimated data were preferable to excluding data from participants or studies.
Finally, the trialists who authored this review were in general the authors of the included trials. However, decisions on trial selection and data extraction were arranged to avoid trialists making decisions about their own trial.
Agreements and disagreements with other studies or reviews
Several systematic reviews have addressed the topic of how to improve the transition of discharge home for patients in hospital. A systematic review of discharge planning strategies for medical patients concluded that a discharge plan tailored to the individual patient may bring about reductions in length of hospital stay and readmission rates (Shepperd 2016). A systematic review of trials of generic (non‐stroke specific) early discharge hospital at home services concluded that such services could speed up discharge home, but commented on the limited evidence available (Shepperd 2009). A more recent stroke‐specific literature review on team co‐ordinated early supported discharge again concluded that this could be an effective approach for a selected patient group (Meyer 2016). None of these reviews have included such a comprehensive group of stroke‐specific trials.

Flow diagram illustrating the results of the updated searches

'Risk of bias' graph: review authors' judgements about each risk of bias item presented as percentages across all included studies.

'Risk of bias' summary: review authors' judgements about each risk of bias item for each included study.

Comparison 1 Early supported discharge service versus conventional care: patient outcomes, Outcome 1 Death.
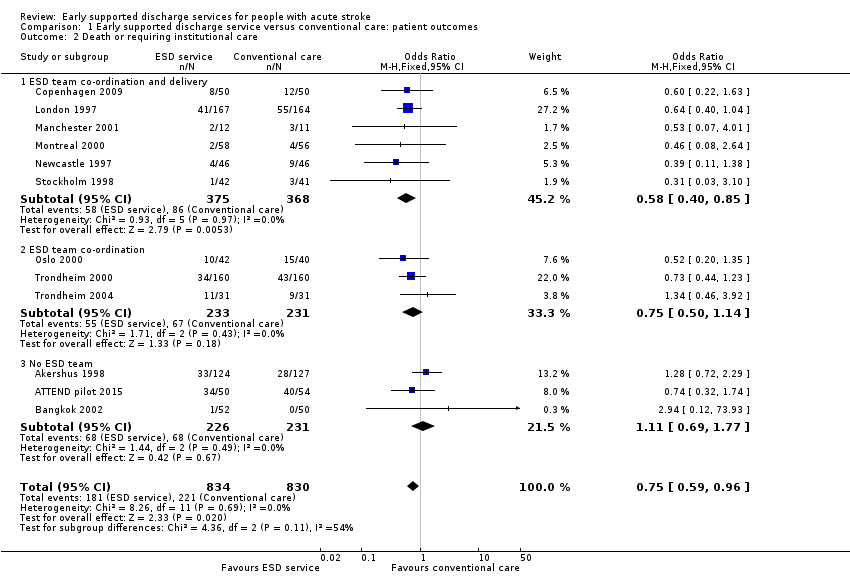
Comparison 1 Early supported discharge service versus conventional care: patient outcomes, Outcome 2 Death or requiring institutional care.

Comparison 1 Early supported discharge service versus conventional care: patient outcomes, Outcome 3 Death or dependency.
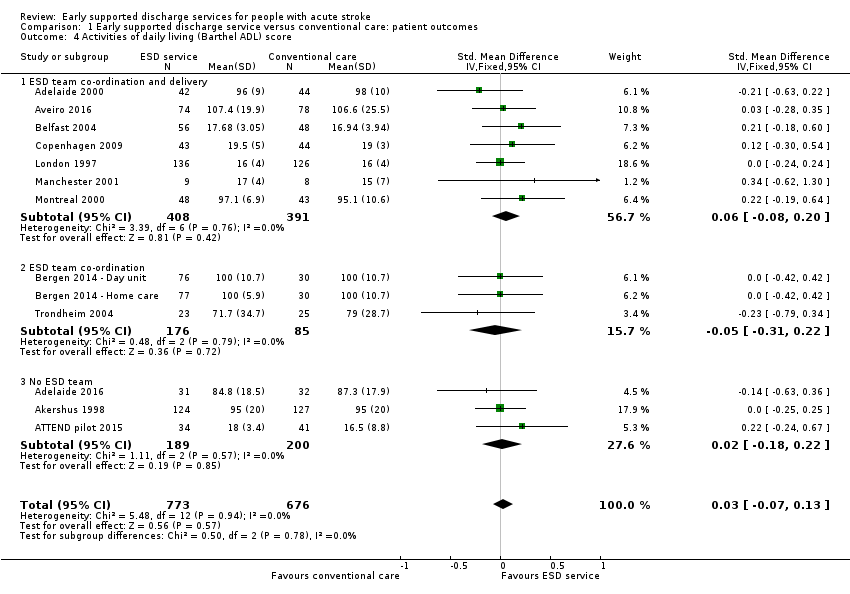
Comparison 1 Early supported discharge service versus conventional care: patient outcomes, Outcome 4 Activities of daily living (Barthel ADL) score.

Comparison 1 Early supported discharge service versus conventional care: patient outcomes, Outcome 5 Extended activities of daily living (EADL) score.

Comparison 1 Early supported discharge service versus conventional care: patient outcomes, Outcome 6 Subjective health status.
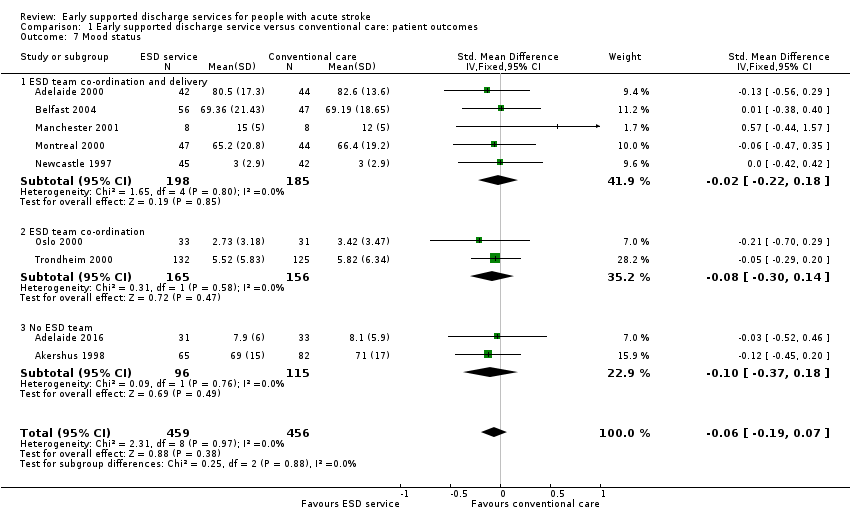
Comparison 1 Early supported discharge service versus conventional care: patient outcomes, Outcome 7 Mood status.

Comparison 1 Early supported discharge service versus conventional care: patient outcomes, Outcome 8 Satisfaction with services.

Comparison 2 Early supported discharge service versus conventional care: duration of follow‐up, Outcome 1 Death or dependency: within 6 months.

Comparison 2 Early supported discharge service versus conventional care: duration of follow‐up, Outcome 2 Death or dependency: at 6 to 12 months.
Comparison 2 Early supported discharge service versus conventional care: duration of follow‐up, Outcome 3 Death or dependency: within 5 years.
Comparison 3 Early supported discharge service versus conventional care: carer outcomes, Outcome 1 Subjective health status.
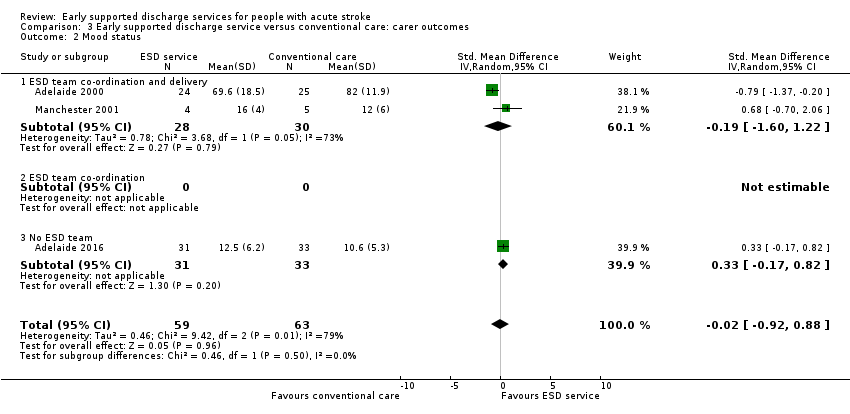
Comparison 3 Early supported discharge service versus conventional care: carer outcomes, Outcome 2 Mood status.

Comparison 3 Early supported discharge service versus conventional care: carer outcomes, Outcome 3 Satisfaction with services.
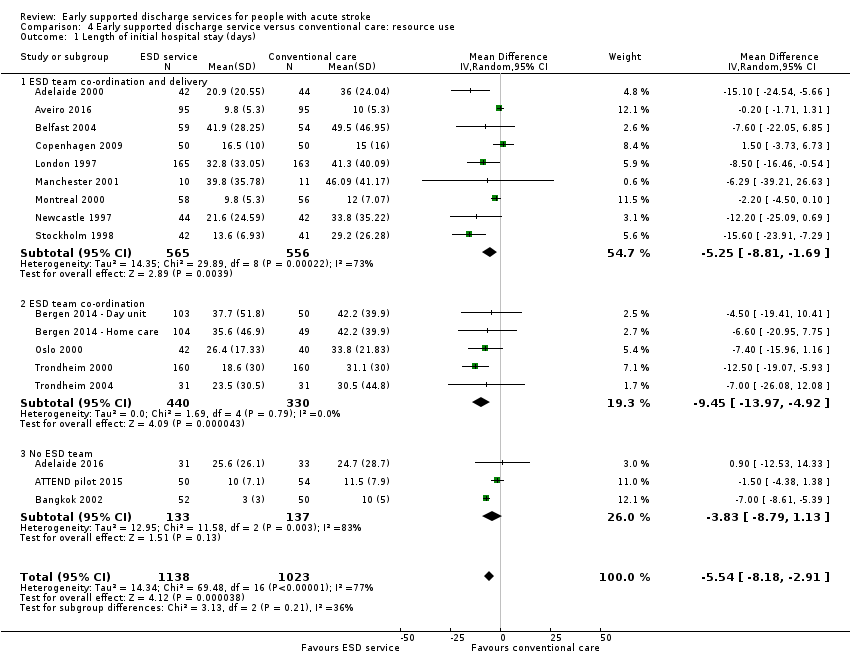
Comparison 4 Early supported discharge service versus conventional care: resource use, Outcome 1 Length of initial hospital stay (days).
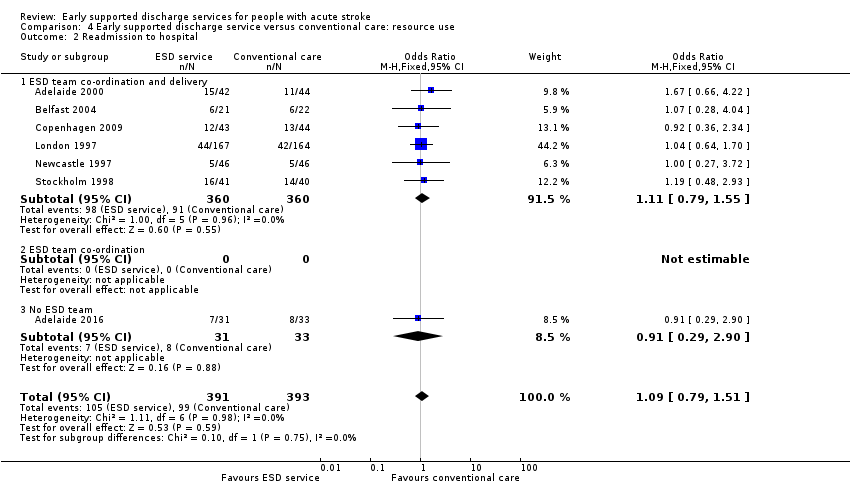
Comparison 4 Early supported discharge service versus conventional care: resource use, Outcome 2 Readmission to hospital.
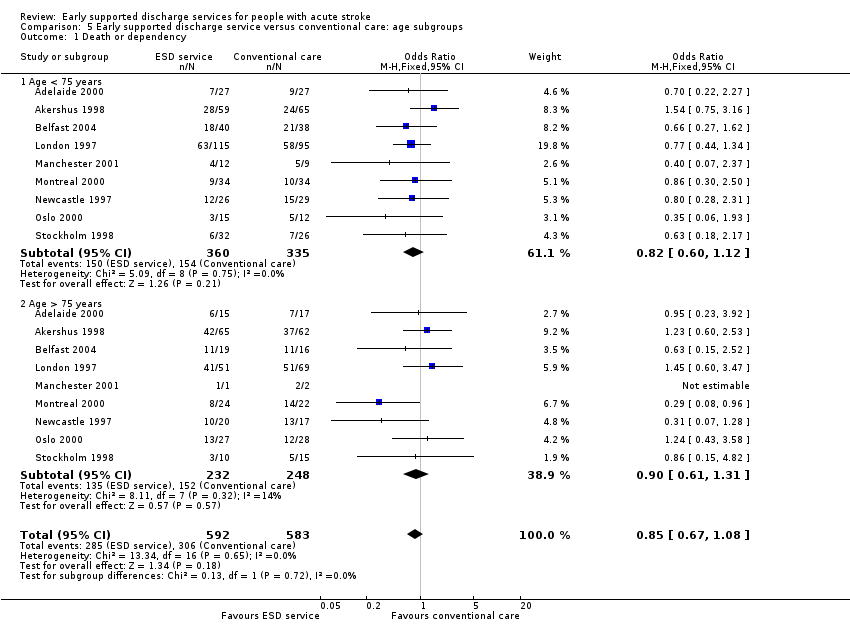
Comparison 5 Early supported discharge service versus conventional care: age subgroups, Outcome 1 Death or dependency.

Comparison 5 Early supported discharge service versus conventional care: age subgroups, Outcome 2 Length of stay (days).

Comparison 6 Early supported discharge service versus conventional care: gender subgroups, Outcome 1 Death or dependency.

Comparison 6 Early supported discharge service versus conventional care: gender subgroups, Outcome 2 Length of stay (days).

Comparison 7 Early supported discharge service versus conventional care: stroke severity subgroups, Outcome 1 Death or dependency.

Comparison 7 Early supported discharge service versus conventional care: stroke severity subgroups, Outcome 2 Length of stay (days).

Comparison 8 Early supported discharge service versus conventional care: carer subgroups, Outcome 1 Death or dependency.

Comparison 8 Early supported discharge service versus conventional care: carer subgroups, Outcome 2 Length of stay (days).
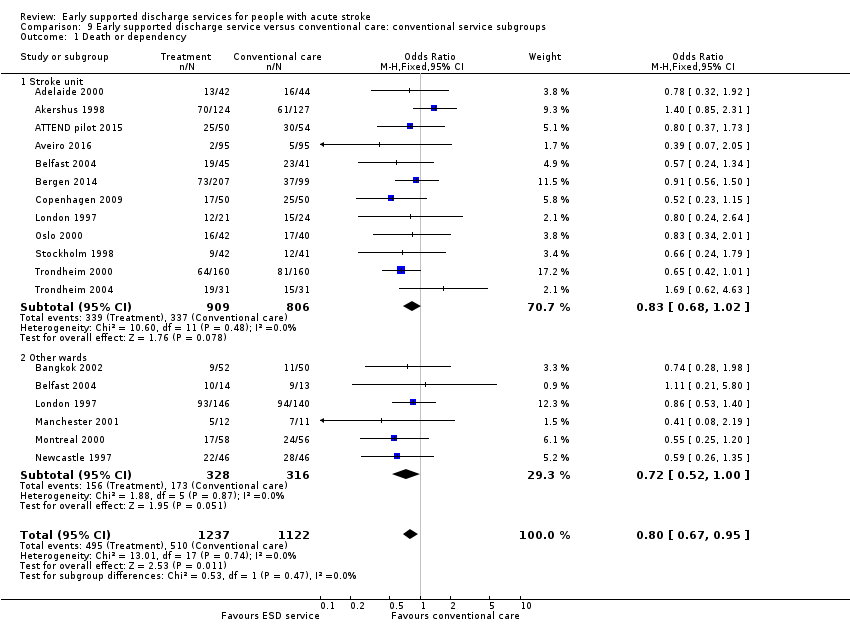
Comparison 9 Early supported discharge service versus conventional care: conventional service subgroups, Outcome 1 Death or dependency.

Comparison 9 Early supported discharge service versus conventional care: conventional service subgroups, Outcome 2 Length of stay (days).

Comparison 10 Early supported discharge service versus conventional care: ESD service subgroups: service base, Outcome 1 Death or dependency.
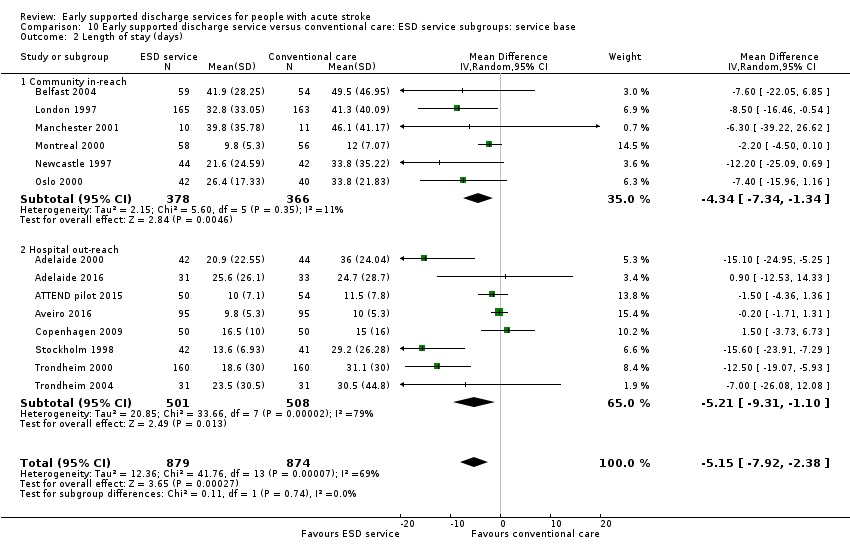
Comparison 10 Early supported discharge service versus conventional care: ESD service subgroups: service base, Outcome 2 Length of stay (days).
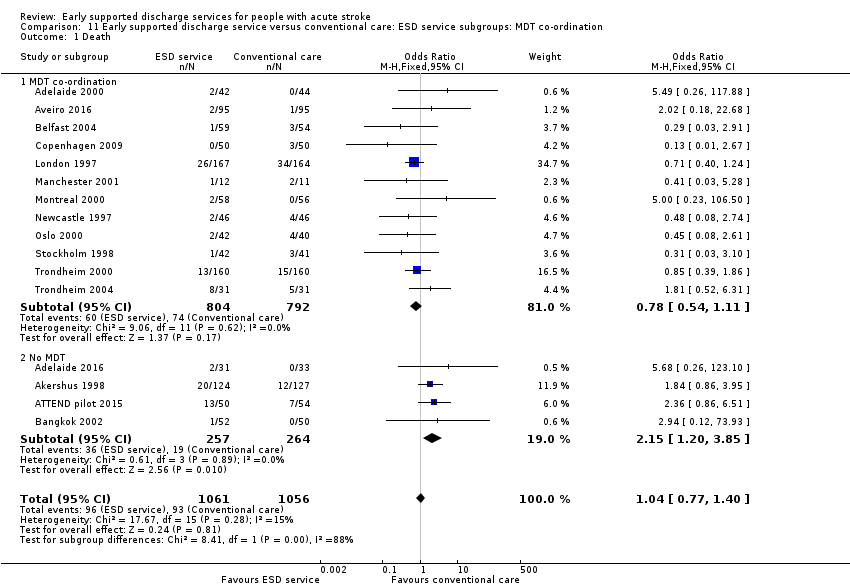
Comparison 11 Early supported discharge service versus conventional care: ESD service subgroups: MDT co‐ordination, Outcome 1 Death.

Comparison 11 Early supported discharge service versus conventional care: ESD service subgroups: MDT co‐ordination, Outcome 2 Death or requiring institutional care.
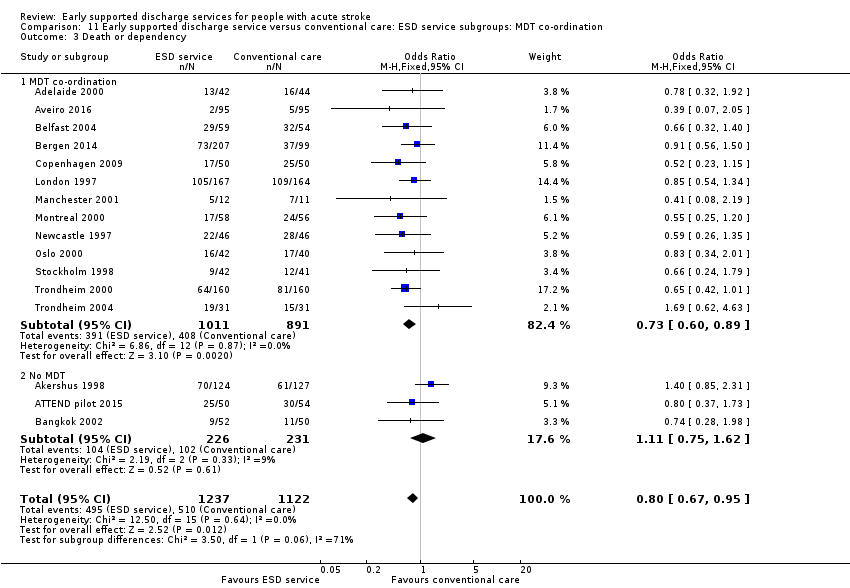
Comparison 11 Early supported discharge service versus conventional care: ESD service subgroups: MDT co‐ordination, Outcome 3 Death or dependency.

Comparison 11 Early supported discharge service versus conventional care: ESD service subgroups: MDT co‐ordination, Outcome 4 Length of stay (days).
| ESD service compared with usual care for stroke | ||||||
| Patient or population: people with stroke Settings: Hospital Intervention: Early supported discharge (ESD) service ‐ any type Comparison: Usual care | ||||||
| Outcomes | Illustrative comparative risks* (95% CI) | Relative effect | No of Participants | Quality of the evidence | Comments | |
| Assumed risk | Corresponding risk | |||||
| Usual care | ESD service | |||||
| Death or dependency at end of scheduled follow‐up (median 6 months) | Medium risk population | OR 0.80 (0.67 to 0.95) | 2359 | ⊕⊕⊕⊝ | Assumed risk from baseline in included trials. Corresponding risk estimated from risk difference (95% CI). | |
| 450 per 1000 | 400 per 1000 | |||||
| Death at end of scheduled follow‐up (median 6 months) | Medium risk population | OR 1.04 (0.77 to 1.40) | 2116 | ⊕⊕⊕⊝ | As above | |
| 90 per 1000 | 90 per 1000 | |||||
| Death or institution care at end of scheduled follow‐up (median 6 months) | Medium risk population | OR 0.75 (0.59 to 0.96) | 1664 (12) | ⊕⊕⊕⊝ | As above | |
| 270 per 1000 | 220 per 1000 | |||||
| Extended activities of daily living (EADL) score at end of scheduled follow‐up (median 6 months) | The mean EADL score ranged across control groups depending on the measure used (see Analysis 1.5) | The mean EADL score in the intervention groups was on average higher than usual care. | SMD 0.14 (0.03 to 0.25) | 1262 | ⊕⊕⊝⊝ | Range of scores used to measure EADL (high score means better outcome) therefore comparison is within scores. |
| Satisfaction with services at end of scheduled follow‐up (median 6 months) | Medium risk population | OR 1.60 (1.08 to 2.38) | 513 | ⊕⊕⊝⊝ | Stated satisfaction of patients with service received. | |
| 610 per 1000 | 690 per 1000 | |||||
| Length of initial hospital stay (days) | The mean length of stay in hospital and/or institution ranged across control groups from 10 to 50 days. | The mean length of stay in the intervention groups was | MD ‐ 5.5 (2.9 to 8.2) days | 2161 | ⊕⊕⊕⊝ | Length of stay in a hospital and/or institution. Most trials reported initial hospital stay. |
| Readmission to hospital at end of scheduled follow‐up (median 6 months) | Medium risk population | OR 1.09 (0.79 to 1.51) | 784 | ⊕⊕⊝⊝ | ||
| 250 per 1000 | 270 per 1000 | |||||
| *The basis for the assumed risk (e.g. the median control group risk across studies) is provided in footnotes. The corresponding risk (and its 95% confidence interval) is based on the assumed risk in the comparison group and the relative effect of the intervention (and its 95% CI). | ||||||
| GRADE Working Group grades of evidence | ||||||
| The trials on average focused on a middle band of stroke patients with moderate levels of disability. a) Downgraded once for risk of performance bias. Sensitivity analyses indicate little risk from other potential biases. b) Downgraded twice for risk of performance bias and potential risk of missing data. c) Downgraded for risk of performance bias. Substantial heterogeneity of results are present but unlikely to alter direction of effect. | ||||||
| Trial | Setting | Key features | Control service base | ESD staffing (whole time equivalents for caseload of 100 patients/year; median and range) | |||||||
| Medical | Nursing | Physio | OT | SALT | Assistant | Other | Total | ||||
| ESD team co‐ordination and delivery | |||||||||||
| Urban | PHMR Goals documented | Rehabilitation unit (stroke and neurological) | 0.06 | 0.06 | 0.7 | 1.6 | 0.25
| 0.4
| Social work | 2.6 | |
| Mixed | Tailored | Mixture (stroke unit, case managers in community‐based team) | 0.8 | 0 | 1.0 | 1.5 | 0 | 0 | Psychology | 3.2 | |
| Mixed | PHMR | Mixture (medical, geriatric, stroke unit) | 0.1 | 0 | 1.5
| 1.0
| 0.5
| 1.5 | Secretary Social work | 4.6 | |
| Urban | Tailored | Stroke unit | nd | nd | nd | nd | nd | nd | nd | nd | |
| Urban | Equipment store | Mixture (medical, stroke unit) | 0.1 | 0 | 1 | 1 | 0.5 | 0.5 | ‐ | 3.1 | |
| Urban |
| Mixture (medical, stroke team or unit) | nd | nd | nd | nd | nd | nd | ‐ | nd | |
| Urban |
| Mixture (medical neurology) | 0 | 0.4 | 1.0 | 0.7 | 0.4 | ‐ | Dietitian | 2.7 | |
| Urban | Envt visit Key worker 7‐day input PHMR | Mixture (medical, geriatric) | 0
| 0 | 0.8 | 1.0 | 0.3 | 0.2
| Secretary Social work Carers | 2.8 | |
| Urban | Case manager Patient diary | Stroke unit | 0.03 | 0 | 1.0 | 1.0 | 0.5 | ‐ | ‐ | 2.6 | |
| Mixed | Tailored | Neurorehabilitation centres (3) | ? | 0 | ? | ? | 0 | 0 | 0 | ? | |
| ESD team co‐ordination | |||||||||||
| Urban | Day Unit ESD Home‐based ESD | Stroke unit | nd | nd | nd | nd | nd | nd | nd | nd | |
| Urban | Key worker Community services | Stroke unit | nd | nd | nd | nd | nd | nd | ‐ | nd | |
| Urban | Key worker Team Community services | Stroke unit | 0.12 | 1.2 | 1.2 | 1.2 | 0 | ‐ | ‐ | 3.7 | |
| Rural |
| Stroke unit | 0.12 | 1.2 | 1.2 | 1.2 | 0 | ‐ | ‐ | 3.7 | |
| 10 urban 3 mixed 1 rural | 7 stroke unit 5 mixed service 2 neurorehabilitation unit | 0.10 (0 to 0.12) | 0 (0 to 1.2) | 1.0 (0.7 to 1.5) | 1.0 (0.7 to 1.6) | 0.3 (0 to 0.5) | 0.4 (0 to 1.5) | ‐ | 3.1 (2.6 to 4.6) | ||
| No ESD team | |||||||||||
| Urban | Caregiver‐mediated exercises combined with tele‐rehabilitation services | Stroke unit | nd | nd | nd? | nd | nd | nd | ‐ | nd | |
| Mixed | Range of community rehabilitation services | Stroke unit | nd | nd | nd | nd | nd | nd | ‐ | nd | |
| Mixed | Family‐mediated rehabilitation with mostly remote follow‐up | Stroke unit | nd | nd | < 1.0 | nd | nd | nd | ‐ | nd | |
| Urban | Red Cross volunteers | Stroke unit | nd | nd | nd | nd | nd | nd | ‐ | nd | |
| MDT mtg: multidisciplinary team meeting | |||||||||||
| Trial | Death | Institutional care | Dependency | Defined dependent | Length of stay |
| 6 months | 6 months | 6 months | Barthel index < 95/100 | Initial hospital discharge | |
| 3 months | ‐ | 3 months | Barthel index | Initial hospital discharge and up to 12 months | |
| 7 months | 7 months | 7 months | Barthel index < 95/100 | Not used ‐ only available for acute hospital | |
| 6 months | ‐ | 6 months | Rankin score 3 to 5 | Initial hospital discharge (median, IQR) | |
| 6 months | 6 months | 6 months | Functional Independence Measure < 60 points | Initial stroke unit stay (also stay in rehabilitation unit) | |
| 6 months | 6 months | 6 months | Barthel index < 95/100 | Initial hospital discharge | |
| 12 months | 12 months | 12 months | Barthel index < 19/20 | Initial hospital discharge | |
| 6 months | 6 months | 6 months | Rankin score 3 to 5 | Initial hospital stay plus institution up to 6 months | |
| 5 months | 5 months | 3 months | Rankin score 3 to 5 | Initial hospital stay | |
| 12 months | 12 months | 12 months | Barthel index < 19/20 | Initial hospital discharge | |
| 12 months | 12 months | 12 months | Barthel index < 19/20 | Initial hospital stay (acute and rehabilitation wards) | |
| 3 months | 3 months | 3 months | Barthel index < 95/100 | Initial hospital stay | |
| 3 month | 3 month | 3 month | Rankin score 3 to 5 | Initial hospital stay | |
| 6 month | 6 month | 6 month | Rankin score 3 to 5 | Initial hospital stay | |
| 6 month | 6 month | 6 month | Barthel index 95/100 | Initial hospital stay | |
| 6 months | 6 months | 6 months | Barthel index 95/100 | Initial hospital stay | |
| 12 months | 12 months | 12 months | Rankin score 3 to 5 | Initial hospital stay (acute and rehabilitation wards) | |
| IQR: interquartile range | |||||
| Trial | Recruited intervention | Recruited control | Recruited total | Missing intervention | Missing control | Available intervention | Available control | Available total | Comments |
| 885 | 874 | 1759 | 31 | 25 | 854 (96%) | 849 (97%) | 1703 (97%) | ||
| 31 | 32 | 63 | 2 | 2 | 29 (94%) | 30 (94%) | 59 (94%) | Not available as dichotomous outcome | |
| 50 | 54 | 104 | 5 | 9 | 45 (90%) | 45 (83%) | 90 (87%) | ||
| 95 | 95 | 190 | 19 | 17 | 76 (80%) | 78 (82%) | 154 (81%) | ||
| 207 | 99 | 306 | 44 | 33 | 163 (79%) | 66 (67%) | 229 (75%) | ||
| Total | 1268 | 1154 | 2422 | 101 | 86 | 1166 (92%) | 1068 (93%) | 2234 (92%) |
| Trial | Timing of outcome | ADL score | Extended ADL score | Subjective health | Mood | Service satisfaction | Hospital readmission |
| 6 months | Barthel index (median, IQR) | Adelaide Activities Profile | SF‐36 (General health perceptions) | SF‐36 (mental health) | Satisfied with rehabilitation programme | 6 months | |
| 3 months | Barthel index (mean, 95% CI) | Nottingham extended ADL (mean, 95% CI) | Stroke Impact Scale | Hospital Anxiety and Depression Scale (HADS) | ‐ | 12 months | |
| 7 months | Barthel index (median, imputed SD) | ‐ | SF‐36 (general health perceptions) | SF‐36 (mental health) | ‐ | ‐ | |
| 6 months | ‐ | Nottingham Extended | EQ‐5D | Hospital anxiety and depression scale (category) | ‐ | 6 months | |
| 6 months | FIM (mean, SD) | Frenchay Activities Index | ‐ | ‐ | ‐ | ‐ | |
| ‐ | ‐ | ‐ | ‐ | ‐ | ‐ | ‐ | |
| 12 months | Barthel index | Nottingham extended ADL | SF‐36 (general health perceptions) | SF‐36 (mental health) | Satisfied with outpatient rehabilitation | 6 month | |
| 6 months | Barthel index (median, IQR) | ‐ | ‐ | ‐ | Satisfaction score (mean & SD) | ‐ | |
| 3 months | Barthel Index (median, imputed SD) | ‐ | EQ‐5D | ‐ | 5 months | ||
| 12 months | Barthel index | Rivermead ADL score | Nottingham health profile (score reversed) | Number abnormal on hospital anxiety and depression scale | Satisfied with care in general | 12 month | |
| 12 months | Barthel index | Nottingham extended ADL score | Euroquol scale (0 to 100) | Hospital anxiety and depression scale (depression subscore, score reversed) | ‐ | ‐ | |
| 3 month | Barthel index | Instrumental ADL (OARS) scale | SF‐36 (general health perceptions) | SF‐36 (mental health) | ‐ | ‐ | |
| 3 month | ‐ | Nottingham extended ADL score (median, IQR) | Dartmouth COOP chart overall health section (median, IQR; scale reversed) | Dartmouth COOP chart feelings section (median, IQR; scale reversed) | ‐ | 3 month | |
| 6 month | ‐ | Nottingham extended ADL score (median, IQR) | General Health Questionnaire (reversed score) | MADRS score | Satisfied with care in general | ‐ | |
| 8 months | ‐ | Frenchay Activities index (median, IQR) | Sickness impact profile score (median, IQR) | ‐ | Satisfied with care received | 6 months | |
| 12 months | ‐ | Frenchay social activity index | Nottingham Health Profile (average of sum 1 and 2) | MADRS | ‐ | ‐ | |
| 12 months | Barthel Index | ‐ | Nottingham health profile | ‐ | ‐ | ‐ | |
| ADL: activities of daily living | |||||||
| Trial | Timing of outcome | Subjective health | Mood | Service satisfaction |
| 6 months | SF‐36 general health perceptions | SF‐36 mental health | Satisfied with rehabilitation programme | |
| 3 months | Caregiver Strain Index (score reversed) | Hospital Anxiety and Depression Scale (score reversed) | ||
| ‐ | ‐ | ‐ | ‐ | |
| 6 months | Caregiver Burden Scale (category) | ‐ | ‐ | |
| ‐ | ‐ | ‐ | ‐ | |
| ‐ | ‐ | ‐ | ‐ | |
| 6 months | Caregiver strain index (score reversed) | ‐ | Satisfied with outpatient services | |
| ‐ | ‐ | ‐ | ‐ | |
| 3 months | Satisfied with rehabilitation programme | |||
| 12 months | Caregiver strain index (score reversed) | ‐ | Satisfied with care in general | |
| 12 month | ‐ | Hospital Anxiety and Depression Scale (depression subscore, score reversed) | ‐ | |
| 3 months | Caregiver Burden Index | ‐ | ‐ | |
| 3 months | General health questionnaire (median, range; score reversed) | ‐ | ‐ | |
| 6 months | General health questionnaire (score reversed) | ‐ | Satisfied with care in general | |
| ‐ | ‐ | ‐ | ‐ | |
| 12 months | Caregiver Burden score | ‐ | ‐ | |
| 12 months | Caregiver strain index (score reversed) | ‐ | ‐ |
| Time from randomisation | Number (%) discharged | Risk difference (95% CI) | Significance | |
| ESD service (364 patients) | Control (354 patients) | |||
| 2 weeks | 116 (32%) | 77 (22%) | 11 (‐3, 24) | 0.13 |
| 4 weeks | 236 (65%) | 179 (50%) | 19 (4, 35) | 0.01 |
| 6 weeks | 277 (76%) | 249 (70 %) | 8 (1, 15) | 0.02 |
| 8 weeks | 303 (83%) | 275 (78%) | 8 (3, 13) | 0.003 |
| 3 months | 345 (95%) | 324 (92%) | 2 (‐1, 6) | 0.21 |
| 6 months | 363 (100%) | 353 (100%) | 0 (‐2, 1) | 0.71 |
| Data are presented from six trials that could provide relevant data on 718 participants (Adelaide 2000; Belfast 2004; London 1997; Manchester 2001; Oslo 2000; Stockholm 1998). Discharges include deaths and do not include readmissions. The risk difference (95% confidence interval) is calculated taking into account variation between trials | ||||
| Trial | Items costed | ESD cost / patient | Control cost / pt | Percent difference |
| Cost minimisation. Direct and indirect | AUD 8040 | AUD 10,054 | ‐ 20% | |
| Direct and indirect to 12 months | GBP 6800 | GBP 7432 | ‐ 9% | |
| Direct and indirect to 3 months | CAD 7784 | CAD 11,065 | ‐30% | |
| Direct and indirect | GBP 7155 | GBP 7480 | ‐ 4% | |
| Hospital, community, private costs | SEK 2806 | SEK 3475 | ‐ 19% | |
| Direct costs to 12 months | EUR 5113 | EUR 6665 | ‐ 23% |
| Outcome or subgroup title | No. of studies | No. of participants | Statistical method | Effect size |
| 1 Death Show forest plot | 16 | 2116 | Odds Ratio (M‐H, Fixed, 95% CI) | 1.04 [0.77, 1.40] |
| 1.1 ESD team co‐ordination and delivery | 9 | 1132 | Odds Ratio (M‐H, Fixed, 95% CI) | 0.70 [0.45, 1.09] |
| 1.2 ESD team co‐ordination | 3 | 464 | Odds Ratio (M‐H, Fixed, 95% CI) | 0.95 [0.52, 1.74] |
| 1.3 No ESD team | 4 | 520 | Odds Ratio (M‐H, Fixed, 95% CI) | 2.14 [1.19, 3.85] |
| 2 Death or requiring institutional care Show forest plot | 12 | 1664 | Odds Ratio (M‐H, Fixed, 95% CI) | 0.75 [0.59, 0.96] |
| 2.1 ESD team co‐ordination and delivery | 6 | 743 | Odds Ratio (M‐H, Fixed, 95% CI) | 0.58 [0.40, 0.85] |
| 2.2 ESD team co‐ordination | 3 | 464 | Odds Ratio (M‐H, Fixed, 95% CI) | 0.75 [0.50, 1.14] |
| 2.3 No ESD team | 3 | 457 | Odds Ratio (M‐H, Fixed, 95% CI) | 1.11 [0.69, 1.77] |
| 3 Death or dependency Show forest plot | 16 | 2359 | Odds Ratio (M‐H, Fixed, 95% CI) | 0.80 [0.67, 0.95] |
| 3.1 ESD team co‐ordination and delivery | 9 | 1132 | Odds Ratio (M‐H, Fixed, 95% CI) | 0.67 [0.52, 0.87] |
| 3.2 ESD team co‐ordination | 4 | 770 | Odds Ratio (M‐H, Fixed, 95% CI) | 0.82 [0.61, 1.10] |
| 3.3 No ESD team | 3 | 457 | Odds Ratio (M‐H, Fixed, 95% CI) | 1.11 [0.75, 1.62] |
| 4 Activities of daily living (Barthel ADL) score Show forest plot | 13 | 1449 | Std. Mean Difference (IV, Fixed, 95% CI) | 0.03 [‐0.07, 0.13] |
| 4.1 ESD team co‐ordination and delivery | 7 | 799 | Std. Mean Difference (IV, Fixed, 95% CI) | 0.06 [‐0.08, 0.20] |
| 4.2 ESD team co‐ordination | 3 | 261 | Std. Mean Difference (IV, Fixed, 95% CI) | ‐0.05 [‐0.31, 0.22] |
| 4.3 No ESD team | 3 | 389 | Std. Mean Difference (IV, Fixed, 95% CI) | 0.02 [‐0.18, 0.22] |
| 5 Extended activities of daily living (EADL) score Show forest plot | 11 | 1262 | Std. Mean Difference (IV, Fixed, 95% CI) | 0.14 [0.03, 0.25] |
| 5.1 ESD team co‐ordination and delivery | 8 | 876 | Std. Mean Difference (IV, Fixed, 95% CI) | 0.17 [0.04, 0.30] |
| 5.2 ESD team co‐ordination | 2 | 322 | Std. Mean Difference (IV, Fixed, 95% CI) | 0.07 [‐0.15, 0.29] |
| 5.3 No ESD team | 1 | 64 | Std. Mean Difference (IV, Fixed, 95% CI) | 0.16 [‐0.33, 0.65] |
| 6 Subjective health status Show forest plot | 11 | 1202 | Std. Mean Difference (IV, Fixed, 95% CI) | ‐0.01 [‐0.12, 0.10] |
| 6.1 ESD team co‐ordination and delivery | 7 | 685 | Std. Mean Difference (IV, Fixed, 95% CI) | ‐0.12 [‐0.27, 0.03] |
| 6.2 ESD team co‐ordination | 3 | 370 | Std. Mean Difference (IV, Fixed, 95% CI) | 0.14 [‐0.07, 0.34] |
| 6.3 No ESD team | 1 | 147 | Std. Mean Difference (IV, Fixed, 95% CI) | 0.14 [‐0.19, 0.47] |
| 7 Mood status Show forest plot | 9 | 915 | Std. Mean Difference (IV, Fixed, 95% CI) | ‐0.06 [‐0.19, 0.07] |
| 7.1 ESD team co‐ordination and delivery | 5 | 383 | Std. Mean Difference (IV, Fixed, 95% CI) | ‐0.02 [‐0.22, 0.18] |
| 7.2 ESD team co‐ordination | 2 | 321 | Std. Mean Difference (IV, Fixed, 95% CI) | ‐0.08 [‐0.30, 0.14] |
| 7.3 No ESD team | 2 | 211 | Std. Mean Difference (IV, Fixed, 95% CI) | ‐0.10 [‐0.37, 0.18] |
| 8 Satisfaction with services Show forest plot | 5 | 513 | Odds Ratio (M‐H, Fixed, 95% CI) | 1.60 [1.08, 2.38] |
| 8.1 ESD team co‐ordination and delivery | 4 | 450 | Odds Ratio (M‐H, Fixed, 95% CI) | 1.74 [1.13, 2.67] |
| 8.2 ESD team co‐ordination | 1 | 63 | Odds Ratio (M‐H, Fixed, 95% CI) | 1.01 [0.36, 2.83] |
| 8.3 No ESD team | 0 | 0 | Odds Ratio (M‐H, Fixed, 95% CI) | 0.0 [0.0, 0.0] |
| Outcome or subgroup title | No. of studies | No. of participants | Statistical method | Effect size |
| 1 Death or dependency: within 6 months Show forest plot | 10 | 1385 | Odds Ratio (M‐H, Fixed, 95% CI) | 0.70 [0.56, 0.87] |
| 2 Death or dependency: at 6 to 12 months Show forest plot | 7 | 1183 | Odds Ratio (M‐H, Fixed, 95% CI) | 0.84 [0.66, 1.05] |
| 3 Death or dependency: within 5 years Show forest plot | 2 | 403 | Odds Ratio (M‐H, Fixed, 95% CI) | 0.78 [0.52, 1.17] |
| Outcome or subgroup title | No. of studies | No. of participants | Statistical method | Effect size |
| 1 Subjective health status Show forest plot | 9 | 813 | Std. Mean Difference (IV, Fixed, 95% CI) | ‐0.06 [‐0.19, 0.08] |
| 1.1 ESD team co‐ordination and delivery | 5 | 373 | Std. Mean Difference (IV, Fixed, 95% CI) | ‐0.15 [‐0.35, 0.06] |
| 1.2 ESD team co‐ordination | 3 | 376 | Std. Mean Difference (IV, Fixed, 95% CI) | 0.09 [‐0.12, 0.29] |
| 1.3 No ESD team | 1 | 64 | Std. Mean Difference (IV, Fixed, 95% CI) | ‐0.38 [‐0.88, 0.11] |
| 2 Mood status Show forest plot | 3 | 122 | Std. Mean Difference (IV, Random, 95% CI) | ‐0.02 [‐0.92, 0.88] |
| 2.1 ESD team co‐ordination and delivery | 2 | 58 | Std. Mean Difference (IV, Random, 95% CI) | ‐0.19 [‐1.60, 1.22] |
| 2.2 ESD team co‐ordination | 0 | 0 | Std. Mean Difference (IV, Random, 95% CI) | 0.0 [0.0, 0.0] |
| 2.3 No ESD team | 1 | 64 | Std. Mean Difference (IV, Random, 95% CI) | 0.33 [‐0.17, 0.82] |
| 3 Satisfaction with services Show forest plot | 4 | 279 | Odds Ratio (M‐H, Fixed, 95% CI) | 1.56 [0.87, 2.81] |
| 3.1 ESD team co‐ordination and delivery | 3 | 246 | Odds Ratio (M‐H, Fixed, 95% CI) | 1.60 [0.85, 3.01] |
| 3.2 ESD team co‐ordination | 1 | 33 | Odds Ratio (M‐H, Fixed, 95% CI) | 1.28 [0.24, 6.70] |
| 3.3 No ESD team | 0 | 0 | Odds Ratio (M‐H, Fixed, 95% CI) | 0.0 [0.0, 0.0] |
| Outcome or subgroup title | No. of studies | No. of participants | Statistical method | Effect size |
| 1 Length of initial hospital stay (days) Show forest plot | 17 | 2161 | Mean Difference (IV, Random, 95% CI) | ‐5.54 [‐8.18, ‐2.91] |
| 1.1 ESD team co‐ordination and delivery | 9 | 1121 | Mean Difference (IV, Random, 95% CI) | ‐5.25 [‐8.81, ‐1.69] |
| 1.2 ESD team co‐ordination | 5 | 770 | Mean Difference (IV, Random, 95% CI) | ‐9.45 [‐13.97, ‐4.92] |
| 1.3 No ESD team | 3 | 270 | Mean Difference (IV, Random, 95% CI) | ‐3.83 [‐8.79, 1.13] |
| 2 Readmission to hospital Show forest plot | 7 | 784 | Odds Ratio (M‐H, Fixed, 95% CI) | 1.09 [0.79, 1.51] |
| 2.1 ESD team co‐ordination and delivery | 6 | 720 | Odds Ratio (M‐H, Fixed, 95% CI) | 1.11 [0.79, 1.55] |
| 2.2 ESD team co‐ordination | 0 | 0 | Odds Ratio (M‐H, Fixed, 95% CI) | 0.0 [0.0, 0.0] |
| 2.3 No ESD team | 1 | 64 | Odds Ratio (M‐H, Fixed, 95% CI) | 0.91 [0.29, 2.90] |
| Outcome or subgroup title | No. of studies | No. of participants | Statistical method | Effect size |
| 1 Death or dependency Show forest plot | 9 | 1175 | Odds Ratio (M‐H, Fixed, 95% CI) | 0.85 [0.67, 1.08] |
| 1.1 Age < 75 years | 9 | 695 | Odds Ratio (M‐H, Fixed, 95% CI) | 0.82 [0.60, 1.12] |
| 1.2 Age > 75 years | 9 | 480 | Odds Ratio (M‐H, Fixed, 95% CI) | 0.90 [0.61, 1.31] |
| 2 Length of stay (days) Show forest plot | 8 | 911 | Mean Difference (IV, Random, 95% CI) | ‐9.69 [‐13.56, ‐5.82] |
| 2.1 Age < 75 years | 8 | 566 | Mean Difference (IV, Random, 95% CI) | ‐11.68 [‐18.00, ‐5.36] |
| 2.2 Age > 75 years | 7 | 345 | Mean Difference (IV, Random, 95% CI) | ‐6.26 [‐10.51, ‐2.01] |
| Outcome or subgroup title | No. of studies | No. of participants | Statistical method | Effect size |
| 1 Death or dependency Show forest plot | 9 | 1175 | Odds Ratio (M‐H, Fixed, 95% CI) | 0.83 [0.65, 1.05] |
| 1.1 Men | 9 | 654 | Odds Ratio (M‐H, Fixed, 95% CI) | 0.73 [0.54, 1.01] |
| 1.2 Women | 9 | 521 | Odds Ratio (M‐H, Fixed, 95% CI) | 0.98 [0.68, 1.40] |
| 2 Length of stay (days) Show forest plot | 8 | 909 | Mean Difference (IV, Fixed, 95% CI) | ‐4.54 [‐6.48, ‐2.60] |
| 2.1 Men | 8 | 518 | Mean Difference (IV, Fixed, 95% CI) | ‐4.32 [‐6.65, ‐1.98] |
| 2.2 Women | 7 | 391 | Mean Difference (IV, Fixed, 95% CI) | ‐5.05 [‐8.55, ‐1.55] |
| Outcome or subgroup title | No. of studies | No. of participants | Statistical method | Effect size |
| 1 Death or dependency Show forest plot | 11 | 1545 | Odds Ratio (M‐H, Fixed, 95% CI) | 0.86 [0.69, 1.07] |
| 1.1 Initial Barthel 10 to 20 | 11 | 1164 | Odds Ratio (M‐H, Fixed, 95% CI) | 0.77 [0.61, 0.98] |
| 1.2 Initial Barthel < 10 | 10 | 381 | Odds Ratio (M‐H, Fixed, 95% CI) | 1.40 [0.83, 2.36] |
| 2 Length of stay (days) Show forest plot | 9 | 960 | Mean Difference (IV, Random, 95% CI) | ‐7.33 [‐12.15, ‐2.50] |
| 2.1 Initial Barthel 10 to 20 | 9 | 788 | Mean Difference (IV, Random, 95% CI) | ‐3.11 [‐7.13, 0.92] |
| 2.2 Initial Barthel < 10 | 7 | 172 | Mean Difference (IV, Random, 95% CI) | ‐28.32 [‐39.93, ‐16.71] |
| Outcome or subgroup title | No. of studies | No. of participants | Statistical method | Effect size |
| 1 Death or dependency Show forest plot | 11 | 1341 | Odds Ratio (M‐H, Fixed, 95% CI) | 0.87 [0.69, 1.08] |
| 1.1 Carer present | 11 | 903 | Odds Ratio (M‐H, Fixed, 95% CI) | 0.85 [0.65, 1.11] |
| 1.2 No carer | 9 | 438 | Odds Ratio (M‐H, Fixed, 95% CI) | 0.90 [0.61, 1.32] |
| 2 Length of stay (days) Show forest plot | 11 | 1138 | Mean Difference (IV, Random, 95% CI) | ‐6.09 [‐9.23, ‐2.94] |
| 2.1 Carer present | 11 | 804 | Mean Difference (IV, Random, 95% CI) | ‐6.22 [‐10.19, ‐2.24] |
| 2.2 No carer | 8 | 334 | Mean Difference (IV, Random, 95% CI) | ‐6.17 [‐9.00, ‐1.34] |
| Outcome or subgroup title | No. of studies | No. of participants | Statistical method | Effect size |
| 1 Death or dependency Show forest plot | 16 | 2359 | Odds Ratio (M‐H, Fixed, 95% CI) | 0.80 [0.67, 0.95] |
| 1.1 Stroke unit | 12 | 1715 | Odds Ratio (M‐H, Fixed, 95% CI) | 0.83 [0.68, 1.02] |
| 1.2 Other wards | 6 | 644 | Odds Ratio (M‐H, Fixed, 95% CI) | 0.72 [0.52, 1.00] |
| 2 Length of stay (days) Show forest plot | 17 | 2181 | Mean Difference (IV, Random, 95% CI) | ‐5.53 [‐8.25, ‐2.81] |
| 2.1 Stroke unit | 14 | 1546 | Mean Difference (IV, Random, 95% CI) | ‐4.56 [‐8.02, ‐1.11] |
| 2.2 Other wards | 6 | 635 | Mean Difference (IV, Random, 95% CI) | ‐7.25 [‐11.47, ‐3.03] |
| Outcome or subgroup title | No. of studies | No. of participants | Statistical method | Effect size |
| 1 Death or dependency Show forest plot | 13 | 1700 | Odds Ratio (M‐H, Fixed, 95% CI) | 0.71 [0.58, 0.87] |
| 1.1 Community in‐reach | 6 | 755 | Odds Ratio (M‐H, Fixed, 95% CI) | 0.72 [0.53, 0.96] |
| 1.2 Hospital out‐reach | 7 | 945 | Odds Ratio (M‐H, Fixed, 95% CI) | 0.71 [0.53, 0.94] |
| 2 Length of stay (days) Show forest plot | 14 | 1753 | Mean Difference (IV, Random, 95% CI) | ‐5.15 [‐7.92, ‐2.38] |
| 2.1 Community in‐reach | 6 | 744 | Mean Difference (IV, Random, 95% CI) | ‐4.34 [‐7.34, ‐1.34] |
| 2.2 Hospital out‐reach | 8 | 1009 | Mean Difference (IV, Random, 95% CI) | ‐5.21 [‐9.31, ‐1.10] |
| Outcome or subgroup title | No. of studies | No. of participants | Statistical method | Effect size |
| 1 Death Show forest plot | 16 | 2117 | Odds Ratio (M‐H, Fixed, 95% CI) | 1.04 [0.77, 1.40] |
| 1.1 MDT co‐ordination | 12 | 1596 | Odds Ratio (M‐H, Fixed, 95% CI) | 0.78 [0.54, 1.11] |
| 1.2 No MDT | 4 | 521 | Odds Ratio (M‐H, Fixed, 95% CI) | 2.15 [1.20, 3.85] |
| 2 Death or requiring institutional care Show forest plot | 12 | 1664 | Odds Ratio (M‐H, Fixed, 95% CI) | 0.75 [0.59, 0.96] |
| 2.1 MDT co‐ordination | 9 | 1207 | Odds Ratio (M‐H, Fixed, 95% CI) | 0.65 [0.49, 0.87] |
| 2.2 No MDT | 3 | 457 | Odds Ratio (M‐H, Fixed, 95% CI) | 1.11 [0.69, 1.77] |
| 3 Death or dependency Show forest plot | 16 | 2359 | Odds Ratio (M‐H, Fixed, 95% CI) | 0.80 [0.67, 0.95] |
| 3.1 MDT co‐ordination | 13 | 1902 | Odds Ratio (M‐H, Fixed, 95% CI) | 0.73 [0.60, 0.89] |
| 3.2 No MDT | 3 | 457 | Odds Ratio (M‐H, Fixed, 95% CI) | 1.11 [0.75, 1.62] |
| 4 Length of stay (days) Show forest plot | 17 | 2161 | Mean Difference (IV, Random, 95% CI) | ‐5.65 [‐8.28, ‐3.02] |
| 4.1 MDT co‐ordination | 14 | 1891 | Mean Difference (IV, Random, 95% CI) | ‐6.45 [‐9.67, ‐3.24] |
| 4.2 No MDT | 3 | 270 | Mean Difference (IV, Random, 95% CI) | ‐3.82 [‐8.78, 1.13] |