Servicios de alta temprana con apoyo para pacientes con un accidente cerebrovascular agudo
Información
- DOI:
- https://doi.org/10.1002/14651858.CD000443.pub4Copiar DOI

- Base de datos:
-
- Cochrane Database of Systematic Reviews
- Versión publicada:
-
- 13 julio 2017see what's new
- Tipo:
-
- Intervention
- Etapa:
-
- Review
- Grupo Editorial Cochrane:
-
Grupo Cochrane de Accidentes cerebrovasculares
- Copyright:
-
- Copyright © 2017 The Cochrane Collaboration. Published by John Wiley & Sons, Ltd.
Cifras del artículo
Altmetric:
Citado por:
Autores
Contributions of authors
For this version of the review, Peter Langhorne updated and carried out the literature searches, reanalysed the data and redrafted the manuscript. Satu Baylan carried out trial selection and screening and helped redraft the review. The Early Supported Discharge Trialists group provided advice and input on data interpretation and redrafting of the manuscript. The new trialists contacts were; Maayken van den Berg (Adelaide 2016), Jeyaraj Pandian (ATTEND pilot 2015), Silvina Santana (Aveiro 2016) and Hakon Hofstad (Bergen 2014).
For the previous version of the review, Patricia Fearon updated and carried out the literature searches, reanalysed the data and redrafted the manuscript. Peter Langhorne supervised the update and revised the draft manuscript. The Early Supported Discharge Trialists group provided original data, data interpretation, and redrafted the manuscript (ESD trialists 2012).
For the initial version of the review, Peter Langhorne initiated the study, drafted the original protocol, co‐ordinated the project, and drafted the original manuscript (EDS Trialists 2001). For the 2005 version of the review, Peter Langhorne, Martin Dennis, and Gillian Taylor formed the writing committee. Gillian Taylor, Peter Langhorne, and Gordon Murray conducted the original statistical analyses. The Early Supported Discharge Trialists group provided original data, data interpretation, and redrafted the manuscript (ESD trialists 2005).
Early Supported Discharge Trialists group consisted of: Craig Anderson (Sydney), Erik Bautz‐Holter (Oslo), Martin Dennis (Secretariat) Paola Dey (Manchester), Bent Indredavik (Trondheim), Birgitte Jepson (West Denmark), Peter Langhorne (Co‐ordinator), Nancy Mayo (Montreal), Paul Mogensen (West Denmark), Gordon Murray (Stastician), Michael Power (Belfast), Helen Rodgers (Newcastle), Ole Morten Ronning (Akershus), Anthony Rudd (London), Silvana Santana (Aviero), Nijasri Suwanwela (Bangkok), Gillian Taylor (Statistician), Lotta Widen‐Holmqvist (Stockholm) and Charles Wolfe (London). All contributed to the study design, data collection, and analysis and revision of the manuscript.
Sources of support
Internal sources
-
University of Glasgow, UK.
-
University of Edinburgh, UK.
External sources
-
Stroke Association, UK.
-
Chest Heart and Stroke Scotland, UK.
Declarations of interest
Peter Langhorne co‐authored one trial and the ESD trialists conducted the original randomised trials (see 'Potential biases in the review process'). Otherwise no relevant conflicts are known for Peter Langhorne and Satu Baylan.
Acknowledgements
The Early Supported Discharge Trialists group consisted of: Craig Anderson (Auckland), Erik Bautz‐Holter (Oslo), Martin Dennis (Secretariat) Paola Dey (Manchester), Bent Indredavik (Trondheim), Birgitte Jepson (West Denmark), Peter Langhorne (Co‐ordinator), Nancy Mayo (Montreal), Paul Mogensen (West Denmark), Gordon Murray (Statistician), Michael Power (Belfast), Helen Rodgers (Newcastle), Ole Morten Ronning (Akershus), Anthony Rudd (London), Silvana Santana (Aviero), Nijasri Suwanwela (Bangkok), Gillian Taylor (Statistician), Lotta Widen‐Holmqvist (Stockholm) and Charles Wolfe (London).
More recent trial contacts have been: Maayken van den Berg (Adelaide 2016), Jeyaraj Pandian (ATTEND pilot), Hakon Hofstad (Bergen).
We are grateful to Ken Fullerton (Belfast), Sally Rubenach (Adelaide), and Jean Douglas (Administrator) who contributed to earlier versions of this review.
Version history
| Published | Title | Stage | Authors | Version |
| 2017 Jul 13 | Early supported discharge services for people with acute stroke | Review | Peter Langhorne, Satu Baylan, Early Supported Discharge Trialists | |
| 2012 Sep 12 | Services for reducing duration of hospital care for acute stroke patients | Review | Patricia Fearon, Peter Langhorne, Early Supported Discharge Trialists | |
| 2005 Apr 20 | Services for reducing duration of hospital care for acute stroke patients | Review | Early Supported Discharge Trialists | |
| 2001 Jul 23 | Services for reducing duration of hospital care for acute stroke patients | Review | T rialists Early Supported Discharge, Peter Langhorne | |
Differences between protocol and review
For the 2012 update some post‐hoc analyses were carried out. These are highlighted in the text. The 2012 update did not explicitly include or exclude cluster‐randomised trial design and one was included (Glostrup 2006). For the current update, we have clarified inclusion criteria to exclude cluster‐randomised trials because of: 1) difficulties in obtaining data for appropriate analysis, and 2) increasing focus on cluster‐randomised trial methodology for implementation rather than evaluation trials. This results in the loss of one trial of 198 participants with no change in the conclusions (Glostrup 2006). The title was revised in 2017 to 'Early supported discharge services for people with acute stroke' to better reflect the content of the review.
Keywords
MeSH
Medical Subject Headings (MeSH) Keywords
- *Length of Stay;
- *Patient Discharge [economics];
- *Stroke Rehabilitation;
- Cost‐Benefit Analysis;
- Home Care Services, Hospital‐Based [economics, *organization & administration];
- Home Nursing [economics, organization & administration];
- Patient Readmission [statistics & numerical data];
- Randomized Controlled Trials as Topic;
- Stroke [economics, mortality];
Medical Subject Headings Check Words
Aged; Aged, 80 and over; Humans;
PICO

Flow diagram illustrating the results of the updated searches

'Risk of bias' graph: review authors' judgements about each risk of bias item presented as percentages across all included studies.

'Risk of bias' summary: review authors' judgements about each risk of bias item for each included study.

Comparison 1 Early supported discharge service versus conventional care: patient outcomes, Outcome 1 Death.
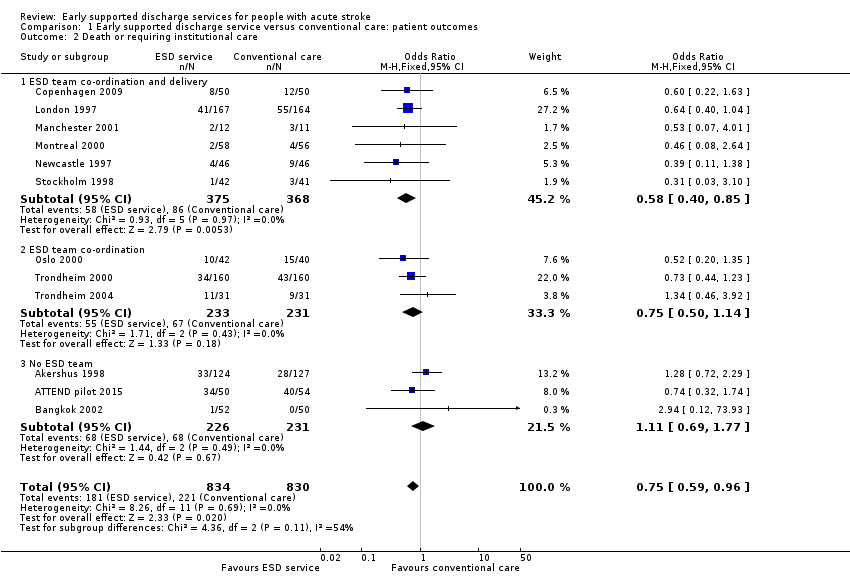
Comparison 1 Early supported discharge service versus conventional care: patient outcomes, Outcome 2 Death or requiring institutional care.

Comparison 1 Early supported discharge service versus conventional care: patient outcomes, Outcome 3 Death or dependency.
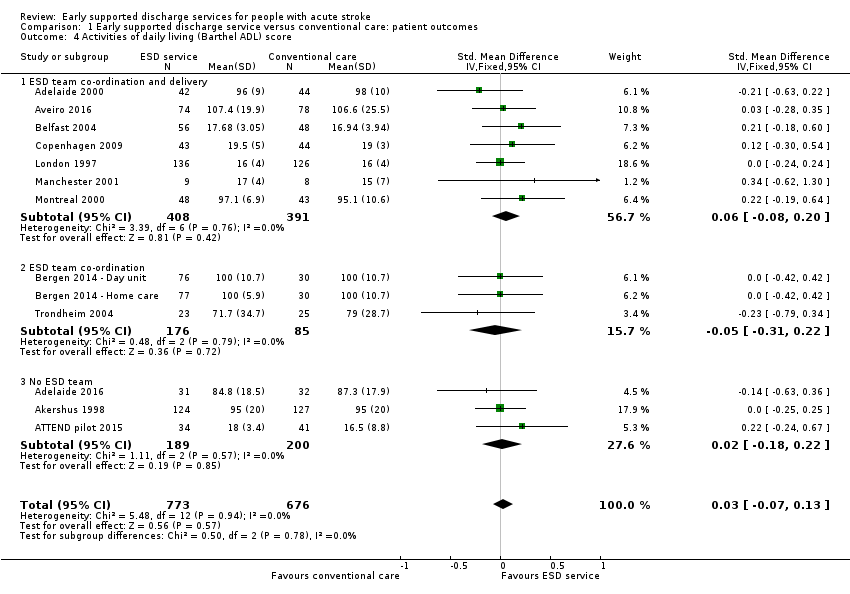
Comparison 1 Early supported discharge service versus conventional care: patient outcomes, Outcome 4 Activities of daily living (Barthel ADL) score.

Comparison 1 Early supported discharge service versus conventional care: patient outcomes, Outcome 5 Extended activities of daily living (EADL) score.

Comparison 1 Early supported discharge service versus conventional care: patient outcomes, Outcome 6 Subjective health status.
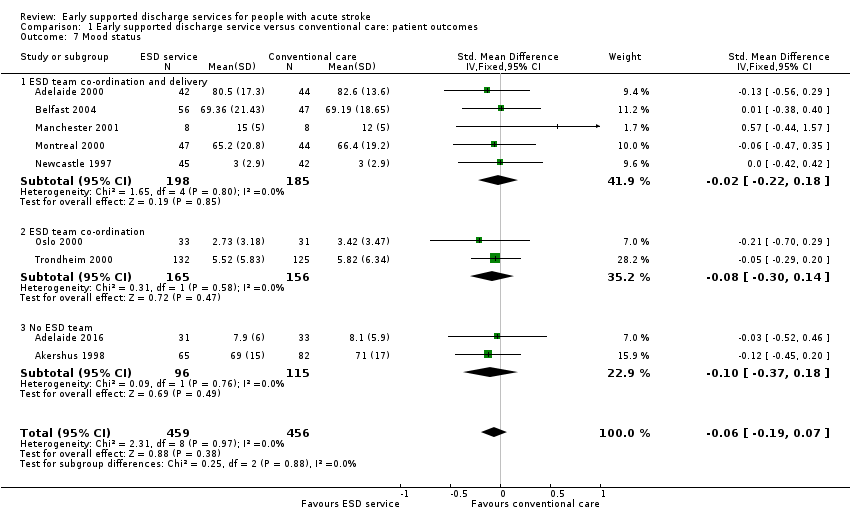
Comparison 1 Early supported discharge service versus conventional care: patient outcomes, Outcome 7 Mood status.

Comparison 1 Early supported discharge service versus conventional care: patient outcomes, Outcome 8 Satisfaction with services.

Comparison 2 Early supported discharge service versus conventional care: duration of follow‐up, Outcome 1 Death or dependency: within 6 months.

Comparison 2 Early supported discharge service versus conventional care: duration of follow‐up, Outcome 2 Death or dependency: at 6 to 12 months.
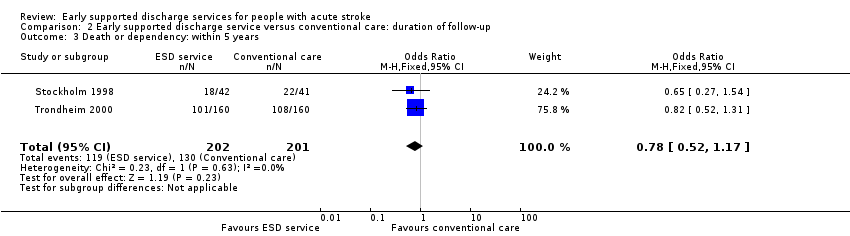
Comparison 2 Early supported discharge service versus conventional care: duration of follow‐up, Outcome 3 Death or dependency: within 5 years.
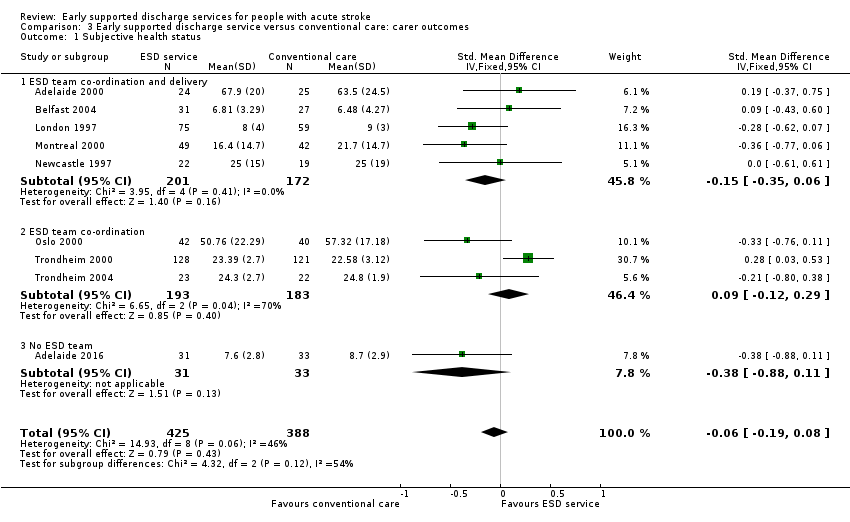
Comparison 3 Early supported discharge service versus conventional care: carer outcomes, Outcome 1 Subjective health status.
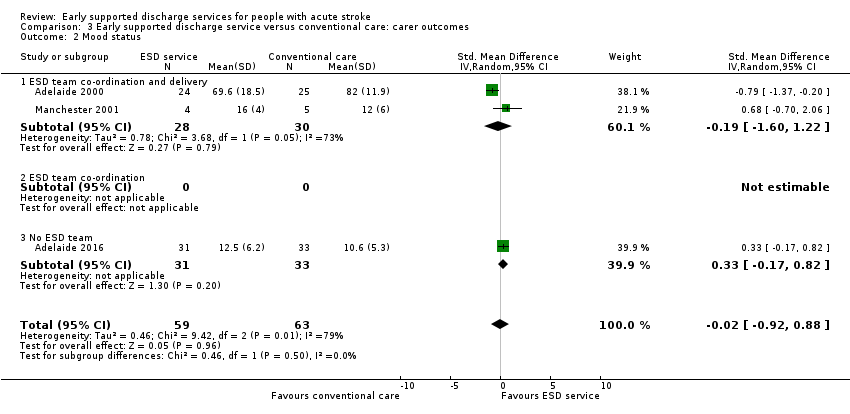
Comparison 3 Early supported discharge service versus conventional care: carer outcomes, Outcome 2 Mood status.

Comparison 3 Early supported discharge service versus conventional care: carer outcomes, Outcome 3 Satisfaction with services.
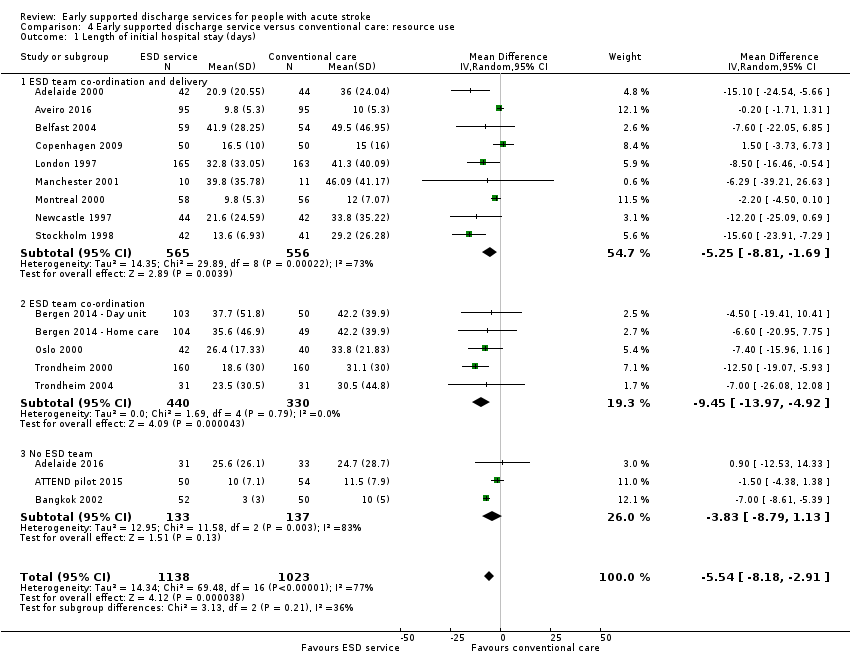
Comparison 4 Early supported discharge service versus conventional care: resource use, Outcome 1 Length of initial hospital stay (days).
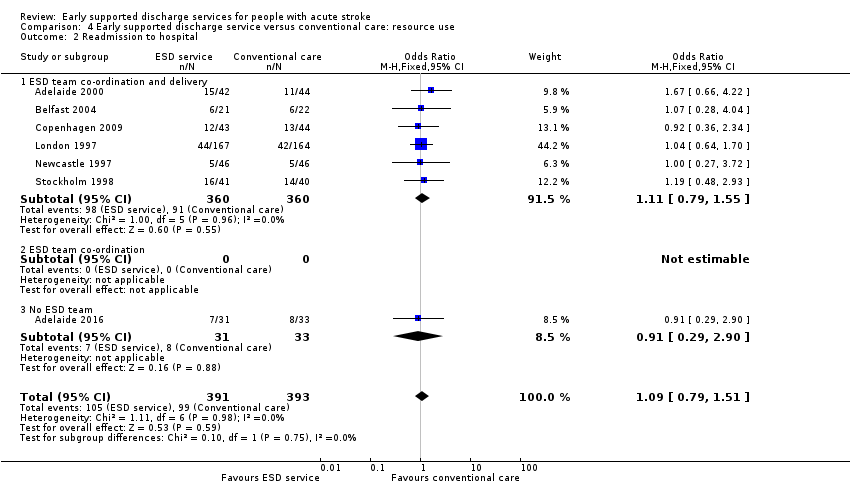
Comparison 4 Early supported discharge service versus conventional care: resource use, Outcome 2 Readmission to hospital.
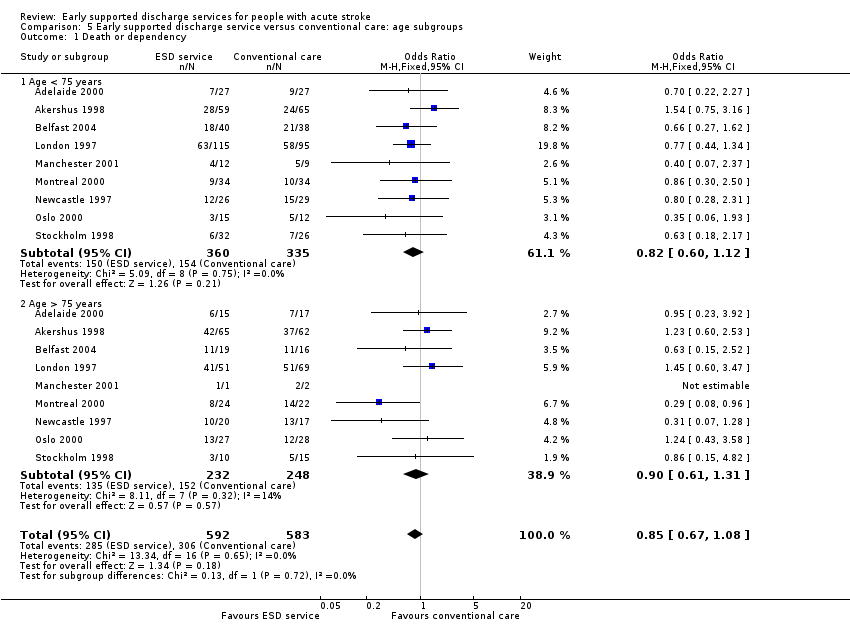
Comparison 5 Early supported discharge service versus conventional care: age subgroups, Outcome 1 Death or dependency.

Comparison 5 Early supported discharge service versus conventional care: age subgroups, Outcome 2 Length of stay (days).

Comparison 6 Early supported discharge service versus conventional care: gender subgroups, Outcome 1 Death or dependency.

Comparison 6 Early supported discharge service versus conventional care: gender subgroups, Outcome 2 Length of stay (days).

Comparison 7 Early supported discharge service versus conventional care: stroke severity subgroups, Outcome 1 Death or dependency.

Comparison 7 Early supported discharge service versus conventional care: stroke severity subgroups, Outcome 2 Length of stay (days).

Comparison 8 Early supported discharge service versus conventional care: carer subgroups, Outcome 1 Death or dependency.

Comparison 8 Early supported discharge service versus conventional care: carer subgroups, Outcome 2 Length of stay (days).
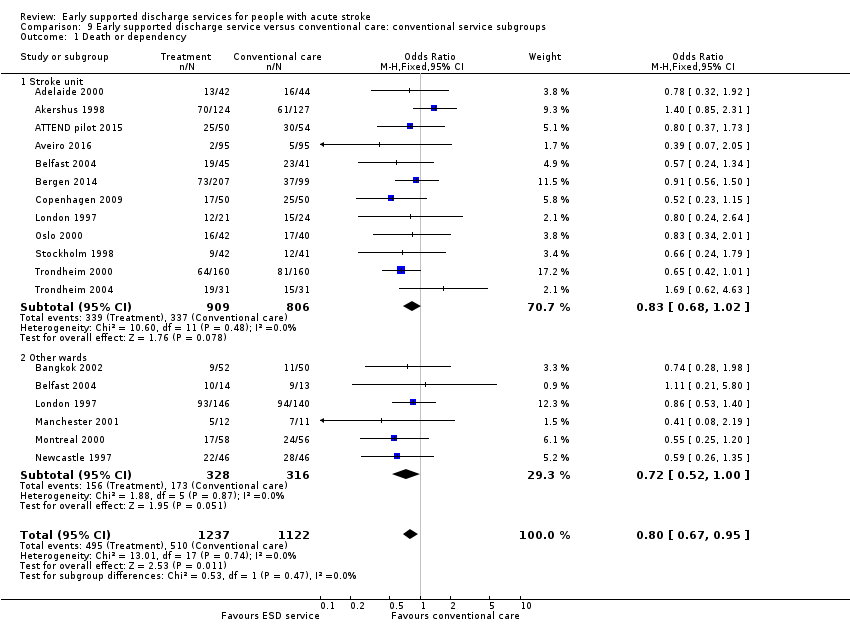
Comparison 9 Early supported discharge service versus conventional care: conventional service subgroups, Outcome 1 Death or dependency.

Comparison 9 Early supported discharge service versus conventional care: conventional service subgroups, Outcome 2 Length of stay (days).

Comparison 10 Early supported discharge service versus conventional care: ESD service subgroups: service base, Outcome 1 Death or dependency.
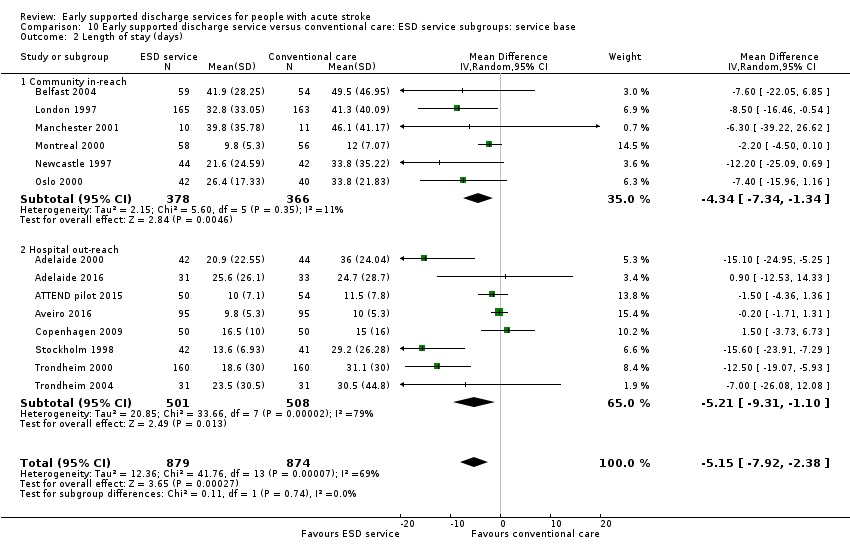
Comparison 10 Early supported discharge service versus conventional care: ESD service subgroups: service base, Outcome 2 Length of stay (days).
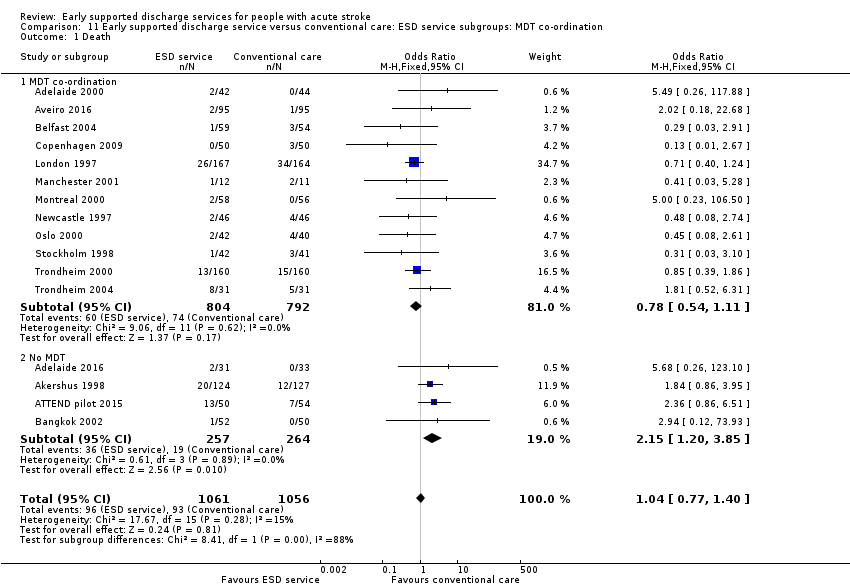
Comparison 11 Early supported discharge service versus conventional care: ESD service subgroups: MDT co‐ordination, Outcome 1 Death.

Comparison 11 Early supported discharge service versus conventional care: ESD service subgroups: MDT co‐ordination, Outcome 2 Death or requiring institutional care.
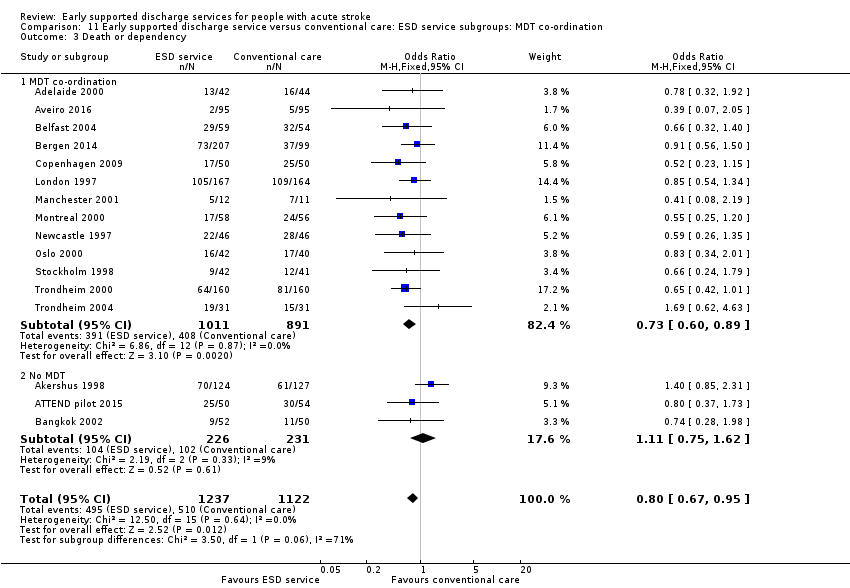
Comparison 11 Early supported discharge service versus conventional care: ESD service subgroups: MDT co‐ordination, Outcome 3 Death or dependency.

Comparison 11 Early supported discharge service versus conventional care: ESD service subgroups: MDT co‐ordination, Outcome 4 Length of stay (days).
| ESD service compared with usual care for stroke | ||||||
| Patient or population: people with stroke Settings: Hospital Intervention: Early supported discharge (ESD) service ‐ any type Comparison: Usual care | ||||||
| Outcomes | Illustrative comparative risks* (95% CI) | Relative effect | No of Participants | Quality of the evidence | Comments | |
| Assumed risk | Corresponding risk | |||||
| Usual care | ESD service | |||||
| Death or dependency at end of scheduled follow‐up (median 6 months) | Medium risk population | OR 0.80 (0.67 to 0.95) | 2359 | ⊕⊕⊕⊝ | Assumed risk from baseline in included trials. Corresponding risk estimated from risk difference (95% CI). | |
| 450 per 1000 | 400 per 1000 | |||||
| Death at end of scheduled follow‐up (median 6 months) | Medium risk population | OR 1.04 (0.77 to 1.40) | 2116 | ⊕⊕⊕⊝ | As above | |
| 90 per 1000 | 90 per 1000 | |||||
| Death or institution care at end of scheduled follow‐up (median 6 months) | Medium risk population | OR 0.75 (0.59 to 0.96) | 1664 (12) | ⊕⊕⊕⊝ | As above | |
| 270 per 1000 | 220 per 1000 | |||||
| Extended activities of daily living (EADL) score at end of scheduled follow‐up (median 6 months) | The mean EADL score ranged across control groups depending on the measure used (see Analysis 1.5) | The mean EADL score in the intervention groups was on average higher than usual care. | SMD 0.14 (0.03 to 0.25) | 1262 | ⊕⊕⊝⊝ | Range of scores used to measure EADL (high score means better outcome) therefore comparison is within scores. |
| Satisfaction with services at end of scheduled follow‐up (median 6 months) | Medium risk population | OR 1.60 (1.08 to 2.38) | 513 | ⊕⊕⊝⊝ | Stated satisfaction of patients with service received. | |
| 610 per 1000 | 690 per 1000 | |||||
| Length of initial hospital stay (days) | The mean length of stay in hospital and/or institution ranged across control groups from 10 to 50 days. | The mean length of stay in the intervention groups was | MD ‐ 5.5 (2.9 to 8.2) days | 2161 | ⊕⊕⊕⊝ | Length of stay in a hospital and/or institution. Most trials reported initial hospital stay. |
| Readmission to hospital at end of scheduled follow‐up (median 6 months) | Medium risk population | OR 1.09 (0.79 to 1.51) | 784 | ⊕⊕⊝⊝ | ||
| 250 per 1000 | 270 per 1000 | |||||
| *The basis for the assumed risk (e.g. the median control group risk across studies) is provided in footnotes. The corresponding risk (and its 95% confidence interval) is based on the assumed risk in the comparison group and the relative effect of the intervention (and its 95% CI). | ||||||
| GRADE Working Group grades of evidence | ||||||
| The trials on average focused on a middle band of stroke patients with moderate levels of disability. a) Downgraded once for risk of performance bias. Sensitivity analyses indicate little risk from other potential biases. b) Downgraded twice for risk of performance bias and potential risk of missing data. c) Downgraded for risk of performance bias. Substantial heterogeneity of results are present but unlikely to alter direction of effect. | ||||||
| Trial | Setting | Key features | Control service base | ESD staffing (whole time equivalents for caseload of 100 patients/year; median and range) | |||||||
| Medical | Nursing | Physio | OT | SALT | Assistant | Other | Total | ||||
| ESD team co‐ordination and delivery | |||||||||||
| Urban | PHMR Goals documented | Rehabilitation unit (stroke and neurological) | 0.06 | 0.06 | 0.7 | 1.6 | 0.25
| 0.4
| Social work | 2.6 | |
| Mixed | Tailored | Mixture (stroke unit, case managers in community‐based team) | 0.8 | 0 | 1.0 | 1.5 | 0 | 0 | Psychology | 3.2 | |
| Mixed | PHMR | Mixture (medical, geriatric, stroke unit) | 0.1 | 0 | 1.5
| 1.0
| 0.5
| 1.5 | Secretary Social work | 4.6 | |
| Urban | Tailored | Stroke unit | nd | nd | nd | nd | nd | nd | nd | nd | |
| Urban | Equipment store | Mixture (medical, stroke unit) | 0.1 | 0 | 1 | 1 | 0.5 | 0.5 | ‐ | 3.1 | |
| Urban |
| Mixture (medical, stroke team or unit) | nd | nd | nd | nd | nd | nd | ‐ | nd | |
| Urban |
| Mixture (medical neurology) | 0 | 0.4 | 1.0 | 0.7 | 0.4 | ‐ | Dietitian | 2.7 | |
| Urban | Envt visit Key worker 7‐day input PHMR | Mixture (medical, geriatric) | 0
| 0 | 0.8 | 1.0 | 0.3 | 0.2
| Secretary Social work Carers | 2.8 | |
| Urban | Case manager Patient diary | Stroke unit | 0.03 | 0 | 1.0 | 1.0 | 0.5 | ‐ | ‐ | 2.6 | |
| Mixed | Tailored | Neurorehabilitation centres (3) | ? | 0 | ? | ? | 0 | 0 | 0 | ? | |
| ESD team co‐ordination | |||||||||||
| Urban | Day Unit ESD Home‐based ESD | Stroke unit | nd | nd | nd | nd | nd | nd | nd | nd | |
| Urban | Key worker Community services | Stroke unit | nd | nd | nd | nd | nd | nd | ‐ | nd | |
| Urban | Key worker Team Community services | Stroke unit | 0.12 | 1.2 | 1.2 | 1.2 | 0 | ‐ | ‐ | 3.7 | |
| Rural |
| Stroke unit | 0.12 | 1.2 | 1.2 | 1.2 | 0 | ‐ | ‐ | 3.7 | |
| 10 urban 3 mixed 1 rural | 7 stroke unit 5 mixed service 2 neurorehabilitation unit | 0.10 (0 to 0.12) | 0 (0 to 1.2) | 1.0 (0.7 to 1.5) | 1.0 (0.7 to 1.6) | 0.3 (0 to 0.5) | 0.4 (0 to 1.5) | ‐ | 3.1 (2.6 to 4.6) | ||
| No ESD team | |||||||||||
| Urban | Caregiver‐mediated exercises combined with tele‐rehabilitation services | Stroke unit | nd | nd | nd? | nd | nd | nd | ‐ | nd | |
| Mixed | Range of community rehabilitation services | Stroke unit | nd | nd | nd | nd | nd | nd | ‐ | nd | |
| Mixed | Family‐mediated rehabilitation with mostly remote follow‐up | Stroke unit | nd | nd | < 1.0 | nd | nd | nd | ‐ | nd | |
| Urban | Red Cross volunteers | Stroke unit | nd | nd | nd | nd | nd | nd | ‐ | nd | |
| MDT mtg: multidisciplinary team meeting | |||||||||||
| Trial | Death | Institutional care | Dependency | Defined dependent | Length of stay |
| 6 months | 6 months | 6 months | Barthel index < 95/100 | Initial hospital discharge | |
| 3 months | ‐ | 3 months | Barthel index | Initial hospital discharge and up to 12 months | |
| 7 months | 7 months | 7 months | Barthel index < 95/100 | Not used ‐ only available for acute hospital | |
| 6 months | ‐ | 6 months | Rankin score 3 to 5 | Initial hospital discharge (median, IQR) | |
| 6 months | 6 months | 6 months | Functional Independence Measure < 60 points | Initial stroke unit stay (also stay in rehabilitation unit) | |
| 6 months | 6 months | 6 months | Barthel index < 95/100 | Initial hospital discharge | |
| 12 months | 12 months | 12 months | Barthel index < 19/20 | Initial hospital discharge | |
| 6 months | 6 months | 6 months | Rankin score 3 to 5 | Initial hospital stay plus institution up to 6 months | |
| 5 months | 5 months | 3 months | Rankin score 3 to 5 | Initial hospital stay | |
| 12 months | 12 months | 12 months | Barthel index < 19/20 | Initial hospital discharge | |
| 12 months | 12 months | 12 months | Barthel index < 19/20 | Initial hospital stay (acute and rehabilitation wards) | |
| 3 months | 3 months | 3 months | Barthel index < 95/100 | Initial hospital stay | |
| 3 month | 3 month | 3 month | Rankin score 3 to 5 | Initial hospital stay | |
| 6 month | 6 month | 6 month | Rankin score 3 to 5 | Initial hospital stay | |
| 6 month | 6 month | 6 month | Barthel index 95/100 | Initial hospital stay | |
| 6 months | 6 months | 6 months | Barthel index 95/100 | Initial hospital stay | |
| 12 months | 12 months | 12 months | Rankin score 3 to 5 | Initial hospital stay (acute and rehabilitation wards) | |
| IQR: interquartile range | |||||
| Trial | Recruited intervention | Recruited control | Recruited total | Missing intervention | Missing control | Available intervention | Available control | Available total | Comments |
| 885 | 874 | 1759 | 31 | 25 | 854 (96%) | 849 (97%) | 1703 (97%) | ||
| 31 | 32 | 63 | 2 | 2 | 29 (94%) | 30 (94%) | 59 (94%) | Not available as dichotomous outcome | |
| 50 | 54 | 104 | 5 | 9 | 45 (90%) | 45 (83%) | 90 (87%) | ||
| 95 | 95 | 190 | 19 | 17 | 76 (80%) | 78 (82%) | 154 (81%) | ||
| 207 | 99 | 306 | 44 | 33 | 163 (79%) | 66 (67%) | 229 (75%) | ||
| Total | 1268 | 1154 | 2422 | 101 | 86 | 1166 (92%) | 1068 (93%) | 2234 (92%) |
| Trial | Timing of outcome | ADL score | Extended ADL score | Subjective health | Mood | Service satisfaction | Hospital readmission |
| 6 months | Barthel index (median, IQR) | Adelaide Activities Profile | SF‐36 (General health perceptions) | SF‐36 (mental health) | Satisfied with rehabilitation programme | 6 months | |
| 3 months | Barthel index (mean, 95% CI) | Nottingham extended ADL (mean, 95% CI) | Stroke Impact Scale | Hospital Anxiety and Depression Scale (HADS) | ‐ | 12 months | |
| 7 months | Barthel index (median, imputed SD) | ‐ | SF‐36 (general health perceptions) | SF‐36 (mental health) | ‐ | ‐ | |
| 6 months | ‐ | Nottingham Extended | EQ‐5D | Hospital anxiety and depression scale (category) | ‐ | 6 months | |
| 6 months | FIM (mean, SD) | Frenchay Activities Index | ‐ | ‐ | ‐ | ‐ | |
| ‐ | ‐ | ‐ | ‐ | ‐ | ‐ | ‐ | |
| 12 months | Barthel index | Nottingham extended ADL | SF‐36 (general health perceptions) | SF‐36 (mental health) | Satisfied with outpatient rehabilitation | 6 month | |
| 6 months | Barthel index (median, IQR) | ‐ | ‐ | ‐ | Satisfaction score (mean & SD) | ‐ | |
| 3 months | Barthel Index (median, imputed SD) | ‐ | EQ‐5D | ‐ | 5 months | ||
| 12 months | Barthel index | Rivermead ADL score | Nottingham health profile (score reversed) | Number abnormal on hospital anxiety and depression scale | Satisfied with care in general | 12 month | |
| 12 months | Barthel index | Nottingham extended ADL score | Euroquol scale (0 to 100) | Hospital anxiety and depression scale (depression subscore, score reversed) | ‐ | ‐ | |
| 3 month | Barthel index | Instrumental ADL (OARS) scale | SF‐36 (general health perceptions) | SF‐36 (mental health) | ‐ | ‐ | |
| 3 month | ‐ | Nottingham extended ADL score (median, IQR) | Dartmouth COOP chart overall health section (median, IQR; scale reversed) | Dartmouth COOP chart feelings section (median, IQR; scale reversed) | ‐ | 3 month | |
| 6 month | ‐ | Nottingham extended ADL score (median, IQR) | General Health Questionnaire (reversed score) | MADRS score | Satisfied with care in general | ‐ | |
| 8 months | ‐ | Frenchay Activities index (median, IQR) | Sickness impact profile score (median, IQR) | ‐ | Satisfied with care received | 6 months | |
| 12 months | ‐ | Frenchay social activity index | Nottingham Health Profile (average of sum 1 and 2) | MADRS | ‐ | ‐ | |
| 12 months | Barthel Index | ‐ | Nottingham health profile | ‐ | ‐ | ‐ | |
| ADL: activities of daily living | |||||||
| Trial | Timing of outcome | Subjective health | Mood | Service satisfaction |
| 6 months | SF‐36 general health perceptions | SF‐36 mental health | Satisfied with rehabilitation programme | |
| 3 months | Caregiver Strain Index (score reversed) | Hospital Anxiety and Depression Scale (score reversed) | ||
| ‐ | ‐ | ‐ | ‐ | |
| 6 months | Caregiver Burden Scale (category) | ‐ | ‐ | |
| ‐ | ‐ | ‐ | ‐ | |
| ‐ | ‐ | ‐ | ‐ | |
| 6 months | Caregiver strain index (score reversed) | ‐ | Satisfied with outpatient services | |
| ‐ | ‐ | ‐ | ‐ | |
| 3 months | Satisfied with rehabilitation programme | |||
| 12 months | Caregiver strain index (score reversed) | ‐ | Satisfied with care in general | |
| 12 month | ‐ | Hospital Anxiety and Depression Scale (depression subscore, score reversed) | ‐ | |
| 3 months | Caregiver Burden Index | ‐ | ‐ | |
| 3 months | General health questionnaire (median, range; score reversed) | ‐ | ‐ | |
| 6 months | General health questionnaire (score reversed) | ‐ | Satisfied with care in general | |
| ‐ | ‐ | ‐ | ‐ | |
| 12 months | Caregiver Burden score | ‐ | ‐ | |
| 12 months | Caregiver strain index (score reversed) | ‐ | ‐ |
| Time from randomisation | Number (%) discharged | Risk difference (95% CI) | Significance | |
| ESD service (364 patients) | Control (354 patients) | |||
| 2 weeks | 116 (32%) | 77 (22%) | 11 (‐3, 24) | 0.13 |
| 4 weeks | 236 (65%) | 179 (50%) | 19 (4, 35) | 0.01 |
| 6 weeks | 277 (76%) | 249 (70 %) | 8 (1, 15) | 0.02 |
| 8 weeks | 303 (83%) | 275 (78%) | 8 (3, 13) | 0.003 |
| 3 months | 345 (95%) | 324 (92%) | 2 (‐1, 6) | 0.21 |
| 6 months | 363 (100%) | 353 (100%) | 0 (‐2, 1) | 0.71 |
| Data are presented from six trials that could provide relevant data on 718 participants (Adelaide 2000; Belfast 2004; London 1997; Manchester 2001; Oslo 2000; Stockholm 1998). Discharges include deaths and do not include readmissions. The risk difference (95% confidence interval) is calculated taking into account variation between trials | ||||
| Trial | Items costed | ESD cost / patient | Control cost / pt | Percent difference |
| Cost minimisation. Direct and indirect | AUD 8040 | AUD 10,054 | ‐ 20% | |
| Direct and indirect to 12 months | GBP 6800 | GBP 7432 | ‐ 9% | |
| Direct and indirect to 3 months | CAD 7784 | CAD 11,065 | ‐30% | |
| Direct and indirect | GBP 7155 | GBP 7480 | ‐ 4% | |
| Hospital, community, private costs | SEK 2806 | SEK 3475 | ‐ 19% | |
| Direct costs to 12 months | EUR 5113 | EUR 6665 | ‐ 23% |
| Outcome or subgroup title | No. of studies | No. of participants | Statistical method | Effect size |
| 1 Death Show forest plot | 16 | 2116 | Odds Ratio (M‐H, Fixed, 95% CI) | 1.04 [0.77, 1.40] |
| 1.1 ESD team co‐ordination and delivery | 9 | 1132 | Odds Ratio (M‐H, Fixed, 95% CI) | 0.70 [0.45, 1.09] |
| 1.2 ESD team co‐ordination | 3 | 464 | Odds Ratio (M‐H, Fixed, 95% CI) | 0.95 [0.52, 1.74] |
| 1.3 No ESD team | 4 | 520 | Odds Ratio (M‐H, Fixed, 95% CI) | 2.14 [1.19, 3.85] |
| 2 Death or requiring institutional care Show forest plot | 12 | 1664 | Odds Ratio (M‐H, Fixed, 95% CI) | 0.75 [0.59, 0.96] |
| 2.1 ESD team co‐ordination and delivery | 6 | 743 | Odds Ratio (M‐H, Fixed, 95% CI) | 0.58 [0.40, 0.85] |
| 2.2 ESD team co‐ordination | 3 | 464 | Odds Ratio (M‐H, Fixed, 95% CI) | 0.75 [0.50, 1.14] |
| 2.3 No ESD team | 3 | 457 | Odds Ratio (M‐H, Fixed, 95% CI) | 1.11 [0.69, 1.77] |
| 3 Death or dependency Show forest plot | 16 | 2359 | Odds Ratio (M‐H, Fixed, 95% CI) | 0.80 [0.67, 0.95] |
| 3.1 ESD team co‐ordination and delivery | 9 | 1132 | Odds Ratio (M‐H, Fixed, 95% CI) | 0.67 [0.52, 0.87] |
| 3.2 ESD team co‐ordination | 4 | 770 | Odds Ratio (M‐H, Fixed, 95% CI) | 0.82 [0.61, 1.10] |
| 3.3 No ESD team | 3 | 457 | Odds Ratio (M‐H, Fixed, 95% CI) | 1.11 [0.75, 1.62] |
| 4 Activities of daily living (Barthel ADL) score Show forest plot | 13 | 1449 | Std. Mean Difference (IV, Fixed, 95% CI) | 0.03 [‐0.07, 0.13] |
| 4.1 ESD team co‐ordination and delivery | 7 | 799 | Std. Mean Difference (IV, Fixed, 95% CI) | 0.06 [‐0.08, 0.20] |
| 4.2 ESD team co‐ordination | 3 | 261 | Std. Mean Difference (IV, Fixed, 95% CI) | ‐0.05 [‐0.31, 0.22] |
| 4.3 No ESD team | 3 | 389 | Std. Mean Difference (IV, Fixed, 95% CI) | 0.02 [‐0.18, 0.22] |
| 5 Extended activities of daily living (EADL) score Show forest plot | 11 | 1262 | Std. Mean Difference (IV, Fixed, 95% CI) | 0.14 [0.03, 0.25] |
| 5.1 ESD team co‐ordination and delivery | 8 | 876 | Std. Mean Difference (IV, Fixed, 95% CI) | 0.17 [0.04, 0.30] |
| 5.2 ESD team co‐ordination | 2 | 322 | Std. Mean Difference (IV, Fixed, 95% CI) | 0.07 [‐0.15, 0.29] |
| 5.3 No ESD team | 1 | 64 | Std. Mean Difference (IV, Fixed, 95% CI) | 0.16 [‐0.33, 0.65] |
| 6 Subjective health status Show forest plot | 11 | 1202 | Std. Mean Difference (IV, Fixed, 95% CI) | ‐0.01 [‐0.12, 0.10] |
| 6.1 ESD team co‐ordination and delivery | 7 | 685 | Std. Mean Difference (IV, Fixed, 95% CI) | ‐0.12 [‐0.27, 0.03] |
| 6.2 ESD team co‐ordination | 3 | 370 | Std. Mean Difference (IV, Fixed, 95% CI) | 0.14 [‐0.07, 0.34] |
| 6.3 No ESD team | 1 | 147 | Std. Mean Difference (IV, Fixed, 95% CI) | 0.14 [‐0.19, 0.47] |
| 7 Mood status Show forest plot | 9 | 915 | Std. Mean Difference (IV, Fixed, 95% CI) | ‐0.06 [‐0.19, 0.07] |
| 7.1 ESD team co‐ordination and delivery | 5 | 383 | Std. Mean Difference (IV, Fixed, 95% CI) | ‐0.02 [‐0.22, 0.18] |
| 7.2 ESD team co‐ordination | 2 | 321 | Std. Mean Difference (IV, Fixed, 95% CI) | ‐0.08 [‐0.30, 0.14] |
| 7.3 No ESD team | 2 | 211 | Std. Mean Difference (IV, Fixed, 95% CI) | ‐0.10 [‐0.37, 0.18] |
| 8 Satisfaction with services Show forest plot | 5 | 513 | Odds Ratio (M‐H, Fixed, 95% CI) | 1.60 [1.08, 2.38] |
| 8.1 ESD team co‐ordination and delivery | 4 | 450 | Odds Ratio (M‐H, Fixed, 95% CI) | 1.74 [1.13, 2.67] |
| 8.2 ESD team co‐ordination | 1 | 63 | Odds Ratio (M‐H, Fixed, 95% CI) | 1.01 [0.36, 2.83] |
| 8.3 No ESD team | 0 | 0 | Odds Ratio (M‐H, Fixed, 95% CI) | 0.0 [0.0, 0.0] |
| Outcome or subgroup title | No. of studies | No. of participants | Statistical method | Effect size |
| 1 Death or dependency: within 6 months Show forest plot | 10 | 1385 | Odds Ratio (M‐H, Fixed, 95% CI) | 0.70 [0.56, 0.87] |
| 2 Death or dependency: at 6 to 12 months Show forest plot | 7 | 1183 | Odds Ratio (M‐H, Fixed, 95% CI) | 0.84 [0.66, 1.05] |
| 3 Death or dependency: within 5 years Show forest plot | 2 | 403 | Odds Ratio (M‐H, Fixed, 95% CI) | 0.78 [0.52, 1.17] |
| Outcome or subgroup title | No. of studies | No. of participants | Statistical method | Effect size |
| 1 Subjective health status Show forest plot | 9 | 813 | Std. Mean Difference (IV, Fixed, 95% CI) | ‐0.06 [‐0.19, 0.08] |
| 1.1 ESD team co‐ordination and delivery | 5 | 373 | Std. Mean Difference (IV, Fixed, 95% CI) | ‐0.15 [‐0.35, 0.06] |
| 1.2 ESD team co‐ordination | 3 | 376 | Std. Mean Difference (IV, Fixed, 95% CI) | 0.09 [‐0.12, 0.29] |
| 1.3 No ESD team | 1 | 64 | Std. Mean Difference (IV, Fixed, 95% CI) | ‐0.38 [‐0.88, 0.11] |
| 2 Mood status Show forest plot | 3 | 122 | Std. Mean Difference (IV, Random, 95% CI) | ‐0.02 [‐0.92, 0.88] |
| 2.1 ESD team co‐ordination and delivery | 2 | 58 | Std. Mean Difference (IV, Random, 95% CI) | ‐0.19 [‐1.60, 1.22] |
| 2.2 ESD team co‐ordination | 0 | 0 | Std. Mean Difference (IV, Random, 95% CI) | 0.0 [0.0, 0.0] |
| 2.3 No ESD team | 1 | 64 | Std. Mean Difference (IV, Random, 95% CI) | 0.33 [‐0.17, 0.82] |
| 3 Satisfaction with services Show forest plot | 4 | 279 | Odds Ratio (M‐H, Fixed, 95% CI) | 1.56 [0.87, 2.81] |
| 3.1 ESD team co‐ordination and delivery | 3 | 246 | Odds Ratio (M‐H, Fixed, 95% CI) | 1.60 [0.85, 3.01] |
| 3.2 ESD team co‐ordination | 1 | 33 | Odds Ratio (M‐H, Fixed, 95% CI) | 1.28 [0.24, 6.70] |
| 3.3 No ESD team | 0 | 0 | Odds Ratio (M‐H, Fixed, 95% CI) | 0.0 [0.0, 0.0] |
| Outcome or subgroup title | No. of studies | No. of participants | Statistical method | Effect size |
| 1 Length of initial hospital stay (days) Show forest plot | 17 | 2161 | Mean Difference (IV, Random, 95% CI) | ‐5.54 [‐8.18, ‐2.91] |
| 1.1 ESD team co‐ordination and delivery | 9 | 1121 | Mean Difference (IV, Random, 95% CI) | ‐5.25 [‐8.81, ‐1.69] |
| 1.2 ESD team co‐ordination | 5 | 770 | Mean Difference (IV, Random, 95% CI) | ‐9.45 [‐13.97, ‐4.92] |
| 1.3 No ESD team | 3 | 270 | Mean Difference (IV, Random, 95% CI) | ‐3.83 [‐8.79, 1.13] |
| 2 Readmission to hospital Show forest plot | 7 | 784 | Odds Ratio (M‐H, Fixed, 95% CI) | 1.09 [0.79, 1.51] |
| 2.1 ESD team co‐ordination and delivery | 6 | 720 | Odds Ratio (M‐H, Fixed, 95% CI) | 1.11 [0.79, 1.55] |
| 2.2 ESD team co‐ordination | 0 | 0 | Odds Ratio (M‐H, Fixed, 95% CI) | 0.0 [0.0, 0.0] |
| 2.3 No ESD team | 1 | 64 | Odds Ratio (M‐H, Fixed, 95% CI) | 0.91 [0.29, 2.90] |
| Outcome or subgroup title | No. of studies | No. of participants | Statistical method | Effect size |
| 1 Death or dependency Show forest plot | 9 | 1175 | Odds Ratio (M‐H, Fixed, 95% CI) | 0.85 [0.67, 1.08] |
| 1.1 Age < 75 years | 9 | 695 | Odds Ratio (M‐H, Fixed, 95% CI) | 0.82 [0.60, 1.12] |
| 1.2 Age > 75 years | 9 | 480 | Odds Ratio (M‐H, Fixed, 95% CI) | 0.90 [0.61, 1.31] |
| 2 Length of stay (days) Show forest plot | 8 | 911 | Mean Difference (IV, Random, 95% CI) | ‐9.69 [‐13.56, ‐5.82] |
| 2.1 Age < 75 years | 8 | 566 | Mean Difference (IV, Random, 95% CI) | ‐11.68 [‐18.00, ‐5.36] |
| 2.2 Age > 75 years | 7 | 345 | Mean Difference (IV, Random, 95% CI) | ‐6.26 [‐10.51, ‐2.01] |
| Outcome or subgroup title | No. of studies | No. of participants | Statistical method | Effect size |
| 1 Death or dependency Show forest plot | 9 | 1175 | Odds Ratio (M‐H, Fixed, 95% CI) | 0.83 [0.65, 1.05] |
| 1.1 Men | 9 | 654 | Odds Ratio (M‐H, Fixed, 95% CI) | 0.73 [0.54, 1.01] |
| 1.2 Women | 9 | 521 | Odds Ratio (M‐H, Fixed, 95% CI) | 0.98 [0.68, 1.40] |
| 2 Length of stay (days) Show forest plot | 8 | 909 | Mean Difference (IV, Fixed, 95% CI) | ‐4.54 [‐6.48, ‐2.60] |
| 2.1 Men | 8 | 518 | Mean Difference (IV, Fixed, 95% CI) | ‐4.32 [‐6.65, ‐1.98] |
| 2.2 Women | 7 | 391 | Mean Difference (IV, Fixed, 95% CI) | ‐5.05 [‐8.55, ‐1.55] |
| Outcome or subgroup title | No. of studies | No. of participants | Statistical method | Effect size |
| 1 Death or dependency Show forest plot | 11 | 1545 | Odds Ratio (M‐H, Fixed, 95% CI) | 0.86 [0.69, 1.07] |
| 1.1 Initial Barthel 10 to 20 | 11 | 1164 | Odds Ratio (M‐H, Fixed, 95% CI) | 0.77 [0.61, 0.98] |
| 1.2 Initial Barthel < 10 | 10 | 381 | Odds Ratio (M‐H, Fixed, 95% CI) | 1.40 [0.83, 2.36] |
| 2 Length of stay (days) Show forest plot | 9 | 960 | Mean Difference (IV, Random, 95% CI) | ‐7.33 [‐12.15, ‐2.50] |
| 2.1 Initial Barthel 10 to 20 | 9 | 788 | Mean Difference (IV, Random, 95% CI) | ‐3.11 [‐7.13, 0.92] |
| 2.2 Initial Barthel < 10 | 7 | 172 | Mean Difference (IV, Random, 95% CI) | ‐28.32 [‐39.93, ‐16.71] |
| Outcome or subgroup title | No. of studies | No. of participants | Statistical method | Effect size |
| 1 Death or dependency Show forest plot | 11 | 1341 | Odds Ratio (M‐H, Fixed, 95% CI) | 0.87 [0.69, 1.08] |
| 1.1 Carer present | 11 | 903 | Odds Ratio (M‐H, Fixed, 95% CI) | 0.85 [0.65, 1.11] |
| 1.2 No carer | 9 | 438 | Odds Ratio (M‐H, Fixed, 95% CI) | 0.90 [0.61, 1.32] |
| 2 Length of stay (days) Show forest plot | 11 | 1138 | Mean Difference (IV, Random, 95% CI) | ‐6.09 [‐9.23, ‐2.94] |
| 2.1 Carer present | 11 | 804 | Mean Difference (IV, Random, 95% CI) | ‐6.22 [‐10.19, ‐2.24] |
| 2.2 No carer | 8 | 334 | Mean Difference (IV, Random, 95% CI) | ‐6.17 [‐9.00, ‐1.34] |
| Outcome or subgroup title | No. of studies | No. of participants | Statistical method | Effect size |
| 1 Death or dependency Show forest plot | 16 | 2359 | Odds Ratio (M‐H, Fixed, 95% CI) | 0.80 [0.67, 0.95] |
| 1.1 Stroke unit | 12 | 1715 | Odds Ratio (M‐H, Fixed, 95% CI) | 0.83 [0.68, 1.02] |
| 1.2 Other wards | 6 | 644 | Odds Ratio (M‐H, Fixed, 95% CI) | 0.72 [0.52, 1.00] |
| 2 Length of stay (days) Show forest plot | 17 | 2181 | Mean Difference (IV, Random, 95% CI) | ‐5.53 [‐8.25, ‐2.81] |
| 2.1 Stroke unit | 14 | 1546 | Mean Difference (IV, Random, 95% CI) | ‐4.56 [‐8.02, ‐1.11] |
| 2.2 Other wards | 6 | 635 | Mean Difference (IV, Random, 95% CI) | ‐7.25 [‐11.47, ‐3.03] |
| Outcome or subgroup title | No. of studies | No. of participants | Statistical method | Effect size |
| 1 Death or dependency Show forest plot | 13 | 1700 | Odds Ratio (M‐H, Fixed, 95% CI) | 0.71 [0.58, 0.87] |
| 1.1 Community in‐reach | 6 | 755 | Odds Ratio (M‐H, Fixed, 95% CI) | 0.72 [0.53, 0.96] |
| 1.2 Hospital out‐reach | 7 | 945 | Odds Ratio (M‐H, Fixed, 95% CI) | 0.71 [0.53, 0.94] |
| 2 Length of stay (days) Show forest plot | 14 | 1753 | Mean Difference (IV, Random, 95% CI) | ‐5.15 [‐7.92, ‐2.38] |
| 2.1 Community in‐reach | 6 | 744 | Mean Difference (IV, Random, 95% CI) | ‐4.34 [‐7.34, ‐1.34] |
| 2.2 Hospital out‐reach | 8 | 1009 | Mean Difference (IV, Random, 95% CI) | ‐5.21 [‐9.31, ‐1.10] |
| Outcome or subgroup title | No. of studies | No. of participants | Statistical method | Effect size |
| 1 Death Show forest plot | 16 | 2117 | Odds Ratio (M‐H, Fixed, 95% CI) | 1.04 [0.77, 1.40] |
| 1.1 MDT co‐ordination | 12 | 1596 | Odds Ratio (M‐H, Fixed, 95% CI) | 0.78 [0.54, 1.11] |
| 1.2 No MDT | 4 | 521 | Odds Ratio (M‐H, Fixed, 95% CI) | 2.15 [1.20, 3.85] |
| 2 Death or requiring institutional care Show forest plot | 12 | 1664 | Odds Ratio (M‐H, Fixed, 95% CI) | 0.75 [0.59, 0.96] |
| 2.1 MDT co‐ordination | 9 | 1207 | Odds Ratio (M‐H, Fixed, 95% CI) | 0.65 [0.49, 0.87] |
| 2.2 No MDT | 3 | 457 | Odds Ratio (M‐H, Fixed, 95% CI) | 1.11 [0.69, 1.77] |
| 3 Death or dependency Show forest plot | 16 | 2359 | Odds Ratio (M‐H, Fixed, 95% CI) | 0.80 [0.67, 0.95] |
| 3.1 MDT co‐ordination | 13 | 1902 | Odds Ratio (M‐H, Fixed, 95% CI) | 0.73 [0.60, 0.89] |
| 3.2 No MDT | 3 | 457 | Odds Ratio (M‐H, Fixed, 95% CI) | 1.11 [0.75, 1.62] |
| 4 Length of stay (days) Show forest plot | 17 | 2161 | Mean Difference (IV, Random, 95% CI) | ‐5.65 [‐8.28, ‐3.02] |
| 4.1 MDT co‐ordination | 14 | 1891 | Mean Difference (IV, Random, 95% CI) | ‐6.45 [‐9.67, ‐3.24] |
| 4.2 No MDT | 3 | 270 | Mean Difference (IV, Random, 95% CI) | ‐3.82 [‐8.78, 1.13] |