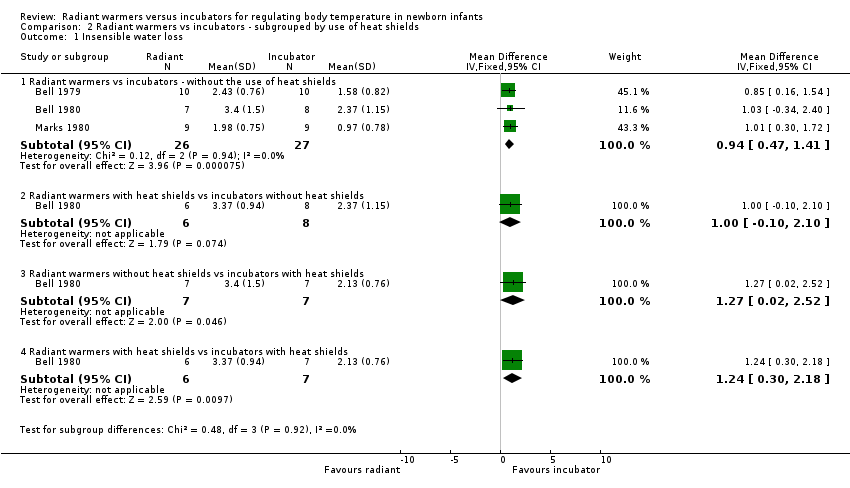
| 1 Insensible water loss Show forest plot | 3 | | Mean Difference (IV, Fixed, 95% CI) | Subtotals only |
|
| 1.1 Radiant warmers vs incubators ‐ without the use of heat shields | 3 | 53 | Mean Difference (IV, Fixed, 95% CI) | 0.94 [0.47, 1.41] |
| 1.2 Radiant warmers with heat shields vs incubators without heat shields | 1 | 14 | Mean Difference (IV, Fixed, 95% CI) | 1.0 [‐0.10, 2.10] |
| 1.3 Radiant warmers without heat shields vs incubators with heat shields | 1 | 14 | Mean Difference (IV, Fixed, 95% CI) | 1.27 [0.02, 2.52] |
| 1.4 Radiant warmers with heat shields vs incubators with heat shields | 1 | 13 | Mean Difference (IV, Fixed, 95% CI) | 1.24 [0.30, 2.18] |
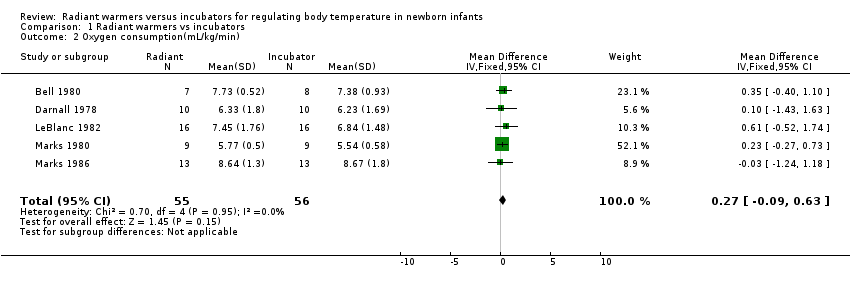
| 2 Oxygen consumption (mL/kg/min) Show forest plot | 5 | | Mean Difference (IV, Fixed, 95% CI) | Subtotals only |
|
| 2.1 Radiant warmers vs incubators ‐ without the use of heat shields | 5 | 111 | Mean Difference (IV, Fixed, 95% CI) | 0.27 [‐0.09, 0.63] |
| 2.2 Radiant warmers with heat shields vs incubators without heat shields | 1 | 14 | Mean Difference (IV, Fixed, 95% CI) | ‐0.05 [‐0.84, 0.74] |
| 2.3 Radiant warmers without heat shields vs incubators with heat shields | 1 | 14 | Mean Difference (IV, Fixed, 95% CI) | ‐0.05 [‐0.89, 0.79] |
| 2.4 Radiant warmers with heat shields vs incubators with heat shields | 1 | 13 | Mean Difference (IV, Fixed, 95% CI) | ‐0.45 [‐1.33, 0.43] |
| 3 Time to regain birthweight (days) Show forest plot | 2 | 90 | Mean Difference (IV, Fixed, 95% CI) | 0.86 [‐1.49, 3.21] |
|
| 3.1 Radiant warmers vs incubators ‐ without the use of heat shields | 1 | 30 | Mean Difference (IV, Fixed, 95% CI) | ‐0.65 [‐4.58, 3.28] |
| 3.2 Radiant warmers with heat shields vs incubators without heat shields | 1 | 60 | Mean Difference (IV, Fixed, 95% CI) | 1.70 [‐1.24, 4.64] |
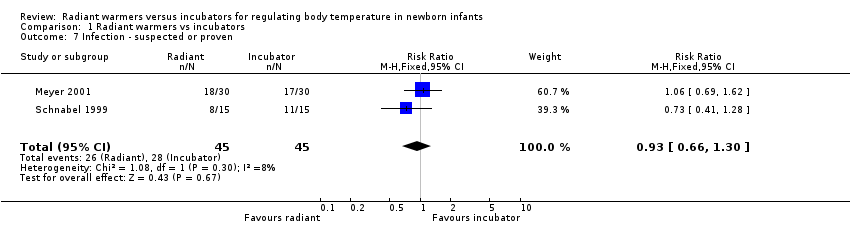
| 4 Infection ‐ suspected or proven Show forest plot | 2 | 90 | Risk Ratio (M‐H, Fixed, 95% CI) | 0.93 [0.66, 1.30] |
|
| 4.1 Radiant warmers vs incubators ‐ without the use of heat shields | 1 | 30 | Risk Ratio (M‐H, Fixed, 95% CI) | 0.73 [0.41, 1.28] |
| 4.2 Radiant warmers with heat shields vs incubators without heat shields | 1 | 60 | Risk Ratio (M‐H, Fixed, 95% CI) | 1.06 [0.69, 1.62] |
| 5 Infection ‐ positive blood culture Show forest plot | 1 | 60 | Risk Ratio (M‐H, Fixed, 95% CI) | 0.6 [0.16, 2.29] |
|
| 5.1 Radiant warmers with heat shields vs incubators without heat shields | 1 | 60 | Risk Ratio (M‐H, Fixed, 95% CI) | 0.6 [0.16, 2.29] |
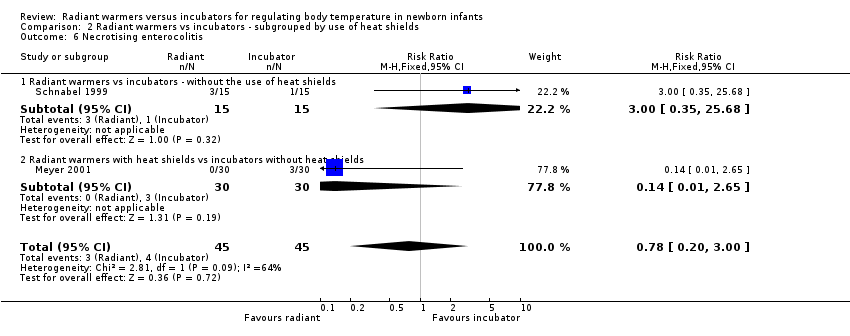
| 6 Necrotising enterocolitis Show forest plot | 2 | 90 | Risk Ratio (M‐H, Fixed, 95% CI) | 0.78 [0.20, 3.00] |
|
| 6.1 Radiant warmers vs incubators ‐ without the use of heat shields | 1 | 30 | Risk Ratio (M‐H, Fixed, 95% CI) | 3.0 [0.35, 25.68] |
| 6.2 Radiant warmers with heat shields vs incubators without heat shields | 1 | 60 | Risk Ratio (M‐H, Fixed, 95% CI) | 0.14 [0.01, 2.65] |
| 7 Patent ductus arteriosus Show forest plot | 2 | 90 | Risk Ratio (M‐H, Fixed, 95% CI) | 1.0 [0.38, 2.62] |
|
| 7.1 Radiant warmers vs incubators ‐ without the use of heat shields | 1 | 30 | Risk Ratio (M‐H, Fixed, 95% CI) | 1.5 [0.29, 7.73] |
| 7.2 Radiant warmers with heat shields vs incubators without heat shields | 1 | 60 | Risk Ratio (M‐H, Fixed, 95% CI) | 0.8 [0.24, 2.69] |
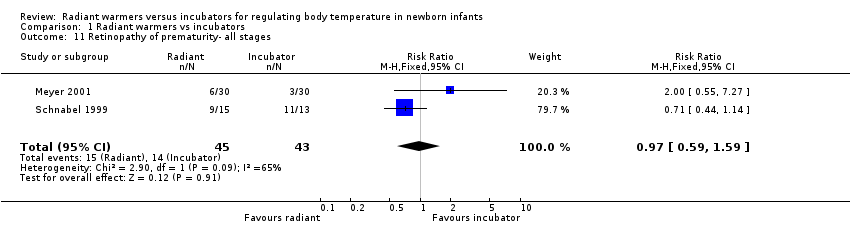
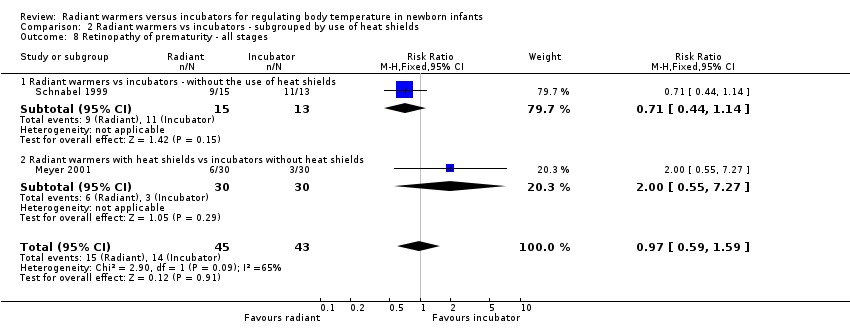
| 8 Retinopathy of prematurity ‐ all stages Show forest plot | 2 | 88 | Risk Ratio (M‐H, Fixed, 95% CI) | 0.97 [0.59, 1.59] |
|
| 8.1 Radiant warmers vs incubators ‐ without the use of heat shields | 1 | 28 | Risk Ratio (M‐H, Fixed, 95% CI) | 0.71 [0.44, 1.14] |
| 8.2 Radiant warmers with heat shields vs incubators without heat shields | 1 | 60 | Risk Ratio (M‐H, Fixed, 95% CI) | 2.0 [0.55, 7.27] |
| 9 Retinopathy of prematurity ‐ Stages III and IV Show forest plot | 2 | 88 | Risk Ratio (M‐H, Fixed, 95% CI) | 1.27 [0.28, 5.83] |
|
| 9.1 Radiant warmers vs incubators ‐ without the use of heat shields | 1 | 28 | Risk Ratio (M‐H, Fixed, 95% CI) | 0.87 [0.14, 5.32] |
| 9.2 Radiant warmers with heat shields vs incubators without heat shields | 1 | 60 | Risk Ratio (M‐H, Fixed, 95% CI) | 3.0 [0.13, 70.83] |
| 10 Intraventricular haemorrhage ‐ all grades Show forest plot | 2 | 90 | Risk Ratio (M‐H, Fixed, 95% CI) | 0.76 [0.31, 1.91] |
|
| 10.1 Radiant warmers vs incubators ‐ without the use of heat shields | 1 | 30 | Risk Ratio (M‐H, Fixed, 95% CI) | 0.33 [0.01, 7.58] |
| 10.2 Radiant warmers with heat shields vs incubators without heat shields | 1 | 60 | Risk Ratio (M‐H, Fixed, 95% CI) | 0.86 [0.33, 2.25] |
| 11 Intraventricular haemorrhage ‐ Grades 3 and 4 Show forest plot | 2 | 90 | Risk Ratio (M‐H, Fixed, 95% CI) | 0.33 [0.01, 7.87] |
|
| 11.1 Radiant warmers vs incubators ‐ without the use of heat shields | 1 | 30 | Risk Ratio (M‐H, Fixed, 95% CI) | 0.0 [0.0, 0.0] |
| 11.2 Radiant warmers with heat shields vs incubators without heat shields | 1 | 60 | Risk Ratio (M‐H, Fixed, 95% CI) | 0.33 [0.01, 7.87] |
| 12 Cerebral cystic lesions Show forest plot | 2 | 90 | Risk Ratio (M‐H, Fixed, 95% CI) | 0.33 [0.04, 3.08] |
|
| 12.1 Radiant warmers vs incubators ‐ without the use of heat shields | 1 | 30 | Risk Ratio (M‐H, Fixed, 95% CI) | 0.33 [0.01, 7.58] |
| 12.2 Radiant warmers with heat shields vs incubators without heat shields | 1 | 60 | Risk Ratio (M‐H, Fixed, 95% CI) | 0.33 [0.01, 7.87] |
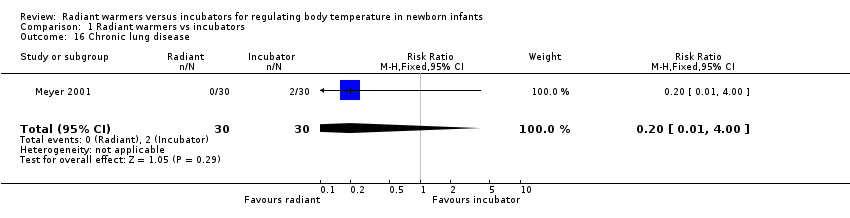
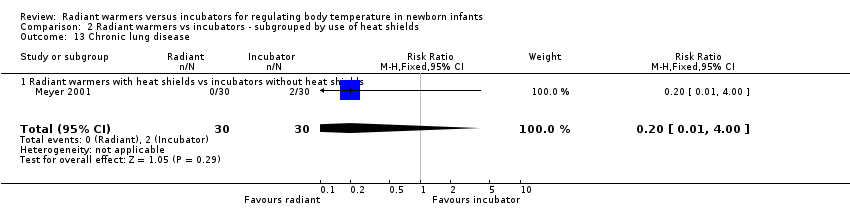
| 13 Chronic lung disease Show forest plot | 1 | 60 | Risk Ratio (M‐H, Fixed, 95% CI) | 0.2 [0.01, 4.00] |
|
| 13.1 Radiant warmers with heat shields vs incubators without heat shields | 1 | 60 | Risk Ratio (M‐H, Fixed, 95% CI) | 0.2 [0.01, 4.00] |
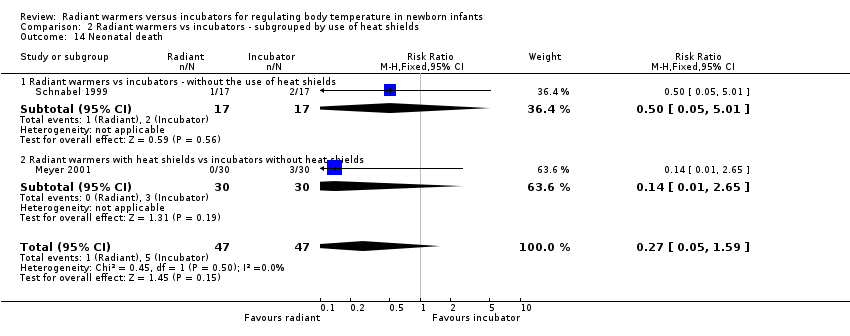
| 14 Neonatal death Show forest plot | 2 | 94 | Risk Ratio (M‐H, Fixed, 95% CI) | 0.27 [0.05, 1.59] |
|
| 14.1 Radiant warmers vs incubators ‐ without the use of heat shields | 1 | 34 | Risk Ratio (M‐H, Fixed, 95% CI) | 0.5 [0.05, 5.01] |
| 14.2 Radiant warmers with heat shields vs incubators without heat shields | 1 | 60 | Risk Ratio (M‐H, Fixed, 95% CI) | 0.14 [0.01, 2.65] |
| 15 Serum sodium >150mmol/L Show forest plot | 1 | 60 | Risk Ratio (M‐H, Fixed, 95% CI) | 3.0 [0.66, 13.69] |
|
| 15.1 Radiant warmers with heat shields vs incubators without heat shields | 1 | 60 | Risk Ratio (M‐H, Fixed, 95% CI) | 3.0 [0.66, 13.69] |