| 1 Functional scores at 12 months (higher = worse) Show forest plot | 3 | 153 | Std. Mean Difference (IV, Fixed, 95% CI) | ‐0.10 [‐0.42, 0.22] |
|
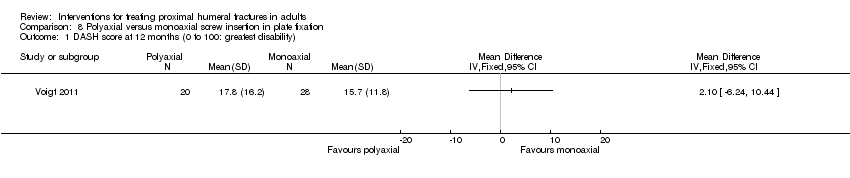
| 1.1 DASH (0 to 100: worst disability) (reversed) | 2 | 105 | Std. Mean Difference (IV, Fixed, 95% CI) | ‐0.19 [‐0.57, 0.19] |
| 1.2 ASES (0 to 24: best) | 1 | 48 | Std. Mean Difference (IV, Fixed, 95% CI) | 0.10 [‐0.46, 0.67] |
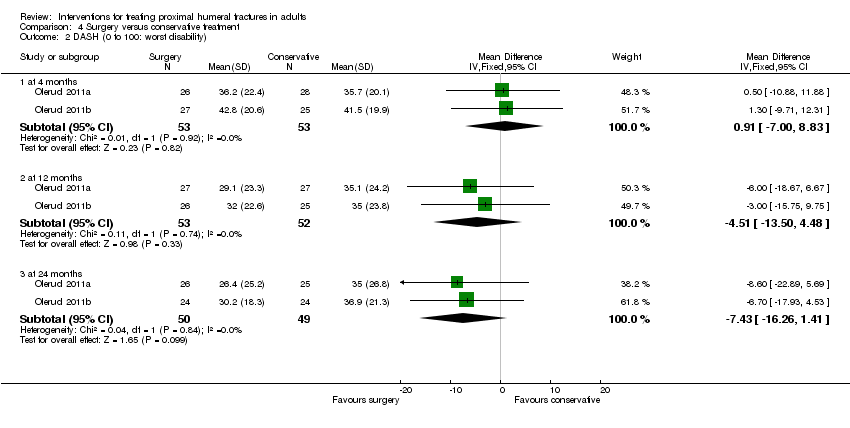
| 2 DASH (0 to 100: worst disability) Show forest plot | 2 | | Mean Difference (IV, Fixed, 95% CI) | Subtotals only |
|
| 2.1 at 4 months | 2 | 106 | Mean Difference (IV, Fixed, 95% CI) | 0.91 [‐7.00, 8.83] |
| 2.2 at 12 months | 2 | 105 | Mean Difference (IV, Fixed, 95% CI) | ‐4.51 [‐13.50, 4.48] |
| 2.3 at 24 months | 2 | 99 | Mean Difference (IV, Fixed, 95% CI) | ‐7.43 [‐16.26, 1.41] |
| 3 American Shoulder and Elbow Surgeons score (0 to 24: best) Show forest plot | 1 | | Mean Difference (IV, Fixed, 95% CI) | Totals not selected |
|
| 3.1 at 6 months | 1 | | Mean Difference (IV, Fixed, 95% CI) | 0.0 [0.0, 0.0] |
| 3.2 at 12 months | 1 | | Mean Difference (IV, Fixed, 95% CI) | 0.0 [0.0, 0.0] |
| 4 Activities of daily living Show forest plot | 1 | | Risk Ratio (M‐H, Fixed, 95% CI) | Totals not selected |
|
| 4.1 Unable to manage personal hygiene at 1 year | 1 | | Risk Ratio (M‐H, Fixed, 95% CI) | 0.0 [0.0, 0.0] |
| 4.2 Unable to comb hair at 1 year | 1 | | Risk Ratio (M‐H, Fixed, 95% CI) | 0.0 [0.0, 0.0] |
| 4.3 Unable to sleep on fractured side at 1 year | 1 | | Risk Ratio (M‐H, Fixed, 95% CI) | 0.0 [0.0, 0.0] |
| 4.4 Unable to carry 5 kg at 1 year | 1 | | Risk Ratio (M‐H, Fixed, 95% CI) | 0.0 [0.0, 0.0] |
| 4.5 Unable to manage personal hygiene at 50 months | 1 | | Risk Ratio (M‐H, Fixed, 95% CI) | 0.0 [0.0, 0.0] |
| 4.6 Unable to comb hair at 50 months | 1 | | Risk Ratio (M‐H, Fixed, 95% CI) | 0.0 [0.0, 0.0] |
| 4.7 Unable to sleep on fractured side at 50 months | 1 | | Risk Ratio (M‐H, Fixed, 95% CI) | 0.0 [0.0, 0.0] |
| 4.8 Unable to carry 5 kg at 50 months | 1 | | Risk Ratio (M‐H, Fixed, 95% CI) | 0.0 [0.0, 0.0] |
| 5 Quality of life assessment: EuroQol (0: dead to 1: best health) Show forest plot | 3 | | Mean Difference (IV, Fixed, 95% CI) | Subtotals only |
|
| 5.1 at 3 to 4 months | 3 | 156 | Mean Difference (IV, Fixed, 95% CI) | 0.01 [‐0.02, 0.05] |
| 5.2 at 6 months | 3 | 156 | Mean Difference (IV, Fixed, 95% CI) | 0.04 [‐0.01, 0.08] |
| 5.3 at 12 months | 3 | 153 | Mean Difference (IV, Fixed, 95% CI) | 0.04 [‐0.01, 0.08] |
| 5.4 at 24 months | 2 | 101 | Mean Difference (IV, Fixed, 95% CI) | 0.15 [0.05, 0.25] |
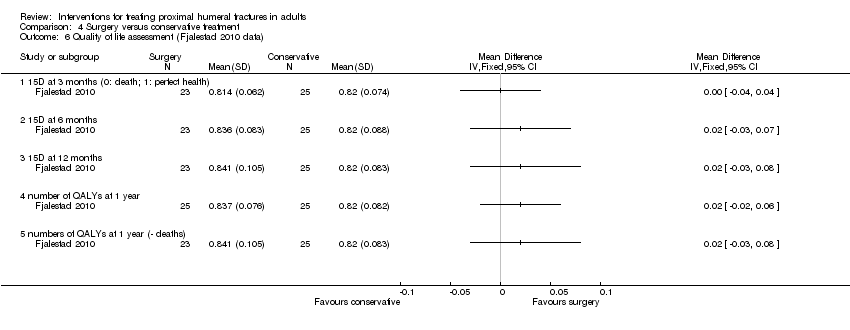
| 6 Quality of life assessment (Fjalestad 2010 data) Show forest plot | 1 | | Mean Difference (IV, Fixed, 95% CI) | Totals not selected |
|
| 6.1 15D at 3 months (0: death; 1: perfect health) | 1 | | Mean Difference (IV, Fixed, 95% CI) | 0.0 [0.0, 0.0] |
| 6.2 15D at 6 months | 1 | | Mean Difference (IV, Fixed, 95% CI) | 0.0 [0.0, 0.0] |
| 6.3 15D at 12 months | 1 | | Mean Difference (IV, Fixed, 95% CI) | 0.0 [0.0, 0.0] |
| 6.4 number of QALYs at 1 year | 1 | | Mean Difference (IV, Fixed, 95% CI) | 0.0 [0.0, 0.0] |
| 6.5 numbers of QALYs at 1 year (‐ deaths) | 1 | | Mean Difference (IV, Fixed, 95% CI) | 0.0 [0.0, 0.0] |
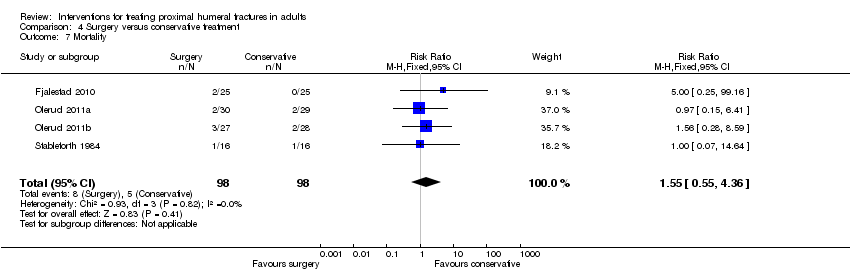
| 7 Mortality Show forest plot | 4 | 196 | Risk Ratio (M‐H, Fixed, 95% CI) | 1.55 [0.55, 4.36] |
|
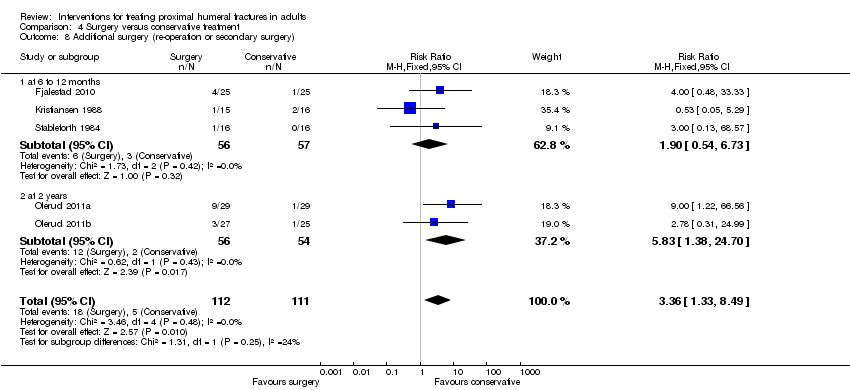
| 8 Additional surgery (re‐operation or secondary surgery) Show forest plot | 5 | 223 | Risk Ratio (M‐H, Fixed, 95% CI) | 3.36 [1.33, 8.49] |
|
| 8.1 at 6 to 12 months | 3 | 113 | Risk Ratio (M‐H, Fixed, 95% CI) | 1.90 [0.54, 6.73] |
| 8.2 at 2 years | 2 | 110 | Risk Ratio (M‐H, Fixed, 95% CI) | 5.83 [1.38, 24.70] |
| 9 Adverse events / complications Show forest plot | 6 | | Risk Ratio (M‐H, Fixed, 95% CI) | Subtotals only |
|
| 9.1 Infection | 6 | 259 | Risk Ratio (M‐H, Fixed, 95% CI) | 4.13 [0.91, 18.87] |
| 9.2 Nerve injury / palsy | 3 | 146 | Risk Ratio (M‐H, Fixed, 95% CI) | 0.74 [0.20, 2.76] |
| 9.3 Non union | 5 | 223 | Risk Ratio (M‐H, Fixed, 95% CI) | 0.48 [0.16, 1.40] |
| 9.4 Avascular necrosis | 5 | 213 | Risk Ratio (M‐H, Fixed, 95% CI) | 0.65 [0.37, 1.16] |
| 9.5 Post‐traumatic osteoarthritis (signs of) | 3 | 133 | Risk Ratio (M‐H, Fixed, 95% CI) | 0.56 [0.21, 1.51] |
| 9.6 Screw penetration into joint | 3 | 160 | Risk Ratio (M‐H, Fixed, 95% CI) | 11.49 [2.25, 58.76] |
| 9.7 Impingement | 1 | 58 | Risk Ratio (M‐H, Fixed, 95% CI) | 2.0 [0.19, 20.86] |
| 9.8 Redisplacement resulting in an operation | 2 | 81 | Risk Ratio (M‐H, Fixed, 95% CI) | 0.26 [0.03, 2.22] |
| 9.9 Secondary dislocation or resorption of the greater tuberosity | 1 | 51 | Risk Ratio (M‐H, Fixed, 95% CI) | 15.18 [0.92, 249.78] |
| 9.10 Tuberosity displacement at 50 months | 1 | 29 | Risk Ratio (M‐H, Fixed, 95% CI) | 0.15 [0.01, 2.71] |
| 9.11 Wire penetration at 1 year | 1 | 38 | Risk Ratio (M‐H, Fixed, 95% CI) | 3.0 [0.13, 69.31] |
| 9.12 Fixation failure resulting in an operation | 1 | 50 | Risk Ratio (M‐H, Fixed, 95% CI) | 3.0 [0.13, 70.30] |
| 9.13 Refracture | 1 | 22 | Risk Ratio (M‐H, Fixed, 95% CI) | 1.0 [0.07, 14.05] |
| 10 Constant scores (overall: 0 to 100: best score) Show forest plot | 4 | | Mean Difference (IV, Fixed, 95% CI) | Subtotals only |
|
| 10.1 at 4 months | 2 | 107 | Mean Difference (IV, Fixed, 95% CI) | ‐1.33 [‐6.80, 4.14] |
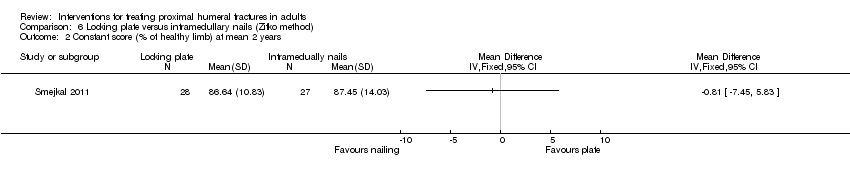
| 10.2 at 12 months | 3 | 152 | Mean Difference (IV, Fixed, 95% CI) | 2.36 [‐3.52, 8.24] |
| 10.3 at 24 months | 2 | 101 | Mean Difference (IV, Fixed, 95% CI) | 0.48 [‐7.26, 8.22] |
| 10.4 at 50 months | 1 | 29 | Mean Difference (IV, Fixed, 95% CI) | ‐5.0 [‐17.52, 7.52] |
| 11 Constant scores (difference between injured and uninjured shoulder): Normal = 0. Show forest plot | 1 | | Mean Difference (IV, Fixed, 95% CI) | Totals not selected |
|
| 11.1 at 6 months | 1 | | Mean Difference (IV, Fixed, 95% CI) | 0.0 [0.0, 0.0] |
| 11.2 at 12 months | 1 | | Mean Difference (IV, Fixed, 95% CI) | 0.0 [0.0, 0.0] |
| 12 Poor or unsatisfactory function at 1 year (Neer rating) Show forest plot | 1 | | Risk Ratio (M‐H, Fixed, 95% CI) | Totals not selected |
|
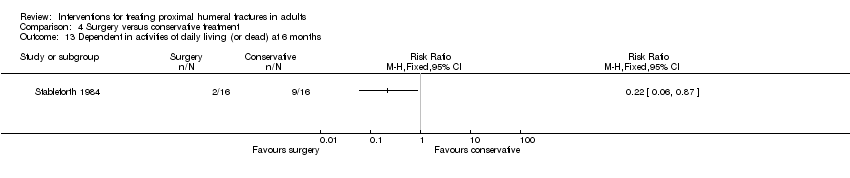
| 13 Dependent in activities of daily living (or dead) at 6 months Show forest plot | 1 | | Risk Ratio (M‐H, Fixed, 95% CI) | Totals not selected |
|
| 14 Pain at 2 years: VAS (0 to 100: worst pain) Show forest plot | 2 | 101 | Mean Difference (IV, Fixed, 95% CI) | ‐6.38 [‐14.18, 1.41] |
|
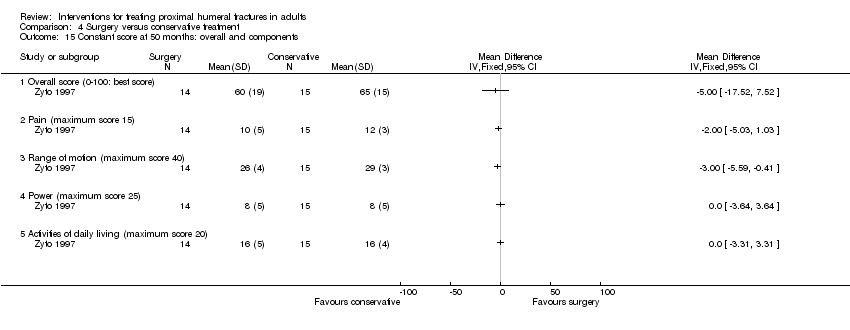
| 15 Constant score at 50 months: overall and components Show forest plot | 1 | | Mean Difference (IV, Fixed, 95% CI) | Totals not selected |
|
| 15.1 Overall score (0‐100: best score) | 1 | | Mean Difference (IV, Fixed, 95% CI) | 0.0 [0.0, 0.0] |
| 15.2 Pain (maximum score 15) | 1 | | Mean Difference (IV, Fixed, 95% CI) | 0.0 [0.0, 0.0] |
| 15.3 Range of motion (maximum score 40) | 1 | | Mean Difference (IV, Fixed, 95% CI) | 0.0 [0.0, 0.0] |
| 15.4 Power (maximum score 25) | 1 | | Mean Difference (IV, Fixed, 95% CI) | 0.0 [0.0, 0.0] |
| 15.5 Activities of daily living (maximum score 20) | 1 | | Mean Difference (IV, Fixed, 95% CI) | 0.0 [0.0, 0.0] |
| 16 Constant (often severe) pain at 6 months Show forest plot | 1 | | Risk Ratio (M‐H, Fixed, 95% CI) | Totals not selected |
|
| 17 Failure to recover 75% muscle power relative to other arm (survivors) at 6 months Show forest plot | 1 | | Risk Ratio (M‐H, Fixed, 95% CI) | Totals not selected |
|
| 17.1 Flexion | 1 | | Risk Ratio (M‐H, Fixed, 95% CI) | 0.0 [0.0, 0.0] |
| 17.2 Abduction | 1 | | Risk Ratio (M‐H, Fixed, 95% CI) | 0.0 [0.0, 0.0] |
| 17.3 Lateral rotation | 1 | | Risk Ratio (M‐H, Fixed, 95% CI) | 0.0 [0.0, 0.0] |
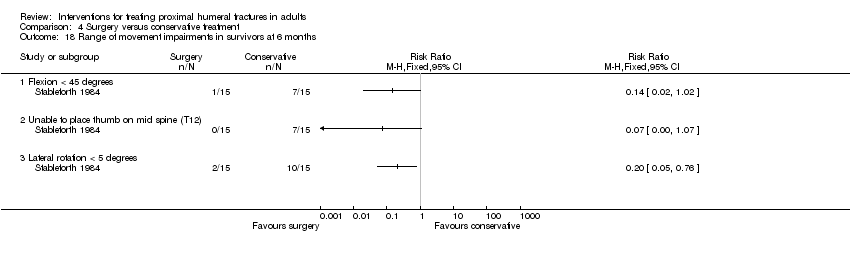
| 18 Range of movement impairments in survivors at 6 months Show forest plot | 1 | | Risk Ratio (M‐H, Fixed, 95% CI) | Totals not selected |
|
| 18.1 Flexion < 45 degrees | 1 | | Risk Ratio (M‐H, Fixed, 95% CI) | 0.0 [0.0, 0.0] |
| 18.2 Unable to place thumb on mid spine (T12) | 1 | | Risk Ratio (M‐H, Fixed, 95% CI) | 0.0 [0.0, 0.0] |
| 18.3 Lateral rotation < 5 degrees | 1 | | Risk Ratio (M‐H, Fixed, 95% CI) | 0.0 [0.0, 0.0] |
| 19 Costs at 1 year (Euros in 2005) Show forest plot | | | Other data | No numeric data |
|
| 20 Total costs including indirect costs (Euros) at 1 year Show forest plot | 1 | | Mean Difference (IV, Fixed, 95% CI) | Totals not selected |
|


![Comparison 6 Locking plate versus intramedullary nails (Zifko method), Outcome 1 Complications and [slight] malunion.](/es/cdsr/doi/10.1002/14651858.CD000434.pub3/media/CDSR/CD000434/rel0003/CD000434/image_n/nCD000434-CMP-006-01.png)