| 1 Life skills: 1. No important change in specific skills Show forest plot | 1 | | Risk Ratio (M‐H, Random, 95% CI) | Subtotals only |
|
| 1.1 household activity skills | 1 | 10 | Risk Ratio (M‐H, Random, 95% CI) | 0.24 [0.01, 4.72] |
| 1.2 kitchen skills | 1 | 10 | Risk Ratio (M‐H, Random, 95% CI) | 0.0 [0.0, 0.0] |
| 1.3 laundry skills | 1 | 10 | Risk Ratio (M‐H, Random, 95% CI) | 0.14 [0.01, 2.38] |
| 1.4 self‐care skills | 1 | 10 | Risk Ratio (M‐H, Random, 95% CI) | 1.0 [0.28, 3.54] |
| 2 Life skills: 2. Average score (Various scales, endpoint, high score = better) Show forest plot | 3 | | Mean Difference (IV, Random, 95% CI) | Subtotals only |
|
| 2.1 NOSIE ‐ at 12‐16 weeks | 2 | 205 | Mean Difference (IV, Random, 95% CI) | 16.77 [10.56, 22.99] |
| 2.2 UPSA ‐ at 24 weeks | 1 | 32 | Mean Difference (IV, Random, 95% CI) | ‐1.10 [‐7.82, 5.62] |
| 3 Leaving the study early Show forest plot | 5 | 345 | Risk Ratio (M‐H, Random, 95% CI) | 1.16 [0.40, 3.36] |
|
| 4 Mental state: 1b. Average endpoint score ‐ at 24 weeks (HAM‐D, skewed data) Show forest plot | | | Other data | No numeric data |
|
| 5 Mental state: 1a. Average endpoint scores (various scales, high score = worse) Show forest plot | 2 | | Mean Difference (IV, Random, 95% CI) | Subtotals only |
|
| 5.1 general pathology ‐ at 24 weeks (PANSS general psychopathology) | 1 | 32 | Mean Difference (IV, Random, 95% CI) | 0.0 [‐3.12, 3.12] |
| 5.2 positive syndrome ‐ at 24 weeks (PANSS positive) | 1 | 32 | Mean Difference (IV, Random, 95% CI) | ‐0.80 [‐4.38, 2.78] |
| 5.3 negative symptoms ‐ 12‐24 weeks (PANSS negative) | 1 | 32 | Mean Difference (IV, Random, 95% CI) | 1.90 [‐1.75, 5.55] |
| 5.4 negative symptoms ‐ 12‐24 weeks (SANS) | 1 | 120 | Mean Difference (IV, Random, 95% CI) | ‐15.82 [‐23.01, ‐8.63] |
| 6 Mental state: 2a. Average change scores ‐ depression (various scales, high score = poor) Show forest plot | 1 | | Mean Difference (IV, Random, 95% CI) | Subtotals only |
|
| 6.1 POMS (depression subscales) | 1 | 25 | Mean Difference (IV, Random, 95% CI) | ‐5.99 [‐15.96, 3.98] |
| 6.2 Zung | 1 | 25 | Mean Difference (IV, Random, 95% CI) | ‐7.17 [‐18.65, 4.31] |
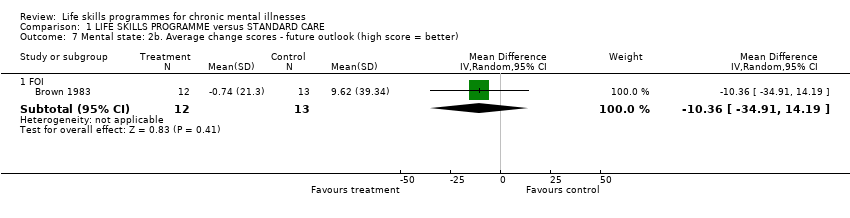
| 7 Mental state: 2b. Average change scores ‐ future outlook (high score = better) Show forest plot | 1 | | Mean Difference (IV, Random, 95% CI) | Subtotals only |
|
| 7.1 FOI | 1 | 25 | Mean Difference (IV, Random, 95% CI) | ‐10.36 [‐34.91, 14.19] |
| 8 General functioning: Average endpoint score ‐ at 6 weeks (SSPI, high score = worse) Show forest plot | 1 | 80 | Mean Difference (IV, Fixed, 95% CI) | ‐4.33 [‐5.23, ‐3.43] |
|
| 9 Quality of life: Average endpoint score ‐ at 24 weeks (QWB, high score = better) Show forest plot | 1 | 32 | Mean Difference (IV, Random, 95% CI) | ‐0.02 [‐0.07, 0.03] |
|