Administración de suplementos de ácidos grasos poliinsaturados de cadena larga para los recién nacidos a término
Información
- DOI:
- https://doi.org/10.1002/14651858.CD000376.pub4Copiar DOI

- Base de datos:
-
- Cochrane Database of Systematic Reviews
- Versión publicada:
-
- 10 marzo 2017see what's new
- Tipo:
-
- Intervention
- Etapa:
-
- Review
- Grupo Editorial Cochrane:
-
Grupo Cochrane de Neonatología
- Copyright:
-
- Copyright © 2017 The Cochrane Collaboration. Published by John Wiley & Sons, Ltd.
Cifras del artículo
Altmetric:
Citado por:
Autores
Contributions of authors
2016 review update:
-
BJ: literature search, assessment of eligibility, data extraction, assessment of risk of bias of included RCTs, writing and reviewing of the manuscript.
-
SR: literature search, assessment of eligibility, data extraction, assessment of risk of bias of included RCTs, entry of data into RevMan and data analysis, contact with study authors for additional information, reviewing of the manuscript.
-
SP: literature search, assessment of eligibility, verification of assessment of risk of bias of included RCTs, verification of data entered into RevMan by SR, reviewing of the manuscript.
-
KS: reviewing of the manuscript, overall supervision for update of the meta‐analysis.
2011 review update:
-
SR: literature search, assessment of eligibility and quality of studies, data extraction, entry of data into RevMan and data analysis, contact with study authors for additional information, writing of the manuscript.
-
SP: literature search, assessment of eligibility and quality of studies, verification of data entered into RevMan by SR, reviewing of the manuscript.
-
KS: assessment of eligibility of studies for inclusion, reviewing of the manuscript, guidance and supervision for update of the meta‐analysis.
2008 review update:
-
SR: literature search, assessment of eligibility and quality of studies, contact with authors of original trials, data extraction, entry of data into RevMan, writing of the manuscript.
-
SP: literature search, assessment of eligibility and quality of studies, verification of data entered into RevMan by SR, reviewing of the manuscript.
-
KS: referee author, checking and editing of the manuscript.
2001:
-
KS: literature search, assessment of eligibility and quality of studies, data extraction and data analysis, writing of the manuscript.
2000:
-
Original review: KS: design and preparation of protocol, literature search, assessment of eligibility and quality of studies, data extraction and data analysis, writing of the manuscript.
Sources of support
Internal sources
-
King Edward Memorial Hospital for Women, Perth, Australia.
-
Princess Margaret Hospital for Childern, Perth, Australia.
External sources
-
Eunice Kennedy Shriver National Institute of Child Health and Human Development, National Institutes of Health, Department of Health and Human Services, USA.
Editorial support of the Cochrane Neonatal Review Group has been funded with Federal funds from the Eunice Kennedy Shriver National Institute of Child Health and Human Development, National Institutes of Health, Department of Health and Human Services, USA, under Contract No. HHSN275201600005C
-
National Institute for Health Research, UK.
UK Editorial support for Cochrane Neonatal has been funded with funds from a UK National Institute of Health Research Grant (NIHR) Cochrane Programme Grant (13/89/12). The views expressed in this publication are those of the review authors and are not necessarily those of the NHS, the NIHR or the UK Department of Health
Declarations of interest
None.
Acknowledgements
Maria Makrides, Nancy Auestad, Xiaoming Ben, Eileen Birch, Susan Carlson, Carlo Agostoni, Geraint Morris, Mijna Hadders‐Algra, Dennis Hoffman, Alexandre Lapillone and Peter Willatts for clarifying existing data, clarifying methods and providing additional information from their studies.
Version history
| Published | Title | Stage | Authors | Version |
| 2017 Mar 10 | Long chain polyunsaturated fatty acid supplementation in infants born at term | Review | Bonny Jasani, Karen Simmer, Sanjay K Patole, Shripada C Rao | |
| 2011 Dec 07 | Longchain polyunsaturated fatty acid supplementation in infants born at term | Review | Karen Simmer, Sanjay K Patole, Shripada C Rao | |
| 2008 Jan 23 | Longchain polyunsaturated fatty acid supplementation in infants born at term | Review | Karen Simmer, Sanjay Patole, Shripada C Rao | |
| 2001 Oct 23 | Longchain polyunsaturated fatty acid supplementation in infants born at term | Review | Karen Simmer | |
Keywords
MeSH
Medical Subject Headings (MeSH) Keywords
- *Child Development;
- *Dietary Supplements;
- *Infant Nutritional Physiological Phenomena;
- Arachidonic Acid [administration & dosage];
- Body Weight;
- Cephalometry;
- Docosahexaenoic Acids [administration & dosage];
- Evoked Potentials, Visual;
- Fatty Acids, Unsaturated [*administration & dosage];
- Growth;
- Infant Formula [*chemistry];
- Randomized Controlled Trials as Topic;
- Term Birth;
- Visual Acuity [physiology];
Medical Subject Headings Check Words
Humans; Infant; Infant, Newborn;
PICO

Study flow diagram.

Risk of bias summary: review authors' judgements about each risk of bias item for each included study.
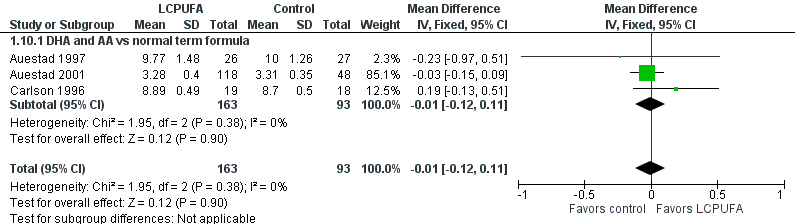
Forest plot of comparison: 1 LCPUFA supplemented vs control formula, outcome: 1.10 Visual acuity/Teller cards at 12 m (cycles/degree).
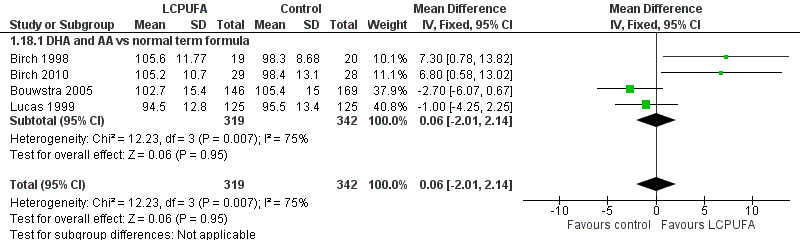
Forest plot of comparison: 1 LCPUFA supplemented vs control formula, outcome: 1.18 MDI (Bayley Scale score) at 18 m.

Forest plot of comparison: 1 LCPUFA supplemented vs control formula, outcome: 1.19 PDI (Bayley Scale score) at 18 m.
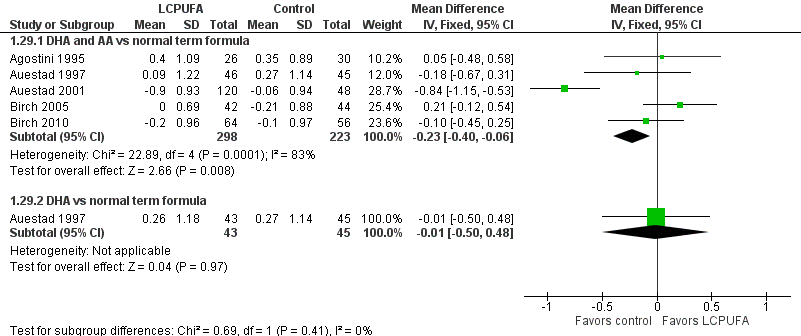
Forest plot of comparison: 1 LCPUFA supplemented vs control formula, outcome: 1.29 Weight at 12 m, z score.
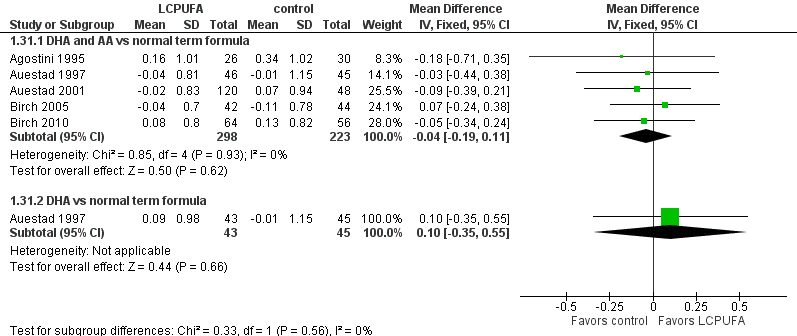
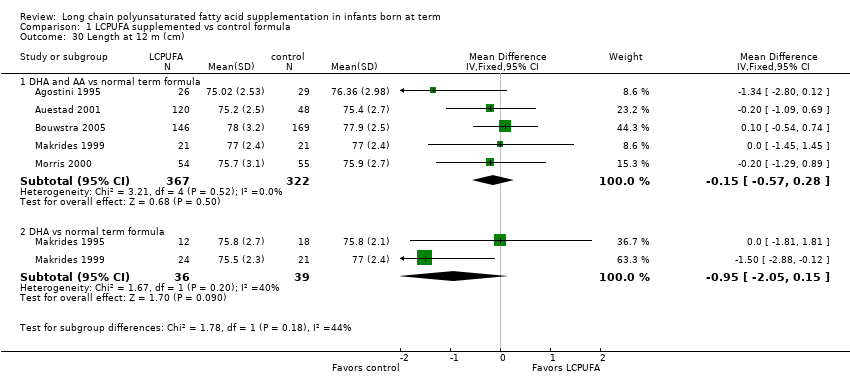
Forest plot of comparison: 1 LCPUFA supplemented vs control formula, outcome: 1.31 Length at 12 m, z score.

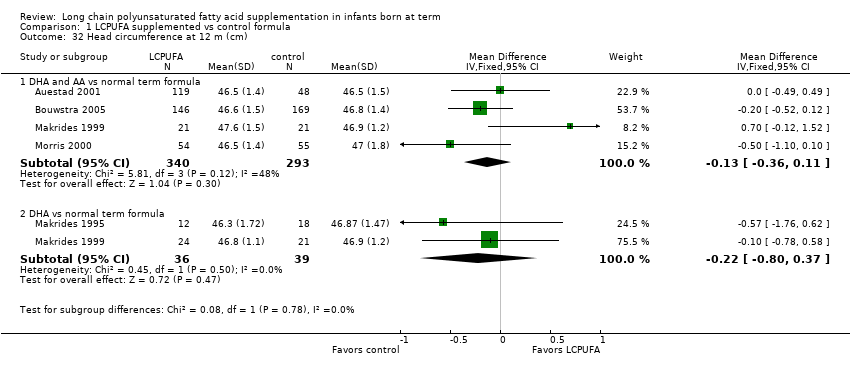
Forest plot of comparison: 1 LCPUFA supplemented vs control formula, outcome: 1.33 Head circumference at 12 m, z score.

Comparison 1 LCPUFA supplemented vs control formula, Outcome 1 VEP acuity at 4 m (logMAR, steady state).

Comparison 1 LCPUFA supplemented vs control formula, Outcome 2 Sweep VEP acuity at 4 m (logMAR).
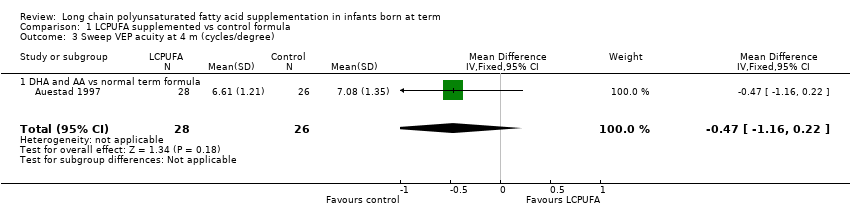
Comparison 1 LCPUFA supplemented vs control formula, Outcome 3 Sweep VEP acuity at 4 m (cycles/degree).

Comparison 1 LCPUFA supplemented vs control formula, Outcome 4 Visual acuity/Teller cards at 4 m (cycles/degree).

Comparison 1 LCPUFA supplemented vs control formula, Outcome 5 Sweep VEP acuity at 6 m (cycles/degree).
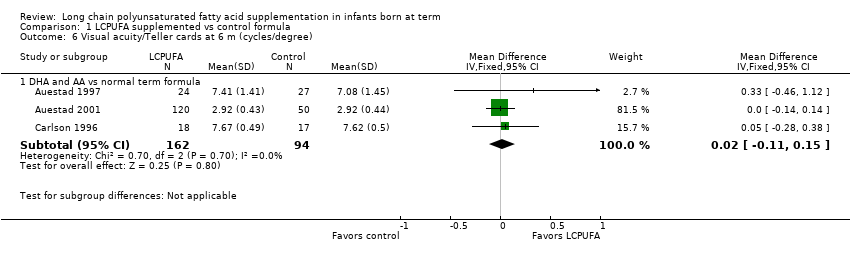
Comparison 1 LCPUFA supplemented vs control formula, Outcome 6 Visual acuity/Teller cards at 6 m (cycles/degree).

Comparison 1 LCPUFA supplemented vs control formula, Outcome 7 VEP acuity at 7‐8 m (logMAR, steady state).
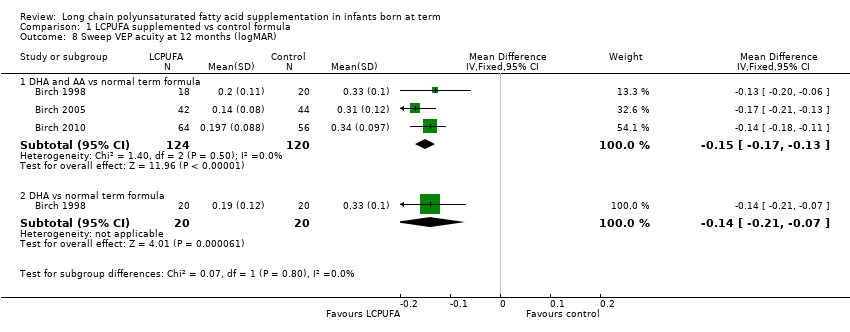
Comparison 1 LCPUFA supplemented vs control formula, Outcome 8 Sweep VEP acuity at 12 months (logMAR).

Comparison 1 LCPUFA supplemented vs control formula, Outcome 9 Sweep VEP acuity at 12 m (cycles/degree).
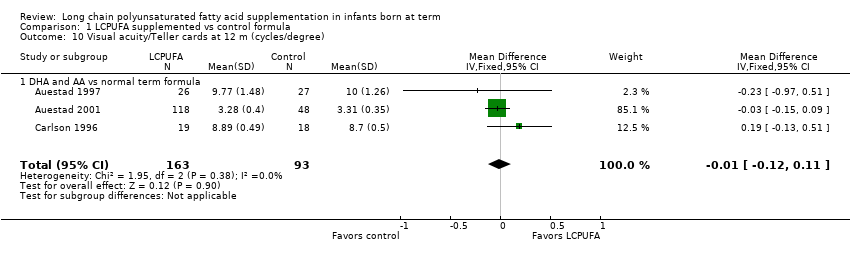
Comparison 1 LCPUFA supplemented vs control formula, Outcome 10 Visual acuity/Teller cards at 12 m (cycles/degree).
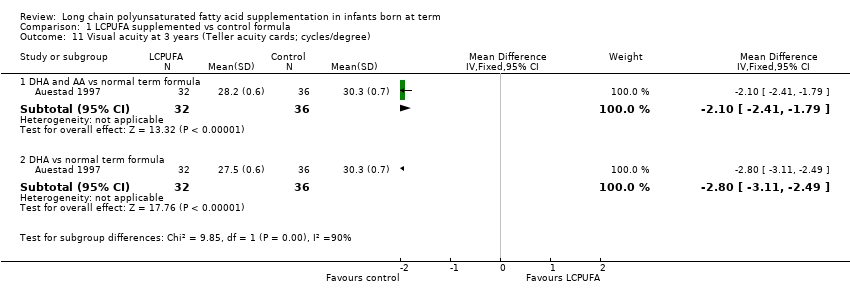
Comparison 1 LCPUFA supplemented vs control formula, Outcome 11 Visual acuity at 3 years (Teller acuity cards; cycles/degree).
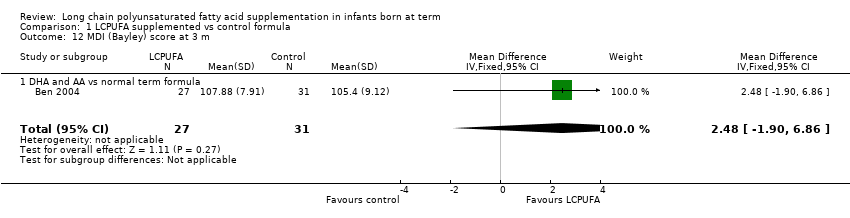
Comparison 1 LCPUFA supplemented vs control formula, Outcome 12 MDI (Bayley) score at 3 m.

Comparison 1 LCPUFA supplemented vs control formula, Outcome 13 PDI (Bayley) score at 3 m.

Comparison 1 LCPUFA supplemented vs control formula, Outcome 14 MDI (Bayley) score at 6 m.

Comparison 1 LCPUFA supplemented vs control formula, Outcome 15 PDI (Bayley) score at 6 m.

Comparison 1 LCPUFA supplemented vs control formula, Outcome 16 MDI (Bayley score) at 1 year.

Comparison 1 LCPUFA supplemented vs control formula, Outcome 17 PDI (Bayley score) at 1 year.
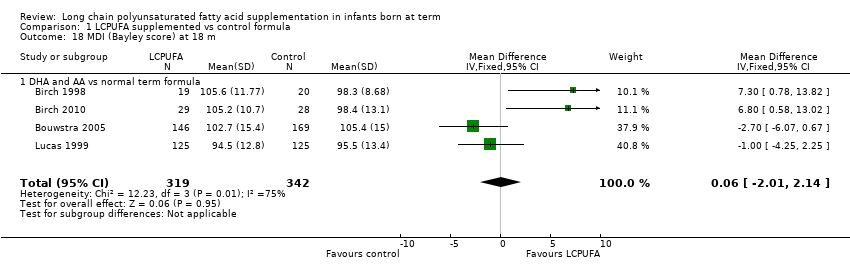
Comparison 1 LCPUFA supplemented vs control formula, Outcome 18 MDI (Bayley score) at 18 m.

Comparison 1 LCPUFA supplemented vs control formula, Outcome 19 PDI (Bayley score) at 18 m.
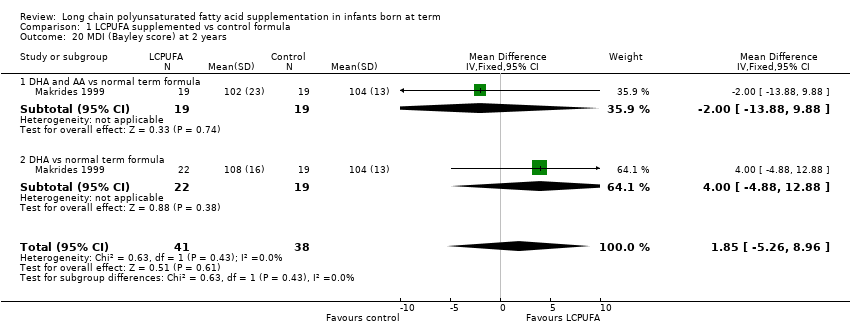
Comparison 1 LCPUFA supplemented vs control formula, Outcome 20 MDI (Bayley score) at 2 years.

Comparison 1 LCPUFA supplemented vs control formula, Outcome 21 PDI (Bayley score) at 2 years.
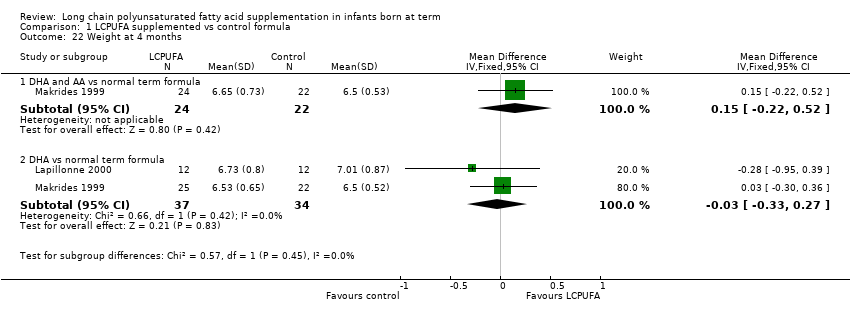
Comparison 1 LCPUFA supplemented vs control formula, Outcome 22 Weight at 4 months.

Comparison 1 LCPUFA supplemented vs control formula, Outcome 23 Length at 4 months.
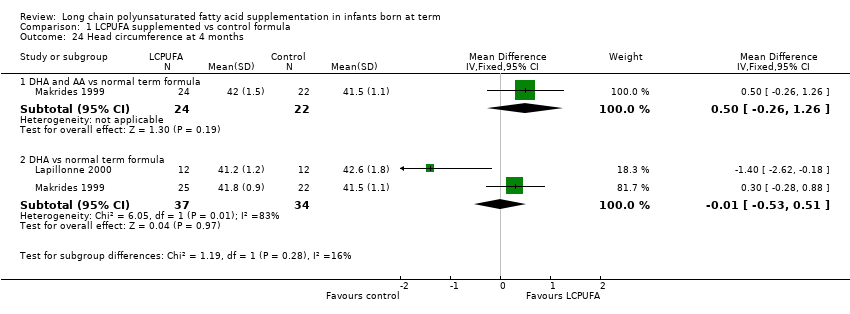
Comparison 1 LCPUFA supplemented vs control formula, Outcome 24 Head circumference at 4 months.
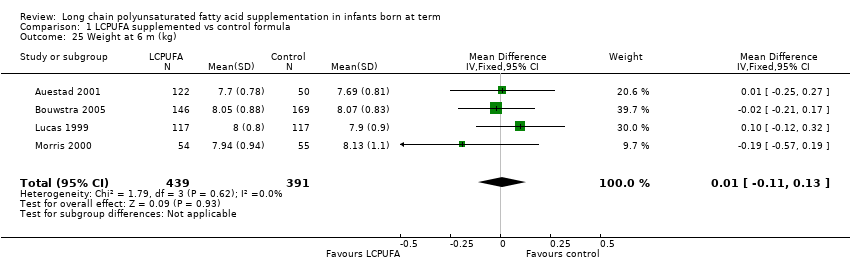
Comparison 1 LCPUFA supplemented vs control formula, Outcome 25 Weight at 6 m (kg).

Comparison 1 LCPUFA supplemented vs control formula, Outcome 26 Length at 6 m (cm).

Comparison 1 LCPUFA supplemented vs control formula, Outcome 27 Head circumference at 6 m (cm).
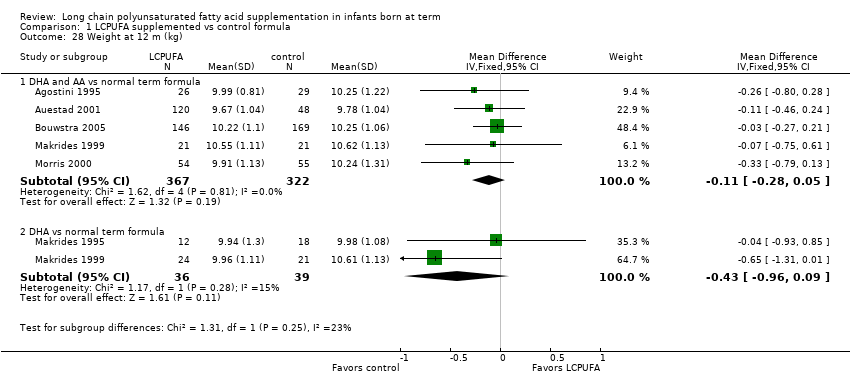
Comparison 1 LCPUFA supplemented vs control formula, Outcome 28 Weight at 12 m (kg).
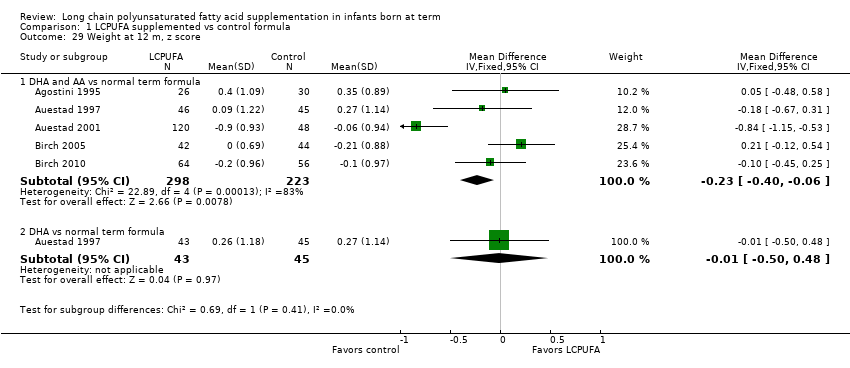
Comparison 1 LCPUFA supplemented vs control formula, Outcome 29 Weight at 12 m, z score.
Comparison 1 LCPUFA supplemented vs control formula, Outcome 30 Length at 12 m (cm).

Comparison 1 LCPUFA supplemented vs control formula, Outcome 31 Length at 12 m, z score.
Comparison 1 LCPUFA supplemented vs control formula, Outcome 32 Head circumference at 12 m (cm).

Comparison 1 LCPUFA supplemented vs control formula, Outcome 33 Head circumference at 12 m, z score.

Comparison 1 LCPUFA supplemented vs control formula, Outcome 34 Weight at 18 m (kg).

Comparison 1 LCPUFA supplemented vs control formula, Outcome 35 Length at 18 m (cm).
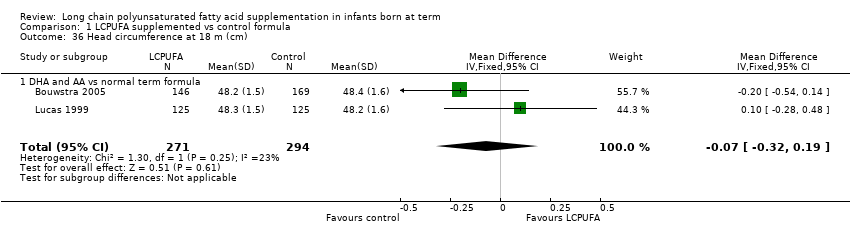
Comparison 1 LCPUFA supplemented vs control formula, Outcome 36 Head circumference at 18 m (cm).
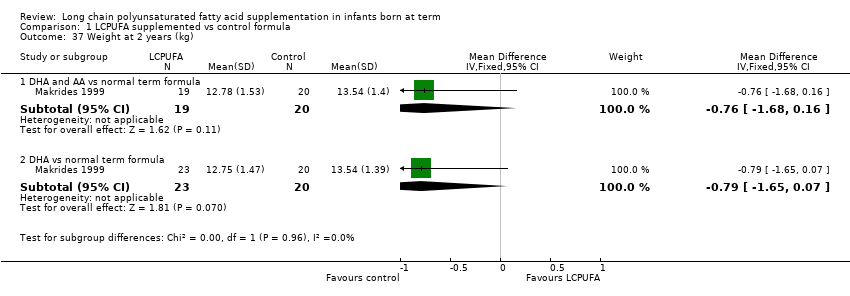
Comparison 1 LCPUFA supplemented vs control formula, Outcome 37 Weight at 2 years (kg).
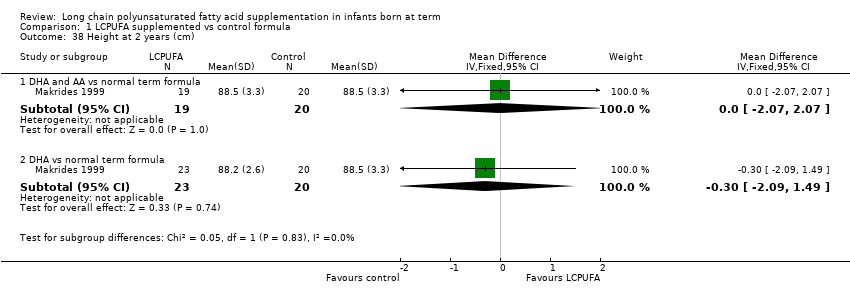
Comparison 1 LCPUFA supplemented vs control formula, Outcome 38 Height at 2 years (cm).
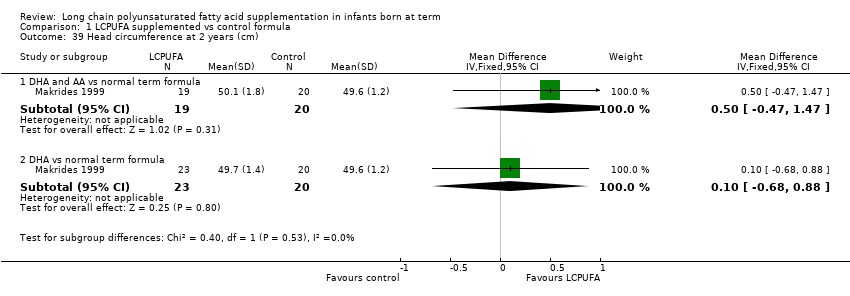
Comparison 1 LCPUFA supplemented vs control formula, Outcome 39 Head circumference at 2 years (cm).
| LCPUFA supplemented formula compared with control formula for term infants for clinical outcomes (visual function, neurodevelopment and physical growth) | ||||||
| Patient or population: term infants | ||||||
| Outcomes | Illustrative comparative risks* (95% CI) | Relative effect | Number of participants | Quality of the evidence | Comments | |
| Assumed risk | Corresponding risk | |||||
| Control formula | LCPUFA supplemented formula | |||||
| Visual acuity/Teller cards at 12 months (cycles/degree) ‐ DHA and AA vs normal term formula | Mean visual acuity (cycles/degree) ranged across control groups from 3.31 to 10 | Mean visual acuity (cycles/degree) ranged across intervention groups from 3.28 to 9.77 | MD ‐0.01 (95% CI ‐0.12 to 0.11) | 256 | ⊕⊕⊝⊝ | Downgraded 2 levels |
| Sweep VEP acuity at 12 months (LogMAR) ‐ DHA and AA vs normal term formula | Mean sweep VEP acuity (LogMAR) ranged across control groups from 0.31 to 0.339 | Mean sweep VEP acuity (LogMAR) ranged across intervention groups from 0.14 to 0.2 | MD ‐0.15 (95% CI ‐0.17 to ‐0.13) | 244 | ⊕⊕⊝⊝ | Downgraded 2 levels |
| MDI scores (Bayley) at 18 months ‐ DHA and AA vs normal term formula | Mean MDI ranged across control groups from 98.3 to 105.4 | Mean MDI ranged across intervention groups from 94.5 to 105.6 | MD 0.06 (95% CI ‐ 2.01 to 2.14) | 661 | ⊕⊕⊝⊝ | Downgraded 2 levels |
| PDI scores (Bayley) at 18 months ‐ DHA and AA vs normal term formula | Mean PDI ranged across control groups from 96.4 to 102 | Mean PDI ranged across intervention groups from 95.9 to 105.8 | MD 0.69 (95% CI ‐0.78 to 2.16) | 661 | ⊕⊕⊝⊝ | Downgraded 2 levels |
| Weight at 12 months (z scores) ‐ DHA and AA vs normal term formula | Mean z scores for weight ranged across control groups from ‐0.21 to 0.35 | Mean z scores for weight ranged across intervention groups from ‐0.9 to 0.4 | MD ‐0.23 (95% CI ‐0.40 to ‐0.06) | 521 | ⊕⊕⊝⊝ | Downgraded 2 levels |
| Length at 12 months (z scores) ‐ DHA and AA vs normal term formula | Mean z scores for length ranged across control groups from ‐0.11 to 0.34 | Mean z scores for length ranged across control groups from ‐0.04 to 0.16 | MD ‐0.04 (95% CI ‐0.19 to 0.11) | 521 | ⊕⊕⊝⊝ | Downgraded 2 levels |
| Head circumference at 12 months (z scores) ‐ DHA and AA vs normal term formula | Mean z scores for head circumference ranged across control groups from 0.18 to 0.94 | Mean z scores for head circumference ranged across control groups from 0.01 to 0.93 | MD ‐0.13 (95% CI ‐0.32 to 0.05) | 464 | ⊕⊕⊝⊝ | Downgraded 2 levels |
| *The basis for the assumed risk (e.g. median control group risk across studies) is provided in footnotes. The corresponding risk (and its 95% confidence interval) is based on assumed risk in the comparison group and the relative effect of the intervention (and its 95% CI) | ||||||
| GRADE Working Group grades of evidence | ||||||
| Outcome or subgroup title | No. of studies | No. of participants | Statistical method | Effect size |
| 1 VEP acuity at 4 m (logMAR, steady state) Show forest plot | 2 | Mean Difference (IV, Fixed, 95% CI) | Subtotals only | |
| 1.1 DHA and AA vs normal term formula | 1 | 30 | Mean Difference (IV, Fixed, 95% CI) | 0.01 [‐0.07, 0.09] |
| 1.2 DHA vs normal term formula | 2 | 60 | Mean Difference (IV, Fixed, 95% CI) | ‐0.03 [‐0.10, 0.03] |
| 2 Sweep VEP acuity at 4 m (logMAR) Show forest plot | 3 | Mean Difference (IV, Fixed, 95% CI) | Subtotals only | |
| 2.1 DHA and AA vs normal term formula | 3 | 266 | Mean Difference (IV, Fixed, 95% CI) | ‐0.08 [‐0.10, ‐0.05] |
| 2.2 DHA vs normal term formula | 1 | 41 | Mean Difference (IV, Fixed, 95% CI) | ‐0.08 [‐0.15, ‐0.01] |
| 3 Sweep VEP acuity at 4 m (cycles/degree) Show forest plot | 1 | 54 | Mean Difference (IV, Fixed, 95% CI) | ‐0.47 [‐1.16, 0.22] |
| 3.1 DHA and AA vs normal term formula | 1 | 54 | Mean Difference (IV, Fixed, 95% CI) | ‐0.47 [‐1.16, 0.22] |
| 4 Visual acuity/Teller cards at 4 m (cycles/degree) Show forest plot | 3 | 264 | Mean Difference (IV, Fixed, 95% CI) | ‐0.11 [‐0.24, 0.02] |
| 4.1 DHA and AA vs normal term formula | 3 | 264 | Mean Difference (IV, Fixed, 95% CI) | ‐0.11 [‐0.24, 0.02] |
| 5 Sweep VEP acuity at 6 m (cycles/degree) Show forest plot | 1 | 53 | Mean Difference (IV, Fixed, 95% CI) | ‐0.31 [‐1.04, 0.42] |
| 5.1 DHA and AA vs normal term formula | 1 | 53 | Mean Difference (IV, Fixed, 95% CI) | ‐0.31 [‐1.04, 0.42] |
| 6 Visual acuity/Teller cards at 6 m (cycles/degree) Show forest plot | 3 | Mean Difference (IV, Fixed, 95% CI) | Subtotals only | |
| 6.1 DHA and AA vs normal term formula | 3 | 256 | Mean Difference (IV, Fixed, 95% CI) | 0.02 [‐0.11, 0.15] |
| 7 VEP acuity at 7‐8 m (logMAR, steady state) Show forest plot | 2 | Mean Difference (IV, Fixed, 95% CI) | Subtotals only | |
| 7.1 DHA and AA vs normal term formula | 1 | 30 | Mean Difference (IV, Fixed, 95% CI) | 0.0 [‐0.13, 0.13] |
| 7.2 DHA vs normal term formula | 2 | 52 | Mean Difference (IV, Fixed, 95% CI) | ‐0.02 [‐0.14, 0.10] |
| 8 Sweep VEP acuity at 12 months (logMAR) Show forest plot | 3 | Mean Difference (IV, Fixed, 95% CI) | Subtotals only | |
| 8.1 DHA and AA vs normal term formula | 3 | 244 | Mean Difference (IV, Fixed, 95% CI) | ‐0.15 [‐0.17, ‐0.13] |
| 8.2 DHA vs normal term formula | 1 | 40 | Mean Difference (IV, Fixed, 95% CI) | ‐0.14 [‐0.21, ‐0.07] |
| 9 Sweep VEP acuity at 12 m (cycles/degree) Show forest plot | 1 | 53 | Mean Difference (IV, Fixed, 95% CI) | 0.0 [‐0.71, 0.71] |
| 9.1 DHA and AA vs normal term formula | 1 | 53 | Mean Difference (IV, Fixed, 95% CI) | 0.0 [‐0.71, 0.71] |
| 10 Visual acuity/Teller cards at 12 m (cycles/degree) Show forest plot | 3 | 256 | Mean Difference (IV, Fixed, 95% CI) | ‐0.01 [‐0.12, 0.11] |
| 10.1 DHA and AA vs normal term formula | 3 | 256 | Mean Difference (IV, Fixed, 95% CI) | ‐0.01 [‐0.12, 0.11] |
| 11 Visual acuity at 3 years (Teller acuity cards; cycles/degree) Show forest plot | 1 | Mean Difference (IV, Fixed, 95% CI) | Subtotals only | |
| 11.1 DHA and AA vs normal term formula | 1 | 68 | Mean Difference (IV, Fixed, 95% CI) | ‐2.10 [‐2.41, ‐1.79] |
| 11.2 DHA vs normal term formula | 1 | 68 | Mean Difference (IV, Fixed, 95% CI) | ‐2.80 [‐3.11, ‐2.49] |
| 12 MDI (Bayley) score at 3 m Show forest plot | 1 | 58 | Mean Difference (IV, Fixed, 95% CI) | 2.48 [‐1.90, 6.86] |
| 12.1 DHA and AA vs normal term formula | 1 | 58 | Mean Difference (IV, Fixed, 95% CI) | 2.48 [‐1.90, 6.86] |
| 13 PDI (Bayley) score at 3 m Show forest plot | 1 | 58 | Mean Difference (IV, Fixed, 95% CI) | 3.66 [0.43, 6.89] |
| 13.1 DHA and AA vs normal term formula | 1 | 58 | Mean Difference (IV, Fixed, 95% CI) | 3.66 [0.43, 6.89] |
| 14 MDI (Bayley) score at 6 m Show forest plot | 2 | 207 | Mean Difference (IV, Fixed, 95% CI) | ‐0.59 [‐2.26, 1.07] |
| 14.1 DHA and AA vs normal term formula | 2 | 207 | Mean Difference (IV, Fixed, 95% CI) | ‐0.59 [‐2.26, 1.07] |
| 15 PDI (Bayley) score at 6 m Show forest plot | 2 | 206 | Mean Difference (IV, Fixed, 95% CI) | 0.23 [‐2.47, 2.94] |
| 15.1 DHA and AA vs normal term formula | 2 | 206 | Mean Difference (IV, Fixed, 95% CI) | 0.23 [‐2.47, 2.94] |
| 16 MDI (Bayley score) at 1 year Show forest plot | 4 | Mean Difference (IV, Fixed, 95% CI) | Subtotals only | |
| 16.1 DHA and AA vs normal term formula | 3 | 298 | Mean Difference (IV, Fixed, 95% CI) | ‐0.95 [‐3.38, 1.49] |
| 16.2 DHA vs normal term formula | 3 | 160 | Mean Difference (IV, Fixed, 95% CI) | ‐0.27 [‐4.36, 3.83] |
| 17 PDI (Bayley score) at 1 year Show forest plot | 4 | Mean Difference (IV, Fixed, 95% CI) | Subtotals only | |
| 17.1 DHA and AA vs normal term formula | 3 | 298 | Mean Difference (IV, Fixed, 95% CI) | ‐2.48 [‐5.83, 0.86] |
| 17.2 DHA vs normal term formula | 3 | 160 | Mean Difference (IV, Fixed, 95% CI) | ‐1.70 [‐6.62, 3.22] |
| 18 MDI (Bayley score) at 18 m Show forest plot | 4 | 661 | Mean Difference (IV, Fixed, 95% CI) | 0.06 [‐2.01, 2.14] |
| 18.1 DHA and AA vs normal term formula | 4 | 661 | Mean Difference (IV, Fixed, 95% CI) | 0.06 [‐2.01, 2.14] |
| 19 PDI (Bayley score) at 18 m Show forest plot | 4 | 661 | Mean Difference (IV, Fixed, 95% CI) | 0.69 [‐0.78, 2.16] |
| 19.1 DHA and AA vs normal term formula | 4 | 661 | Mean Difference (IV, Fixed, 95% CI) | 0.69 [‐0.78, 2.16] |
| 20 MDI (Bayley score) at 2 years Show forest plot | 1 | 79 | Mean Difference (IV, Fixed, 95% CI) | 1.85 [‐5.26, 8.96] |
| 20.1 DHA and AA vs normal term formula | 1 | 38 | Mean Difference (IV, Fixed, 95% CI) | ‐2.0 [‐13.88, 9.88] |
| 20.2 DHA vs normal term formula | 1 | 41 | Mean Difference (IV, Fixed, 95% CI) | 4.0 [‐4.88, 12.88] |
| 21 PDI (Bayley score) at 2 years Show forest plot | 1 | Mean Difference (IV, Fixed, 95% CI) | Subtotals only | |
| 21.1 DHA and AA vs normal term formula | 1 | 37 | Mean Difference (IV, Fixed, 95% CI) | ‐1.0 [‐12.71, 10.71] |
| 21.2 DHA vs normal term formula | 1 | 37 | Mean Difference (IV, Fixed, 95% CI) | 7.00 [‐3.32, 17.32] |
| 22 Weight at 4 months Show forest plot | 2 | Mean Difference (IV, Fixed, 95% CI) | Subtotals only | |
| 22.1 DHA and AA vs normal term formula | 1 | 46 | Mean Difference (IV, Fixed, 95% CI) | 0.15 [‐0.22, 0.52] |
| 22.2 DHA vs normal term formula | 2 | 71 | Mean Difference (IV, Fixed, 95% CI) | ‐0.03 [‐0.33, 0.27] |
| 23 Length at 4 months Show forest plot | 2 | Mean Difference (IV, Fixed, 95% CI) | Subtotals only | |
| 23.1 DHA and AA vs normal term formula | 1 | 46 | Mean Difference (IV, Fixed, 95% CI) | 0.0 [‐1.45, 1.45] |
| 23.2 DHA vs normal term formula | 2 | 71 | Mean Difference (IV, Fixed, 95% CI) | 0.03 [1.00, 1.06] |
| 24 Head circumference at 4 months Show forest plot | 2 | Mean Difference (IV, Fixed, 95% CI) | Subtotals only | |
| 24.1 DHA and AA vs normal term formula | 1 | 46 | Mean Difference (IV, Fixed, 95% CI) | 0.5 [‐0.26, 1.26] |
| 24.2 DHA vs normal term formula | 2 | 71 | Mean Difference (IV, Fixed, 95% CI) | ‐0.01 [‐0.53, 0.51] |
| 25 Weight at 6 m (kg) Show forest plot | 4 | 830 | Mean Difference (IV, Fixed, 95% CI) | 0.01 [‐0.11, 0.13] |
| 26 Length at 6 m (cm) Show forest plot | 4 | 830 | Mean Difference (IV, Fixed, 95% CI) | ‐0.13 [‐0.47, 0.21] |
| 27 Head circumference at 6 m (cm) Show forest plot | 4 | 830 | Mean Difference (IV, Fixed, 95% CI) | ‐0.06 [‐0.25, 0.13] |
| 28 Weight at 12 m (kg) Show forest plot | 6 | Mean Difference (IV, Fixed, 95% CI) | Subtotals only | |
| 28.1 DHA and AA vs normal term formula | 5 | 689 | Mean Difference (IV, Fixed, 95% CI) | ‐0.11 [‐0.28, 0.05] |
| 28.2 DHA vs normal term formula | 2 | 75 | Mean Difference (IV, Fixed, 95% CI) | ‐0.43 [‐0.96, 0.09] |
| 29 Weight at 12 m, z score Show forest plot | 5 | Mean Difference (IV, Fixed, 95% CI) | Subtotals only | |
| 29.1 DHA and AA vs normal term formula | 5 | 521 | Mean Difference (IV, Fixed, 95% CI) | ‐0.23 [‐0.40, ‐0.06] |
| 29.2 DHA vs normal term formula | 1 | 88 | Mean Difference (IV, Fixed, 95% CI) | ‐0.01 [‐0.50, 0.48] |
| 30 Length at 12 m (cm) Show forest plot | 6 | Mean Difference (IV, Fixed, 95% CI) | Subtotals only | |
| 30.1 DHA and AA vs normal term formula | 5 | 689 | Mean Difference (IV, Fixed, 95% CI) | ‐0.15 [‐0.57, 0.28] |
| 30.2 DHA vs normal term formula | 2 | 75 | Mean Difference (IV, Fixed, 95% CI) | ‐0.95 [‐2.05, 0.15] |
| 31 Length at 12 m, z score Show forest plot | 5 | Mean Difference (IV, Fixed, 95% CI) | Subtotals only | |
| 31.1 DHA and AA vs normal term formula | 5 | 521 | Mean Difference (IV, Fixed, 95% CI) | ‐0.04 [‐0.19, 0.11] |
| 31.2 DHA vs normal term formula | 1 | 88 | Mean Difference (IV, Fixed, 95% CI) | 0.10 [‐0.35, 0.55] |
| 32 Head circumference at 12 m (cm) Show forest plot | 5 | Mean Difference (IV, Fixed, 95% CI) | Subtotals only | |
| 32.1 DHA and AA vs normal term formula | 4 | 633 | Mean Difference (IV, Fixed, 95% CI) | ‐0.13 [‐0.36, 0.11] |
| 32.2 DHA vs normal term formula | 2 | 75 | Mean Difference (IV, Fixed, 95% CI) | ‐0.22 [‐0.80, 0.37] |
| 33 Head circumference at 12 m, z score Show forest plot | 4 | Mean Difference (IV, Fixed, 95% CI) | Subtotals only | |
| 33.1 DHA and AA vs normal term formula | 4 | 464 | Mean Difference (IV, Fixed, 95% CI) | ‐0.13 [‐0.32, 0.05] |
| 33.2 DHA vs normal term formula | 1 | 88 | Mean Difference (IV, Fixed, 95% CI) | 0.07 [‐0.33, 0.47] |
| 34 Weight at 18 m (kg) Show forest plot | 2 | 563 | Mean Difference (IV, Fixed, 95% CI) | ‐0.04 [‐0.25, 0.17] |
| 34.1 DHA and AA vs normal term formula | 2 | 563 | Mean Difference (IV, Fixed, 95% CI) | ‐0.04 [‐0.25, 0.17] |
| 35 Length at 18 m (cm) Show forest plot | 2 | 565 | Mean Difference (IV, Fixed, 95% CI) | ‐0.19 [‐0.71, 0.34] |
| 35.1 DHA and AA vs normal term formula | 2 | 565 | Mean Difference (IV, Fixed, 95% CI) | ‐0.19 [‐0.71, 0.34] |
| 36 Head circumference at 18 m (cm) Show forest plot | 2 | 565 | Mean Difference (IV, Fixed, 95% CI) | ‐0.07 [‐0.32, 0.19] |
| 36.1 DHA and AA vs normal term formula | 2 | 565 | Mean Difference (IV, Fixed, 95% CI) | ‐0.07 [‐0.32, 0.19] |
| 37 Weight at 2 years (kg) Show forest plot | 1 | Mean Difference (IV, Fixed, 95% CI) | Subtotals only | |
| 37.1 DHA and AA vs normal term formula | 1 | 39 | Mean Difference (IV, Fixed, 95% CI) | ‐0.76 [‐1.68, 0.16] |
| 37.2 DHA vs normal term formula | 1 | 43 | Mean Difference (IV, Fixed, 95% CI) | ‐0.79 [‐1.65, 0.07] |
| 38 Height at 2 years (cm) Show forest plot | 1 | Mean Difference (IV, Fixed, 95% CI) | Subtotals only | |
| 38.1 DHA and AA vs normal term formula | 1 | 39 | Mean Difference (IV, Fixed, 95% CI) | 0.0 [‐2.07, 2.07] |
| 38.2 DHA vs normal term formula | 1 | 43 | Mean Difference (IV, Fixed, 95% CI) | ‐0.30 [‐2.09, 1.49] |
| 39 Head circumference at 2 years (cm) Show forest plot | 1 | Mean Difference (IV, Fixed, 95% CI) | Subtotals only | |
| 39.1 DHA and AA vs normal term formula | 1 | 39 | Mean Difference (IV, Fixed, 95% CI) | 0.5 [‐0.47, 1.47] |
| 39.2 DHA vs normal term formula | 1 | 43 | Mean Difference (IV, Fixed, 95% CI) | 0.10 [‐0.68, 0.88] |