| 1 VEP acuity at 4 m (logMAR, steady state) Show forest plot | 2 | | Mean Difference (IV, Fixed, 95% CI) | Subtotals only |
|
| 1.1 DHA and AA vs normal term formula | 1 | 30 | Mean Difference (IV, Fixed, 95% CI) | 0.01 [‐0.07, 0.09] |
| 1.2 DHA vs normal term formula | 2 | 60 | Mean Difference (IV, Fixed, 95% CI) | ‐0.03 [‐0.10, 0.03] |
| 2 Sweep VEP acuity at 4 m (logMAR) Show forest plot | 3 | | Mean Difference (IV, Fixed, 95% CI) | Subtotals only |
|
| 2.1 DHA and AA vs normal term formula | 3 | 266 | Mean Difference (IV, Fixed, 95% CI) | ‐0.08 [‐0.10, ‐0.05] |
| 2.2 DHA vs normal term formula | 1 | 41 | Mean Difference (IV, Fixed, 95% CI) | ‐0.08 [‐0.15, ‐0.01] |
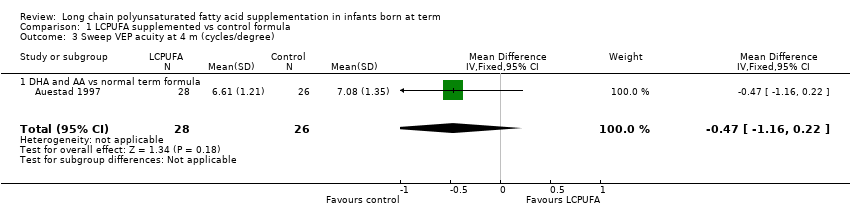
| 3 Sweep VEP acuity at 4 m (cycles/degree) Show forest plot | 1 | 54 | Mean Difference (IV, Fixed, 95% CI) | ‐0.47 [‐1.16, 0.22] |
|
| 3.1 DHA and AA vs normal term formula | 1 | 54 | Mean Difference (IV, Fixed, 95% CI) | ‐0.47 [‐1.16, 0.22] |
| 4 Visual acuity/Teller cards at 4 m (cycles/degree) Show forest plot | 3 | 264 | Mean Difference (IV, Fixed, 95% CI) | ‐0.11 [‐0.24, 0.02] |
|
| 4.1 DHA and AA vs normal term formula | 3 | 264 | Mean Difference (IV, Fixed, 95% CI) | ‐0.11 [‐0.24, 0.02] |
| 5 Sweep VEP acuity at 6 m (cycles/degree) Show forest plot | 1 | 53 | Mean Difference (IV, Fixed, 95% CI) | ‐0.31 [‐1.04, 0.42] |
|
| 5.1 DHA and AA vs normal term formula | 1 | 53 | Mean Difference (IV, Fixed, 95% CI) | ‐0.31 [‐1.04, 0.42] |
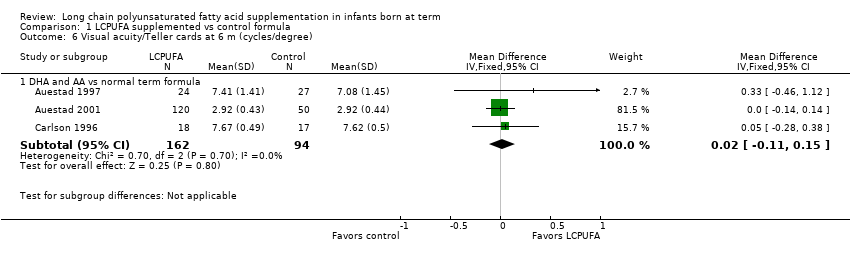
| 6 Visual acuity/Teller cards at 6 m (cycles/degree) Show forest plot | 3 | | Mean Difference (IV, Fixed, 95% CI) | Subtotals only |
|
| 6.1 DHA and AA vs normal term formula | 3 | 256 | Mean Difference (IV, Fixed, 95% CI) | 0.02 [‐0.11, 0.15] |
| 7 VEP acuity at 7‐8 m (logMAR, steady state) Show forest plot | 2 | | Mean Difference (IV, Fixed, 95% CI) | Subtotals only |
|
| 7.1 DHA and AA vs normal term formula | 1 | 30 | Mean Difference (IV, Fixed, 95% CI) | 0.0 [‐0.13, 0.13] |
| 7.2 DHA vs normal term formula | 2 | 52 | Mean Difference (IV, Fixed, 95% CI) | ‐0.02 [‐0.14, 0.10] |
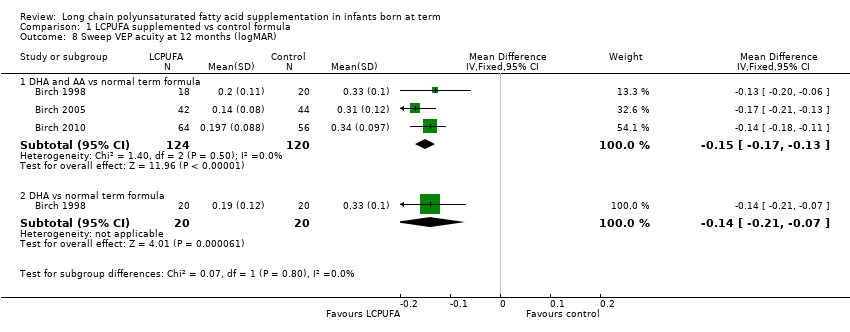
| 8 Sweep VEP acuity at 12 months (logMAR) Show forest plot | 3 | | Mean Difference (IV, Fixed, 95% CI) | Subtotals only |
|
| 8.1 DHA and AA vs normal term formula | 3 | 244 | Mean Difference (IV, Fixed, 95% CI) | ‐0.15 [‐0.17, ‐0.13] |
| 8.2 DHA vs normal term formula | 1 | 40 | Mean Difference (IV, Fixed, 95% CI) | ‐0.14 [‐0.21, ‐0.07] |
| 9 Sweep VEP acuity at 12 m (cycles/degree) Show forest plot | 1 | 53 | Mean Difference (IV, Fixed, 95% CI) | 0.0 [‐0.71, 0.71] |
|
| 9.1 DHA and AA vs normal term formula | 1 | 53 | Mean Difference (IV, Fixed, 95% CI) | 0.0 [‐0.71, 0.71] |
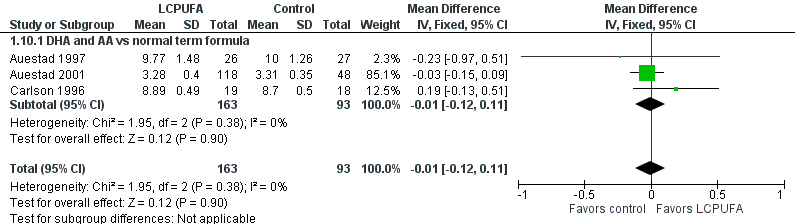
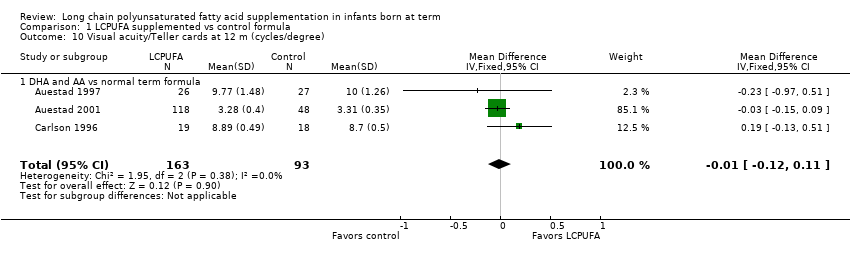
| 10 Visual acuity/Teller cards at 12 m (cycles/degree) Show forest plot | 3 | 256 | Mean Difference (IV, Fixed, 95% CI) | ‐0.01 [‐0.12, 0.11] |
|
| 10.1 DHA and AA vs normal term formula | 3 | 256 | Mean Difference (IV, Fixed, 95% CI) | ‐0.01 [‐0.12, 0.11] |
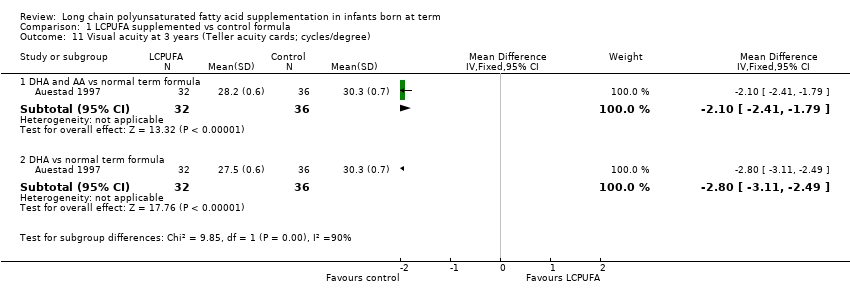
| 11 Visual acuity at 3 years (Teller acuity cards; cycles/degree) Show forest plot | 1 | | Mean Difference (IV, Fixed, 95% CI) | Subtotals only |
|
| 11.1 DHA and AA vs normal term formula | 1 | 68 | Mean Difference (IV, Fixed, 95% CI) | ‐2.10 [‐2.41, ‐1.79] |
| 11.2 DHA vs normal term formula | 1 | 68 | Mean Difference (IV, Fixed, 95% CI) | ‐2.80 [‐3.11, ‐2.49] |
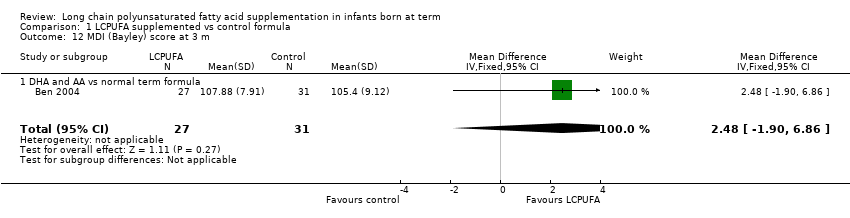
| 12 MDI (Bayley) score at 3 m Show forest plot | 1 | 58 | Mean Difference (IV, Fixed, 95% CI) | 2.48 [‐1.90, 6.86] |
|
| 12.1 DHA and AA vs normal term formula | 1 | 58 | Mean Difference (IV, Fixed, 95% CI) | 2.48 [‐1.90, 6.86] |
| 13 PDI (Bayley) score at 3 m Show forest plot | 1 | 58 | Mean Difference (IV, Fixed, 95% CI) | 3.66 [0.43, 6.89] |
|
| 13.1 DHA and AA vs normal term formula | 1 | 58 | Mean Difference (IV, Fixed, 95% CI) | 3.66 [0.43, 6.89] |
| 14 MDI (Bayley) score at 6 m Show forest plot | 2 | 207 | Mean Difference (IV, Fixed, 95% CI) | ‐0.59 [‐2.26, 1.07] |
|
| 14.1 DHA and AA vs normal term formula | 2 | 207 | Mean Difference (IV, Fixed, 95% CI) | ‐0.59 [‐2.26, 1.07] |
| 15 PDI (Bayley) score at 6 m Show forest plot | 2 | 206 | Mean Difference (IV, Fixed, 95% CI) | 0.23 [‐2.47, 2.94] |
|
| 15.1 DHA and AA vs normal term formula | 2 | 206 | Mean Difference (IV, Fixed, 95% CI) | 0.23 [‐2.47, 2.94] |
| 16 MDI (Bayley score) at 1 year Show forest plot | 4 | | Mean Difference (IV, Fixed, 95% CI) | Subtotals only |
|
| 16.1 DHA and AA vs normal term formula | 3 | 298 | Mean Difference (IV, Fixed, 95% CI) | ‐0.95 [‐3.38, 1.49] |
| 16.2 DHA vs normal term formula | 3 | 160 | Mean Difference (IV, Fixed, 95% CI) | ‐0.27 [‐4.36, 3.83] |
| 17 PDI (Bayley score) at 1 year Show forest plot | 4 | | Mean Difference (IV, Fixed, 95% CI) | Subtotals only |
|
| 17.1 DHA and AA vs normal term formula | 3 | 298 | Mean Difference (IV, Fixed, 95% CI) | ‐2.48 [‐5.83, 0.86] |
| 17.2 DHA vs normal term formula | 3 | 160 | Mean Difference (IV, Fixed, 95% CI) | ‐1.70 [‐6.62, 3.22] |
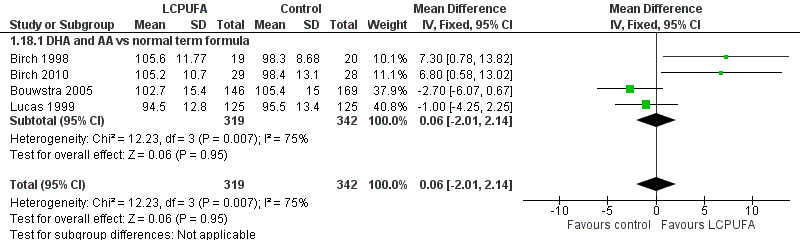
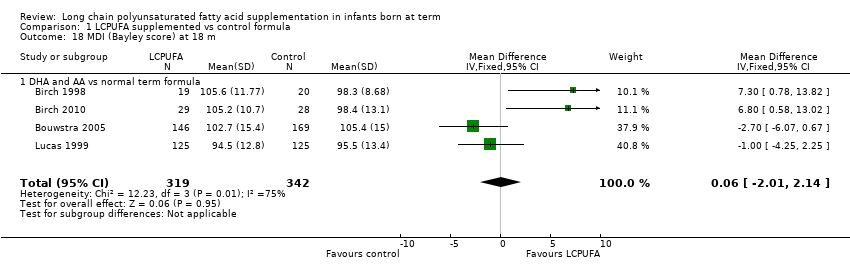
| 18 MDI (Bayley score) at 18 m Show forest plot | 4 | 661 | Mean Difference (IV, Fixed, 95% CI) | 0.06 [‐2.01, 2.14] |
|
| 18.1 DHA and AA vs normal term formula | 4 | 661 | Mean Difference (IV, Fixed, 95% CI) | 0.06 [‐2.01, 2.14] |
| 19 PDI (Bayley score) at 18 m Show forest plot | 4 | 661 | Mean Difference (IV, Fixed, 95% CI) | 0.69 [‐0.78, 2.16] |
|
| 19.1 DHA and AA vs normal term formula | 4 | 661 | Mean Difference (IV, Fixed, 95% CI) | 0.69 [‐0.78, 2.16] |
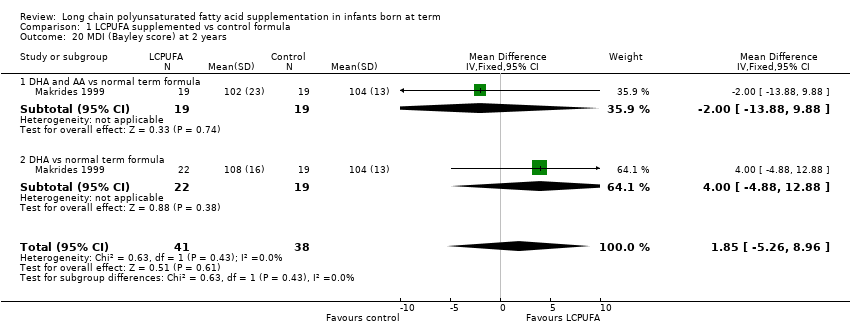
| 20 MDI (Bayley score) at 2 years Show forest plot | 1 | 79 | Mean Difference (IV, Fixed, 95% CI) | 1.85 [‐5.26, 8.96] |
|
| 20.1 DHA and AA vs normal term formula | 1 | 38 | Mean Difference (IV, Fixed, 95% CI) | ‐2.0 [‐13.88, 9.88] |
| 20.2 DHA vs normal term formula | 1 | 41 | Mean Difference (IV, Fixed, 95% CI) | 4.0 [‐4.88, 12.88] |
| 21 PDI (Bayley score) at 2 years Show forest plot | 1 | | Mean Difference (IV, Fixed, 95% CI) | Subtotals only |
|
| 21.1 DHA and AA vs normal term formula | 1 | 37 | Mean Difference (IV, Fixed, 95% CI) | ‐1.0 [‐12.71, 10.71] |
| 21.2 DHA vs normal term formula | 1 | 37 | Mean Difference (IV, Fixed, 95% CI) | 7.00 [‐3.32, 17.32] |
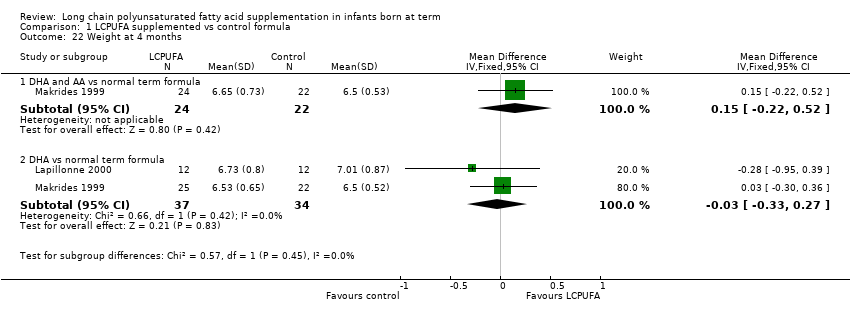
| 22 Weight at 4 months Show forest plot | 2 | | Mean Difference (IV, Fixed, 95% CI) | Subtotals only |
|
| 22.1 DHA and AA vs normal term formula | 1 | 46 | Mean Difference (IV, Fixed, 95% CI) | 0.15 [‐0.22, 0.52] |
| 22.2 DHA vs normal term formula | 2 | 71 | Mean Difference (IV, Fixed, 95% CI) | ‐0.03 [‐0.33, 0.27] |
| 23 Length at 4 months Show forest plot | 2 | | Mean Difference (IV, Fixed, 95% CI) | Subtotals only |
|
| 23.1 DHA and AA vs normal term formula | 1 | 46 | Mean Difference (IV, Fixed, 95% CI) | 0.0 [‐1.45, 1.45] |
| 23.2 DHA vs normal term formula | 2 | 71 | Mean Difference (IV, Fixed, 95% CI) | 0.03 [1.00, 1.06] |
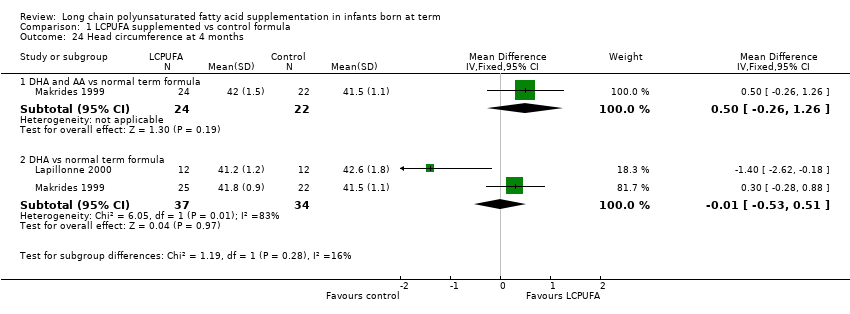
| 24 Head circumference at 4 months Show forest plot | 2 | | Mean Difference (IV, Fixed, 95% CI) | Subtotals only |
|
| 24.1 DHA and AA vs normal term formula | 1 | 46 | Mean Difference (IV, Fixed, 95% CI) | 0.5 [‐0.26, 1.26] |
| 24.2 DHA vs normal term formula | 2 | 71 | Mean Difference (IV, Fixed, 95% CI) | ‐0.01 [‐0.53, 0.51] |
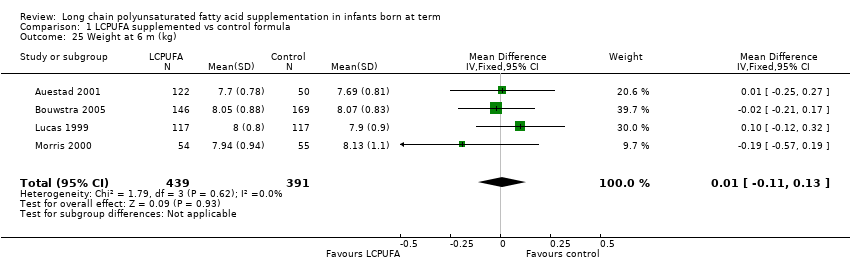
| 25 Weight at 6 m (kg) Show forest plot | 4 | 830 | Mean Difference (IV, Fixed, 95% CI) | 0.01 [‐0.11, 0.13] |
|
| 26 Length at 6 m (cm) Show forest plot | 4 | 830 | Mean Difference (IV, Fixed, 95% CI) | ‐0.13 [‐0.47, 0.21] |
|
| 27 Head circumference at 6 m (cm) Show forest plot | 4 | 830 | Mean Difference (IV, Fixed, 95% CI) | ‐0.06 [‐0.25, 0.13] |
|
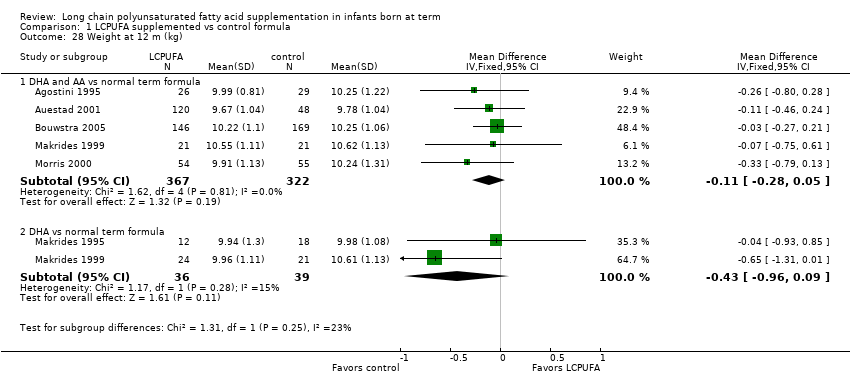
| 28 Weight at 12 m (kg) Show forest plot | 6 | | Mean Difference (IV, Fixed, 95% CI) | Subtotals only |
|
| 28.1 DHA and AA vs normal term formula | 5 | 689 | Mean Difference (IV, Fixed, 95% CI) | ‐0.11 [‐0.28, 0.05] |
| 28.2 DHA vs normal term formula | 2 | 75 | Mean Difference (IV, Fixed, 95% CI) | ‐0.43 [‐0.96, 0.09] |
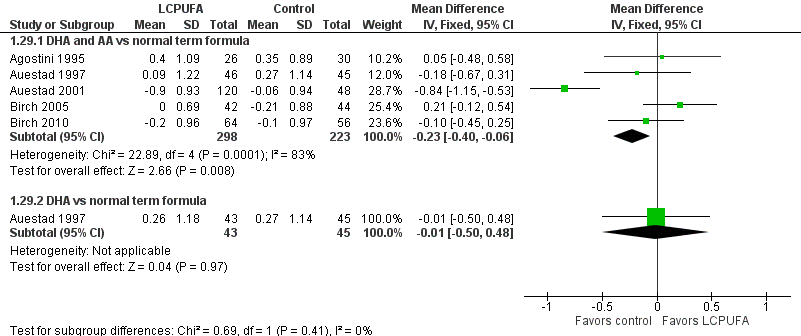
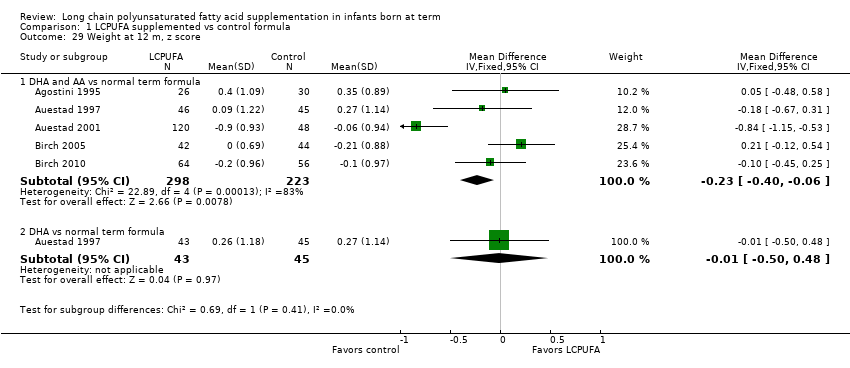
| 29 Weight at 12 m, z score Show forest plot | 5 | | Mean Difference (IV, Fixed, 95% CI) | Subtotals only |
|
| 29.1 DHA and AA vs normal term formula | 5 | 521 | Mean Difference (IV, Fixed, 95% CI) | ‐0.23 [‐0.40, ‐0.06] |
| 29.2 DHA vs normal term formula | 1 | 88 | Mean Difference (IV, Fixed, 95% CI) | ‐0.01 [‐0.50, 0.48] |
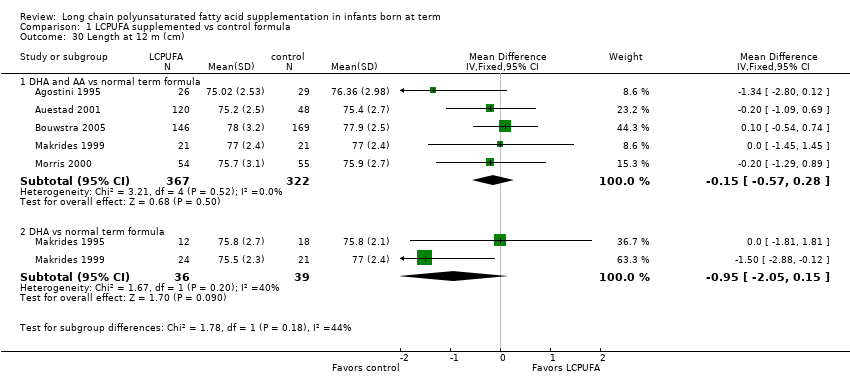
| 30 Length at 12 m (cm) Show forest plot | 6 | | Mean Difference (IV, Fixed, 95% CI) | Subtotals only |
|
| 30.1 DHA and AA vs normal term formula | 5 | 689 | Mean Difference (IV, Fixed, 95% CI) | ‐0.15 [‐0.57, 0.28] |
| 30.2 DHA vs normal term formula | 2 | 75 | Mean Difference (IV, Fixed, 95% CI) | ‐0.95 [‐2.05, 0.15] |
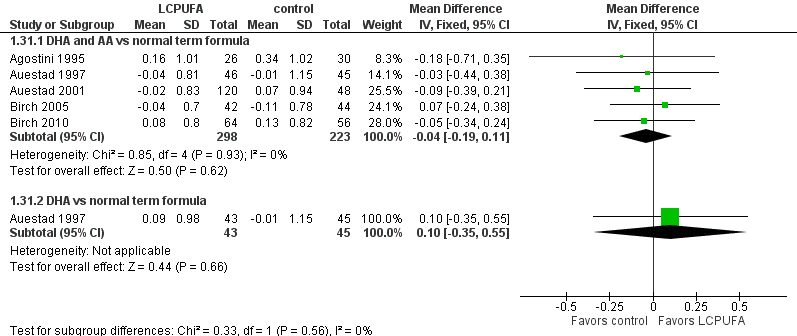
| 31 Length at 12 m, z score Show forest plot | 5 | | Mean Difference (IV, Fixed, 95% CI) | Subtotals only |
|
| 31.1 DHA and AA vs normal term formula | 5 | 521 | Mean Difference (IV, Fixed, 95% CI) | ‐0.04 [‐0.19, 0.11] |
| 31.2 DHA vs normal term formula | 1 | 88 | Mean Difference (IV, Fixed, 95% CI) | 0.10 [‐0.35, 0.55] |
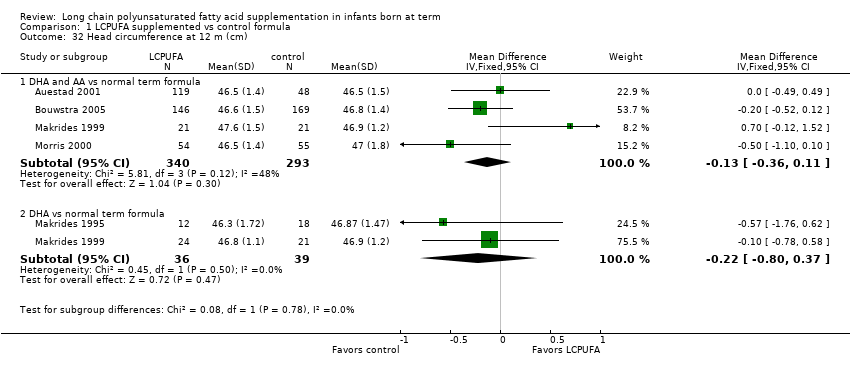
| 32 Head circumference at 12 m (cm) Show forest plot | 5 | | Mean Difference (IV, Fixed, 95% CI) | Subtotals only |
|
| 32.1 DHA and AA vs normal term formula | 4 | 633 | Mean Difference (IV, Fixed, 95% CI) | ‐0.13 [‐0.36, 0.11] |
| 32.2 DHA vs normal term formula | 2 | 75 | Mean Difference (IV, Fixed, 95% CI) | ‐0.22 [‐0.80, 0.37] |
| 33 Head circumference at 12 m, z score Show forest plot | 4 | | Mean Difference (IV, Fixed, 95% CI) | Subtotals only |
|
| 33.1 DHA and AA vs normal term formula | 4 | 464 | Mean Difference (IV, Fixed, 95% CI) | ‐0.13 [‐0.32, 0.05] |
| 33.2 DHA vs normal term formula | 1 | 88 | Mean Difference (IV, Fixed, 95% CI) | 0.07 [‐0.33, 0.47] |
| 34 Weight at 18 m (kg) Show forest plot | 2 | 563 | Mean Difference (IV, Fixed, 95% CI) | ‐0.04 [‐0.25, 0.17] |
|
| 34.1 DHA and AA vs normal term formula | 2 | 563 | Mean Difference (IV, Fixed, 95% CI) | ‐0.04 [‐0.25, 0.17] |
| 35 Length at 18 m (cm) Show forest plot | 2 | 565 | Mean Difference (IV, Fixed, 95% CI) | ‐0.19 [‐0.71, 0.34] |
|
| 35.1 DHA and AA vs normal term formula | 2 | 565 | Mean Difference (IV, Fixed, 95% CI) | ‐0.19 [‐0.71, 0.34] |
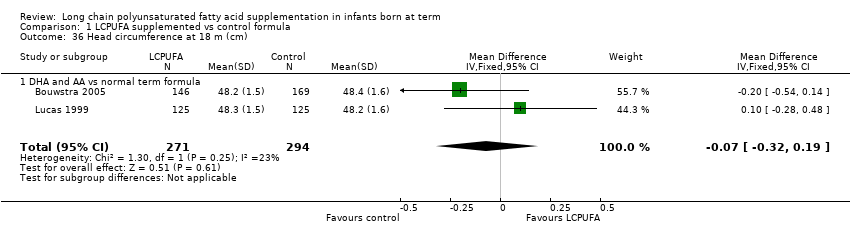
| 36 Head circumference at 18 m (cm) Show forest plot | 2 | 565 | Mean Difference (IV, Fixed, 95% CI) | ‐0.07 [‐0.32, 0.19] |
|
| 36.1 DHA and AA vs normal term formula | 2 | 565 | Mean Difference (IV, Fixed, 95% CI) | ‐0.07 [‐0.32, 0.19] |
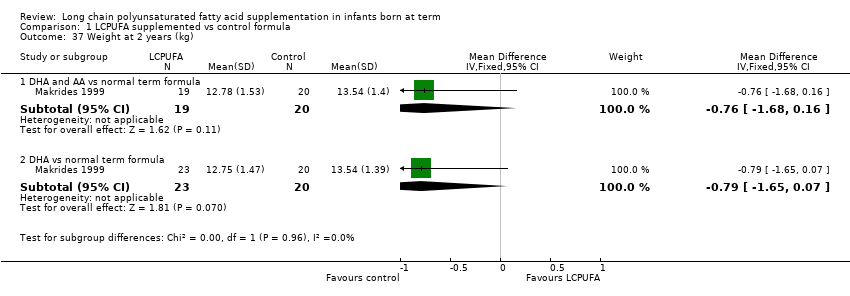
| 37 Weight at 2 years (kg) Show forest plot | 1 | | Mean Difference (IV, Fixed, 95% CI) | Subtotals only |
|
| 37.1 DHA and AA vs normal term formula | 1 | 39 | Mean Difference (IV, Fixed, 95% CI) | ‐0.76 [‐1.68, 0.16] |
| 37.2 DHA vs normal term formula | 1 | 43 | Mean Difference (IV, Fixed, 95% CI) | ‐0.79 [‐1.65, 0.07] |
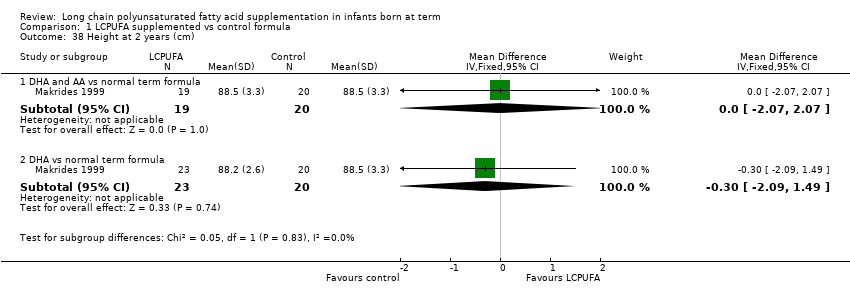
| 38 Height at 2 years (cm) Show forest plot | 1 | | Mean Difference (IV, Fixed, 95% CI) | Subtotals only |
|
| 38.1 DHA and AA vs normal term formula | 1 | 39 | Mean Difference (IV, Fixed, 95% CI) | 0.0 [‐2.07, 2.07] |
| 38.2 DHA vs normal term formula | 1 | 43 | Mean Difference (IV, Fixed, 95% CI) | ‐0.30 [‐2.09, 1.49] |
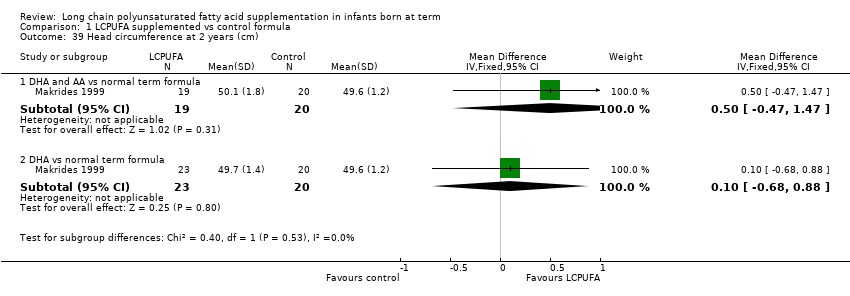
| 39 Head circumference at 2 years (cm) Show forest plot | 1 | | Mean Difference (IV, Fixed, 95% CI) | Subtotals only |
|
| 39.1 DHA and AA vs normal term formula | 1 | 39 | Mean Difference (IV, Fixed, 95% CI) | 0.5 [‐0.47, 1.47] |
| 39.2 DHA vs normal term formula | 1 | 43 | Mean Difference (IV, Fixed, 95% CI) | 0.10 [‐0.68, 0.88] |