| 1 Type 1 ROP or death before determination of ROP outcome using the adjudicated ROP outcome Show forest plot | 2 | 679 | Risk Ratio (M‐H, Fixed, 95% CI) | 1.28 [0.99, 1.67] |
|
| 2 Type 1 ROP Show forest plot | 1 | 511 | Risk Ratio (M‐H, Fixed, 95% CI) | 1.41 [0.89, 2.24] |
|
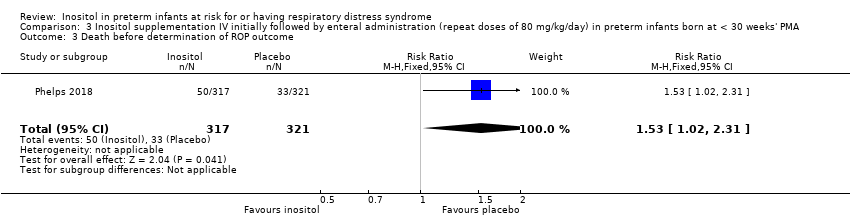
| 3 Death before determination of ROP outcome Show forest plot | 1 | 638 | Risk Ratio (M‐H, Fixed, 95% CI) | 1.53 [1.02, 2.31] |
|
| 4 Type 1 ROP including adjudicated ROP outcome Show forest plot | 2 | 605 | Risk Ratio (M‐H, Fixed, 95% CI) | 1.24 [0.82, 1.86] |
|
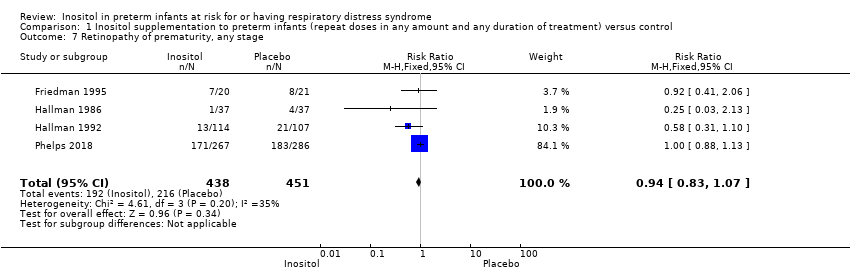
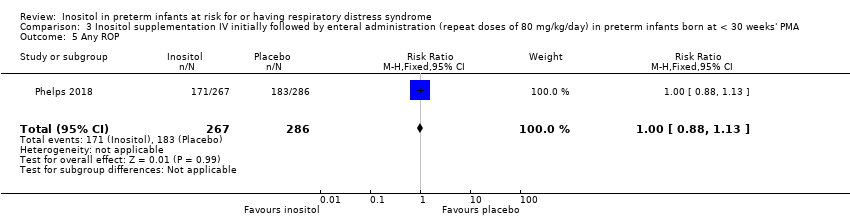
| 5 Any ROP Show forest plot | 1 | 553 | Risk Ratio (M‐H, Fixed, 95% CI) | 1.00 [0.88, 1.13] |
|
| 6 ROP ≥ 2 ROP Show forest plot | 1 | 548 | Risk Ratio (M‐H, Fixed, 95% CI) | 0.95 [0.80, 1.13] |
|
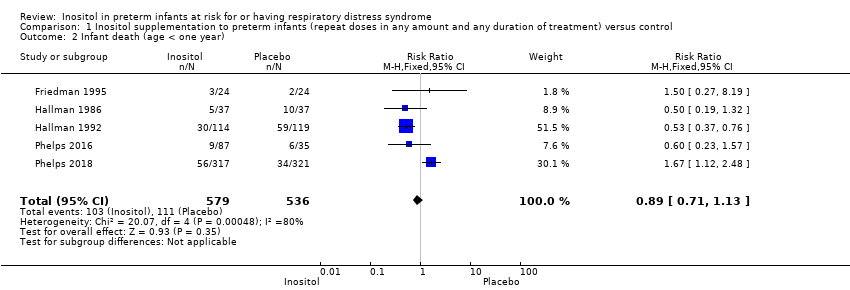
| 7 All cause infant mortality to 55 week's PMA Show forest plot | 1 | 638 | Risk Ratio (M‐H, Fixed, 95% CI) | 1.67 [1.12, 2.48] |
|
| 8 All cause mortality (outcome collected through first event: death, hospital discharge, hospital transfer, or 120 days after birth) Show forest plot | 2 | 701 | Risk Ratio (M‐H, Fixed, 95% CI) | 1.35 [0.91, 2.00] |
|
| 9 BPD (requiring oxygen at 36 week's PMA for oxygen saturation > 90%) Show forest plot | 1 | 560 | Risk Ratio (M‐H, Fixed, 95% CI) | 1.02 [0.89, 1.18] |
|
| 10 BPD or death by it prior to 37 weeks' PMA (outcomes collected through first event: death, hospital discharge, hospital transfer, or 120 days after birth) Show forest plot | 2 | 616 | Risk Ratio (M‐H, Fixed, 95% CI) | 1.01 [0.87, 1.16] |
|
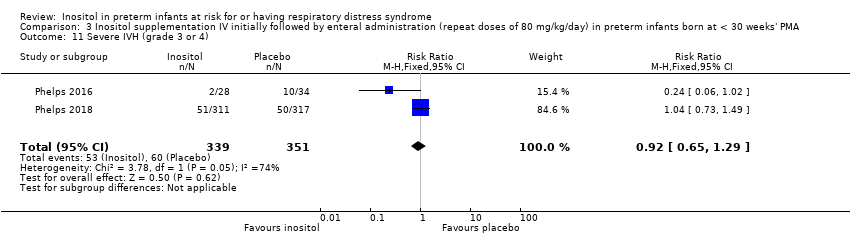
| 11 Severe IVH (grade 3 or 4) Show forest plot | 2 | 690 | Risk Ratio (M‐H, Fixed, 95% CI) | 0.92 [0.65, 1.29] |
|
| 12 Cystic areas in the cerebral parenchyma measured through 28 d Show forest plot | 2 | 225 | Risk Ratio (M‐H, Fixed, 95% CI) | 1.29 [0.58, 2.85] |
|
| 13 Early onset sepsis Show forest plot | 1 | 63 | Risk Ratio (M‐H, Fixed, 95% CI) | 0.0 [0.0, 0.0] |
|
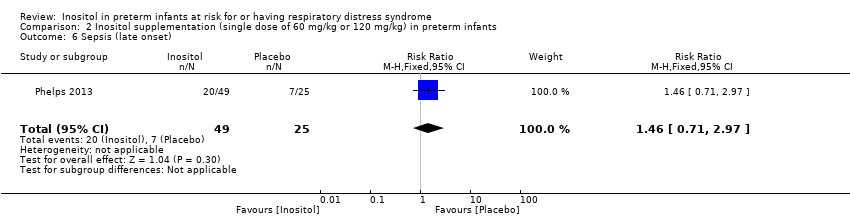
| 14 Late onset sepsis (> 72 hrs of age) Show forest plot | 2 | 701 | Risk Ratio (M‐H, Fixed, 95% CI) | 1.33 [1.00, 1.75] |
|
| 15 Suspected or proven NEC Show forest plot | 2 | 701 | Risk Ratio (M‐H, Fixed, 95% CI) | 0.88 [0.55, 1.41] |
|
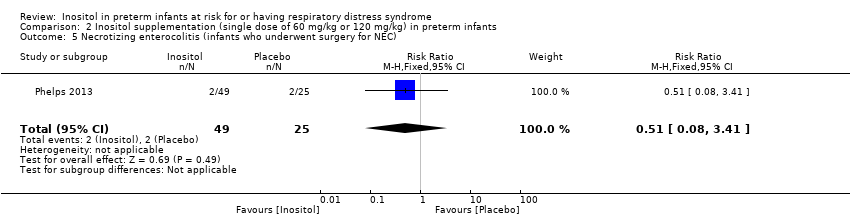
| 16 Surgical NEC Show forest plot | 2 | 701 | Risk Ratio (M‐H, Fixed, 95% CI) | 1.21 [0.57, 2.58] |
|
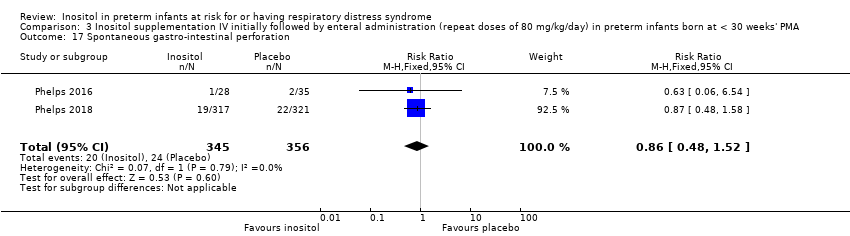
| 17 Spontaneous gastro‐intestinal perforation Show forest plot | 2 | 701 | Risk Ratio (M‐H, Fixed, 95% CI) | 0.86 [0.48, 1.52] |
|
| 18 Pulmonary haemorrhage Show forest plot | 1 | 638 | Risk Ratio (M‐H, Fixed, 95% CI) | 0.98 [0.59, 1.62] |
|
| 19 PDA Show forest plot | 2 | 700 | Risk Ratio (M‐H, Fixed, 95% CI) | 0.98 [0.85, 1.14] |
|
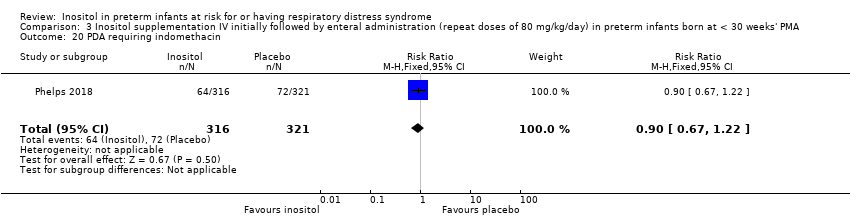
| 20 PDA requiring indomethacin Show forest plot | 1 | 637 | Risk Ratio (M‐H, Fixed, 95% CI) | 0.90 [0.67, 1.22] |
|
| 21 PDA requiring surgery Show forest plot | 2 | 700 | Risk Ratio (M‐H, Fixed, 95% CI) | 0.96 [0.65, 1.42] |
|
| 22 Seizure treatment for ≥ 2 days Show forest plot | 2 | 700 | Risk Ratio (M‐H, Fixed, 95% CI) | 1.04 [0.43, 2.56] |
|
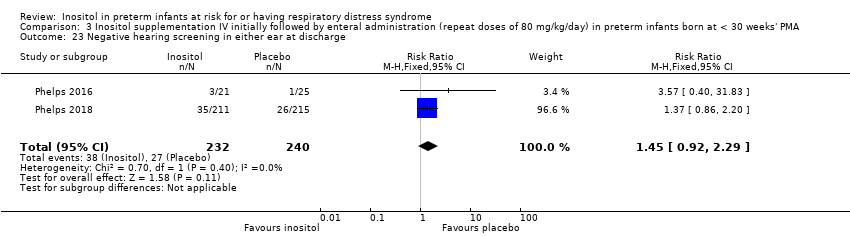
| 23 Negative hearing screening in either ear at discharge Show forest plot | 2 | 472 | Risk Ratio (M‐H, Fixed, 95% CI) | 1.45 [0.92, 2.29] |
|
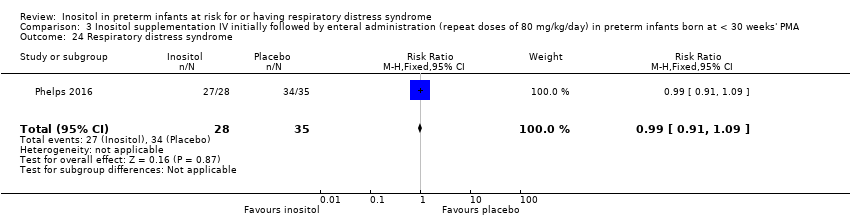
| 24 Respiratory distress syndrome Show forest plot | 1 | 63 | Risk Ratio (M‐H, Fixed, 95% CI) | 0.99 [0.91, 1.09] |
|
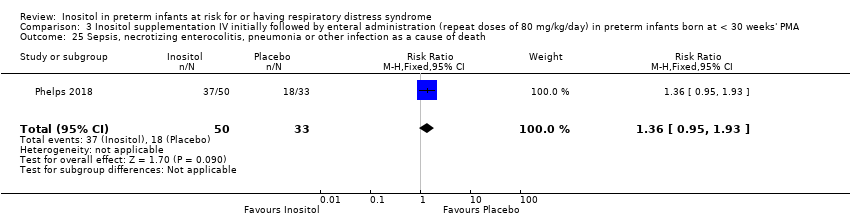
| 25 Sepsis, necrotizing enterocolitis, pneumonia or other infection as a cause of death Show forest plot | 1 | 83 | Risk Ratio (M‐H, Fixed, 95% CI) | 1.36 [0.95, 1.93] |
|