| 1 Asthma exacerbation within 2 weeks Show forest plot | 2 | 2238 | Risk Difference (Random, 95% CI) | 0.01 [‐0.01, 0.04] |
|
| 1.1 Adults | 2 | 1526 | Risk Difference (Random, 95% CI) | 0.02 [‐0.01, 0.05] |
| 1.2 Children | 1 | 712 | Risk Difference (Random, 95% CI) | 0.01 [‐0.04, 0.05] |
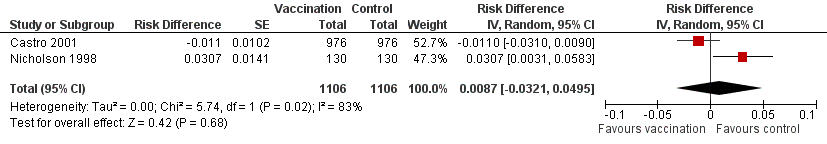
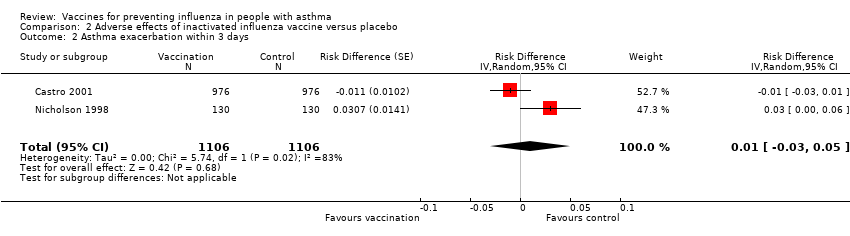
| 2 Asthma exacerbation within 3 days Show forest plot | 2 | 2212 | Risk Difference (Random, 95% CI) | 0.01 [‐0.03, 0.05] |
|
| 3 Asthma exacerbation within 2 weeks (subgrouped by previous vaccination status) Show forest plot | 2 | 2206 | Risk Difference (Random, 95% CI) | 0.01 [‐0.02, 0.04] |
|
| 3.1 First‐time vaccinees | 2 | 474 | Risk Difference (Random, 95% CI) | 0.04 [‐0.03, 0.12] |
| 3.2 Repeat vaccinees | 2 | 1732 | Risk Difference (Random, 95% CI) | ‐0.00 [‐0.02, 0.01] |
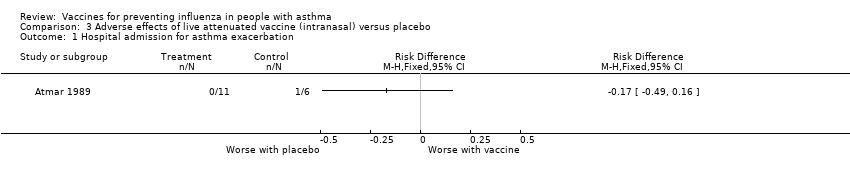
| 4 Hospital admission (0 to 14 days post vaccination) Show forest plot | 1 | | Risk Difference (Fixed, 95% CI) | Totals not selected |
|
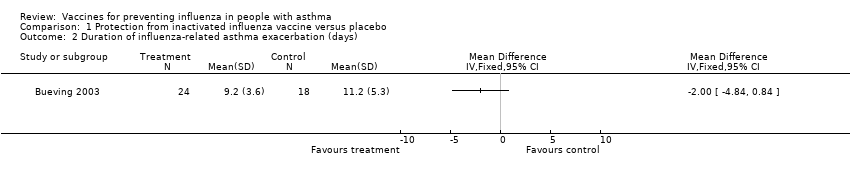
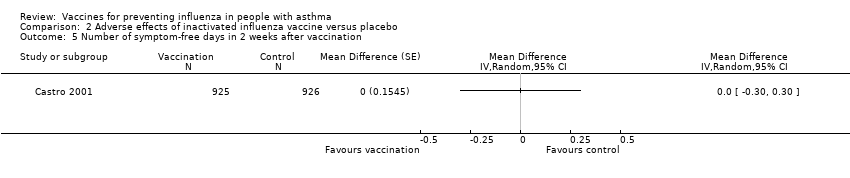
| 5 Number of symptom‐free days in 2 weeks after vaccination Show forest plot | 1 | | Mean Difference (Random, 95% CI) | Totals not selected |
|
| 6 ≥ 1 day off school or work Show forest plot | 2 | 2648 | Risk Difference (Random, 95% CI) | ‐0.00 [‐0.02, 0.01] |
|
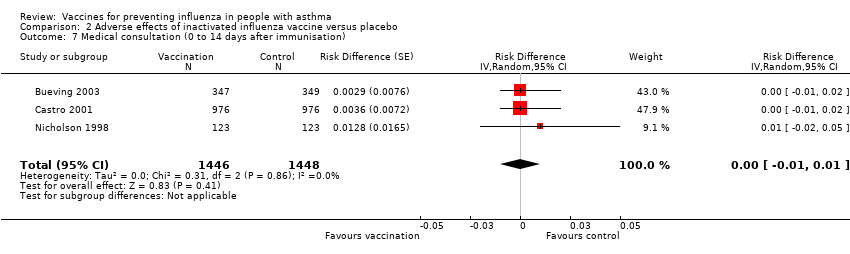
| 7 Medical consultation (0 to 14 days after immunisation) Show forest plot | 3 | 2894 | Risk Difference (Random, 95% CI) | 0.00 [‐0.01, 0.01] |
|
| 8 Patients at least 15% fall in FEV1 within 5 days Show forest plot | 1 | | Odds Ratio (M‐H, Fixed, 95% CI) | Totals not selected |
|
| 8.1 First dose of vaccination | 1 | | Odds Ratio (M‐H, Fixed, 95% CI) | 0.0 [0.0, 0.0] |
| 8.2 Second dose of vaccination | 1 | | Odds Ratio (M‐H, Fixed, 95% CI) | 0.0 [0.0, 0.0] |
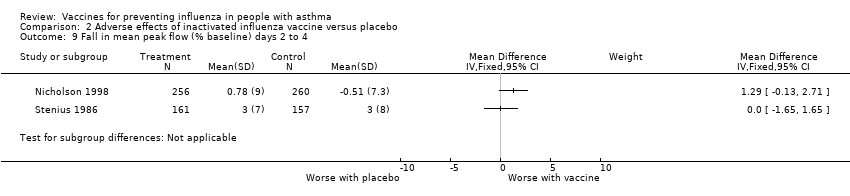
| 9 Fall in mean peak flow (% baseline) days 2 to 4 Show forest plot | 2 | | Mean Difference (IV, Fixed, 95% CI) | Subtotals only |
|
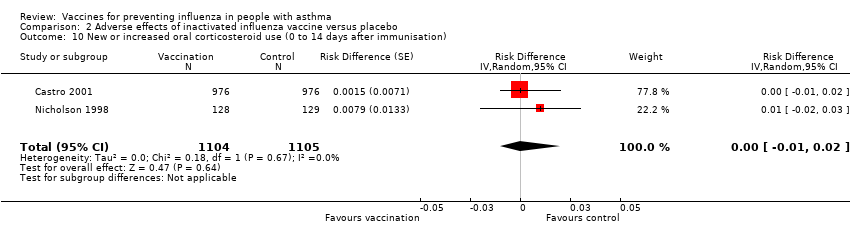
| 10 New or increased oral corticosteroid use (0 to 14 days after immunisation) Show forest plot | 2 | 2209 | Risk Difference (Random, 95% CI) | 0.00 [‐0.01, 0.02] |
|
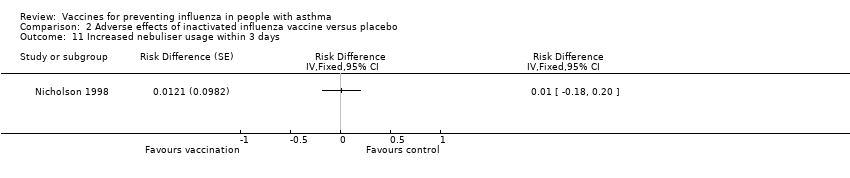
| 11 Increased nebuliser usage within 3 days Show forest plot | 1 | | Risk Difference (Fixed, 95% CI) | Totals not selected |
|
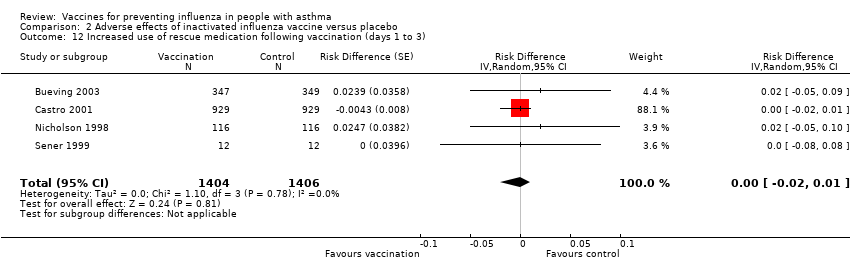
| 12 Increased use of rescue medication following vaccination (days 1 to 3) Show forest plot | 4 | 2810 | Risk Difference (Random, 95% CI) | ‐0.00 [‐0.02, 0.01] |
|
| 13 Change in airways responsiveness Show forest plot | | | Other data | No numeric data |
|
| 14 Change in asthma symptoms in the week following vaccination Show forest plot | | | Other data | No numeric data |
|