Vacunas para la prevención de la gripe en pacientes asmáticos
Información
- DOI:
- https://doi.org/10.1002/14651858.CD000364.pub4Copiar DOI

- Base de datos:
-
- Cochrane Database of Systematic Reviews
- Versión publicada:
-
- 28 febrero 2013see what's new
- Tipo:
-
- Intervention
- Etapa:
-
- Review
- Grupo Editorial Cochrane:
-
Grupo Cochrane de Vías respiratorias
- Copyright:
-
- Copyright © 2013 The Cochrane Collaboration. Published by John Wiley & Sons, Ltd.
Cifras del artículo
Altmetric:
Citado por:
Autores
Contributions of authors
Christopher Cates (CJC) had the idea of carrying out the original review and wrote the protocol in conjunction with Tom Jefferson (TOJ) and Brian Rowe (BR). Studies for inclusion were assessed by CJC and TOJ and quality scoring was also carried out by the same review authors. In the first update of the review CJC and Anna Bara assessed the new studies for inclusion and quality, and for the 2007 update CJC and Toby Lasserson assessed the new studies. CJC wrote and revised the review with assistance and advice from TOJ and BR. The 2012 update was carried out by CJC with assistance for Joannie Shen and Charlotta Karner in selecting the new studies and Elora Baishnab in assessing the risk of bias of the new studies and extracting outcome data. BH revised text and CJC is the guarantor of the review.
Sources of support
Internal sources
-
NHS Executive (North Thames), UK.
-
NHS Research and Development, UK.
-
Emergency Medicine Research Group (EMeRG), Department of Emergency Medicine, University of Alberta, Canada.
Funding, space and equipment to complete systematic reviews.
External sources
-
Garfield Weston Foundation, UK.
-
Canada Institute of Health Research (CIHR), Ottawa, Canada.
Declarations of interest
None known. The authors have not represented the producers of these vaccine products. CJC acted in an advisory capacity in the design of one of the studies (Bueving 2003).
Acknowledgements
The NHS Executive (North Thames) provided funding for Dr Cates to prepare the original version of this review. We would especially like to thank Tom Jefferson for co‐authoring the original review and initial updates, but who stepped down from the review byline in 2012. In addition we would like to acknowledge the assistance provided by the CARG staff (Steve Milan, Jane Dennis, Toby Lasserson and Karen Blackhall) in identifying the trials from the register and obtaining copies of the papers. We would also like to thank Klaus Linde for help with translation of the German papers and assessment of their methodological quality, and Jo Picot for assisting with trial selection and data extraction for the 2003 update. We would like to thank the following authors for responding to correspondence and supplying additional data for the review: Dr Robert Atmar, Dr Mario Castro, Dr Phile Govaert, Dr Brita Stenius‐Aarnalia, Dr Tom Bell, Jonathan Nguyen‐Van‐Tam, Dr Stephen Bourke, Jing‐Long Huang and Hans van der Wouden. We would like to thank Anna Bara for her contribution to the original review and Toby Lasserson for help with assessment of papers to include in the 2007 update. We would also like to thanks Joannie Shen (JS), Charlotta Karner (CK) and Elora Baishnab (EB) for their contributions to the 2012 update.
Version history
| Published | Title | Stage | Authors | Version |
| 2013 Feb 28 | Vaccines for preventing influenza in people with asthma | Review | Christopher J Cates, Brian H Rowe | |
| 2008 Apr 23 | Vaccines for preventing influenza in people with asthma | Review | Christopher J Cates, Tom Jefferson, Brian H Rowe | |
| 2003 Oct 20 | Vaccines for preventing influenza in people with asthma | Review | Christopher J Cates, Tom Jefferson, Anna Bara, Brian H Rowe | |
| 2000 Aug 21 | Influenza vaccination in asthma: efficacy and side‐effects | Review | Christopher Cates, T O Jefferson, A I Bara | |
Differences between protocol and review
The 2011 updated review includes a 'Risk of bias' table, in which the assessment of risk of bias for blinding of participants and personnel was not judged to be low risk unless there was a clear indication that the placebo injection was similar in appearance to the active injection. Jadad scores (Jadad 1996) were used in the early versions of this review and have been preserved in the Characteristics of included studies. The generic inverse variance method has been used for meta‐analysis using paired data from cross‐over trials in the 2012 update.
Keywords
MeSH
Medical Subject Headings (MeSH) Keywords
Medical Subject Headings Check Words
Adult; Child; Humans;
PICO

Risk of bias summary: review authors' judgements about each risk of bias item for each included study.

Forest plot of comparison: 1 Protection from inactivated influenza vaccine versus placebo, outcome: 1.1 Influenza‐related asthma exacerbations.

Forest plot of comparison: 2 Split virus or surface antigen vaccine versus placebo (adverse events in first two weeks), outcome: 2.1 Asthma exacerbation within two weeks.
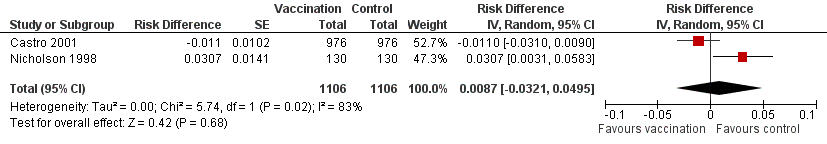
Forest plot of comparison: 2 Split virus or surface antigen vaccine versus placebo (adverse events in first two weeks), outcome: 2.2 Asthma exacerbation within three days.

Forest plot of comparison: 2 Split virus or surface antigen vaccine versus placebo (adverse events in first two weeks), outcome: 2.3 Asthma exacerbation within two weeks (subgrouped by previous vaccination status).

Comparison 1 Protection from inactivated influenza vaccine versus placebo, Outcome 1 Influenza‐related asthma exacerbations.
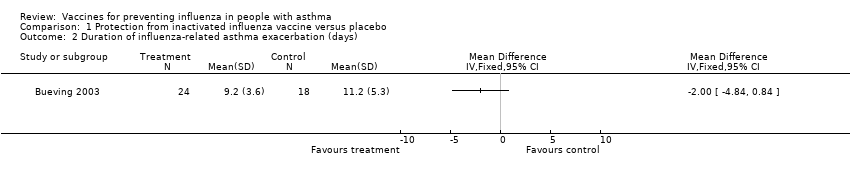
Comparison 1 Protection from inactivated influenza vaccine versus placebo, Outcome 2 Duration of influenza‐related asthma exacerbation (days).

Comparison 1 Protection from inactivated influenza vaccine versus placebo, Outcome 3 Severity of influenza‐related asthma exacerbation (symptom score).

Comparison 1 Protection from inactivated influenza vaccine versus placebo, Outcome 4 Difference in symptom score during influenza positive weeks.
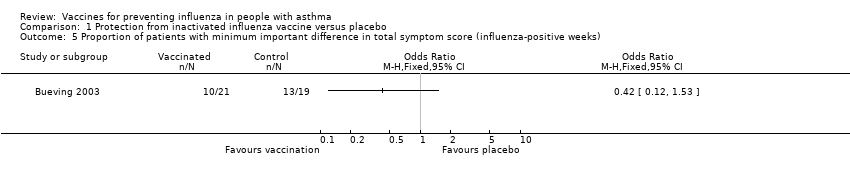
Comparison 1 Protection from inactivated influenza vaccine versus placebo, Outcome 5 Proportion of patients with minimum important difference in total symptom score (influenza‐positive weeks).

Comparison 1 Protection from inactivated influenza vaccine versus placebo, Outcome 6 FEV1 (% predicted) during influenza positive weeks.

Comparison 2 Adverse effects of inactivated influenza vaccine versus placebo, Outcome 1 Asthma exacerbation within 2 weeks.
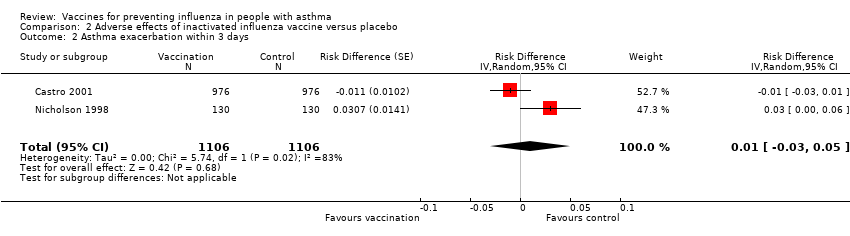
Comparison 2 Adverse effects of inactivated influenza vaccine versus placebo, Outcome 2 Asthma exacerbation within 3 days.

Comparison 2 Adverse effects of inactivated influenza vaccine versus placebo, Outcome 3 Asthma exacerbation within 2 weeks (subgrouped by previous vaccination status).

Comparison 2 Adverse effects of inactivated influenza vaccine versus placebo, Outcome 4 Hospital admission (0 to 14 days post vaccination).
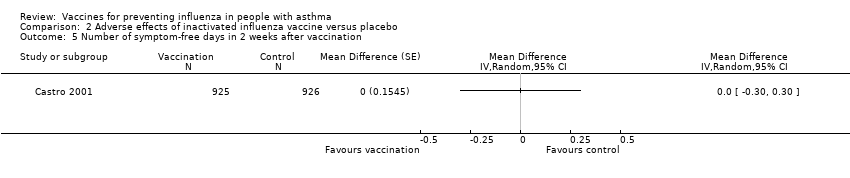
Comparison 2 Adverse effects of inactivated influenza vaccine versus placebo, Outcome 5 Number of symptom‐free days in 2 weeks after vaccination.

Comparison 2 Adverse effects of inactivated influenza vaccine versus placebo, Outcome 6 ≥ 1 day off school or work.
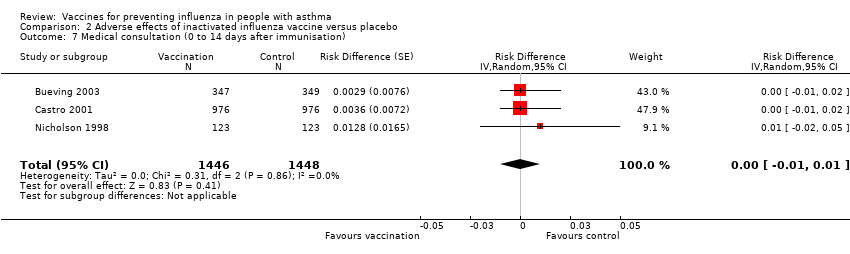
Comparison 2 Adverse effects of inactivated influenza vaccine versus placebo, Outcome 7 Medical consultation (0 to 14 days after immunisation).

Comparison 2 Adverse effects of inactivated influenza vaccine versus placebo, Outcome 8 Patients at least 15% fall in FEV1 within 5 days.
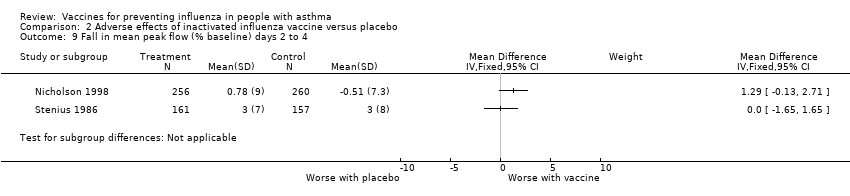
Comparison 2 Adverse effects of inactivated influenza vaccine versus placebo, Outcome 9 Fall in mean peak flow (% baseline) days 2 to 4.
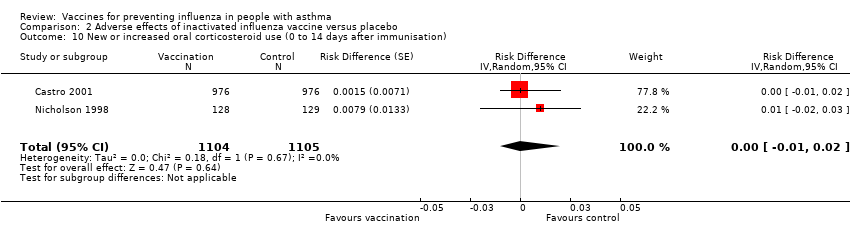
Comparison 2 Adverse effects of inactivated influenza vaccine versus placebo, Outcome 10 New or increased oral corticosteroid use (0 to 14 days after immunisation).
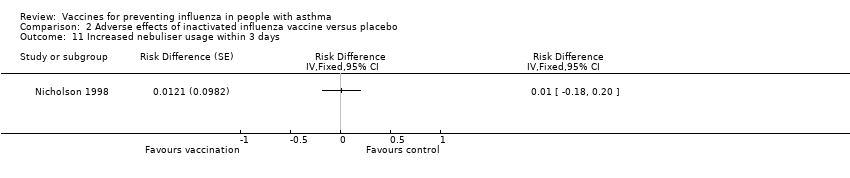
Comparison 2 Adverse effects of inactivated influenza vaccine versus placebo, Outcome 11 Increased nebuliser usage within 3 days.
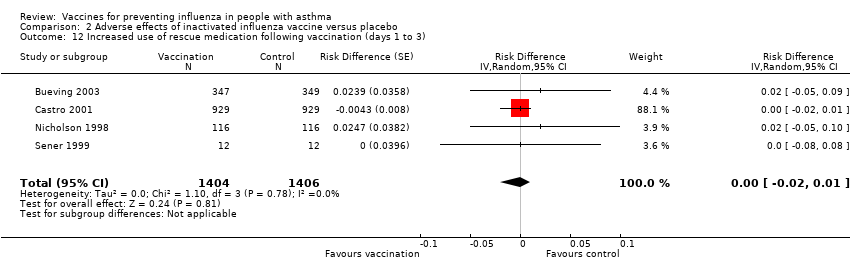
Comparison 2 Adverse effects of inactivated influenza vaccine versus placebo, Outcome 12 Increased use of rescue medication following vaccination (days 1 to 3).
| Study | |
| Kut 1999 | No significant change in PC20 following either placebo or vaccine. |
| Reid 1998 | No significant difference found in placebo group (n=5) or vaccination group (n=17) in either mean PD20 or mean FEV1 (tested by analysis of variance ANOVA). No individual patient in either group showed a change of PD20 of more than two‐fold. |
| Sener 1999 | No significant difference between placebo and vaccine in PD20 at 2 weeks. Vaccine 2.96(SD 3.2) and placebo 2.76 (SD 2.91) |
Comparison 2 Adverse effects of inactivated influenza vaccine versus placebo, Outcome 13 Change in airways responsiveness.
| Study | |
| Govaert 1992 | No adverse reactions on asthma symptoms reported from any of the 14 asthmatics immunised with split‐virus vaccine or the 11 astmatics given placebo. (Communication from author) |
| Hahn 1980 | No significant deterioration in home Peak Flow measurement in the split vaccine (25 patients), subunit vaccine (25 patients) or placebo group (16 patients) in the two weeks following vaccination. No numerical data given. |
| Sener 1999 | No significant difference in symptom scores in the week after vaccine. Placebo mean score 4.66 (SD 7.3), vaccine mean score 4.92 (SD 7.56) |
| Stenius 1986 | Similar in the vaccine and placebo groups. No numerical data provided. |
Comparison 2 Adverse effects of inactivated influenza vaccine versus placebo, Outcome 14 Change in asthma symptoms in the week following vaccination.
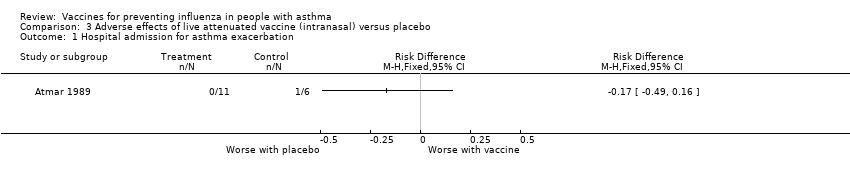
Comparison 3 Adverse effects of live attenuated vaccine (intranasal) versus placebo, Outcome 1 Hospital admission for asthma exacerbation.

Comparison 3 Adverse effects of live attenuated vaccine (intranasal) versus placebo, Outcome 2 Asthma exacerbations in the month after vaccination.
| Study | |
| Miyazaki 1993 | No asthma attacks were apparent following vaccination. Evaluation was made difficult by an Adenovirus outbreak during the study period. No defintion of asthma attack provided by the authors. |
| Tanaka 1993 | No asthma attacks were observed following vaccination (20 patients given CR vaccine and 25 given placebo). No defintion of asthma attack provided by the authors. |
Comparison 3 Adverse effects of live attenuated vaccine (intranasal) versus placebo, Outcome 3 Asthma exacerbations in the week following vaccination.
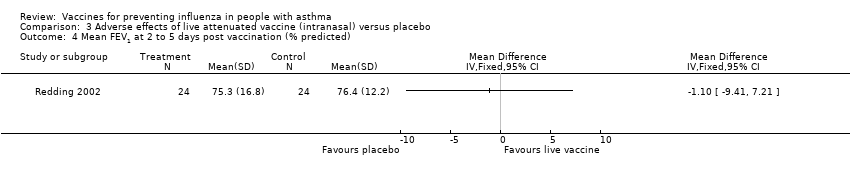
Comparison 3 Adverse effects of live attenuated vaccine (intranasal) versus placebo, Outcome 4 Mean FEV1 at 2 to 5 days post vaccination (% predicted).
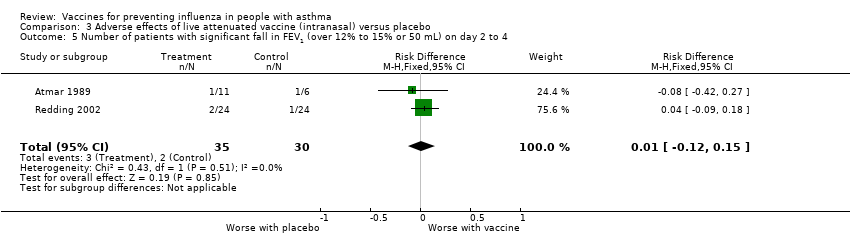
Comparison 3 Adverse effects of live attenuated vaccine (intranasal) versus placebo, Outcome 5 Number of patients with significant fall in FEV1 (over 12% to 15% or 50 mL) on day 2 to 4.
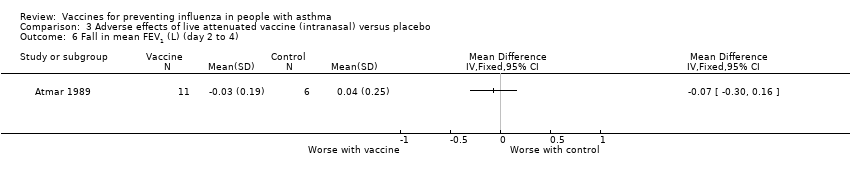
Comparison 3 Adverse effects of live attenuated vaccine (intranasal) versus placebo, Outcome 6 Fall in mean FEV1 (L) (day 2 to 4).

Comparison 3 Adverse effects of live attenuated vaccine (intranasal) versus placebo, Outcome 7 Number of puffs of beta2‐agonist per day (in month following vaccination).

Comparison 3 Adverse effects of live attenuated vaccine (intranasal) versus placebo, Outcome 8 Morning peak flow of greater than 30% below baseline at least once in the 4 weeks after vaccination.
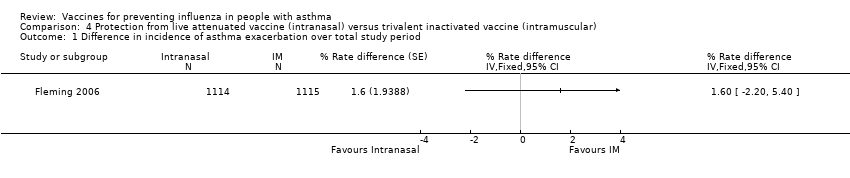
Comparison 4 Protection from live attenuated vaccine (intranasal) versus trivalent inactivated vaccine (intramuscular), Outcome 1 Difference in incidence of asthma exacerbation over total study period.

Comparison 4 Protection from live attenuated vaccine (intranasal) versus trivalent inactivated vaccine (intramuscular), Outcome 2 Hospitalisations due to respiratory illness.

Comparison 4 Protection from live attenuated vaccine (intranasal) versus trivalent inactivated vaccine (intramuscular), Outcome 3 Days off school or work (incidence rates).

Comparison 4 Protection from live attenuated vaccine (intranasal) versus trivalent inactivated vaccine (intramuscular), Outcome 4 Unscheduled healthcare visits (incidence rates).
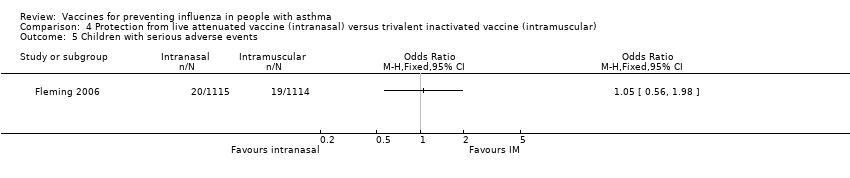
Comparison 4 Protection from live attenuated vaccine (intranasal) versus trivalent inactivated vaccine (intramuscular), Outcome 5 Children with serious adverse events.

Comparison 5 Adverse effects of live attenuated vaccine (intranasal) versus trivalent inactivated vaccine (intramuscular), Outcome 1 Subjects reporting wheeze in the first 15 days.
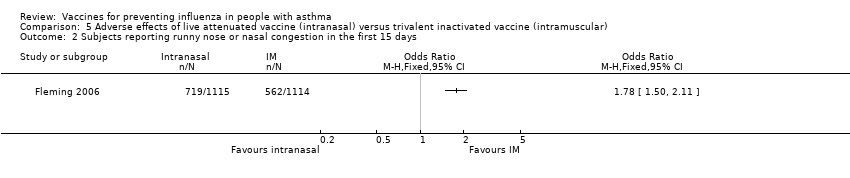
Comparison 5 Adverse effects of live attenuated vaccine (intranasal) versus trivalent inactivated vaccine (intramuscular), Outcome 2 Subjects reporting runny nose or nasal congestion in the first 15 days.
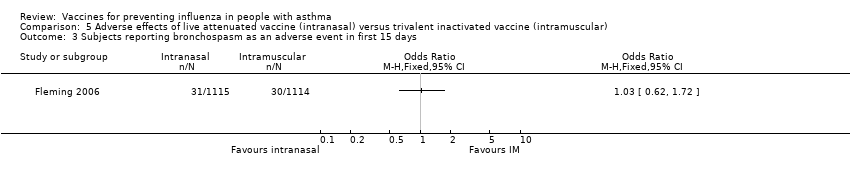
Comparison 5 Adverse effects of live attenuated vaccine (intranasal) versus trivalent inactivated vaccine (intramuscular), Outcome 3 Subjects reporting bronchospasm as an adverse event in first 15 days.
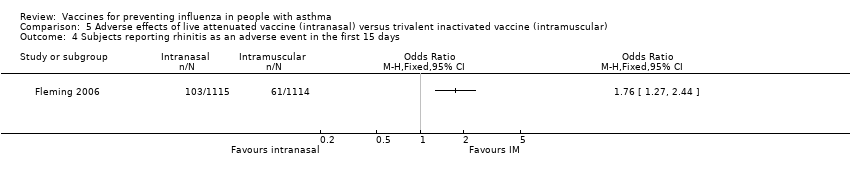
Comparison 5 Adverse effects of live attenuated vaccine (intranasal) versus trivalent inactivated vaccine (intramuscular), Outcome 4 Subjects reporting rhinitis as an adverse event in the first 15 days.
| Inactivated influenza vaccine versus placebo for people with asthma | ||||||
| Patient or population: children and adults with asthma | ||||||
| Outcomes | Illustrative comparative risks* (95% CI) | Relative effect | No of participants | Quality of the evidence | Comments | |
| Assumed risk | Corresponding risk | |||||
| Control | Adverse effects of inactivated influenza vaccine versus placebo | |||||
| Results from trials in children | ||||||
| Protection from experiencing an asthma exacerbation of any cause over the influenza season ‐ children (over 6 years of age) given inactivated influenza vaccine | 90 per 100 | 86 per 100 (81 to 90) | See comment | 696 | ⊕⊕⊕⊝ | Risks were calculated from risk difference in a single study (at low risk of bias) |
| Protection from experiencing an influenza‐related asthma exacerbation over the influenza season ‐ children (over 6 years of age) given inactivated influenza vaccine | 5 per 100 | 6 per 100 (3 to 9) | See comment | 696 | ⊕⊕⊕⊝ | Risks were calculated from risk difference in a single study (at low risk of bias) |
| Asthma exacerbation (adverse effects) caused by inactivated influenza vaccine, measured in the first 2 weeks following vaccination ‐ children (over 3 years of age) given inactivated influenza vaccine | 33 per 100 | 34 per 100 (29 to 38) | See comment | 712 | ⊕⊕⊕⊝ | Risks were calculated from paired proportions in a single cross‐over study (at low risk of bias) |
| Results from trials in adults3 | ||||||
| Protection from experiencing an asthma exacerbation of any cause over the influenza season ‐ adults given inactivated influenza vaccine | See comment | See comment | See comment | See comment | See comment | 2 parallel‐group studies in adults did not contribute to this outcome due to low levels of influenza infection in the season following vaccination |
| Protection from experiencing an influenza‐related asthma exacerbation over the influenza season ‐ adults given inactivated influenza vaccine | See comment | See comment | See comment | See comment | See comment | 2 parallel‐group studies in adults did not contribute to this outcome due to low levels of influenza infection in the season following vaccination |
| Asthma exacerbation (adverse effects) caused by inactivated influenza vaccine, measured in the first 2 weeks following vaccination ‐ adults given inactivated influenza vaccine | 25 per 100 | 27 per 100 (24 to 29) | See comment | 1526 | ⊕⊕⊕⊝ | Risks were calculated from pooled risk differences (from paired proportions in 2 cross‐over studies) |
| *The basis for the assumed risk is the mean control group risk across studies. The corresponding risk (and its 95% confidence interval) is based on the assumed risk in the comparison group and the reported risk difference of the intervention (and its 95% CI). | ||||||
| GRADE Working Group grades of evidence | ||||||
| 1 Single study on children with 95% CI that included no difference between vaccination and placebo. 2 95% CI from the pooled results of two studies excluded the pre‐specified threshold of a 6% increase in the number of participants with an asthma exacerbation following influenza vaccination. 3One trial at low risk of bias and one trial at unclear risk of bias. | ||||||
| Outcome or subgroup title | No. of studies | No. of participants | Statistical method | Effect size |
| 1 Influenza‐related asthma exacerbations Show forest plot | 1 | Risk Difference (M‐H, Fixed, 95% CI) | Totals not selected | |
| 1.1 Number of participants with influenza‐related exacerbations | 1 | Risk Difference (M‐H, Fixed, 95% CI) | 0.0 [0.0, 0.0] | |
| 1.2 Number of patients with any asthma exacerbation | 1 | Risk Difference (M‐H, Fixed, 95% CI) | 0.0 [0.0, 0.0] | |
| 2 Duration of influenza‐related asthma exacerbation (days) Show forest plot | 1 | Mean Difference (IV, Fixed, 95% CI) | Totals not selected | |
| 3 Severity of influenza‐related asthma exacerbation (symptom score) Show forest plot | 1 | Mean Difference (IV, Fixed, 95% CI) | Totals not selected | |
| 4 Difference in symptom score during influenza positive weeks Show forest plot | 1 | Mean difference (Fixed, 95% CI) | Totals not selected | |
| 5 Proportion of patients with minimum important difference in total symptom score (influenza‐positive weeks) Show forest plot | 1 | Odds Ratio (M‐H, Fixed, 95% CI) | Totals not selected | |
| 6 FEV1 (% predicted) during influenza positive weeks Show forest plot | 1 | Mean Difference (IV, Fixed, 95% CI) | Totals not selected | |
| Outcome or subgroup title | No. of studies | No. of participants | Statistical method | Effect size |
| 1 Asthma exacerbation within 2 weeks Show forest plot | 2 | 2238 | Risk Difference (Random, 95% CI) | 0.01 [‐0.01, 0.04] |
| 1.1 Adults | 2 | 1526 | Risk Difference (Random, 95% CI) | 0.02 [‐0.01, 0.05] |
| 1.2 Children | 1 | 712 | Risk Difference (Random, 95% CI) | 0.01 [‐0.04, 0.05] |
| 2 Asthma exacerbation within 3 days Show forest plot | 2 | 2212 | Risk Difference (Random, 95% CI) | 0.01 [‐0.03, 0.05] |
| 3 Asthma exacerbation within 2 weeks (subgrouped by previous vaccination status) Show forest plot | 2 | 2206 | Risk Difference (Random, 95% CI) | 0.01 [‐0.02, 0.04] |
| 3.1 First‐time vaccinees | 2 | 474 | Risk Difference (Random, 95% CI) | 0.04 [‐0.03, 0.12] |
| 3.2 Repeat vaccinees | 2 | 1732 | Risk Difference (Random, 95% CI) | ‐0.00 [‐0.02, 0.01] |
| 4 Hospital admission (0 to 14 days post vaccination) Show forest plot | 1 | Risk Difference (Fixed, 95% CI) | Totals not selected | |
| 5 Number of symptom‐free days in 2 weeks after vaccination Show forest plot | 1 | Mean Difference (Random, 95% CI) | Totals not selected | |
| 6 ≥ 1 day off school or work Show forest plot | 2 | 2648 | Risk Difference (Random, 95% CI) | ‐0.00 [‐0.02, 0.01] |
| 7 Medical consultation (0 to 14 days after immunisation) Show forest plot | 3 | 2894 | Risk Difference (Random, 95% CI) | 0.00 [‐0.01, 0.01] |
| 8 Patients at least 15% fall in FEV1 within 5 days Show forest plot | 1 | Odds Ratio (M‐H, Fixed, 95% CI) | Totals not selected | |
| 8.1 First dose of vaccination | 1 | Odds Ratio (M‐H, Fixed, 95% CI) | 0.0 [0.0, 0.0] | |
| 8.2 Second dose of vaccination | 1 | Odds Ratio (M‐H, Fixed, 95% CI) | 0.0 [0.0, 0.0] | |
| 9 Fall in mean peak flow (% baseline) days 2 to 4 Show forest plot | 2 | Mean Difference (IV, Fixed, 95% CI) | Subtotals only | |
| 10 New or increased oral corticosteroid use (0 to 14 days after immunisation) Show forest plot | 2 | 2209 | Risk Difference (Random, 95% CI) | 0.00 [‐0.01, 0.02] |
| 11 Increased nebuliser usage within 3 days Show forest plot | 1 | Risk Difference (Fixed, 95% CI) | Totals not selected | |
| 12 Increased use of rescue medication following vaccination (days 1 to 3) Show forest plot | 4 | 2810 | Risk Difference (Random, 95% CI) | ‐0.00 [‐0.02, 0.01] |
| 13 Change in airways responsiveness Show forest plot | Other data | No numeric data | ||
| 14 Change in asthma symptoms in the week following vaccination Show forest plot | Other data | No numeric data | ||
| Outcome or subgroup title | No. of studies | No. of participants | Statistical method | Effect size |
| 1 Hospital admission for asthma exacerbation Show forest plot | 1 | Risk Difference (M‐H, Fixed, 95% CI) | Totals not selected | |
| 2 Asthma exacerbations in the month after vaccination Show forest plot | 1 | Risk Difference (M‐H, Fixed, 95% CI) | Totals not selected | |
| 3 Asthma exacerbations in the week following vaccination Show forest plot | Other data | No numeric data | ||
| 4 Mean FEV1 at 2 to 5 days post vaccination (% predicted) Show forest plot | 1 | Mean Difference (IV, Fixed, 95% CI) | Totals not selected | |
| 5 Number of patients with significant fall in FEV1 (over 12% to 15% or 50 mL) on day 2 to 4 Show forest plot | 2 | 65 | Risk Difference (M‐H, Fixed, 95% CI) | 0.01 [‐0.12, 0.15] |
| 6 Fall in mean FEV1 (L) (day 2 to 4) Show forest plot | 1 | Mean Difference (IV, Fixed, 95% CI) | Totals not selected | |
| 7 Number of puffs of beta2‐agonist per day (in month following vaccination) Show forest plot | 1 | Mean Difference (IV, Fixed, 95% CI) | Totals not selected | |
| 8 Morning peak flow of greater than 30% below baseline at least once in the 4 weeks after vaccination Show forest plot | 1 | Risk Difference (M‐H, Fixed, 95% CI) | Totals not selected | |
| Outcome or subgroup title | No. of studies | No. of participants | Statistical method | Effect size |
| 1 Difference in incidence of asthma exacerbation over total study period Show forest plot | 1 | % Rate difference (Fixed, 95% CI) | Totals not selected | |
| 2 Hospitalisations due to respiratory illness Show forest plot | 1 | Odds Ratio (M‐H, Fixed, 95% CI) | Totals not selected | |
| 3 Days off school or work (incidence rates) Show forest plot | 1 | Rate Ratio (Fixed, 95% CI) | Totals not selected | |
| 4 Unscheduled healthcare visits (incidence rates) Show forest plot | 1 | Rate ratio (Fixed, 95% CI) | Totals not selected | |
| 5 Children with serious adverse events Show forest plot | 1 | Odds Ratio (M‐H, Fixed, 95% CI) | Totals not selected | |
| Outcome or subgroup title | No. of studies | No. of participants | Statistical method | Effect size |
| 1 Subjects reporting wheeze in the first 15 days Show forest plot | 1 | Odds Ratio (M‐H, Fixed, 95% CI) | Totals not selected | |
| 2 Subjects reporting runny nose or nasal congestion in the first 15 days Show forest plot | 1 | Odds Ratio (M‐H, Fixed, 95% CI) | Totals not selected | |
| 3 Subjects reporting bronchospasm as an adverse event in first 15 days Show forest plot | 1 | Odds Ratio (M‐H, Fixed, 95% CI) | Totals not selected | |
| 4 Subjects reporting rhinitis as an adverse event in the first 15 days Show forest plot | 1 | Odds Ratio (M‐H, Fixed, 95% CI) | Totals not selected | |