Tecnologías de reproducción asistida para la subfertilidad masculina
Información
- DOI:
- https://doi.org/10.1002/14651858.CD000360.pub5Copiar DOI

- Base de datos:
-
- Cochrane Database of Systematic Reviews
- Versión publicada:
-
- 26 febrero 2016see what's new
- Tipo:
-
- Intervention
- Etapa:
-
- Review
- Grupo Editorial Cochrane:
-
Grupo Cochrane de Ginecología y fertilidad
- Copyright:
-
- Copyright © 2016 The Cochrane Collaboration. Published by John Wiley & Sons, Ltd.
Cifras del artículo
Altmetric:
Citado por:
Autores
Contributions of authors
M Cissen: took the lead in rewriting the protocol. Performed the literature search, selected trials and performed data extraction and analysis. Wrote the review.
AJ Bensdorp: primary author of the previous publication of the review (Bensdorp 2007b). Assisted in rewriting the protocol.
BJ Cohlen: primary author of the first publication of the review (Cohlen 1998; Cohlen 2000). Substantial contribution writing update.
JP de Bruin: formulation of research question; substantial contribution writing update.
S Repping: formulation of research question; substantial contribution writing update.
M van Wely: helped in rewriting the protocol and writing the review. As the second review author, she selected trials and performed data extraction and analysis.
Sources of support
Internal sources
-
None, Other.
External sources
-
None, Other.
Declarations of interest
None known for any of the review authors.
Acknowledgements
Many special thanks to Marian Showell and the staff of the Cochrane Gynaecology and Fertility Group office for their support, performing the electronic searches and their valuable comments during the writing of this review. Thanks to Professor E. te Velde and Professor J.D.F. Habbema, who contributed to the first publication of the protocol (Cohlen 1998).
Version history
| Published | Title | Stage | Authors | Version |
| 2016 Feb 26 | Assisted reproductive technologies for male subfertility | Review | Maartje Cissen, Alexandra Bensdorp, Ben J Cohlen, Sjoerd Repping, Jan Peter de Bruin, Madelon van Wely | |
| 2007 Oct 17 | Intra‐uterine insemination for male subfertility | Review | Alexandra Bensdorp, Ben J Cohlen, Maas Jan Heineman, Patrick Vanderkerchove | |
| 2007 Jul 18 | Intra‐uterine insemination for male subfertility | Review | Alexandra Bensdorp, Ben J Cohlen, Maas‐Jan J Heineman, Patrick Vandekerckhove | |
| 2007 Jan 24 | Timed intercourse versus intra‐uterine insemination with or without ovarian hyperstimulation for subfertility in men | Review | Ben J Cohlen, Patrick Vandekerckhove, E R te Velde, J DF Habbema, Alexandra Bensdorp, Maas‐Jan J Heineman | |
| 1999 Apr 26 | Timed intercourse versus intra‐uterine insemination with or without ovarian hyperstimulation for subfertility in men | Review | Ben J Cohlen, Patrick Vandekerckhove, E R te Velde, J DF Habbema, Egbert Te Velde | |
Differences between protocol and review
None.
Keywords
MeSH
Medical Subject Headings (MeSH) Keywords
Medical Subject Headings Check Words
Female; Humans; Male; Pregnancy;
PICO
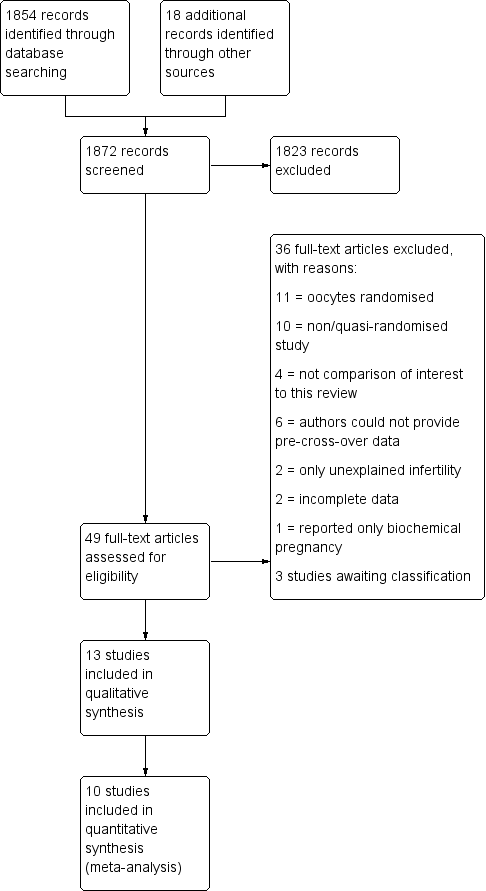
Study flow diagram.
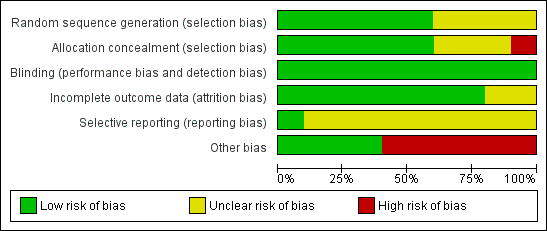
Risk of bias graph: review authors' judgements about each risk of bias item presented as percentages across all included studies.

Risk of bias summary: review authors' judgements about each risk of bias item for each included study.

Forest plot of comparison: 1 Intra‐uterine insemination (IUI) versus timed intercourse (TI) both in natural cycles (NC), outcome: 1.1 Pregnancy rate per couple (all cycles).

Forest plot of comparison: 2 Intra‐uterine insemination (IUI) versus timed intercourse (TI) both in cycles with ovarian hyperstimulation (OH), outcome: 2.3 Pregnancy rate per couple (all cycles).

Forest plot of comparison: 4 Intra‐uterine insemination (IUI) in cycles with ovarian hyperstimulation (OH) versus timed intercourse (TI) in natural cycles (NC), outcome: 4.2 Pregnancy rate per couple (all cycles).

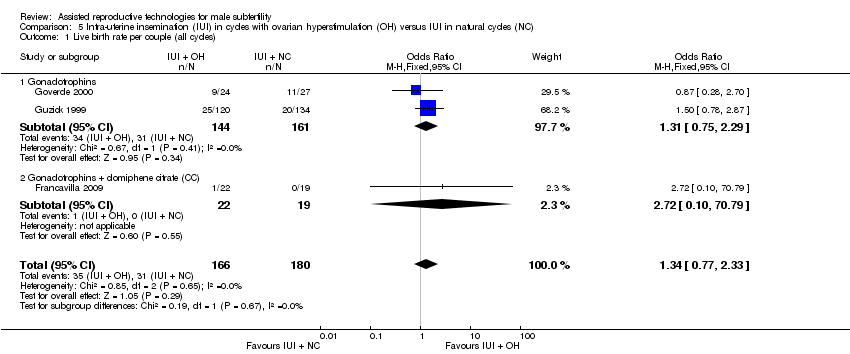
Forest plot of comparison: 5 Intra‐uterine insemination (IUI) in natural cycles (NC) versus IUI in cycles with ovarian hyperstimulation (OH) versus IUI in natural cycles (NC), outcome: 5.2 Pregnancy rate per couple (all cycles).
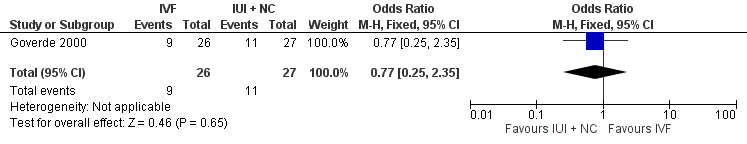
Forest plot of comparison: 8 In vitro fertilisation (IVF) versus intra‐uterine insemination (IUI) in natural cycles (NC), outcome: 8.1 Live birth rate per couple (all cycles).

Forest plot of comparison: 9 In vitro fertilisation (IVF) versus intra‐uterine insemination (IUI) in cycles with ovarian hyperstimulation (OH), outcome: 9.1 Live birth rate per couple (all cycles).

Comparison 1 Intra‐uterine insemination (IUI) versus timed intercourse (TI) both in natural cycles (NC), Outcome 1 Pregnancy rate per couple (all cycles).

Comparison 2 Intra‐uterine insemination (IUI) versus timed intercourse (TI) both in cycles with ovarian hyperstimulation (OH), Outcome 1 Live birth rate per couple (all cycles).
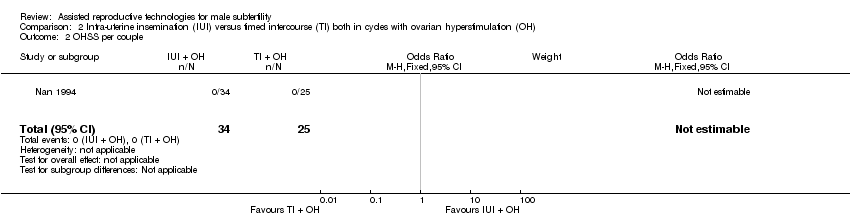
Comparison 2 Intra‐uterine insemination (IUI) versus timed intercourse (TI) both in cycles with ovarian hyperstimulation (OH), Outcome 2 OHSS per couple.
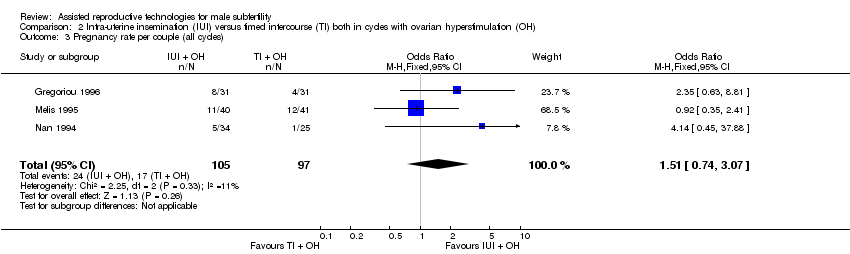
Comparison 2 Intra‐uterine insemination (IUI) versus timed intercourse (TI) both in cycles with ovarian hyperstimulation (OH), Outcome 3 Pregnancy rate per couple (all cycles).

Comparison 2 Intra‐uterine insemination (IUI) versus timed intercourse (TI) both in cycles with ovarian hyperstimulation (OH), Outcome 4 Multiple pregnancy rate per couple.

Comparison 2 Intra‐uterine insemination (IUI) versus timed intercourse (TI) both in cycles with ovarian hyperstimulation (OH), Outcome 5 Miscarriage rate per couple.

Comparison 4 Intra‐uterine insemination (IUI) in cycles with ovarian hyperstimulation (OH) versus timed intercourse (TI) in natural cycles (NC), Outcome 1 Live birth rate per couple (all cycles).

Comparison 4 Intra‐uterine insemination (IUI) in cycles with ovarian hyperstimulation (OH) versus timed intercourse (TI) in natural cycles (NC), Outcome 2 Pregnancy rate per couple (all cycles).
Comparison 5 Intra‐uterine insemination (IUI) in cycles with ovarian hyperstimulation (OH) versus IUI in natural cycles (NC), Outcome 1 Live birth rate per couple (all cycles).

Comparison 5 Intra‐uterine insemination (IUI) in cycles with ovarian hyperstimulation (OH) versus IUI in natural cycles (NC), Outcome 2 Pregnancy rate per couple (all cycles).

Comparison 5 Intra‐uterine insemination (IUI) in cycles with ovarian hyperstimulation (OH) versus IUI in natural cycles (NC), Outcome 3 Miscarriage rate per couple.

Comparison 8 In vitro fertilisation (IVF) versus intra‐uterine insemination (IUI) in natural cycles (NC), Outcome 1 Live birth rate per couple (all cycles).

Comparison 9 In vitro fertilisation (IVF) versus intra‐uterine insemination (IUI) in cycles with ovarian hyperstimulation (OH), Outcome 1 Live birth rate per couple (all cycles).

Comparison 9 In vitro fertilisation (IVF) versus intra‐uterine insemination (IUI) in cycles with ovarian hyperstimulation (OH), Outcome 2 OHSS per couple.

Comparison 9 In vitro fertilisation (IVF) versus intra‐uterine insemination (IUI) in cycles with ovarian hyperstimulation (OH), Outcome 3 Pregnancy rate per couple (all cycles).
| IUI in natural cycles compared to TI in natural cycles for male subfertility | ||||||
| Patient or population: couples with male subfertility | ||||||
| Outcomes | Illustrative comparative risks* (95% CI) | Relative effect | No of couples (studies) | Quality of the evidence | Comments | |
| Assumed risk | Corresponding risk | |||||
| TI in natural cycles | IUI in natural cycles | |||||
| Live birth rate | Not reported in any included studies | ‐ | ‐ | |||
| OHSS | Not reported in any included studies | ‐ | ‐ | |||
| Pregnancy rate per couple (all cycles) | 0 per 1000 | 0 per 1000 | OR 4.57 | 62 | ⊕⊝⊝⊝ | ‐ |
| *The basis for the assumed risk was the median control group risk across studies. The corresponding risk (and its 95% confidence interval) is based on the assumed risk in the comparison group and the relative effect of the intervention (and its 95% CI). | ||||||
| GRADE Working Group grades of evidence | ||||||
| 1 Risk of bias was very serious: 1. Francavilla 2009, allocation concealment: high risk (on chronological basis), 2. Francavilla 2009, other bias: high risk (no stratification by diagnosis category of subfertility). | ||||||
| IUI in stimulated cycles compared to TI in stimulated cycles for male subfertility | ||||||
| Patient or population: couples with male subfertility | ||||||
| Outcomes | Illustrative comparative risks* (95% CI) | Relative effect | No of couples (studies) | Quality of the evidence | Comments | |
| Assumed risk | Corresponding risk | |||||
| TI in stimulated cycles | IUI in stimulated cycles | |||||
| Live birth rate per couple (all cycles) | 220 per 1000 | 200 per 1000 | OR 0.89 | 81 | ⊕⊕⊝⊝ | ‐ |
| OHSS per couple Follow‐up: 6 months | See comment | See comment | Not estimable | 59 (1 study) | ⊕⊕⊝⊝ | ‐ |
| Pregnancy rate per couple (all cycles) | 175 per 1000 | 243 per 1000 | OR 1.51 | 202 | ⊕⊝⊝⊝ | ‐ |
| Multiple pregnancy rate per couple | 0 per 1000 | 0 per 1000 | OR 3.15 | 81 | ⊕⊕⊝⊝ | ‐ |
| Miscarriage rate per couple | 73 per 1000 | 75 per 1000 | OR 1.03 | 81 | ⊕⊕⊝⊝ | ‐ |
| *The basis for the assumed risk was the median control group risk across studies. The corresponding risk (and its 95% confidence interval) is based on the assumed risk in the comparison group and the relative effect of the intervention (and its 95% CI). | ||||||
| GRADE Working Group grades of evidence | ||||||
| 1 There was very serious imprecision, with small sample size. | ||||||
| IUI in stimulated cycles compared to TI in natural cycles for male subfertility | ||||||
| Patient or population: couples with male subfertility | ||||||
| Outcomes | Illustrative comparative risks* (95% CI) | Relative effect | No of couples (studies) | Quality of the evidence | Comments | |
| Assumed risk | Corresponding risk | |||||
| TI in natural cycles | IUI in stimulated cycles | |||||
| Live birth rate per couple (all cycles) | 0 per 1000 | 0 per 1000 | OR 3.14 | 44 | ⊕⊝⊝⊝ | ‐ |
| OHSS | Not reported in any included studies | ‐ | ||||
| Pregnancy rate per couple (all cycles) | 0 per 1000 | 0 per 1000 | OR 3.14 | 44 | ⊕⊝⊝⊝ | ‐ |
| *The basis for the assumed risk was the median control group risk across studies. The corresponding risk (and its 95% confidence interval) is based on the assumed risk in the comparison group and the relative effect of the intervention (and its 95% CI). | ||||||
| GRADE Working Group grades of evidence | ||||||
| 1 Risk of bias was very serious: 1. Allocation concealment: high risk (on chronological basis), 2. Other bias: high risk (no stratification by diagnosis category of subfertility). | ||||||
| IUI in stimulated cycles compared to IUI in natural cycles for male subfertility | ||||||
| Patient or population: couples with male subfertility | ||||||
| Outcomes | Illustrative comparative risks* (95% CI) | Relative effect | No of couples | Quality of the evidence | Comments | |
| Assumed risk | Corresponding risk | |||||
| IUI in natural cycles | IUI in stimulated cycles | |||||
| Live birth rate per couple (all cycles) | 172 per 1000 | 218 per 1000 | OR 1.34 | 346 | ⊕⊝⊝⊝ | ‐ |
| OHSS | Not reported in any included studies | ‐ | ‐ | |||
| Pregnancy rate per couple (all cycles) | 148 per 1000 | 226 per 1000 | OR 1.68 | 399 | ⊕⊝⊝⊝ | ‐ |
| Miscarriage rate per couple | 53 per 1000 | 56 per 1000 | OR 1.06 | 115 | ⊕⊝⊝⊝ | ‐ |
| *The basis for the assumed risk was the median control group risk across studies. The corresponding risk (and its 95% confidence interval) is based on the assumed risk in the comparison group and the relative effect of the intervention (and its 95% CI). | ||||||
| GRADE Working Group grades of evidence | ||||||
| 1 Risk of bias was very serious: 1. Francavilla 2009, allocation concealment: high risk (on chronological basis), 2. Arici 1994, Francavilla 2009, and Guzick 1999, other bias: high risk (no stratification by diagnosis category of subfertility. | ||||||
| IVF compared to IUI in natural cycles for male subfertility | ||||||
| Patient or population: couples with male subfertility | ||||||
| Outcomes | Illustrative comparative risks* (95% CI) | Relative effect | No of couples (studies) | Quality of the evidence | Comments | |
| Assumed risk | Corresponding risk | |||||
| IUI in natural cycles | IVF | |||||
| Live birth rate per couple (all cycles) | 407 per 1000 | 346 per 1000 | OR 0.77 | 53 | ⊕⊕⊝⊝ | ‐ |
| OHSS | Not reported in any included studies | ‐ | ‐ | |||
| *The basis for the assumed risk was the median control group risk across studies. The corresponding risk (and its 95% confidence interval) is based on the assumed risk in the comparison group and the relative effect of the intervention (and its 95% CI). | ||||||
| GRADE Working Group grades of evidence | ||||||
| 1 There was very serious imprecision, with small sample sizes. | ||||||
| IVF compared to IUI in stimulated cycles for male subfertility | ||||||
| Patient or population: couples with male subfertility | ||||||
| Outcomes | Illustrative comparative risks* (95% CI) | Relative effect | No of couples (studies) | Quality of the evidence | Comments | |
| Assumed risk | Corresponding risk | |||||
| IUI in stimulated cycles | IVF | |||||
| Live birth rate per couple (all cycles) | 452 per 1000 | 460 per 1000 | OR 1.03 | 86 | ⊕⊝⊝⊝ | ‐ |
| OHSS per couple | See comment | See comment | Not estimable | 36 | ⊕⊝⊝⊝ | No OHSS occurred |
| Pregnancy rate per couple (all cycles) | 611 per 1000 | 666 per 1000 | OR 1.27 | 36 | ⊕⊝⊝⊝ | ‐ |
| *The basis for the assumed risk was the median control group risk across studies. The corresponding risk (and its 95% confidence interval) is based on the assumed risk in the comparison group and the relative effect of the intervention (and its 95% CI). | ||||||
| GRADE Working Group grades of evidence | ||||||
| 1 Risk of bias was serious: Bensdorp 2015, other bias: high risk (no stratification by diagnosis category of subfertility). | ||||||
| Outcome or subgroup title | No. of studies | No. of participants | Statistical method | Effect size |
| 1 Pregnancy rate per couple (all cycles) Show forest plot | 2 | 62 | Odds Ratio (M‐H, Fixed, 95% CI) | 4.57 [0.21, 101.61] |
| Outcome or subgroup title | No. of studies | No. of participants | Statistical method | Effect size |
| 1 Live birth rate per couple (all cycles) Show forest plot | 1 | 81 | Odds Ratio (M‐H, Fixed, 95% CI) | 0.89 [0.30, 2.59] |
| 2 OHSS per couple Show forest plot | 1 | 59 | Odds Ratio (M‐H, Fixed, 95% CI) | 0.0 [0.0, 0.0] |
| 3 Pregnancy rate per couple (all cycles) Show forest plot | 3 | 202 | Odds Ratio (M‐H, Fixed, 95% CI) | 1.51 [0.74, 3.07] |
| 4 Multiple pregnancy rate per couple Show forest plot | 1 | 81 | Odds Ratio (M‐H, Fixed, 95% CI) | 3.15 [0.12, 79.69] |
| 5 Miscarriage rate per couple Show forest plot | 1 | 81 | Odds Ratio (M‐H, Fixed, 95% CI) | 1.03 [0.19, 5.42] |
| Outcome or subgroup title | No. of studies | No. of participants | Statistical method | Effect size |
| 1 Live birth rate per couple (all cycles) Show forest plot | 1 | 44 | Odds Ratio (M‐H, Fixed, 95% CI) | 3.14 [0.12, 81.35] |
| 2 Pregnancy rate per couple (all cycles) Show forest plot | 1 | 44 | Odds Ratio (M‐H, Fixed, 95% CI) | 3.14 [0.12, 81.35] |
| Outcome or subgroup title | No. of studies | No. of participants | Statistical method | Effect size |
| 1 Live birth rate per couple (all cycles) Show forest plot | 3 | 346 | Odds Ratio (M‐H, Fixed, 95% CI) | 1.34 [0.77, 2.33] |
| 1.1 Gonadotrophins | 2 | 305 | Odds Ratio (M‐H, Fixed, 95% CI) | 1.31 [0.75, 2.29] |
| 1.2 Gonadotrophins + clomiphene citrate (CC) | 1 | 41 | Odds Ratio (M‐H, Fixed, 95% CI) | 2.72 [0.10, 70.79] |
| 2 Pregnancy rate per couple (all cycles) Show forest plot | 4 | 399 | Odds Ratio (M‐H, Fixed, 95% CI) | 1.68 [1.00, 2.82] |
| 2.1 Gonadotrophins | 2 | 328 | Odds Ratio (M‐H, Fixed, 95% CI) | 1.60 [0.94, 2.73] |
| 2.2 CC | 1 | 30 | Odds Ratio (M‐H, Fixed, 95% CI) | 4.83 [0.18, 128.79] |
| 2.3 Gonadotrophins + CC | 1 | 41 | Odds Ratio (M‐H, Fixed, 95% CI) | 2.72 [0.10, 70.79] |
| 3 Miscarriage rate per couple Show forest plot | 2 | 115 | Odds Ratio (M‐H, Fixed, 95% CI) | 1.06 [0.20, 5.63] |
| Outcome or subgroup title | No. of studies | No. of participants | Statistical method | Effect size |
| 1 Live birth rate per couple (all cycles) Show forest plot | 1 | 53 | Odds Ratio (M‐H, Fixed, 95% CI) | 0.77 [0.25, 2.35] |
| Outcome or subgroup title | No. of studies | No. of participants | Statistical method | Effect size |
| 1 Live birth rate per couple (all cycles) Show forest plot | 2 | 86 | Odds Ratio (M‐H, Fixed, 95% CI) | 1.03 [0.43, 2.45] |
| 2 OHSS per couple Show forest plot | 1 | 36 | Odds Ratio (M‐H, Fixed, 95% CI) | 0.0 [0.0, 0.0] |
| 3 Pregnancy rate per couple (all cycles) Show forest plot | 1 | 36 | Odds Ratio (M‐H, Fixed, 95% CI) | 1.27 [0.33, 4.97] |