Tecnologías de reproducción asistida para la subfertilidad masculina
Resumen
Antecedentes
La inseminación intrauterina (IIU), la fecundación in vitro (FIV) y la inyección intracitoplasmática de espermatozoides (ICSI, por sus siglas en inglés) se utilizan con frecuencia en los tratamientos de fertilidad para parejas con subfertilidad masculina. El uso de estos tratamientos ha sido tema de debate. El conocimiento de la efectividad de los tratamientos de fertilidad para la subfertilidad masculina con diferentes grados de gravedad es limitado. Posiblemente, las parejas están expuestas a tratamientos innecesarios o inefectivos a gran escala.
Objetivos
Evaluar la efectividad y la seguridad de diferentes tratamientos de fertilidad (conducta expectante, coito programado [CP], IIU, FIV e ICSI) para las parejas con subfertilidad que parece deberse a parámetros anormales de los espermatozoides.
Métodos de búsqueda
Se buscaron todas las publicaciones que describieron ensayos controlados aleatorios (ECA) de tratamiento para la subfertilidad masculina. Se hicieron búsquedas en el registro especializado del Grupo Cochrane de Trastornos Menstruales y Subfertilidad (Cochrane Menstrual Disorders and Subfertility Group), Registro Cochrane Central de Ensayos Controlados (Cochrane Central Register of Controlled Trials) (CENTRAL), MEDLINE, EMBASE, CINAHL, PsycINFO y en el National Research Register desde su inicio hasta el 14 abril 2015, y en registros de ensayos en Internet desde enero 1985 hasta abril 2015. No se aplicaron restricciones de idioma. Se verificaron todas las referencias de los ensayos identificados y los artículos de base y se estableció contacto con los autores para identificar datos relevantes publicados y no publicados.
Criterios de selección
Se incluyeron los ECA que compararon diferentes opciones de tratamiento para la subfertilidad masculina. Estas opciones fueron conducta expectante, CP (con o sin hiperestimulación ovárica [HEO]), IIU (con o sin HEO), FIV e ICSI. Solamente se incluyeron las parejas con parámetros anormales de los espermatozoides.
Obtención y análisis de los datos
Dos autores de la revisión seleccionaron los estudios de forma independiente, extrajeron los datos y evaluaron el riesgo de sesgo. Se resolvieron los desacuerdos mediante discusión con el resto de autores de la revisión. Los análisis estadísticos se realizaron según las guías para el análisis estadístico desarrolladas por la Colaboración Cochrane (Cochrane Collaboration). La calidad de las pruebas se calificó mediante los métodos GRADE. Los resultados primarios fueron nacidos vivos y síndrome de hiperestimulación ovárica (SHEO) por pareja asignada al azar.
Resultados principales
La revisión incluyó 10 ECA (757 parejas). La calidad de las pruebas fue baja o muy baja para todas las comparaciones. Las limitaciones principales de las pruebas fueron que no se describieron los métodos de estudio y que hubo imprecisión grave e inconsistencia.
IIU versus CP (cinco ECA)
Dos ECA compararon IIU con CP en ciclos naturales. No hubo datos sobre los nacidos vivos o el SHEO. No se encontraron pruebas de una diferencia en las tasas de embarazo (dos ECA, 62 parejas: odds ratio [OR] 4,57; intervalo de confianza [IC] del 95%: 0,21 a 102, pruebas de calidad muy baja; no hubo eventos en uno de los estudios).
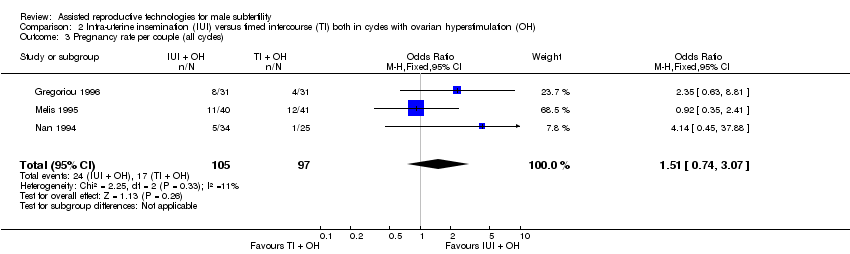
Tres ECA compararon IIU con CP, ambos en ciclos con HEO. No se encontraron pruebas de una diferencia en las tasas de nacidos vivos (un ECA, 81 parejas: OR 0,89; IC del 95%: 0,30 a 2,59; pruebas de calidad baja) o las tasas de embarazo (tres ECA, 202 parejas: OR 1,51; IC del 95%: 0,74 a 3,07; I2 = 11%, pruebas de calidad muy baja). Un ECA informó datos sobre el SHEO. Ninguna de las 62 pacientes presentó SHEO.
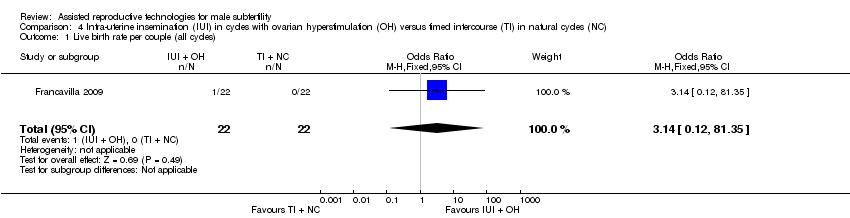
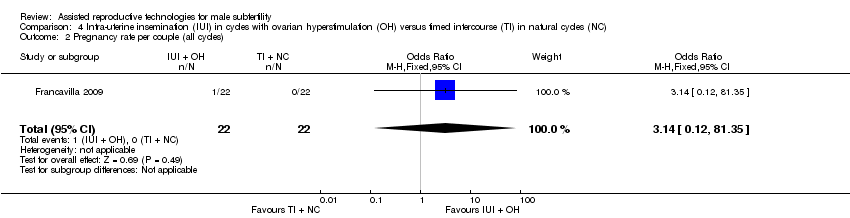
Un ECA comparó IIU en ciclos con HEO con CP en ciclos naturales. No se encontraron pruebas de una diferencia en las tasas de nacidos vivos (un ECA, 44 parejas: OR 3,14; IC del 95%: 0,12 a 81,35; pruebas de muy baja calidad). No hubo datos sobre el SHEO.
IIU en ciclos con HEO versus IIU en ciclos naturales (cinco ECA)
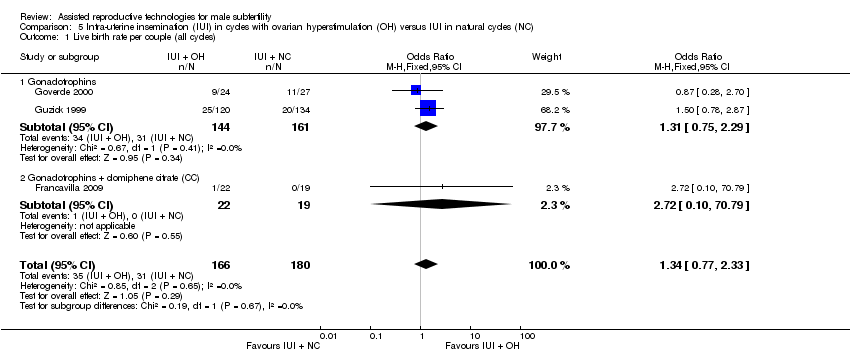
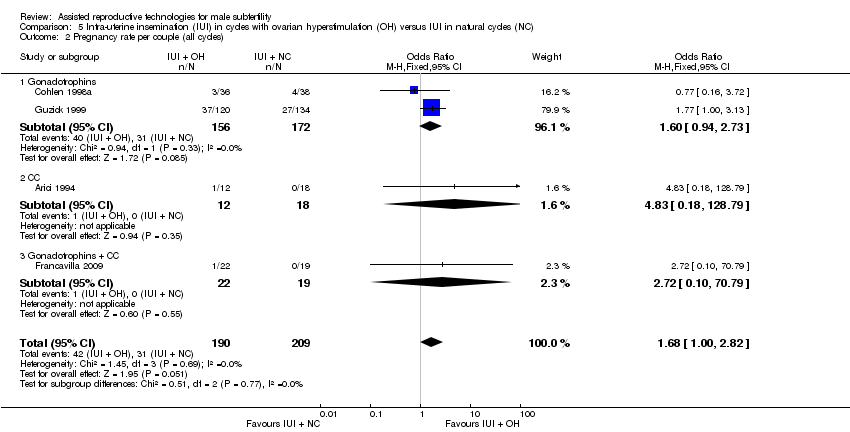
No se encontraron pruebas de una diferencia en las tasas de nacidos vivos (tres ECA, 346 parejas: OR 1,34; IC del 95%: 0,77 a 2,33; I2 = 0%, pruebas de calidad muy baja) ni las tasas de embarazo (cuatro ECA, 399 parejas: OR 1,68; IC del 95%: 1,00 a 2,82; I2 = 0%, pruebas de calidad muy baja). No hubo datos sobre el SHEO.
FIV versus IIU en ciclos naturales o ciclos con HEO (dos ECA)
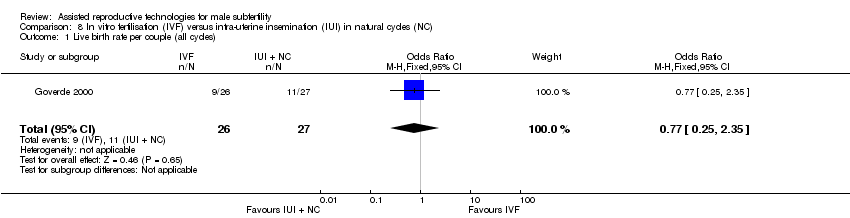
No se encontraron pruebas de una diferencia en las tasas de nacidos vivos entre FIV versus IIU en ciclos naturales (un ECA, 53 parejas: OR 0,77; IC del 95%: 0,25 a 2,35; pruebas de baja calidad) o FIV versus IIU en ciclos con HEO (dos ECA, 86 parejas: OR 1,03; IC del 95%: 0,43 a 2,45; I2 = 0%, pruebas de calidad muy baja). Un ECA informó datos sobre el SHEO. Ninguna de las 62 pacientes presentó SHEO.
En general, no se encontraron pruebas de una diferencia entre ninguno de los grupos en las tasas de nacidos vivos, embarazo o eventos adversos (embarazo múltiple, aborto espontáneo). Sin embargo, la mayoría de las pruebas era de muy baja calidad.
No hubo estudios sobre IIU en ciclos naturales versus CP en ciclos estimulados, FIV versus CP, ICSI versus CP, ICSI versus IIU (con HEO) o ICSI versus FIV.
Conclusiones de los autores
No se encontraron pruebas suficientes para determinar si hubo diferencia en la seguridad y la efectividad entre diferentes tratamientos para la subfertilidad masculina. Se necesita más investigación.
PICOs
Resumen en términos sencillos
Tratamientos para la subfertilidad masculina
Pregunta de la revisión
Los autores Cochrane revisaron las pruebas acerca de la efectividad de diferentes tratamientos para parejas con subfertilidad masculina.
Antecedentes
La inseminación intrauterina (IIU), la fecundación in vitro (FIV) y la inyección intracitoplasmática de espermatozoides (ICSI) son tratamientos de fertilidad utilizados con frecuencia en parejas con fertilidad masculina baja (subfertilidad). En la IIU, los espermatozoides del hombre se preparan y se colocan en el útero. Por lo tanto, los espermatozoides se colocan cerca del lugar donde se forma el embrión (sitio de concepción). La IIU se puede realizar con o sin hiperestimulación ovárica (HEO). En un ciclo de HEO, las pacientes reciben fármacos para estimular los ovarios (los órganos que producen los óvulos [llamados ovocitos]) para aumentar el número de ovocitos disponibles. Los efectos secundarios principales de estos fármacos son el embarazo múltiple (producción de dos o más embriones [estadio inicial en el desarrollo de un feto]) y el síndrome de hiperestimulación ovárica (SHEO; los ovarios producen demasiados óvulos). En la FIV y la ICSI, la fecundación (cuando el óvulo y el espermatozoide se unen y forman un embrión) ocurre fuera del cuerpo. Los ovocitos se recuperan de la paciente mediante una aguja guiada por ecografía que penetra por la pared vaginal hasta alcanzar los ovarios. A través de esta aguja se puede aspirar el líquido folicular que contiene el ovocito. Es frecuente retirar entre diez y 15 ovocitos. En la FIV, los óvulos se mezclan con los espermatozoides en una placa de cultivo. En la ICSI, el espermatozoide se inyecta directamente en los ovocitos para lograr la fertilización. Los ovocitos fertilizados son tratados durante dos a seis días en un medio que contiene nutrientes y luego se colocan en el útero.
Características de los estudios
Se efectuaron búsquedas en las bases de datos médicas en busca de ensayos controlados aleatorios (estudios clínicos donde los pacientes se asignan al azar a uno de dos o más grupos de tratamiento) que investigaran la subfertilidad masculina. Se encontraron diez ensayos controlados aleatorios, todos compararon tratamientos diferentes en parejas con subfertilidad masculina, con un total de 757 parejas. Los estudios evaluaron las siguientes opciones de tratamiento: coito programado (CP; donde la relación sexual ocurrió en el momento recomendado en el ciclo menstrual) (con o sin HEO), IIU (con o sin HEO), FIV e ICSI. Las pruebas estaban actualizadas hasta abril 2015. El interés se centró principalmente en determinar cuántas mujeres tuvieron nacidos vivos y SHEO.
Resultados clave
No se encontraron pruebas de una diferencia en las tasas de nacidos vivos o embarazo entre los tratamientos. Tampoco se encontraron pruebas de una diferencia entre ninguno de los grupos en las tasas de efectos adversos (embarazo múltiple, aborto espontáneo). Los datos disponibles sobre el SHEO fueron demasiado limitados para poder establecer conclusiones.
Calidad de la evidencia
La mayoría de las pruebas fueron de baja o muy baja calidad. Las limitaciones principales fueron que no se describieron los métodos de estudio, los tamaños pequeños de la muestra y la inconsistencia en la forma en la que se realizaron los ensayos. Las pruebas estaban disponibles sólo para seis de las 14 comparaciones evaluadas. Se necesita más investigación.
Conclusiones de los autores
Summary of findings
| IUI in natural cycles compared to TI in natural cycles for male subfertility | ||||||
| Patient or population: couples with male subfertility | ||||||
| Outcomes | Illustrative comparative risks* (95% CI) | Relative effect | No of couples (studies) | Quality of the evidence | Comments | |
| Assumed risk | Corresponding risk | |||||
| TI in natural cycles | IUI in natural cycles | |||||
| Live birth rate | Not reported in any included studies | ‐ | ‐ | |||
| OHSS | Not reported in any included studies | ‐ | ‐ | |||
| Pregnancy rate per couple (all cycles) | 0 per 1000 | 0 per 1000 | OR 4.57 | 62 | ⊕⊝⊝⊝ | ‐ |
| *The basis for the assumed risk was the median control group risk across studies. The corresponding risk (and its 95% confidence interval) is based on the assumed risk in the comparison group and the relative effect of the intervention (and its 95% CI). | ||||||
| GRADE Working Group grades of evidence | ||||||
| 1 Risk of bias was very serious: 1. Francavilla 2009, allocation concealment: high risk (on chronological basis), 2. Francavilla 2009, other bias: high risk (no stratification by diagnosis category of subfertility). | ||||||
| IUI in stimulated cycles compared to TI in stimulated cycles for male subfertility | ||||||
| Patient or population: couples with male subfertility | ||||||
| Outcomes | Illustrative comparative risks* (95% CI) | Relative effect | No of couples (studies) | Quality of the evidence | Comments | |
| Assumed risk | Corresponding risk | |||||
| TI in stimulated cycles | IUI in stimulated cycles | |||||
| Live birth rate per couple (all cycles) | 220 per 1000 | 200 per 1000 | OR 0.89 | 81 | ⊕⊕⊝⊝ | ‐ |
| OHSS per couple Follow‐up: 6 months | See comment | See comment | Not estimable | 59 (1 study) | ⊕⊕⊝⊝ | ‐ |
| Pregnancy rate per couple (all cycles) | 175 per 1000 | 243 per 1000 | OR 1.51 | 202 | ⊕⊝⊝⊝ | ‐ |
| Multiple pregnancy rate per couple | 0 per 1000 | 0 per 1000 | OR 3.15 | 81 | ⊕⊕⊝⊝ | ‐ |
| Miscarriage rate per couple | 73 per 1000 | 75 per 1000 | OR 1.03 | 81 | ⊕⊕⊝⊝ | ‐ |
| *The basis for the assumed risk was the median control group risk across studies. The corresponding risk (and its 95% confidence interval) is based on the assumed risk in the comparison group and the relative effect of the intervention (and its 95% CI). | ||||||
| GRADE Working Group grades of evidence | ||||||
| 1 There was very serious imprecision, with small sample size. | ||||||
| IUI in stimulated cycles compared to TI in natural cycles for male subfertility | ||||||
| Patient or population: couples with male subfertility | ||||||
| Outcomes | Illustrative comparative risks* (95% CI) | Relative effect | No of couples (studies) | Quality of the evidence | Comments | |
| Assumed risk | Corresponding risk | |||||
| TI in natural cycles | IUI in stimulated cycles | |||||
| Live birth rate per couple (all cycles) | 0 per 1000 | 0 per 1000 | OR 3.14 | 44 | ⊕⊝⊝⊝ | ‐ |
| OHSS | Not reported in any included studies | ‐ | ||||
| Pregnancy rate per couple (all cycles) | 0 per 1000 | 0 per 1000 | OR 3.14 | 44 | ⊕⊝⊝⊝ | ‐ |
| *The basis for the assumed risk was the median control group risk across studies. The corresponding risk (and its 95% confidence interval) is based on the assumed risk in the comparison group and the relative effect of the intervention (and its 95% CI). | ||||||
| GRADE Working Group grades of evidence | ||||||
| 1 Risk of bias was very serious: 1. Allocation concealment: high risk (on chronological basis), 2. Other bias: high risk (no stratification by diagnosis category of subfertility). | ||||||
| IUI in stimulated cycles compared to IUI in natural cycles for male subfertility | ||||||
| Patient or population: couples with male subfertility | ||||||
| Outcomes | Illustrative comparative risks* (95% CI) | Relative effect | No of couples | Quality of the evidence | Comments | |
| Assumed risk | Corresponding risk | |||||
| IUI in natural cycles | IUI in stimulated cycles | |||||
| Live birth rate per couple (all cycles) | 172 per 1000 | 218 per 1000 | OR 1.34 | 346 | ⊕⊝⊝⊝ | ‐ |
| OHSS | Not reported in any included studies | ‐ | ‐ | |||
| Pregnancy rate per couple (all cycles) | 148 per 1000 | 226 per 1000 | OR 1.68 | 399 | ⊕⊝⊝⊝ | ‐ |
| Miscarriage rate per couple | 53 per 1000 | 56 per 1000 | OR 1.06 | 115 | ⊕⊝⊝⊝ | ‐ |
| *The basis for the assumed risk was the median control group risk across studies. The corresponding risk (and its 95% confidence interval) is based on the assumed risk in the comparison group and the relative effect of the intervention (and its 95% CI). | ||||||
| GRADE Working Group grades of evidence | ||||||
| 1 Risk of bias was very serious: 1. Francavilla 2009, allocation concealment: high risk (on chronological basis), 2. Arici 1994, Francavilla 2009, and Guzick 1999, other bias: high risk (no stratification by diagnosis category of subfertility. | ||||||
| IVF compared to IUI in natural cycles for male subfertility | ||||||
| Patient or population: couples with male subfertility | ||||||
| Outcomes | Illustrative comparative risks* (95% CI) | Relative effect | No of couples (studies) | Quality of the evidence | Comments | |
| Assumed risk | Corresponding risk | |||||
| IUI in natural cycles | IVF | |||||
| Live birth rate per couple (all cycles) | 407 per 1000 | 346 per 1000 | OR 0.77 | 53 | ⊕⊕⊝⊝ | ‐ |
| OHSS | Not reported in any included studies | ‐ | ‐ | |||
| *The basis for the assumed risk was the median control group risk across studies. The corresponding risk (and its 95% confidence interval) is based on the assumed risk in the comparison group and the relative effect of the intervention (and its 95% CI). | ||||||
| GRADE Working Group grades of evidence | ||||||
| 1 There was very serious imprecision, with small sample sizes. | ||||||
| IVF compared to IUI in stimulated cycles for male subfertility | ||||||
| Patient or population: couples with male subfertility | ||||||
| Outcomes | Illustrative comparative risks* (95% CI) | Relative effect | No of couples (studies) | Quality of the evidence | Comments | |
| Assumed risk | Corresponding risk | |||||
| IUI in stimulated cycles | IVF | |||||
| Live birth rate per couple (all cycles) | 452 per 1000 | 460 per 1000 | OR 1.03 | 86 | ⊕⊝⊝⊝ | ‐ |
| OHSS per couple | See comment | See comment | Not estimable | 36 | ⊕⊝⊝⊝ | No OHSS occurred |
| Pregnancy rate per couple (all cycles) | 611 per 1000 | 666 per 1000 | OR 1.27 | 36 | ⊕⊝⊝⊝ | ‐ |
| *The basis for the assumed risk was the median control group risk across studies. The corresponding risk (and its 95% confidence interval) is based on the assumed risk in the comparison group and the relative effect of the intervention (and its 95% CI). | ||||||
| GRADE Working Group grades of evidence | ||||||
| 1 Risk of bias was serious: Bensdorp 2015, other bias: high risk (no stratification by diagnosis category of subfertility). | ||||||
Antecedentes
Descripción de la afección
La subfertilidad masculina es una afección frecuente entre las parejas con subfertilidad. Se ha estimado que es directamente responsable de aproximadamente el 30% de los problemas con la concepción y es un factor contribuyente en el 50%(Crosignani 1994; Hull 1985). Con el transcurso del tiempo se han utilizado diferentes definiciones de subfertilidad masculina. Se ha descrito que una muestra de semen de calidad normal tiene una concentración de espermatozoides de 20 millones/ml o mayor, una movilidad del 50% o mayor, una morfología normal en el 50% o mayor y no presenta anticuerpos contra los espermatozoides (WHO 1987). En 1992, la Organización Mundial de la Salud (OMS) cambió sus criterios respecto a la morfología de los espermatozoides del 50% al 30% (WHO 1992). Cuando se aplicaron criterios estrictos para la morfología, se consideró normal un valor mayor del 14% (Kruger 1993). Since 2010, los valores de referencia para una muestra de semen de calidad normal se han revisado y los cambios más importantes en los límites de referencia fueron el volumen del semen de 1,5 ml o mayor, una concentración de espermatozoides de 15 millones/ml o mayor, movilidad total del 40% o mayor y morfología normal en el 4% o mayor (Cooper 2010; WHO 2010). A pesar del uso global de los criterios de la OMS, éstos no pueden distinguir a los hombres que tienen probabilidades de ser padres de un niño de los hombres que no pueden. Sin embargo, se ha establecido una correlación continua entre el recuento total de espermatozoides móviles (RTEM) y la probabilidad de concepción natural (van der Steeg 2011). En las parejas a las que se les realiza inseminación intrauterina (IIU), el RTEM también parece tener una relación directa consistente con la tasa de embarazo pero no hay un umbral predictivo definitivo para el éxito (Tijani 2010). El RTEM poslavado probablemente tiene un valor más predictivo porque refleja la concentración de espermatozoides y la movilidad, así como los efectos del procesamiento de los espermatozoides(van Weert 2004). Debido a las diferentes definiciones de la subfertilidad masculina en todo el mundo es difícil calcular qué proporción de los tratamientos de fertilidad se asocia con esta indicación, o cómo afecta la tasa general de éxito.
Descripción de la intervención
La IIU es un tratamiento de fertilidad utilizado con frecuencia en parejas con subfertilidad masculina (Cohlen 2005; Goverde 2000) En la IIU, un pequeño volumen de semen preparado se inyecta transcervicalmente en la cavidad uterina alrededor del tiempo previsto de la ovulación. El fundamento detrás de este procedimiento es obviar el cuello uterino y llevar el semen más cerca del oocito liberado. Además, el lavado del semen y la selección de los espermatozoides móviles (mediante la preparación del semen) quizás aumente de forma adicional las posibilidades de fecundación (Duran 2002a). Se ha argumentado que el método de preparación de espermatozoides podría influir en la probabilidad de concepción (Duran 2002b), pero no hay pruebas suficientes para recomendar alguna técnica de preparación específica(Boomsma 2007). La IIU puede usarse con o sin hiperestimulación ovárica (HEO), que aumenta el número de oocitos disponibles en el sitio de la concepción. También se ha sugerido que superaría los trastornos sutiles de ovulación que no pueden detectarse mediante las investigaciones habituales (Zikopoulos 2005). La HEO se logra mediante la administración de fármacos, como antiestrógenos (p.ej., citrato de clomifeno) o gonadotropinas, a menudo en combinación con agonistas o, más recientemente, antagonistas de la hormona liberadora de gonadotropina (GnRH) (Cantineau 2007).
En ciclos naturales, el aumento preovulatorio de la hormona luteinizante (LH) es el mejor indicador del inicio de la ovulación (WHO 1980). La ovulación se produce entre 35 y 38 horas después del comienzo del ascenso de la LH en sangre (Hoff 1983; Testart 1982). En ciclos estimulados, las posibilidades del momento adecuado aumentan por la administración de una inyección de gonadotrofina coriónica humana (hCG) desencadenante de la ovulación. Para calcular el momento para la inyección de hCG, se determina el diámetro del folículo más grande (principalmente 16 mm a 18 mm) mediante mediciones ecográficas. Se ha determinado que el folículo más grande es el que tiene mayores probabilidades de ruptura, que ocurrirá aproximadamente 38 horas después de la inyección de hCG Testart 1982). Martinez 1991). Por tanto, es sumamente favorable realizar la inseminación cerca de 35 a 45 horas después de la administración de hCG.
Otros tratamientos de fertilidad, más invasivos y costosos, para parejas con subfertilidad masculina son la fecundación in vitro (FIV) y la inyección intracitoplasmática de espermatozoides (ICSI). Ambos métodos utilizan la hiperestimulación ovárica controlada (HEOC), que se propone tres objetivos principales: la supresión de la actividad de la hipófisis, la estimulación del crecimiento de múltiples folículos y la inducción de la ovulación. La supresión de la actividad de la hipófisis, mediante un agonista o antagonista de la GnRH, impide la ovulación prematura y permite la obtención programada de los ovocitos maduros. La hormona foliculoestimulante (FSH), en ocasiones combinada con la LH, se utiliza para estimular el crecimiento de los múltiples folículos. La ovulación es inducida por la hCG o un agonista de la GnRH y se indica cuando están presentes múltiples folículos de 16 mm o más mediante las mediciones ecográficas. El momento óptimo para la inducción de la ovulación todavía no está claro y se necesitan más estudios para determinarlo (Mochtar 2011; Tarlatzis 2006). La recuperación de los ovocitos se realiza aproximadamente a las 36 horas después de la administración de la hCG o un agonista de la GnRH. En la FIV, los ovocitos y los espermatozoos recuperados se unen en una placa de cultivo para lograr la fecundación; en la ICSI, un espermatozoide único seleccionado se inyecta directamente en el citoplasma del ovocito. El objetivo de la ICSI es superar la posibilidad de que los espermatozoides no puedan activar el ovocito para iniciar la fecundación. Después de la fecundación, los ovocitos fertilizados se cultivan en un medio de crecimiento durante dos a seis días y se monitoriza el desarrollo embrionario. Según criterios morfológicos de calidad, se transfiere un par de embriones a la cavidad uterina y los embriones supernumerarios de buena calidad son criopreservados. La suplementación en la fase luteínica con progesterona o hCG es necesaria para mantener la estimulación del endometrio.
De qué manera podría funcionar la intervención
La IIU, la FIV y la ICSI se utilizan para mejorar las tasas de nacidos vivos en parejas que presentan subfertilidad masculina.
Por qué es importante realizar esta revisión
El uso de tratamientos de fertilidad en la subfertilidad masculina ha sido motivo de debate. Algunos autores consideran que la IIU se debe ofrecer como tratamiento de primera línea antes de ofrecer la FIV y la ICSI (Bhattachary 2000; Cohlen 2005; Goverde 2000; Gregoriou 1996; Nan 1994). Otros autores han cuestionado su efectividad en la subfertilidad masculina (Guzick 1998). También se ha indicado que la IIU en la subfertilidad masculina tendría una mayor ventaja solamente cuando se puede alcanzar un determinado valor umbral de recuento de espermatozoides móviles (van Voorhis 2001; van Weert 2004). Cuando se utiliza la HEO para mejorar la efectividad de la IIU, aumenta la prevalencia del síndrome de hiperestimulación ovárica (SHEO) y las tasas de embarazo múltiple. Las guías más recientes del National Institute for Health and Care Excellence (NICE) señalan que para la subfertilidad masculina leve, el uso habitual de la IIU, o con o sin HEO no es apropiado. En cambio, se recomienda la conducta expectante por dos años, antes de considerar la FIV (NICE 2013). Otros autores recomiendan la conducta expectante (durante al menos seis meses) sobre la IIU (u otros tratamientos de fertilidad) en parejas con subfertilidad inexplicada o de factor masculino moderada (RTEM mayor de 3 000 000) y un pronóstico bueno o intermedio para la concepción natural (Hunault 2004; Steures 2006). La FIV, introducida a finales de los años setenta como un tratamiento para la infertilidad tubárica, también se ha propuesto como una opción terapéutica para la subfertilidad masculina (Cohen 1984). Las comparaciones directas y aleatorias entre la FIV y la IIU son escasas y a favor de la última con respecto a la relación entre costo y efectividad (Bensdorp 2015; Goverde 2000; Tjon‐Kon‐Fat 2015). Sin embargo, no hay un valor límite claro de calidad del semen para apoyar la elección de la FIV o la IIU. La ICSI proporciona la posibilidad de descendencia genética incluso en pacientes con parámetros de semen gravemente comprometidos (Palermo 1992). Más recientemente, el uso de la ICSI ha aumentado también en los hombres con características del semen marginales o incluso normales, sin pruebas claras de sus efectos beneficiosos(Bhattachary 2001; Kim 2007) o incluso de sus posibles efectos perjudiciales (Boulet 2015). Los valores límite de los parámetros del semen utilizados para decidir entre la FIV convencional y la ICSI generalmente se basan en la experiencia (Tournaye 2012), y varían por país / centro / laboratorio. Realizar un ciclo dividido de FIV‐ICSI en el que ovocitos hermanos se inseminan convencionalmente o por microinyección, puede impedir el fracaso completo de la fecundación en uno de cuatro ciclos de FIV para la subfertilidad de factor masculino moderada (Kihaile 2003; van der Westenlaken 2005).
Esta revisión investigó los efectos beneficiosos y las desventajas de la conducta expectante o el coito programado (CP), la IIU con o sin HEO, la FIV y la ICSI en parejas con subfertilidad masculina.
Objetivos
Evaluar la efectividad y la seguridad de diferentes tratamientos de fertilidad (conducta expectante, coito programado [CP], IIU, FIV e ICSI) para las parejas con subfertilidad que parece deberse a parámetros anormales de los espermatozoides.
Métodos
Criterios de inclusión de estudios para esta revisión
Tipos de estudios
Se incluyeron ensayos controlados aleatorios publicados y no publicados (ECA). Se evaluó el método de asignación al azar para determinar si los estudios se asignaron al azar verdaderamente. En el caso de los ensayos cruzados (crossover), solamente se incluyeron si estuvieron disponibles los datos antes del cruzamiento. Se incluirían los ensayos con un subgrupo de participantes con subfertilidad masculina si hubiera datos disponibles de este subgrupo.
Tipos de participantes
Fueron elegibles para inclusión las parejas con subfertilidad masculina que hubieran tratado de concebir por al menos un año. Se incluyeron todas las parejas con subfertilidad de factor masculino, que incluyó oligospermia, teratospermia, astenospermia o una combinación de éstas, preferentemente medidas por dos muestras de semen separadas.
La evaluación habitual de la fertilidad debería consistir en un gráfico confirmatorio del estado ovulatorio (temperatura corporal basal [TCB], progesterona en la fase luteínica media o pruebas ecográficas de ovulación) y bajo riesgo de patología tubárica según los antecedentes médicos (Coppus 2007).
Tipos de intervenciones
Se incluyeron ECA con al menos una de las siguientes comparaciones:
-
IIU versus CP o conducta expectante, ambos en ciclos naturales;
-
IIU versus CP, ambos en ciclos con HEO;
-
IIU en ciclos naturales versus CP en ciclos con HEO;
-
IIU en ciclos con HEO versus CP o conducta expectante en ciclos naturales;
-
IIU en ciclos naturales versus IIU en ciclos con HEO;
-
FIV versus CP o conducta expectante en ciclos naturales;
-
FIV versus CP en ciclos con HEO;
-
FIV versus IIU en ciclos naturales;
-
FIV versus IIU en ciclos con HEO;
-
ICSI versus CP o conducta expectante en ciclos naturales;
-
ICSI versus CP en ciclos con HEO;
-
ICSI versus IIU en ciclos naturales;
-
ICSI versus IIU en ciclos con HEO;
-
ICSI versus FIV.
Se excluyeron los ensayos que compararon métodos para realizar la inseminación diferentes de la IIU, como la inseminación intracervical (IIC), la transferencia de gametos a través de las trompas de Falopio (TGTF) y perfusión de espermatozoides en las trompas de Falopio. Además, se excluyeron los ensayos que compararon diferentes tipos de protocolo de estimulación ovárica, ya que este es el tema de otra revisión (Cantineau 2007).
Tipos de medida de resultado
Resultados primarios
-
Tasa de nacidos vivos, definido como el parto de un feto vivo después de las 20 semanas completas de edad gestacional, por pareja.
-
Incidencia de SHEO por pareja.
Resultados secundarios
-
Tasas de embarazo (clínico), definido como pruebas de una bolsa gestacional, confirmado por ecografía, por pareja.
-
Tasas de embarazos múltiples.
-
Abortos espontáneos.
-
Tasas totales de fracaso de la fecundación por pareja durante la FIV.
Results
Description of studies
Results of the search
The search strategy identified 2778 studies; after removing duplicates, 1854 studies remained. Handsearching identified another 18 studies. One review author (MC) screened the titles and abstracts and selected 49 studies for further evaluation. We excluded 36 studies with reasons and three studies were awaiting classification. Finally, the review included 10 studies (see Figure 1).
Included studies
Study design
Four of the 10 studies used a parallel design (Bensdorp 2015; Goverde 2000; Guzick 1999; Melis 1995). Bensdorp 2015 and Guzick 1999 published no separate data for male subfertility, but after correspondence with the first author and the author of another review (Veltman‐Verhulst 2012), we could extract relevant data. Six studies used a cross‐over design (Arici 1994; Cohlen 1998a; Francavilla 2009; Gregoriou 1996; Kerin 1984; Nan 1994). We only pooled pre‐cross‐over data in the meta‐analysis. Three studies were three‐arm trials (Bensdorp 2015; Francavilla 2009; Goverde 2000).
Elementary details concerning the studies are displayed in the Characteristics of included studies table.
Participants
The number of participants (couples) reported in the 10 included studies was 757. The sample size ranged from 21 to 254 couples.
Interventions
1. IUI versus TI or expectant management both in natural cycles
We extracted suitable data from one trial comparing IUI versus TI (Kerin 1984). The authors of Francavilla 2009 supplied unpublished pre‐cross‐over data. In Kerin 1984, one of the treatment arms instructed the participants to have "a single act of vaginal intercourse on the day the couple thought they were most fertile as detected by symptom thermal methods of ovulation detection", which can be considered to be expected management. No specifications regarding the number of outcomes were reported for this treatment arm.
2. IUI versus TI both in cycles with OH
One parallel trial addressed IUI versus TI both in cycles with OH (Melis 1995), and another two trials provided data after the first treatment period after one (Gregoriou 1996) and three (Nan 1994) cycles.
3. IUI in natural cycles versus TI in cycles with OH
We found no trials comparing IUI in natural cycles versus TI in cycles with OH.
4. IUI in cycles with OH versus TI or expectant management in natural cycles
The authors of Francavilla 2009 supplied unpublished pre‐cross‐over data.
5. IUI in cycles with OH versus IUI in natural cycles
Two parallel trials (Goverde 2000; Guzick 1999), and three cross‐over trials reported and provided data comparing IUI in natural cycles versus IUI in cycles with OH (Arici 1994; Cohlen 1998a; Francavilla 2009). Arici 1994 and Francavilla 2009 submitted unpublished data to another review from which we could extract separate data. Cohlen 1998a provided pre‐cross‐over per couple data.
6. IVF versus TI or expectant management in natural cycles
We found no trials comparing IVF versus TI or expectant management in natural cycles.
7. IVF versus TI in cycles with OH
We found no trials comparing IVF versus TI in cycles with OH.
8. IVF versus IUI in natural cycles
One parallel trial compared IVF versus IUI in natural cycles (Goverde 2000).
9. IVF versus IUI in cycles with OH
Two parallel trials compared IVF versus IUI in cycles with OH (Bensdorp 2015; Goverde 2000).
10. ICSI versus TI or expectant management in natural cycles
We found no trials comparing ICSI versus TI or expectant management in natural cycles.
11. ICSI versus TI in cycles with OH
We found no trials comparing ICSI versus TI in cycles with OH.
12. ICSI versus IUI in natural cycles
We found no trials comparing ICSI versus IUI in natural cycles.
13. ICSI versus IUI in cycles with OH
We found no trials comparing ICSI versus IUI in cycles with OH.
14. ICSI versus IVF
We found no trials comparing ICSI versus IVF.
Outcomes
Five studies provided our main outcome of interest; live birth rate per couple (Bensdorp 2015; Francavilla 2009; Goverde 2000; Guzick 1999; Melis 1995).The other five studies could provide data on pregnancy per couple (Arici 1994; Cohlen 1998a; Gregoriou 1996; Kerin 1984; Nan 1994). As most trials did not mention the results after each cycle separately, it was not possible to calculate cumulative pregnancy rates.
Two studies supplied information about OHSS in the mild male subfertility population (Bensdorp 2015; Nan 1994). For four studies, the OHSS data was not provided separately for the population with mild male subfertility (Francavilla 2009; Goverde 2000; Guzick 1999; Melis 1995). One study only provided the post‐cross‐over OHSS data (Cohlen 1998a).
Seven studies reported adverse outcomes (Bensdorp 2015; Cohlen 1998a; Goverde 2000; Guzick 1999; Kerin 1984; Melis 1995; Nan 1994). Six studies reported miscarriage or abortion (Bensdorp 2015; Cohlen 1998a; Francavilla 2009; Goverde 2000; Guzick 1999; Melis 1995). Eight studies reported multiple pregnancies (Bensdorp 2015; Cohlen 1998a; Francavilla 2009; Goverde 2000; Guzick 1999; Melis 1995; Kerin 1984; Nan 1994), and four studies reported ectopic pregnancies (Goverde 2000; Guzick 1999; Kerin 1984; Melis 1995).
Two studies did not state any adverse outcomes (Arici 1994; Gregoriou 1996).
Often the details on adverse effects were not provided for male subfertility separately, or at the end of the trial of post‐cross‐over. Therefore, we could not use these data in the review.
Excluded studies
We excluded 36 studies for the following reasons: 10 studies were not RCTs (retrospective or commentary design, not randomised or quasi randomised) (Elizur 2004; Galle 1990; Goverde 2001; Hewitt 1985; Moolenaar 2015; Nulsen 1993; Plachot 2002; Prentice 1995; Xie 2015; Zayed 1997). Eleven studies randomised oocytes instead of couples (Aboulghar 1995; Aboulghar 1996; Fan 2012; Fishel 2000; Kastrop 1999; Kihaile 2003; Li 2004; Pisarska 1999; Tournaye 2002; van der Westerlaken 2006; Verheyen 1999). In four studies, none of the comparisons of interest was included (Cruz 1986; Friedman 1989; Karlström 2000; Melis 1987). Two studies did not include male subfertility participants (Agarwal 2004; Elzeiny 2014). Two studies published incomplete data (Buvat 1990; Soliman 1993) and one study reported on biochemical pregnancies only (Evans 1991). To this date, we have received no response from the authors for additional information. Six studies with a cross‐over design could not supply their pre‐cross‐over data (Crosignani 1994; Ho 1989; Ho 1992; Kirby 1991; Martinez 1991; te Velde 1989). It is advocated that a particular concern with the cross‐over design is the risk of a carry‐over effect (Elbourne 2002; Khan 1996; McDonnell 2004). It may have been a source of bias and, therefore, we excluded these studies from the review. See the Characteristics of excluded studies table.
Studies awaiting classification
Three studies used a cross‐over design where no pre‐cross‐over data were published (Aribarg 1995; Jaroudi 1998; Kerin 1987). We attempted to contact authors to get these pre‐cross‐over data, but to this date, we have received no response.
Risk of bias in included studies
Figure 2 presents our judgements about each methodological quality item, presented as percentages across all included studies, and Figure 3 summarises our judgements about each methodological quality item for each included study.

Risk of bias graph: review authors' judgements about each risk of bias item presented as percentages across all included studies.

Risk of bias summary: review authors' judgements about each risk of bias item for each included study.
Study design
Of the 10 studies, four had a parallel design (Bensdorp 2015; Goverde 2000; Guzick 1999; Melis 1995). Six studies were of cross‐over alternating design, thus couples were initially randomised to one of the interventions and then alternated between treatment arms on each cycle. In Gregoriou 1996, the cross‐over took place after three cycles.
Allocation
The methods of randomisation or allocation concealment were generally poor in the published information, which might increase the risk for selection bias. However, we received additional information about allocation methods for some studies.
Random sequence generation
Five studies mentioned the use of a computer‐generated program for randomisation (Arici 1994; Bensdorp 2015; Goverde 2000; Guzick 1999; Melis 1995). One study used a random number table, not further specified (Nan 1994). The random sequence generation remained unclear for the other studies (Cohlen 1998a; Francavilla 2009; Gregoriou 1996; Kerin 1984). Sixty percent of the studies were at low risk of bias and 40% of the studies were at unclear risk of bias.
Allocation concealment
Four studies explicitly stated concealment of allocation (Bensdorp 2015; Cohlen 1998a; Goverde 2000; Melis 1995). After we had received additional information about allocation, we deemed two other trials at low risk of bias in this domain (Guzick 1999; Nan 1994). Concealment of allocation was done by the use of sealed opaque envelopes, locked computer files or white and black discs from a blinded bag. We deemed one study at high risk allocation concealment (Francavilla 2009). Concealment of allocation was done on chronological basis. The concealment of allocation was unclear for the other studies (Arici 1994; Gregoriou 1996; Kerin 1984). Sixty percent of the studies were at low risk of bias, 10% of the studies were at high risk of bias and 30% of the studies were at unclear risk of bias.
Blinding
None of the studies reported blinding. In trials comparing TI versus IUI or IUI versus IVF it is of course impossible to blind the participants. In trials of IUI with and without OH, blinding could technically be performed. However, often stimulation is administered intramuscularly, so blinding might be considered unethical. All studies were at low risk of bias with respect to blinding as we determined that it was unlikely to influence our review outcomes.
Incomplete outcome data
Nine studies reported information on drop‐outs, cancelled cycles, or both (Arici 1994; Bensdorp 2015; Cohlen 1998a; Francavilla 2009; Goverde 2000; Guzick 1999; Kerin 1984 ; Melis 1995; Nan 1994). The number of drop‐outs varied from 0% to 25%, the number of cancelled cycles varied from 4% to 19%. One study reported the drop‐out of 17 couples before the start of the first treatment cycle (failed to return, refused randomisation, other subfertility factors) and included 75% (56/75) of the couples in their analysis (Arici 1994). One study reported the drop‐out of 11 couples and included 88% (81/92) of the couples in their analysis (Melis 1995). Six studies reported on their drop‐outs and analysed 100% of the couples included in their study (Bensdorp 2015; Cohlen 1998a; Goverde 2000; Gregoriou 1996; Kerin 1984; Nan 1994). The proportion of analysed couples remained unclear in two studies (Francavilla 2009; Guzick 1999).
Four studies stated that the most important reasons for cancelling a cycle were a premature or missed LH surge and OHSS (Cohlen 1998a; Goverde 2000; Gregoriou 1996; Nan 1994). Furthermore, Goverde 2000 reported that in 37 cycles there was no fertilisation after insemination of the aspirated oocytes during IVF. Melis 1995 stated that the most important reasons for cancelling a cycle were a poor response to ovulation induction and exaggerated response to ovulation induction.
Eighty percent of the studies were at low risk of bias and 20% of the studies were at unclear risk of bias.
Selective reporting
A total of 50% of the included studies reported live birth rates. The remaining studies defined (clinical) pregnancy rates (see Characteristics of included studies table). Ten percent of the studies were at low risk of bias and 90% of the studies were at unclear risk of bias.
Other potential sources of bias
Six studies used a cross‐over design and there might be selectivity in availability of the data (Arici 1994; Cohlen 1998a; Francavilla 2009; Gregoriou 1996; Kerin 1984; Nan 1994). Forty percent of the studies were at low risk of bias and 60% of the studies were at high risk of bias.
Effects of interventions
See: Summary of findings for the main comparison IUI in natural cycles compared to TI in natural cycles for male subfertility; Summary of findings 2 IUI in stimulated cycles compared to TI in stimulated cycles for male subfertility; Summary of findings 3 IUI in stimulated cycles compared to TI in natural cycles for male subfertility; Summary of findings 4 IUI in stimulated cycles compared to IUI in natural cycles for male subfertility; Summary of findings 5 IVF compared to IUI in natural cycles for male subfertility; Summary of findings 6 IVF compared to IUI in stimulated cycles for male subfertility
See: summary of findings Table for the main comparison; summary of findings Table 2; summary of findings Table 3; summary of findings Table 4; summary of findings Table 5; summary of findings Table 6.
Overall the meta‐analyses included 10 studies with 757 couples. Three studies were three‐arm trials, in which each full group has been used twice in a pair‐wise comparison between arms.
1. IUI versus TI or expectant management both in natural cycles
Two studies compared IUI with TI both in natural cycles (Kerin 1984; Francavilla 2009).
Live birth rate per couple
Neither of the studies reported on live births.
OHSS
Neither of the studies reported on OHSS.
Pregnancy rate per couple
Both studies reported clinical pregnancy rate. There was no evidence of a difference in pregnancy rate per couple for IUI versus TI in natural cycles (2 trials, 62 couples: OR 4.57, 95% CI 0.21 to 101.61; very low quality evidence). There were no events in one of the studies (Figure 4; Analysis 1.1).
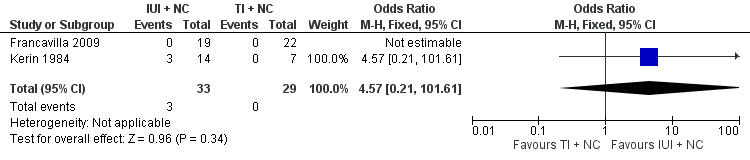
Forest plot of comparison: 1 Intra‐uterine insemination (IUI) versus timed intercourse (TI) both in natural cycles (NC), outcome: 1.1 Pregnancy rate per couple (all cycles).
Multiple pregnancy
Neither of the studies reported on multiple pregnancy.
Miscarriage
Neither of the studies reported on miscarriage.
2. IUI versus TI both in cycles with OH
Three studies compared IUI with TI both in cycles with OH (Gregoriou 1996; Melis 1995; Nan 1994).
Live birth rate per couple
One study reported on live birth rate. There was no evidence of a difference in live birth rate per couple for IUI versus TI in stimulated cycles (1 trial, 81 couples: OR 0.89, 95% CI 0.30 to 2.59; low quality evidence) (Analysis 2.1). In absolute terms, this result implied that a 22% success rate using TI with OH would become between 2% and 38% using IUI with OH.
OHSS
OHSS occurred in none of the cycles (Nan 1994) (Analysis 2.2).
Pregnancy rate per couple
There was no evidence of a difference in pregnancy rate per couple for IUI versus TI in stimulated cycles (3 trials, 202 couples: OR 1.51, 95% CI 0.74 to 3.07; I2 = 11%, very low quality evidence) (Figure 5; Analysis 2.3).

Forest plot of comparison: 2 Intra‐uterine insemination (IUI) versus timed intercourse (TI) both in cycles with ovarian hyperstimulation (OH), outcome: 2.3 Pregnancy rate per couple (all cycles).
Multiple pregnancy
There was no evidence of a difference in multiple pregnancy rate between IUI and TI in stimulated cycles (1 trial, 81 couples: OR 3.15, 95% CI 0.12 to 79.69; low quality evidence) (Analysis 2.4).
Miscarriage
There was no evidence of a difference in miscarriage rate per couple for IUI versus TI in stimulated cycles (1 trial, 81 couples: OR 1.03, 95% CI 0.19 to 5.42; low quality evidence) (Analysis 2.5).
3. IUI in natural cycles versus TI in cycles with OH
We found no trials comparing IUI in natural cycles versus TI in cycles with OH.
4. IUI in cycles with OH versus TI or expectant management in natural cycles
One study compared IUI with OH versus TI with natural cycles (Francavilla 2009).
Live birth rate per couple
One study reported on live birth rate. There was no evidence of a difference in live birth rate per couple for IUI with OH versus TI in natural cycles (1 trial, 44 couples: OR 3.14, 95% CI 0.12 to 81.35; very low quality evidence) (Analysis 4.1). In the TI group, there were no live births (0 of 29 couples), in the IUI group, 9% of couples had a live birth (3/33 couples).
OHSS
There were no (pre‐cross‐over) data available.
Pregnancy rate per couple
There was no evidence of a difference in pregnancy rate per couple for IUI with OH versus TI in natural cycles (1 trial, 44 couples: OR 3.14, 95% CI 0.12 to 81.35; very low quality evidence) (Figure 6; Analysis 4.2).
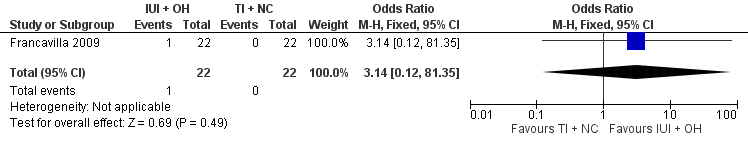
Forest plot of comparison: 4 Intra‐uterine insemination (IUI) in cycles with ovarian hyperstimulation (OH) versus timed intercourse (TI) in natural cycles (NC), outcome: 4.2 Pregnancy rate per couple (all cycles).
Multiple pregnancy
There were no (pre‐cross‐over) data available.
Miscarriage
There were no miscarriages reported.
5 IUI in cycles with OH versus IUI in natural cycles
Five studies compared IUI in cycles with OH with IUI in natural cycles (Arici 1994; Cohlen 1998a; Francavilla 2009; Goverde 2000; Guzick 1999).
Live birth rate per couple
One study reported on live births per treatment arm (Goverde 2000). Francavilla 2009 and Guzick 1999 provided data on live birth rate for the male subfertility group after we contacted them. There was no evidence of a difference in live birth rate per couple for IUI with OH versus IUI in natural cycles (3 trials, 346 couples: OR 1.34, 95% CI 0.77 to 2.33; I2 = 0%, very low quality evidence) (Analysis 5.1). In absolute terms, this result implied that a 17% success rate using IUI in natural cycles would become between 13% and 30% using IUI with OH.
OHSS
None of the studies reported on OHSS.
Pregnancy rate per couple
Four studies reported on pregnancy rate per couple, after one cycle (Arici 1994; Cohlen 1998a; Francavilla 2009) or several cycles (Guzick 1999). There was no evidence of a difference in pregnancy rate per couple for IUI with OH versus IUI in natural cycles (4 trials, 399 couples: OR 1.68, 95% CI 1.00 to 2.82; I2 = 0%, very low quality evidence) (Figure 7; Analysis 5.2).

Forest plot of comparison: 5 Intra‐uterine insemination (IUI) in natural cycles (NC) versus IUI in cycles with ovarian hyperstimulation (OH) versus IUI in natural cycles (NC), outcome: 5.2 Pregnancy rate per couple (all cycles).
Multiple pregnancy
None of the studies reported on multiple pregnancy.
Miscarriage
Two studies reported on miscarriage rate (Cohlen 1998a; Guzick 1999). There was no evidence of a difference in miscarriage rate per couple for IUI with OH versus IUI in natural cycles (2 trials, 115 couples: OR 1.06, 95% CI 0.20 to 5.63; very low quality evidence). There were no events in one of the studies (Analysis 5.3).
6. IVF versus TI or expectant management in natural cycles
We found no trials comparing IVF versus TI or expectant management in natural cycles.
7. IVF versus TI in cycles with OH
We found no trials comparing IVF versus TI in cycles with OH.
8. IVF versus IUI in natural cycles
One study compared IVF with IUI in natural cycles (Goverde 2000).
Live birth rate per couple
There was no evidence of a difference in live birth rate per couple for IVF versus IUI in natural cycles (1 trial, 53 couples: OR 0.77, 95% CI 0.25 to 2.35; low quality evidence) (Figure 8; Analysis 8.1). In absolute terms, this result implied that a 41% success rate using IUI in natural cycles would become between 9% and 61% using IVF.

Forest plot of comparison: 8 In vitro fertilisation (IVF) versus intra‐uterine insemination (IUI) in natural cycles (NC), outcome: 8.1 Live birth rate per couple (all cycles).
OHSS
Severe OHSS occurred in three women of the IVF group for the whole study arm of whom the majority had unexplained subfertility. It was unclear whether any of the couples with mild male subfertility developed OHSS.
Pregnancy rate per couple
None of the studies reported on pregnancy rate.
Multiple pregnancy
None of the studies reported on multiple pregnancy.
Miscarriage
None of the studies reported on miscarriage.
Total fertilisation failure
Total fertilisation failure occurred in 37 IVF cycles (male and unexplained subfertility).
9. IVF versus IUI in cycles with OH
Two studies compared IVF with IUI with OH cycles (Bensdorp 2015; Goverde 2000).
Live birth rate per couple
There was no evidence of a difference in live birth rate per couple for IVF versus IUI cycles with OH (2 trials, 86 couples: OR 1.03, 95% CI 0.43 to 2.45; I2 = 0%, very low quality evidence) (Figure 9; Analysis 9.1). In absolute terms, this result implied that a 45% success rate using IUI cycles with OH would become between 25% and 66% using IVF.

Forest plot of comparison: 9 In vitro fertilisation (IVF) versus intra‐uterine insemination (IUI) in cycles with ovarian hyperstimulation (OH), outcome: 9.1 Live birth rate per couple (all cycles).
OHSS
OHSS occurred in none of the IVF or IUI with OH cycles (Bensdorp 2015) (Analysis 9.2).
Pregnancy rate per couple
There was no evidence of a difference in pregnancy rate per couple for IVF versus IUI cycles with OH (1 trial, 36 couples: OR 1.27, 95% CI 0.33 to 4.97; low quality evidence) (Analysis 9.3).
Multiple pregnancy
Bensdorp 2015 reported two twins, one in the IUI with OH group, one in the IVF with single embryo transfer group.
Miscarriage
Bensdorp 2015 reported two miscarriages, one in the IUI with OH group, one in the IVF with single embryo transfer group.
Total fertilisation failure
Goverde 2000 reported total fertilisation failure in 37 IVF cycles (male and unexplained subfertility).
10. ICSI versus TI or expectant management in natural cycles
We found no trials comparing ICSI versus TI or expectant management in natural cycles.
11. ICSI versus TI in cycles with OH
We found no trials comparing ICSI versus TI in cycles with OH.
12. ICSI versus IUI in natural cycles
We found no trials comparing ICSI versus IUI in natural cycles.
13. ICSI versus IUI in cycles with OH
We found no trials comparing ICSI versus IUI in cycles with OH.
14. ICSI versus IVF
We found no trials comparing ICSI versus IVF.
Sensitivity analyses
The use of RRs and use of a random‐effects model did not substantially alter the findings for any of the comparisons and outcomes.
Discusión
Resumen de los resultados principales
El objetivo de esta revisión fue investigar la efectividad y la seguridad de los tratamientos para parejas con subfertilidad masculina con respecto a las tasas de nacidos vivos. Debido a que se considera que los ECA proporcionan la mejor evaluación de la efectividad de los tratamientos (Johnson 2003), en esta revisión solamente se incluyeron ECA. Los metanálisis pudieron incluir diez estudios, ver el Resumen de los hallazgos para la comparación principal; Resumen de los hallazgos 2; Resumen de los hallazgos 3; Resumen de los hallazgos 4; Resumen de los hallazgos 5; y Resumen de los hallazgos 6. Estos estudios informaron datos sobre seis de las comparaciones propuestas e incluyeron a 757 parejas con subfertilidad masculina a las que se les realizó tratamiento durante 4400 ciclos. Los ensayos de esta revisión revelaron que no hay pruebas de que una de las opciones de tratamiento sea superior a otra. Sin embargo, las pruebas disponibles son limitadas debido al pequeño tamaño de la muestra y a la falta de ensayos de alta calidad.
Compleción y aplicabilidad general de las pruebas
El resultado primario de esta revisión fue la tasa de nacidos vivos por pareja. No todos los ensayos informaron este resultado. Por otra parte, las pruebas estaban disponibles sólo para seis de las 14 comparaciones evaluadas. Se encontraron ECA que compararon la conducta expectante o el CP con la IIU, la IIU con y sin HEO y la IIU con la FIV. Desafortunadamente no se encontraron ECA que compararan FIV e ICSI. Aunque estos tratamientos se utilizan a nivel global a gran escala para la subfertilidad masculina, solamente se encontraron estudios que compararon la FIV y la ICSI en parejas con subfertilidad masculina con asignación aleatoria de los ovocitos a fecundación por inseminación o inyección solamente (Aboulghar 1995; Aboulghar 1996; Fan 2012; Fishel 2000; KaKastrop 1999; strop 1999; Kihaile 2003; Li 2004; Pisarska 1999; Tournaye 2002; van der Westerlaken 2006; Verheyen 1999). Los embriones, independientemente de la forma de fecundación, se transfirieron según la calidad. Por lo tanto, no fue posible establecer conclusiones sobre el efecto de la FIV o la ICSI sobre la tasa de embarazo en estos estudios.
Sólo algunos estudios informaron sobre los efectos adversos. A nivel global, el SHEO y las tasas de embarazo múltiple se consideran un resultado adverso en la práctica de la subfertilidad (Dias 2006; Healy 2004). El riesgo de mortalidad perinatal y morbilidad materna asociada con los embarazos múltiples se ha vuelto cada vez más inadmisible. Por tanto, el objetivo del tratamiento de fertilidad ha variado desde centrarse solamente en las tasas de embarazo hacia el nacimiento de un feto único, sano y a término (Fauser 2005). El uso de la HEO, como parte del tratamiento con IIU, aumenta el número de ovocitos disponibles en el sitio de la concepción por lo que podría aumentar la prevalencia de SHEO y las tasas de embarazo múltiple. En esta revisión no fue posible establecer a qué escala la IIU con HEO influye en el SHEO y las tasas de embarazo múltiple. En la bibliografía, solamente unos pocos estudios informaron las diferencias en las tasas de embarazo múltiple entre los tratamientos de fertilidad (Bensdorp 2015; Mansour 2014; Practice Committee of the ASRM 2012; Sullivan 2013). Bensdorp 2015 no encontró diferencias en el SHEO o la tasa de embarazo múltiple entre la IIU con HEO y la FIV con la transferencia de un único embrión en parejas que presentan subfertilidad masculina y no explicada. Desafortunadamente, otros estudios no informaron las tasas de SHEO en las parejas con subfertilidad masculina por separado y, por lo tanto, no fue posible establecer conclusiones firmes a partir de este estudio para las parejas que presentan subfertilidad masculina, debido a la falta de poder estadístico.
Con frecuencia se aplican los criterios de la OMS cuando se define la calidad normal del semen, pero tienen poco valor pronóstico. El embarazo se ha logrado mediante la IIU con semen que está por debajo de estos umbrales (Dickey 1999) y también hay hombres que presentan espermatozoides que cumplen estas normas y se ha encontrado que son infértiles (Hamilton 2015). Además, no se puede precisar la distinción entre subfertilidad masculina (parámetros de semen por debajo de los niveles de normalidad definidos por la OMS) y subfertilidad inexplicada (parámetros de semen por encima de los niveles de normalidad definidos por la OMS). Se han realizado muchos ensayos para analizar la relación entre calidad y parámetros del semen, o el REMT y la fertilidad natural. Para la práctica clínica, sería útil contar con una prueba que pudiera distinguir entre los hombres subfértiles pero con buenas probabilidades de concebir y los hombres con escasas probabilidades, en lugar de discriminar entre los hombres fértiles y subfértiles (Verhoeve 2006). Hay pruebas de una correlación continua entre el RTEM y la probabilidad de concepción natural (van der Steeg 2011). Todavía no se ha establecido la capacidad predictiva de los valores umbrales para el RTEM (poslavado), la movilidad progresiva, así como la función de la morfología de los espermatozoides (Matorras 1995; Ombelet 1997). Parece que la calidad del semen contribuye a la efectividad de la IIU (Duran 2002a; Ombelet 2003; Steures 2004; Tijani 2010; Wainer 2004), y que existe un umbral por debajo del cual la IIU ya no es efectiva (Dickey 1999; van Weert 2004). Además, la calidad del semen parece desempeñar una función en la predicción del fracaso total de la fecundación en los ciclos de FIV (Repping 2002; Rhemrev 2001).
Se han propuesto otras pruebas de detección en la subfertilidad masculina, como las pruebas de integridad del ácido desoxirribonucleico (ADN) espermático. Hay varias técnicas para medir la fragmentación bruta del ADN espermático (p.ej. prueba de estructura de la cromatina espermática [SCSA, por sus siglas en inglés], prueba de dispersión de la cromatina espermática [SCD, por sus siglas en inglés], prueba TUNEL [del inglés, terminal deoxyribonucleotide transferase‐mediated dUTP‐X Nick end‐labelling] y la prueba Comet). También se ha establecido una correlación entre la presencia de anomalías en el ADN espermático y el resultado del embarazo (Avendano 2010; Bakos 2008; Duran 2002a; Simon 2014). Debido a la exactitud discutible de estas pruebas para predecir las tasas de embarazo, no parecen utilizarse en la práctica (Practice Committee of the ASRM 2013).
Calidad de la evidencia
Ver Figura 2 y Figura 3.
La calidad de las pruebas para la mayoría de las comparaciones era baja o muy baja. El método de asignación al azar y la ocultación de la asignación no estuvieron claros en algunos ensayos. No fue posible realizar el cegamiento debido a la naturaleza de las intervenciones, pero fue poco probable que afectara los resultados en esta revisión. Los ensayos incluidos en el metanálisis tuvieron varias limitaciones, que fueron muy prominentes en los estudios más antiguos. Estos estudios tuvieron tamaños de la muestra pequeños, utilizaron un diseño cruzado, tuvieron una duración limitada del seguimiento que fue desigual entre los estudios y la definición de subfertilidad masculina y los protocolos clínicos utilizados variaron entre los estudios. La calidad metodológica de los estudios con un diseño cruzado en los ensayos de fertilidad ha sido tema de debate. Un diseño cruzado podría dar lugar a una sobrestimación del efecto del tratamiento (Khan 1996; Norman 2000). Todavía no está claro si esta sobrestimación se podría corregir estadísticamente o si es clínicamente relevante (Cohlen 1998b; McDonnell 2004; Vail 2003), por lo tanto, solamente se utilizaron los datos antes del cruzamiento. Además, la mayoría de los estudios determinó las tasas de embarazo como la variable principal de evaluación, mientras que la tasa de nacidos vivos fue el resultado primario de esta revisión. Las últimas guías Cochrane actualizadas para el análisis y la presentación de los resultados enfatizan el uso de tasas de embarazo y nacidos vivos por mujer o pareja en el metanálisis. Sin embargo, en la práctica, estos datos no están siempre disponibles.
Sesgos potenciales en el proceso de revisión
Las búsquedas tuvieron por objeto identificar todos los estudios potencialmente elegibles. Además de los sesgos potenciales analizados anteriormente, podría haber algún sesgo debido a las definiciones diferenciales de subfertilidad masculina. Los ensayos utilizaron distintas definiciones para el número de muestras requeridas, cuántos y que parámetros se evaluaron y los umbrales que posteriormente se aplicaron para la inclusión. La mayoría de los ensayos utilizó los criterios de la OMS, en conformidad con el año de realización del estudio.
Acuerdos y desacuerdos con otros estudios o revisiones
La conclusión de la versión anterior de esta revisión y de otra revisión coincidió con los resultados de la presente revisión (Bensdorp 2007a; Tournaye 2012). La revisión Cochrane sobre el uso de la IIU en parejas que presentaban subfertilidad no explicada encontró pruebas de una tasa mayor de embarazo con la IIU versus el CP, ambos en ciclos estimulados Tournaye 2012). Esta revisión también encontró una tasa mayor de nacidos vivos con la IIU con ciclos con HEO versus la IIU en ciclos naturales. No hubo pruebas de una diferencia en las tasas de embarazo múltiple. En la revisión Cochrane sobre el uso de FIV versus conducta expectante o IIU con HEO en parejas que presentaban subfertilidad no explicada las pruebas de una diferencia fueron no concluyentes (Pandian 2012).

Risk of bias graph: review authors' judgements about each risk of bias item presented as percentages across all included studies.
Risk of bias summary: review authors' judgements about each risk of bias item for each included study.
Forest plot of comparison: 1 Intra‐uterine insemination (IUI) versus timed intercourse (TI) both in natural cycles (NC), outcome: 1.1 Pregnancy rate per couple (all cycles).
Forest plot of comparison: 2 Intra‐uterine insemination (IUI) versus timed intercourse (TI) both in cycles with ovarian hyperstimulation (OH), outcome: 2.3 Pregnancy rate per couple (all cycles).
Forest plot of comparison: 4 Intra‐uterine insemination (IUI) in cycles with ovarian hyperstimulation (OH) versus timed intercourse (TI) in natural cycles (NC), outcome: 4.2 Pregnancy rate per couple (all cycles).
Forest plot of comparison: 5 Intra‐uterine insemination (IUI) in natural cycles (NC) versus IUI in cycles with ovarian hyperstimulation (OH) versus IUI in natural cycles (NC), outcome: 5.2 Pregnancy rate per couple (all cycles).
Forest plot of comparison: 8 In vitro fertilisation (IVF) versus intra‐uterine insemination (IUI) in natural cycles (NC), outcome: 8.1 Live birth rate per couple (all cycles).
Forest plot of comparison: 9 In vitro fertilisation (IVF) versus intra‐uterine insemination (IUI) in cycles with ovarian hyperstimulation (OH), outcome: 9.1 Live birth rate per couple (all cycles).

Comparison 1 Intra‐uterine insemination (IUI) versus timed intercourse (TI) both in natural cycles (NC), Outcome 1 Pregnancy rate per couple (all cycles).

Comparison 2 Intra‐uterine insemination (IUI) versus timed intercourse (TI) both in cycles with ovarian hyperstimulation (OH), Outcome 1 Live birth rate per couple (all cycles).

Comparison 2 Intra‐uterine insemination (IUI) versus timed intercourse (TI) both in cycles with ovarian hyperstimulation (OH), Outcome 2 OHSS per couple.
Comparison 2 Intra‐uterine insemination (IUI) versus timed intercourse (TI) both in cycles with ovarian hyperstimulation (OH), Outcome 3 Pregnancy rate per couple (all cycles).

Comparison 2 Intra‐uterine insemination (IUI) versus timed intercourse (TI) both in cycles with ovarian hyperstimulation (OH), Outcome 4 Multiple pregnancy rate per couple.

Comparison 2 Intra‐uterine insemination (IUI) versus timed intercourse (TI) both in cycles with ovarian hyperstimulation (OH), Outcome 5 Miscarriage rate per couple.
Comparison 4 Intra‐uterine insemination (IUI) in cycles with ovarian hyperstimulation (OH) versus timed intercourse (TI) in natural cycles (NC), Outcome 1 Live birth rate per couple (all cycles).
Comparison 4 Intra‐uterine insemination (IUI) in cycles with ovarian hyperstimulation (OH) versus timed intercourse (TI) in natural cycles (NC), Outcome 2 Pregnancy rate per couple (all cycles).
Comparison 5 Intra‐uterine insemination (IUI) in cycles with ovarian hyperstimulation (OH) versus IUI in natural cycles (NC), Outcome 1 Live birth rate per couple (all cycles).
Comparison 5 Intra‐uterine insemination (IUI) in cycles with ovarian hyperstimulation (OH) versus IUI in natural cycles (NC), Outcome 2 Pregnancy rate per couple (all cycles).
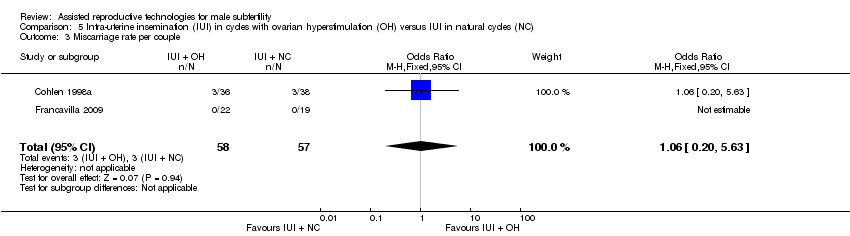
Comparison 5 Intra‐uterine insemination (IUI) in cycles with ovarian hyperstimulation (OH) versus IUI in natural cycles (NC), Outcome 3 Miscarriage rate per couple.
Comparison 8 In vitro fertilisation (IVF) versus intra‐uterine insemination (IUI) in natural cycles (NC), Outcome 1 Live birth rate per couple (all cycles).

Comparison 9 In vitro fertilisation (IVF) versus intra‐uterine insemination (IUI) in cycles with ovarian hyperstimulation (OH), Outcome 1 Live birth rate per couple (all cycles).

Comparison 9 In vitro fertilisation (IVF) versus intra‐uterine insemination (IUI) in cycles with ovarian hyperstimulation (OH), Outcome 2 OHSS per couple.

Comparison 9 In vitro fertilisation (IVF) versus intra‐uterine insemination (IUI) in cycles with ovarian hyperstimulation (OH), Outcome 3 Pregnancy rate per couple (all cycles).
| IUI in natural cycles compared to TI in natural cycles for male subfertility | ||||||
| Patient or population: couples with male subfertility | ||||||
| Outcomes | Illustrative comparative risks* (95% CI) | Relative effect | No of couples (studies) | Quality of the evidence | Comments | |
| Assumed risk | Corresponding risk | |||||
| TI in natural cycles | IUI in natural cycles | |||||
| Live birth rate | Not reported in any included studies | ‐ | ‐ | |||
| OHSS | Not reported in any included studies | ‐ | ‐ | |||
| Pregnancy rate per couple (all cycles) | 0 per 1000 | 0 per 1000 | OR 4.57 | 62 | ⊕⊝⊝⊝ | ‐ |
| *The basis for the assumed risk was the median control group risk across studies. The corresponding risk (and its 95% confidence interval) is based on the assumed risk in the comparison group and the relative effect of the intervention (and its 95% CI). | ||||||
| GRADE Working Group grades of evidence | ||||||
| 1 Risk of bias was very serious: 1. Francavilla 2009, allocation concealment: high risk (on chronological basis), 2. Francavilla 2009, other bias: high risk (no stratification by diagnosis category of subfertility). | ||||||
| IUI in stimulated cycles compared to TI in stimulated cycles for male subfertility | ||||||
| Patient or population: couples with male subfertility | ||||||
| Outcomes | Illustrative comparative risks* (95% CI) | Relative effect | No of couples (studies) | Quality of the evidence | Comments | |
| Assumed risk | Corresponding risk | |||||
| TI in stimulated cycles | IUI in stimulated cycles | |||||
| Live birth rate per couple (all cycles) | 220 per 1000 | 200 per 1000 | OR 0.89 | 81 | ⊕⊕⊝⊝ | ‐ |
| OHSS per couple Follow‐up: 6 months | See comment | See comment | Not estimable | 59 (1 study) | ⊕⊕⊝⊝ | ‐ |
| Pregnancy rate per couple (all cycles) | 175 per 1000 | 243 per 1000 | OR 1.51 | 202 | ⊕⊝⊝⊝ | ‐ |
| Multiple pregnancy rate per couple | 0 per 1000 | 0 per 1000 | OR 3.15 | 81 | ⊕⊕⊝⊝ | ‐ |
| Miscarriage rate per couple | 73 per 1000 | 75 per 1000 | OR 1.03 | 81 | ⊕⊕⊝⊝ | ‐ |
| *The basis for the assumed risk was the median control group risk across studies. The corresponding risk (and its 95% confidence interval) is based on the assumed risk in the comparison group and the relative effect of the intervention (and its 95% CI). | ||||||
| GRADE Working Group grades of evidence | ||||||
| 1 There was very serious imprecision, with small sample size. | ||||||
| IUI in stimulated cycles compared to TI in natural cycles for male subfertility | ||||||
| Patient or population: couples with male subfertility | ||||||
| Outcomes | Illustrative comparative risks* (95% CI) | Relative effect | No of couples (studies) | Quality of the evidence | Comments | |
| Assumed risk | Corresponding risk | |||||
| TI in natural cycles | IUI in stimulated cycles | |||||
| Live birth rate per couple (all cycles) | 0 per 1000 | 0 per 1000 | OR 3.14 | 44 | ⊕⊝⊝⊝ | ‐ |
| OHSS | Not reported in any included studies | ‐ | ||||
| Pregnancy rate per couple (all cycles) | 0 per 1000 | 0 per 1000 | OR 3.14 | 44 | ⊕⊝⊝⊝ | ‐ |
| *The basis for the assumed risk was the median control group risk across studies. The corresponding risk (and its 95% confidence interval) is based on the assumed risk in the comparison group and the relative effect of the intervention (and its 95% CI). | ||||||
| GRADE Working Group grades of evidence | ||||||
| 1 Risk of bias was very serious: 1. Allocation concealment: high risk (on chronological basis), 2. Other bias: high risk (no stratification by diagnosis category of subfertility). | ||||||
| IUI in stimulated cycles compared to IUI in natural cycles for male subfertility | ||||||
| Patient or population: couples with male subfertility | ||||||
| Outcomes | Illustrative comparative risks* (95% CI) | Relative effect | No of couples | Quality of the evidence | Comments | |
| Assumed risk | Corresponding risk | |||||
| IUI in natural cycles | IUI in stimulated cycles | |||||
| Live birth rate per couple (all cycles) | 172 per 1000 | 218 per 1000 | OR 1.34 | 346 | ⊕⊝⊝⊝ | ‐ |
| OHSS | Not reported in any included studies | ‐ | ‐ | |||
| Pregnancy rate per couple (all cycles) | 148 per 1000 | 226 per 1000 | OR 1.68 | 399 | ⊕⊝⊝⊝ | ‐ |
| Miscarriage rate per couple | 53 per 1000 | 56 per 1000 | OR 1.06 | 115 | ⊕⊝⊝⊝ | ‐ |
| *The basis for the assumed risk was the median control group risk across studies. The corresponding risk (and its 95% confidence interval) is based on the assumed risk in the comparison group and the relative effect of the intervention (and its 95% CI). | ||||||
| GRADE Working Group grades of evidence | ||||||
| 1 Risk of bias was very serious: 1. Francavilla 2009, allocation concealment: high risk (on chronological basis), 2. Arici 1994, Francavilla 2009, and Guzick 1999, other bias: high risk (no stratification by diagnosis category of subfertility. | ||||||
| IVF compared to IUI in natural cycles for male subfertility | ||||||
| Patient or population: couples with male subfertility | ||||||
| Outcomes | Illustrative comparative risks* (95% CI) | Relative effect | No of couples (studies) | Quality of the evidence | Comments | |
| Assumed risk | Corresponding risk | |||||
| IUI in natural cycles | IVF | |||||
| Live birth rate per couple (all cycles) | 407 per 1000 | 346 per 1000 | OR 0.77 | 53 | ⊕⊕⊝⊝ | ‐ |
| OHSS | Not reported in any included studies | ‐ | ‐ | |||
| *The basis for the assumed risk was the median control group risk across studies. The corresponding risk (and its 95% confidence interval) is based on the assumed risk in the comparison group and the relative effect of the intervention (and its 95% CI). | ||||||
| GRADE Working Group grades of evidence | ||||||
| 1 There was very serious imprecision, with small sample sizes. | ||||||
| IVF compared to IUI in stimulated cycles for male subfertility | ||||||
| Patient or population: couples with male subfertility | ||||||
| Outcomes | Illustrative comparative risks* (95% CI) | Relative effect | No of couples (studies) | Quality of the evidence | Comments | |
| Assumed risk | Corresponding risk | |||||
| IUI in stimulated cycles | IVF | |||||
| Live birth rate per couple (all cycles) | 452 per 1000 | 460 per 1000 | OR 1.03 | 86 | ⊕⊝⊝⊝ | ‐ |
| OHSS per couple | See comment | See comment | Not estimable | 36 | ⊕⊝⊝⊝ | No OHSS occurred |
| Pregnancy rate per couple (all cycles) | 611 per 1000 | 666 per 1000 | OR 1.27 | 36 | ⊕⊝⊝⊝ | ‐ |
| *The basis for the assumed risk was the median control group risk across studies. The corresponding risk (and its 95% confidence interval) is based on the assumed risk in the comparison group and the relative effect of the intervention (and its 95% CI). | ||||||
| GRADE Working Group grades of evidence | ||||||
| 1 Risk of bias was serious: Bensdorp 2015, other bias: high risk (no stratification by diagnosis category of subfertility). | ||||||
| Outcome or subgroup title | No. of studies | No. of participants | Statistical method | Effect size |
| 1 Pregnancy rate per couple (all cycles) Show forest plot | 2 | 62 | Odds Ratio (M‐H, Fixed, 95% CI) | 4.57 [0.21, 101.61] |
| Outcome or subgroup title | No. of studies | No. of participants | Statistical method | Effect size |
| 1 Live birth rate per couple (all cycles) Show forest plot | 1 | 81 | Odds Ratio (M‐H, Fixed, 95% CI) | 0.89 [0.30, 2.59] |
| 2 OHSS per couple Show forest plot | 1 | 59 | Odds Ratio (M‐H, Fixed, 95% CI) | 0.0 [0.0, 0.0] |
| 3 Pregnancy rate per couple (all cycles) Show forest plot | 3 | 202 | Odds Ratio (M‐H, Fixed, 95% CI) | 1.51 [0.74, 3.07] |
| 4 Multiple pregnancy rate per couple Show forest plot | 1 | 81 | Odds Ratio (M‐H, Fixed, 95% CI) | 3.15 [0.12, 79.69] |
| 5 Miscarriage rate per couple Show forest plot | 1 | 81 | Odds Ratio (M‐H, Fixed, 95% CI) | 1.03 [0.19, 5.42] |
| Outcome or subgroup title | No. of studies | No. of participants | Statistical method | Effect size |
| 1 Live birth rate per couple (all cycles) Show forest plot | 1 | 44 | Odds Ratio (M‐H, Fixed, 95% CI) | 3.14 [0.12, 81.35] |
| 2 Pregnancy rate per couple (all cycles) Show forest plot | 1 | 44 | Odds Ratio (M‐H, Fixed, 95% CI) | 3.14 [0.12, 81.35] |
| Outcome or subgroup title | No. of studies | No. of participants | Statistical method | Effect size |
| 1 Live birth rate per couple (all cycles) Show forest plot | 3 | 346 | Odds Ratio (M‐H, Fixed, 95% CI) | 1.34 [0.77, 2.33] |
| 1.1 Gonadotrophins | 2 | 305 | Odds Ratio (M‐H, Fixed, 95% CI) | 1.31 [0.75, 2.29] |
| 1.2 Gonadotrophins + clomiphene citrate (CC) | 1 | 41 | Odds Ratio (M‐H, Fixed, 95% CI) | 2.72 [0.10, 70.79] |
| 2 Pregnancy rate per couple (all cycles) Show forest plot | 4 | 399 | Odds Ratio (M‐H, Fixed, 95% CI) | 1.68 [1.00, 2.82] |
| 2.1 Gonadotrophins | 2 | 328 | Odds Ratio (M‐H, Fixed, 95% CI) | 1.60 [0.94, 2.73] |
| 2.2 CC | 1 | 30 | Odds Ratio (M‐H, Fixed, 95% CI) | 4.83 [0.18, 128.79] |
| 2.3 Gonadotrophins + CC | 1 | 41 | Odds Ratio (M‐H, Fixed, 95% CI) | 2.72 [0.10, 70.79] |
| 3 Miscarriage rate per couple Show forest plot | 2 | 115 | Odds Ratio (M‐H, Fixed, 95% CI) | 1.06 [0.20, 5.63] |
| Outcome or subgroup title | No. of studies | No. of participants | Statistical method | Effect size |
| 1 Live birth rate per couple (all cycles) Show forest plot | 1 | 53 | Odds Ratio (M‐H, Fixed, 95% CI) | 0.77 [0.25, 2.35] |
| Outcome or subgroup title | No. of studies | No. of participants | Statistical method | Effect size |
| 1 Live birth rate per couple (all cycles) Show forest plot | 2 | 86 | Odds Ratio (M‐H, Fixed, 95% CI) | 1.03 [0.43, 2.45] |
| 2 OHSS per couple Show forest plot | 1 | 36 | Odds Ratio (M‐H, Fixed, 95% CI) | 0.0 [0.0, 0.0] |
| 3 Pregnancy rate per couple (all cycles) Show forest plot | 1 | 36 | Odds Ratio (M‐H, Fixed, 95% CI) | 1.27 [0.33, 4.97] |