Analgesia epidural versus no epidural o ninguna analgesia para el alivio del dolor en el trabajo de parto
Información
- DOI:
- https://doi.org/10.1002/14651858.CD000331.pub4Copiar DOI

- Base de datos:
-
- Cochrane Database of Systematic Reviews
- Versión publicada:
-
- 21 mayo 2018see what's new
- Tipo:
-
- Intervention
- Etapa:
-
- Review
- Grupo Editorial Cochrane:
-
Grupo Cochrane de Embarazo y parto
- Copyright:
-
- Copyright © 2018 The Cochrane Collaboration. Published by John Wiley & Sons, Ltd.
Cifras del artículo
Altmetric:
Citado por:
Autores
Contributions of authors
M Anim‐Somuah (MA) is responsible for this current update. A Cuthbert (AC) and R Smyth (RS) updated the Background and Methods sections, and MA, RS and AC assessed new studies for inclusion and extracted all the data independently. AC entered the data into RevMan and MA and RS double‐checked them. AC, MA, RS and Allan M Cyna (AMC) contributed to the Results, Discussion and Authors' conclusions.
Sources of support
Internal sources
-
No sources of support supplied
External sources
-
2017 Update ‐ WHO UNDP‐UNFPA‐UNICEF‐WHO‐World Bank Special Programme of Research, Development and Research Training in Human Reproduction (HRP), Department of Reproductive Health and Research (RHR), World Health Organization, Switzerland.
Declarations of interest
Millicent Anim‐Somuah: None known
Rebecca MD Smyth: None known
Allan M Cyna: None known
Anna Cuthbert: I am a research associate working in the editorial base of Cochrane Pregnancy and Childbirth. I am employed by the University of Liverpool to work as a research associate in Cochrane Pregnancy and Childbirth (who receives infrastructure funding from the NIHR, UK).
Acknowledgements
C Howell (CH) prepared the first version of the review (Howell 1999).
We thank Angela Gonzales and Alison Ledward for assistance with translation. We thank Leanne Jones for her contribution as an author on the previous version of this review (Anim‐Somuah 2011).
We also thank Therese Dowswell and Lambert Felix from Cochrane Pregnancy and Childbirth for their input in preparing the 2018 update.
As part of the prepublication editorial process, this review has been commented on by three peers (an editor and two referees who are external to the editorial team), and the Group's Statistical Adviser.
This project was supported by the National Institute for Health Research, through Cochrane Infrastructure funding to Cochrane Pregnancy and Childbirth. The views and opinions expressed therein are those of the authors and do not necessarily reflect those of the Systematic Reviews Programme, NIHR, NHS or the Department of Health.
Version history
| Published | Title | Stage | Authors | Version |
| 2018 May 21 | Epidural versus non‐epidural or no analgesia for pain management in labour | Review | Millicent Anim‐Somuah, Rebecca MD Smyth, Allan M Cyna, Anna Cuthbert | |
| 2011 Dec 07 | Epidural versus non‐epidural or no analgesia in labour | Review | Millicent Anim‐Somuah, Rebecca MD Smyth, Leanne Jones | |
| 2005 Oct 19 | Epidural versus non‐epidural or no analgesia in labour | Review | Millicent Anim‐Somuah, Rebecca MD Smyth, Charlotte J Howell | |
| 1999 Jul 26 | Epidural versus non‐epidural analgesia for pain relief in labour | Review | Charlotte J Howell | |
Differences between protocol and review
The 2011 version of this review was one of a series of Cochrane Reviews examining pain management in labour. These reviews contributed to an overview of systematic reviews of pain management for women in labour (Jones 2012), and shared a generic protocol (Jones 2011). In order to adhere to the generic protocol the outcomes included and methods used for subgroup and sensitivity analyses were revised in the 2011 version of this review to comply with the generic protocol. In this updated review (2018) separate comparisons examine epidural versus opioids, versus placebo or no treatment, versus acu‐stimulation, and versus continuous support. This version of the review includes GRADE assessments for important outcomes, and a 'Summary of findings' table for the main comparison. We conducted a post hoc subgroup analysis of trials conducted after 2005 for the outcome of assisted vaginal birth for the main comparison of epidural versus opioids, in response to peer referee comments.
For the 2018 update, we include an additional search of ClinicalTrials.gov and the WHO International Clinical Trials Registry Platform (ICTRP).
Keywords
MeSH
Medical Subject Headings (MeSH) Keywords
- *Analgesia, Epidural [adverse effects];
- *Delivery, Obstetric;
- *Labor Pain;
- *Labor, Obstetric;
- Analgesia, Obstetrical [adverse effects, *methods];
- Cesarean Section [statistics & numerical data];
- Intensive Care Units, Neonatal [statistics & numerical data];
- Patient Satisfaction [statistics & numerical data];
- Randomized Controlled Trials as Topic;
- Risk;
Medical Subject Headings Check Words
Female; Humans; Infant, Newborn; Pregnancy;
PICO

Study flow diagram.

Risk of bias graph: review authors' judgements about each risk of bias item presented as percentages across all included studies.

Risk of bias summary: review authors' judgements about each risk of bias item for each included study.

Funnel plot of comparison: 1 Epidural versus opioids, outcome: 1.12 Assisted vaginal birth.

Funnel plot of comparison: 1 Epidural versus opioids, outcome: 1.13 Caesarean section.

Funnel plot of comparison: 1 Epidural versus opioids, outcome: 1.35 Apgar score less than 7 at 5 minutes.

Comparison 1 Epidural versus opioids, Outcome 1 Pain score in labour.

Comparison 1 Epidural versus opioids, Outcome 2 Pain intensity severe or intolerable.

Comparison 1 Epidural versus opioids, Outcome 3 Woman's perception of pain relief in labour.

Comparison 1 Epidural versus opioids, Outcome 4 Woman's perception of pain relief during first stage of labour.

Comparison 1 Epidural versus opioids, Outcome 5 Woman's perception of pain relief during the second stage of labour.

Comparison 1 Epidural versus opioids, Outcome 6 Satisfaction with pain relief in labour ‐ proportion rating excellent or very good.

Comparison 1 Epidural versus opioids, Outcome 7 Satisfaction with pain relief in labour ‐ continuous data.

Comparison 1 Epidural versus opioids, Outcome 8 Time of administration of pain relief to time pain relief was satisfactory (minutes).
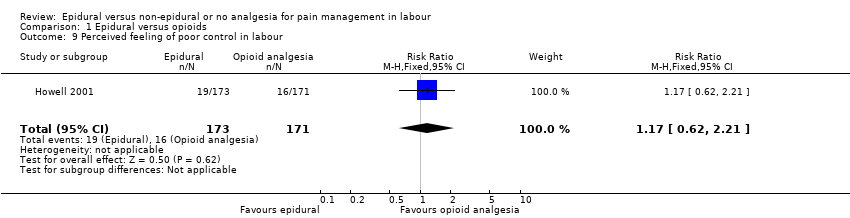
Comparison 1 Epidural versus opioids, Outcome 9 Perceived feeling of poor control in labour.

Comparison 1 Epidural versus opioids, Outcome 10 Satisfaction with childbirth experience ‐ proportion rating satisfied to very satisfied.

Comparison 1 Epidural versus opioids, Outcome 11 Need for additional means of pain relief.

Comparison 1 Epidural versus opioids, Outcome 12 Assisted vaginal birth.

Comparison 1 Epidural versus opioids, Outcome 13 Caesarean section.

Comparison 1 Epidural versus opioids, Outcome 14 Long‐term backache.

Comparison 1 Epidural versus opioids, Outcome 15 Hypotension as defined by trial authors.

Comparison 1 Epidural versus opioids, Outcome 16 Postnatal depression (authors definition, on medication, or self‐reported).

Comparison 1 Epidural versus opioids, Outcome 17 Motor blockade.

Comparison 1 Epidural versus opioids, Outcome 18 Respiratory depression requiring oxygen administration.

Comparison 1 Epidural versus opioids, Outcome 19 Headache.

Comparison 1 Epidural versus opioids, Outcome 20 Perineal trauma requiring suturing.

Comparison 1 Epidural versus opioids, Outcome 21 Nausea and vomiting.

Comparison 1 Epidural versus opioids, Outcome 22 Itch.

Comparison 1 Epidural versus opioids, Outcome 23 Fever > 38 º C.

Comparison 1 Epidural versus opioids, Outcome 24 Shivering.

Comparison 1 Epidural versus opioids, Outcome 25 Drowsiness.

Comparison 1 Epidural versus opioids, Outcome 26 Urinary retention.

Comparison 1 Epidural versus opioids, Outcome 27 Catheterisation during labour.

Comparison 1 Epidural versus opioids, Outcome 28 Malposition.

Comparison 1 Epidural versus opioids, Outcome 29 Surgical amniotomy.

Comparison 1 Epidural versus opioids, Outcome 30 Acidosis defined by cord arterial pH < 7.2 at delivery.

Comparison 1 Epidural versus opioids, Outcome 31 Acidosis defined by cord arterial pH < 7.15.

Comparison 1 Epidural versus opioids, Outcome 32 Naloxone administration.

Comparison 1 Epidural versus opioids, Outcome 33 Meconium staining of liquor.

Comparison 1 Epidural versus opioids, Outcome 34 Neonatal intensive care unit admission.

Comparison 1 Epidural versus opioids, Outcome 35 Apgar score less than 7 at 5 minutes.

Comparison 1 Epidural versus opioids, Outcome 36 Length of first stage of labour (minutes).

Comparison 1 Epidural versus opioids, Outcome 37 Length of second stage of labour (minutes).

Comparison 1 Epidural versus opioids, Outcome 38 Oxytocin augmentation.

Comparison 1 Epidural versus opioids, Outcome 39 Caesarean section for fetal distress.

Comparison 1 Epidural versus opioids, Outcome 40 Caesarean section for dystocia.

Comparison 1 Epidural versus opioids, Outcome 41 Sensitivity analysis ‐ allocation concealment: Maternal satisfaction with pain relief in labour ‐ proportion rating excellent or very good.

Comparison 1 Epidural versus opioids, Outcome 42 Sensitivity analysis ‐ incomplete outcome data: Maternal satisfaction with pain relief in labour ‐ proportion rating excellent or very good.

Comparison 1 Epidural versus opioids, Outcome 43 Sensitivity analysis ‐ allocation concealment: Need for additional means of pain relief.

Comparison 1 Epidural versus opioids, Outcome 44 Sensitivity analysis ‐ incomplete outcome data: Need for additional means of pain relief.

Comparison 2 Epidural versus placebo/no treatment, Outcome 1 Pain score in labour.

Comparison 2 Epidural versus placebo/no treatment, Outcome 2 Woman's perception of pain relief during first stage of labour.

Comparison 2 Epidural versus placebo/no treatment, Outcome 3 Woman's perception of pain relief during the second stage of labour.
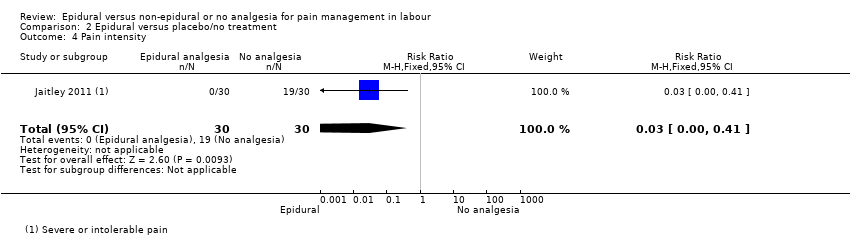
Comparison 2 Epidural versus placebo/no treatment, Outcome 4 Pain intensity.

Comparison 2 Epidural versus placebo/no treatment, Outcome 5 Satisfaction with pain relief in labour ‐ proportion rating excellent or very good.

Comparison 2 Epidural versus placebo/no treatment, Outcome 6 Perceived feeling of poor control in labour.

Comparison 2 Epidural versus placebo/no treatment, Outcome 7 Need for additional means of pain relief.

Comparison 2 Epidural versus placebo/no treatment, Outcome 8 Instrumental delivery.

Comparison 2 Epidural versus placebo/no treatment, Outcome 9 Caesarean section.

Comparison 2 Epidural versus placebo/no treatment, Outcome 10 Motor blockade.

Comparison 2 Epidural versus placebo/no treatment, Outcome 11 Headache.

Comparison 2 Epidural versus placebo/no treatment, Outcome 12 Perineal trauma requiring suturing.

Comparison 2 Epidural versus placebo/no treatment, Outcome 13 Nausea and vomiting.

Comparison 2 Epidural versus placebo/no treatment, Outcome 14 Itch.

Comparison 2 Epidural versus placebo/no treatment, Outcome 15 Fever > 38 º C.

Comparison 2 Epidural versus placebo/no treatment, Outcome 16 Shivering.

Comparison 2 Epidural versus placebo/no treatment, Outcome 17 Drowsiness.

Comparison 2 Epidural versus placebo/no treatment, Outcome 18 Urinary retention.

Comparison 2 Epidural versus placebo/no treatment, Outcome 19 Apgar score less than 7 at 5 minutes.

Comparison 2 Epidural versus placebo/no treatment, Outcome 20 Length of first stage of labour (minutes).

Comparison 2 Epidural versus placebo/no treatment, Outcome 21 Length of second stage of labour (minutes).

Comparison 2 Epidural versus placebo/no treatment, Outcome 22 Oxytocin augmentation.

Comparison 2 Epidural versus placebo/no treatment, Outcome 23 Caesarean section for fetal distress.

Comparison 2 Epidural versus placebo/no treatment, Outcome 24 Caesarean section for dystocia.

Comparison 2 Epidural versus placebo/no treatment, Outcome 25 Sensitivity analysis ‐ allocation concealment: Need for additional means of pain relief.
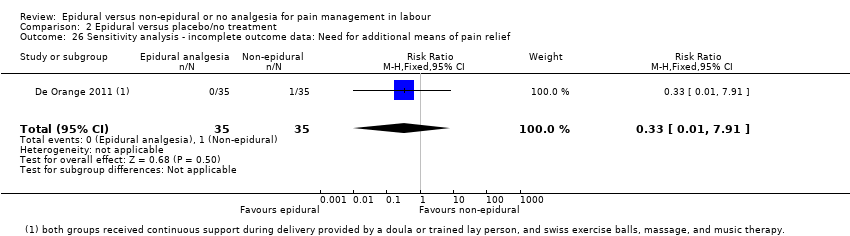
Comparison 2 Epidural versus placebo/no treatment, Outcome 26 Sensitivity analysis ‐ incomplete outcome data: Need for additional means of pain relief.

Comparison 3 Epidural versus TENS, Outcome 1 Maternal pain score in labour.

Comparison 3 Epidural versus TENS, Outcome 2 Instrumental delivery.

Comparison 3 Epidural versus TENS, Outcome 3 Caesarean section.

Comparison 3 Epidural versus TENS, Outcome 4 Hypotension as defined by trial authors.

Comparison 3 Epidural versus TENS, Outcome 5 Urinary retention.

Comparison 3 Epidural versus TENS, Outcome 6 Nausea and vomiting.

Comparison 3 Epidural versus TENS, Outcome 7 Length of second stage of labour (minutes).

Comparison 3 Epidural versus TENS, Outcome 8 Oxytocin augmentation.

Comparison 4 Epidural versus inhaled analgesia, Outcome 1 Maternal satisfaction with pain relief in labour ‐ proportion rating excellent or very good.

Comparison 4 Epidural versus inhaled analgesia, Outcome 2 Caesarean section.

Comparison 5 Epidural versus continuous support, Outcome 1 Satisfaction with pain relief in labour ‐ proportion rating excellent or very good.

Comparison 5 Epidural versus continuous support, Outcome 2 Need for additional means of pain relief.

Comparison 5 Epidural versus continuous support, Outcome 3 Instrumental delivery.

Comparison 5 Epidural versus continuous support, Outcome 4 Caesarean section.

Comparison 5 Epidural versus continuous support, Outcome 5 Long‐term backache.

Comparison 5 Epidural versus continuous support, Outcome 6 Headache.

Comparison 5 Epidural versus continuous support, Outcome 7 Nausea and vomiting.
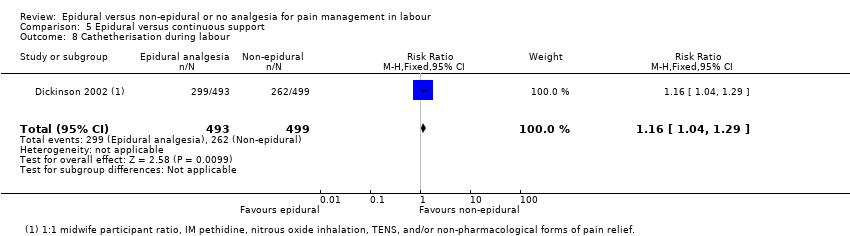
Comparison 5 Epidural versus continuous support, Outcome 8 Cathetherisation during labour.

Comparison 5 Epidural versus continuous support, Outcome 9 Apgar score less than 7 at 5 minutes.
| Epidural compared to opioids in labour (maternal outcomes) | ||||||
| Patient or population: women in labour | ||||||
| Outcomes | Anticipated absolute effects* (95% CI) | Relative effect | № of participants | Quality of the evidence | Comments | |
| Risk with opioids | Risk with epidural | |||||
| Pain intensity measured using pain score in labour (lower scores = less pain) | SMD 2.64 lower | ‐ | 1133 | ⊕⊕⊝⊝ | ‐ | |
| Satisfaction with pain relief ‐ proportion rating excellent or very good | Study population | Average RR 1.47 | 1911 | ⊕⊕⊝⊝ | ‐ | |
| 500 per 1000 | 735 per 1000 | |||||
| Assisted vaginal birth | Study population | RR 1.44 | 9948 | ⊕⊕⊝⊝ | ‐ | |
| 99 per 1000 | 142 per 1000 | |||||
| Caesarean section | Study population | RR 1.07 | 10,350 | ⊕⊕⊕⊝ | ‐ | |
| 114 per 1000 | 122 per 1000 | |||||
| Side effects (maternal) ‐ long‐term backache | Study population | RR 1.00 | 814 | ⊕⊕⊕⊝ | ‐ | |
| 585 per 1000 | 585 per 1000 | |||||
| Admission to special care baby unit/neonatal intensive care unit (as defined by trialists) | Study population | RR 1.03 | 4488 | ⊕⊕⊕⊝ | ‐ | |
| 204 per 1000 | 210 per 1000 (194 to 228) | |||||
| Apgar score less than 7 at 5 minutes | Study population | RR 0.73 | 8752 | ⊕⊕⊝⊝ | ‐ | |
| 17 per 1000 | 12 per 1000 | |||||
| *The risk in the intervention group (and its 95% confidence interval) is based on the assumed risk in the comparison group and the relative effect of the intervention (and its 95% CI). | ||||||
| GRADE Working Group grades of evidence | ||||||
| 1Downgraded due to limitation of study design (‐1). | ||||||
| Outcome or subgroup title | No. of studies | No. of participants | Statistical method | Effect size |
| 1 Pain score in labour Show forest plot | 5 | 1133 | Std. Mean Difference (IV, Random, 95% CI) | ‐2.64 [‐4.56, ‐0.73] |
| 2 Pain intensity severe or intolerable Show forest plot | 1 | 60 | Risk Ratio (M‐H, Fixed, 95% CI) | 0.0 [0.0, 0.0] |
| 3 Woman's perception of pain relief in labour Show forest plot | 3 | 1166 | Mean Difference (IV, Random, 95% CI) | ‐3.36 [‐5.41, ‐1.31] |
| 4 Woman's perception of pain relief during first stage of labour Show forest plot | 3 | 194 | Mean Difference (IV, Random, 95% CI) | ‐12.05 [‐19.35, ‐4.75] |
| 5 Woman's perception of pain relief during the second stage of labour Show forest plot | 2 | 164 | Mean Difference (IV, Fixed, 95% CI) | ‐20.75 [‐22.50, ‐19.01] |
| 6 Satisfaction with pain relief in labour ‐ proportion rating excellent or very good Show forest plot | 7 | 1911 | Risk Ratio (M‐H, Random, 95% CI) | 1.47 [1.03, 2.08] |
| 7 Satisfaction with pain relief in labour ‐ continuous data Show forest plot | 7 | 3171 | Std. Mean Difference (IV, Random, 95% CI) | 0.51 [0.10, 0.91] |
| 8 Time of administration of pain relief to time pain relief was satisfactory (minutes) Show forest plot | 1 | 82 | Mean Difference (IV, Fixed, 95% CI) | ‐6.70 [‐8.02, ‐5.38] |
| 9 Perceived feeling of poor control in labour Show forest plot | 1 | 344 | Risk Ratio (M‐H, Fixed, 95% CI) | 1.17 [0.62, 2.21] |
| 10 Satisfaction with childbirth experience ‐ proportion rating satisfied to very satisfied Show forest plot | 1 | 332 | Risk Ratio (M‐H, Fixed, 95% CI) | 0.95 [0.87, 1.03] |
| 11 Need for additional means of pain relief Show forest plot | 16 | 5099 | Risk Ratio (M‐H, Random, 95% CI) | 0.10 [0.04, 0.25] |
| 12 Assisted vaginal birth Show forest plot | 30 | 9948 | Risk Ratio (M‐H, Fixed, 95% CI) | 1.44 [1.29, 1.60] |
| 13 Caesarean section Show forest plot | 33 | 10350 | Risk Ratio (M‐H, Fixed, 95% CI) | 1.07 [0.96, 1.18] |
| 14 Long‐term backache Show forest plot | 2 | 814 | Risk Ratio (M‐H, Fixed, 95% CI) | 1.00 [0.89, 1.12] |
| 15 Hypotension as defined by trial authors Show forest plot | 10 | 4212 | Risk Ratio (M‐H, Random, 95% CI) | 11.34 [1.89, 67.95] |
| 16 Postnatal depression (authors definition, on medication, or self‐reported) Show forest plot | 1 | 313 | Risk Ratio (M‐H, Fixed, 95% CI) | 0.63 [0.38, 1.05] |
| 17 Motor blockade Show forest plot | 3 | 322 | Risk Ratio (M‐H, Fixed, 95% CI) | 31.71 [4.16, 241.99] |
| 18 Respiratory depression requiring oxygen administration Show forest plot | 5 | 2031 | Risk Ratio (M‐H, Random, 95% CI) | 0.23 [0.05, 0.97] |
| 19 Headache Show forest plot | 4 | 1938 | Risk Ratio (M‐H, Fixed, 95% CI) | 1.06 [0.74, 1.54] |
| 20 Perineal trauma requiring suturing Show forest plot | 1 | 369 | Risk Ratio (M‐H, Fixed, 95% CI) | 1.05 [0.93, 1.18] |
| 21 Nausea and vomiting Show forest plot | 15 | 4440 | Risk Ratio (M‐H, Random, 95% CI) | 0.62 [0.45, 0.87] |
| 22 Itch Show forest plot | 8 | 2900 | Risk Ratio (M‐H, Fixed, 95% CI) | 1.19 [0.81, 1.77] |
| 23 Fever > 38 º C Show forest plot | 9 | 4276 | Risk Ratio (M‐H, Random, 95% CI) | 2.51 [1.67, 3.77] |
| 24 Shivering Show forest plot | 1 | 20 | Risk Ratio (M‐H, Fixed, 95% CI) | 5.0 [0.27, 92.62] |
| 25 Drowsiness Show forest plot | 6 | 740 | Risk Ratio (M‐H, Random, 95% CI) | 0.48 [0.17, 1.33] |
| 26 Urinary retention Show forest plot | 4 | 343 | Risk Ratio (M‐H, Fixed, 95% CI) | 14.18 [4.52, 44.45] |
| 27 Catheterisation during labour Show forest plot | 1 | 111 | Risk Ratio (M‐H, Random, 95% CI) | 5.68 [0.71, 45.68] |
| 28 Malposition Show forest plot | 4 | 673 | Risk Ratio (M‐H, Fixed, 95% CI) | 1.40 [0.98, 1.99] |
| 29 Surgical amniotomy Show forest plot | 2 | 211 | Risk Ratio (M‐H, Random, 95% CI) | 1.03 [0.74, 1.43] |
| 30 Acidosis defined by cord arterial pH < 7.2 at delivery Show forest plot | 8 | 4783 | Risk Ratio (M‐H, Fixed, 95% CI) | 0.81 [0.69, 0.94] |
| 31 Acidosis defined by cord arterial pH < 7.15 Show forest plot | 3 | 480 | Risk Ratio (M‐H, Fixed, 95% CI) | 1.17 [0.64, 2.14] |
| 32 Naloxone administration Show forest plot | 10 | 2645 | Risk Ratio (M‐H, Fixed, 95% CI) | 0.15 [0.10, 0.23] |
| 33 Meconium staining of liquor Show forest plot | 5 | 2295 | Risk Ratio (M‐H, Fixed, 95% CI) | 1.01 [0.84, 1.21] |
| 34 Neonatal intensive care unit admission Show forest plot | 8 | 4488 | Risk Ratio (M‐H, Fixed, 95% CI) | 1.03 [0.95, 1.12] |
| 35 Apgar score less than 7 at 5 minutes Show forest plot | 22 | 8752 | Risk Ratio (M‐H, Fixed, 95% CI) | 0.73 [0.52, 1.02] |
| 36 Length of first stage of labour (minutes) Show forest plot | 9 | 2259 | Mean Difference (IV, Fixed, 95% CI) | 32.28 [18.34, 46.22] |
| 37 Length of second stage of labour (minutes) Show forest plot | 16 | 4979 | Mean Difference (IV, Random, 95% CI) | 15.38 [8.97, 21.79] |
| 38 Oxytocin augmentation Show forest plot | 19 | 8351 | Risk Ratio (M‐H, Random, 95% CI) | 1.12 [1.00, 1.26] |
| 39 Caesarean section for fetal distress Show forest plot | 12 | 5753 | Risk Ratio (M‐H, Fixed, 95% CI) | 1.32 [0.97, 1.79] |
| 40 Caesarean section for dystocia Show forest plot | 13 | 5938 | Risk Ratio (M‐H, Fixed, 95% CI) | 0.93 [0.79, 1.11] |
| 41 Sensitivity analysis ‐ allocation concealment: Maternal satisfaction with pain relief in labour ‐ proportion rating excellent or very good Show forest plot | 4 | 1372 | Risk Ratio (M‐H, Random, 95% CI) | 1.42 [0.70, 2.92] |
| 42 Sensitivity analysis ‐ incomplete outcome data: Maternal satisfaction with pain relief in labour ‐ proportion rating excellent or very good Show forest plot | 3 | 923 | Risk Ratio (M‐H, Random, 95% CI) | 1.23 [0.97, 1.55] |
| 43 Sensitivity analysis ‐ allocation concealment: Need for additional means of pain relief Show forest plot | 9 | 3043 | Risk Ratio (M‐H, Random, 95% CI) | 0.12 [0.03, 0.53] |
| 44 Sensitivity analysis ‐ incomplete outcome data: Need for additional means of pain relief Show forest plot | 9 | 3740 | Risk Ratio (M‐H, Random, 95% CI) | 0.15 [0.05, 0.45] |
| Outcome or subgroup title | No. of studies | No. of participants | Statistical method | Effect size |
| 1 Pain score in labour Show forest plot | 2 | 120 | Std. Mean Difference (IV, Random, 95% CI) | ‐9.55 [‐12.91, ‐6.19] |
| 2 Woman's perception of pain relief during first stage of labour Show forest plot | 1 | 60 | Mean Difference (IV, Fixed, 95% CI) | ‐55.90 [‐61.09, ‐50.71] |
| 3 Woman's perception of pain relief during the second stage of labour Show forest plot | 1 | 60 | Mean Difference (IV, Fixed, 95% CI) | ‐55.70 [‐63.54, ‐47.86] |
| 4 Pain intensity Show forest plot | 1 | 60 | Risk Ratio (M‐H, Fixed, 95% CI) | 0.03 [0.00, 0.41] |
| 5 Satisfaction with pain relief in labour ‐ proportion rating excellent or very good Show forest plot | 1 | 70 | Risk Ratio (M‐H, Fixed, 95% CI) | 1.32 [1.05, 1.65] |
| 6 Perceived feeling of poor control in labour Show forest plot | 2 | 130 | Risk Ratio (M‐H, Fixed, 95% CI) | 0.89 [0.52, 1.50] |
| 7 Need for additional means of pain relief Show forest plot | 2 | 355 | Risk Ratio (M‐H, Fixed, 95% CI) | 0.14 [0.02, 1.14] |
| 8 Instrumental delivery Show forest plot | 4 | 515 | Risk Ratio (M‐H, Random, 95% CI) | 3.41 [0.62, 18.80] |
| 9 Caesarean section Show forest plot | 5 | 578 | Risk Ratio (M‐H, Fixed, 95% CI) | 0.46 [0.23, 0.90] |
| 10 Motor blockade Show forest plot | 1 | 60 | Risk Ratio (M‐H, Fixed, 95% CI) | 0.0 [0.0, 0.0] |
| 11 Headache Show forest plot | 1 | 60 | Risk Ratio (M‐H, Fixed, 95% CI) | 0.0 [0.0, 0.0] |
| 12 Perineal trauma requiring suturing Show forest plot | 1 | 285 | Risk Ratio (M‐H, Fixed, 95% CI) | 0.86 [0.50, 1.50] |
| 13 Nausea and vomiting Show forest plot | 2 | 160 | Risk Ratio (M‐H, Random, 95% CI) | 11.00 [0.62, 193.80] |
| 14 Itch Show forest plot | 1 | 60 | Risk Ratio (M‐H, Fixed, 95% CI) | 3.0 [0.13, 70.83] |
| 15 Fever > 38 º C Show forest plot | 1 | 70 | Risk Ratio (M‐H, Fixed, 95% CI) | 11.0 [0.63, 191.69] |
| 16 Shivering Show forest plot | 1 | 100 | Risk Ratio (M‐H, Fixed, 95% CI) | 8.0 [1.04, 61.62] |
| 17 Drowsiness Show forest plot | 1 | 100 | Risk Ratio (M‐H, Random, 95% CI) | 7.0 [0.37, 132.10] |
| 18 Urinary retention Show forest plot | 2 | 160 | Risk Ratio (M‐H, Fixed, 95% CI) | 3.0 [0.32, 28.21] |
| 19 Apgar score less than 7 at 5 minutes Show forest plot | 1 | 60 | Risk Ratio (M‐H, Fixed, 95% CI) | 0.0 [0.0, 0.0] |
| 20 Length of first stage of labour (minutes) Show forest plot | 2 | 189 | Mean Difference (IV, Random, 95% CI) | ‐55.09 [‐186.26, 76.09] |
| 21 Length of second stage of labour (minutes) Show forest plot | 4 | 344 | Mean Difference (IV, Random, 95% CI) | 7.66 [‐6.12, 21.45] |
| 22 Oxytocin augmentation Show forest plot | 3 | 415 | Risk Ratio (M‐H, Fixed, 95% CI) | 0.89 [0.63, 1.24] |
| 23 Caesarean section for fetal distress Show forest plot | 1 | 100 | Risk Ratio (M‐H, Fixed, 95% CI) | 1.0 [0.06, 15.55] |
| 24 Caesarean section for dystocia Show forest plot | 1 | 100 | Risk Ratio (M‐H, Fixed, 95% CI) | 2.0 [0.19, 21.36] |
| 25 Sensitivity analysis ‐ allocation concealment: Need for additional means of pain relief Show forest plot | 1 | 70 | Risk Ratio (M‐H, Fixed, 95% CI) | 0.33 [0.01, 7.91] |
| 26 Sensitivity analysis ‐ incomplete outcome data: Need for additional means of pain relief Show forest plot | 1 | 70 | Risk Ratio (M‐H, Fixed, 95% CI) | 0.33 [0.01, 7.91] |
| Outcome or subgroup title | No. of studies | No. of participants | Statistical method | Effect size |
| 1 Maternal pain score in labour Show forest plot | 1 | 60 | Mean Difference (IV, Fixed, 95% CI) | ‐53.00 [‐57.98, ‐48.02] |
| 2 Instrumental delivery Show forest plot | 1 | 60 | Risk Ratio (M‐H, Fixed, 95% CI) | 1.0 [0.15, 6.64] |
| 3 Caesarean section Show forest plot | 1 | 60 | Risk Ratio (M‐H, Fixed, 95% CI) | 2.0 [0.19, 20.90] |
| 4 Hypotension as defined by trial authors Show forest plot | 1 | 60 | Risk Ratio (M‐H, Fixed, 95% CI) | 3.0 [0.13, 70.83] |
| 5 Urinary retention Show forest plot | 1 | 60 | Risk Ratio (M‐H, Fixed, 95% CI) | 3.0 [0.13, 70.83] |
| 6 Nausea and vomiting Show forest plot | 1 | 60 | Risk Ratio (M‐H, Fixed, 95% CI) | 0.0 [0.0, 0.0] |
| 7 Length of second stage of labour (minutes) Show forest plot | 1 | 60 | Mean Difference (IV, Fixed, 95% CI) | 17.90 [5.66, 30.14] |
| 8 Oxytocin augmentation Show forest plot | 1 | 60 | Risk Ratio (M‐H, Fixed, 95% CI) | 1.08 [0.59, 1.97] |
| Outcome or subgroup title | No. of studies | No. of participants | Statistical method | Effect size |
| 1 Maternal satisfaction with pain relief in labour ‐ proportion rating excellent or very good Show forest plot | 1 | 86 | Risk Ratio (M‐H, Fixed, 95% CI) | 2.18 [1.31, 3.62] |
| 2 Caesarean section Show forest plot | 1 | 86 | Risk Ratio (M‐H, Fixed, 95% CI) | 0.63 [0.16, 2.47] |
| Outcome or subgroup title | No. of studies | No. of participants | Statistical method | Effect size |
| 1 Satisfaction with pain relief in labour ‐ proportion rating excellent or very good Show forest plot | 1 | 992 | Risk Ratio (M‐H, Fixed, 95% CI) | 1.01 [1.00, 1.02] |
| 2 Need for additional means of pain relief Show forest plot | 1 | 992 | Risk Ratio (M‐H, Fixed, 95% CI) | 0.00 [0.00, 0.03] |
| 3 Instrumental delivery Show forest plot | 1 | 992 | Risk Ratio (M‐H, Fixed, 95% CI) | 1.16 [0.96, 1.39] |
| 4 Caesarean section Show forest plot | 1 | 992 | Risk Ratio (M‐H, Fixed, 95% CI) | 1.21 [0.91, 1.62] |
| 5 Long‐term backache Show forest plot | 1 | 992 | Risk Ratio (M‐H, Fixed, 95% CI) | 0.88 [0.69, 1.11] |
| 6 Headache Show forest plot | 1 | 992 | Risk Ratio (M‐H, Fixed, 95% CI) | 0.96 [0.79, 1.17] |
| 7 Nausea and vomiting Show forest plot | 1 | 992 | Risk Ratio (M‐H, Fixed, 95% CI) | 1.12 [0.80, 1.57] |
| 8 Cathetherisation during labour Show forest plot | 1 | 992 | Risk Ratio (M‐H, Fixed, 95% CI) | 1.16 [1.04, 1.29] |
| 9 Apgar score less than 7 at 5 minutes Show forest plot | 1 | 992 | Risk Ratio (M‐H, Fixed, 95% CI) | 2.02 [0.61, 6.68] |