Analgesia epidural versus no epidural o ninguna analgesia para el alivio del dolor en el trabajo de parto
Resumen
Antecedentes
La analgesia epidural es una técnica de bloqueo nervioso central que se logra mediante la inyección de un anestésico local cerca de los nervios que transmiten el dolor, y se utiliza ampliamente como una forma de alivio del dolor en el parto. Sin embargo, existen inquietudes con respecto a los efectos adversos no deseados en la madre y el recién nacido. Esta es una actualización de una revisión Cochrane existente (Epidural versus no epidural o ninguna analgesia en el trabajo de parto), publicada por última vez en 2011.
Objetivos
Evaluar la efectividad y la seguridad de todos los tipos de analgesia epidural, incluida la analgesia espinal‐epidural combinada (EEC), en la madre y el recién nacido, en comparación con la analgesia no epidural o con ningún alivio del dolor durante el trabajo de parto.
Métodos de búsqueda
Se hicieron búsquedas en el registro de ensayos del Grupo Cochrane de Embarazo y Parto (Cochrane Pregnancy and Childbirth Group)(ClinicalTrials.gov), the WHO International Clinical Trials Registry Platform (ICTRP) (30 de abril 2017), y en las listas de referencias de los estudios recuperados.
Criterios de selección
Ensayos controlados aleatorizados que comparen todos los tipos de epidural con cualquier forma de alivio del dolor que no implique un bloqueo regional, o ningún alivio del dolor en el trabajo de parto. No se han incluido ensayos aleatorizados grupales ni cuasialeatorizados en esta actualización.
Obtención y análisis de los datos
Dos autores de la revisión evaluaron de forma independiente los ensayos para la inclusión y los riesgos de sesgo, extrajeron los datos y verificaron su exactitud. Los resultados seleccionados se evaluaron mediante el enfoque GRADE.
Resultados principales
Cincuenta y dos ensayos cumplieron los criterios de inclusión y se incluyeron datos de 40 ensayos con más de 11 000 mujeres. Cuatro ensayos incluyeron más de dos brazos. Treinta y cuatro ensayos compararon la epidural con los opiáceos, siete compararon la epidural con ninguna analgesia, un ensayo comparó la epidural con la acuestimulación, un ensayo comparó la epidural con la analgesia inhalada y un ensayo comparó la epidural con el apoyo continuo de las parteras y otra analgesia. Los riesgos de sesgo variaron en los estudios incluidos; seis de 40 estudios tuvieron un riesgo de sesgo alto o incierto para cada dominio de sesgo, mientras que la mayoría de los estudios tuvieron un riesgo alto o incierto de sesgo de detección. La calidad de la evidencia evaluada mediante GRADE varió de moderada a baja.
La intensidad del dolor medida con las puntuaciones de dolor fue menor en las mujeres con analgesia epidural en comparación con las mujeres que recibieron opiáceos (diferencia de medias estandarizada ‐2,64; intervalo de confianza [IC] del 95%: ‐4,56 a ‐0.73; 1133 mujeres; cinco estudios; I2 = 98%; evidencia de calidad baja) y una mayor proporción se mostraron satisfechas con su alivio del dolor e informaron que fue "excelente o muy bueno" (riesgo relativo [RR] promedio 1,47; IC del 95%: 1,03 a 2,08; 1911 mujeres; siete estudios; I2 = 97%; evidencia de calidad baja). Hubo heterogeneidad estadística importante en ambos resultados. Hubo una disminución importante en la necesidad de alivio adicional del dolor en las mujeres que recibieron analgesia epidural en comparación con la analgesia con opiáceos (RR promedio 0,10; IC del 95%: 0,04 a 0,25; 5099 mujeres; 16 estudios; I2 = 73%; Tau2 = 1,89; Chi2 = 52,07; p < 0,00001). Más mujeres del grupo de epidural experimentaron un parto vaginal asistido (RR 1,44; IC del 95%: 1,29 a 1,60; 9948 mujeres; 30 estudios; evidencia de calidad baja). Un análisis de subgrupos post hoc de los ensayos realizados después de 2005 mostró que este efecto se anula cuando se excluyen de este análisis los ensayos anteriores a 2005 (RR 1,19; IC del 95%: 0,97 a 1,46). No hubo diferencias en las tasas de cesárea (RR 1,07; IC del 95%: 0,96 a 1,18; 10 350 mujeres; 33 estudios; evidencia de calidad moderada) y el dolor de espalda materno a largo plazo (RR 1,00; IC del 95%: 0,89 a 1,12; 814 mujeres; dos estudios; evidencia de calidad moderada). Tampoco hubo diferencias claras entre los grupos en cuanto a los resultados neonatales, el ingreso en la unidad de cuidados intensivos neonatales (RR 1,03; IC del 95%: 0,95 a 1,12; 4488 recién nacidos; ocho estudios; evidencia de calidad moderada) y la puntuación de Apgar inferior a siete a los cinco minutos (RR 0,73; IC del 95%: 0,52 a 1,02; 8752 recién nacidos; 22 estudios; evidencia de calidad baja). La calidad de la evidencia se disminuyó debido a las limitaciones del diseño de los estudios, la inconsistencia, la imprecisión en las estimaciones de los efectos y el posible sesgo de publicación.
Se informaron efectos secundarios en los grupos de epidural y de opiáceos. Las mujeres con epidural experimentaron más hipotensión, bloqueo motor, fiebre y retención urinaria. Además, los periodos de dilatación y de expulsión fueron más prolongados, y fue más probable que se les aumentara la dosis de oxitocina que a las mujeres del grupo de los opiáceos. Las mujeres que recibieron epidurales tuvieron menos riesgo de sufrir depresión respiratoria que necesitara oxígeno y menos probabilidades de presentar náuseas y vómitos que las mujeres que recibieron opiáceos. Los recién nacidos de mujeres en el grupo de epidural tuvieron menos probabilidades de haber recibido naloxona. No hubo una diferencia clara entre los grupos en cuanto a la depresión postnatal, el dolor de cabeza, el prurito, los escalofríos o la somnolencia. No se informó la morbilidad materna ni resultados neonatales a largo plazo.
La analgesia epidural dio lugar a menos dolor en comparación con placebo o ningún tratamiento y con la acuestimulación. En los ensayos que compararon la analgesia epidural con la inhalada, o el apoyo continuo no se informó la intensidad del dolor. Pocos ensayos informaron sobre efectos secundarios graves para la madre.
Conclusiones de los autores
Evidencia de calidad baja demuestra que la analgesia epidural puede ser más efectiva para reducir el dolor durante el parto y aumentar la satisfacción materna con el alivio del dolor que los métodos no epidurales. Aunque en general parece haber un aumento de los partos vaginales asistidos cuando las mujeres se someten a analgesia epidural, un análisis de subgrupos post hoc demostró que este efecto no se observa en los estudios recientes (después de 2005), lo que indica que los enfoques modernos de la analgesia epidural en el trabajo de parto no afectan a este resultado. La analgesia epidural no tuvo repercusión sobre el riesgo de cesárea o de dolor de espalda a largo plazo, y no pareció tener un efecto inmediato en el estado neonatal determinado por las puntuaciones de Apgar o los ingresos en los cuidados intensivos neonatales. Los estudios de investigación adicionales pueden ser útiles para evaluar los efectos adversos poco frecuentes pero posiblemente graves de la analgesia epidural en las mujeres en trabajo de parto y en las medidas de resultado neonatales a largo plazo.
PICO
Resumen en términos sencillos
Analgesia epidural para el alivio del dolor en el trabajo de parto
¿Cuál es el problema?
Evaluar la efectividad de todas las formas de analgesia epidural (incluida la combinación espinal‐epidural) durante el trabajo de parto, en la mujer y el recién nacido, comparadas con otras formas de alivio del dolor o ningún alivio del dolor.
¿Por qué es esto importante?
El alivio del dolor es importante para las mujeres en trabajo de parto. Los métodos farmacológicos para aliviar el dolor incluyen la inhalación de óxido nitroso, la inyección de opiáceos y la analgesia local con una epidural para un bloqueo nervioso central. Las epidurales se utilizan ampliamente para el alivio del dolor en el parto e implican la inyección de un anestésico local en la región inferior de la espalda, cerca de los nervios que transmiten el dolor. Las soluciones epidurales se administran mediante una inyección en bolo (una inyección grande y rápida), una infusión continua, o mediante una bomba controlada por el paciente. Las concentraciones más bajas de anestésico local cuando se administran junto con un opiáceo permiten a las mujeres mantener la capacidad de desplazarse durante el parto y participar activamente en él. La combinación espinal‐epidural implica una única inyección de anestésico local o de opiáceos en el líquido cefalorraquídeo para el rápido inicio del alivio del dolor, así como la inserción del catéter epidural para el alivio continuo del dolor. Se han informado efectos secundarios como prurito, somnolencia, temblores y fiebre. Se pueden producir efectos adversos poco frecuentes pero potencialmente graves de la analgesia epidural, como un fuerte dolor de cabeza de larga duración después de la inyección, o una lesión nerviosa.
¿Qué evidencia se encontró?
Se buscó la evidencia en abril de 2017 y se identificaron 40 ensayos en los que participaron más de 11 000 mujeres, que contribuyeron con información a esta revisión. Los ensayos variaron en cuanto a la calidad de sus métodos.
Todos los estudios excepto seis compararon la analgesia epidural con fármacos opiáceos inyectados. La epidural puede aliviar el dolor del parto con mayor eficacia que los opiáceos, y es posible que más mujeres estén más satisfechas con la epidural como alivio del dolor. En general, es más probable que las mujeres que utilizan analgesia epidural necesiten fórceps o ventosas como ayuda durante el parto, en comparación con los fármacos opiáceos. Sin embargo, no se observó este efecto en los estudios realizados desde 2005, en los que fue más probable el uso de concentraciones más bajas de anestésico local y de técnicas epidurales más modernas, como la analgesia epidural controlada por la paciente (AECP). La epidural, en comparación con los opiáceos, probablemente hace poca o ninguna diferencia en las tasas de cesárea, las mujeres con dolor de espalda a largo plazo, los efectos en el recién nacido o el número de recién nacidos ingresados en cuidados intensivos neonatales.
Las mujeres que recibieron epidural pueden tener problemas para orinar y pueden presentar fiebre. Hay hallazgos muy variables como un parto más largo, presión sanguínea muy baja y no poder moverse durante un período de tiempo después del parto (bloqueo motor), probablemente debido a que se utilizan concentraciones más altas de anestésico local en la epidural o al uso de infusiones epidurales en lugar de dosis epidurales de alivio del dolor administradas a intervalos. Sin embargo, las mujeres que recibieron fármacos opiáceos también mostraron algunos efectos secundarios como la disminución de la respiración, por lo que necesitaron usar una máscara de oxígeno, y más náuseas y vómitos. A más recién nacidos cuyas madres recibieron opiáceos se les administró un fármaco para contrarrestar los efectos de los opiáceos. No hubo diferencias entre las mujeres del grupo de epidural o de opiáceos en cuanto a la depresión posparto, los dolores de cabeza, el prurito, los escalofríos o la somnolencia.
Las mujeres con epidural informaron menos dolor en comparación con las mujeres en placebo o sin tratamiento, o con acuestimulación. En los ensayos que compararon la analgesia epidural con la inhalada, o el apoyo continuo, no se informó sobre el dolor.
¿Qué significa esto?
Las epidurales pueden reducir el dolor durante el trabajo de parto con mayor efectividad que cualquier otra forma de alivio del dolor, y pueden aumentar la satisfacción materna con el alivio del dolor. Sin embargo, algunas mujeres que reciben una epidural en lugar de a fármacos opiáceos pueden tener más probabilidades de tener un parto vaginal asistido, pero este hallazgo probablemente refleja las mayores concentraciones de anestésicos locales utilizados tradicionalmente, en lugar de las bajas concentraciones de las epidurales modernas. Sería útil realizar más estudios de investigación que utilicen medidas más consistentes de reducción de los resultados adversos con las epidurales.
Authors' conclusions
Summary of findings
| Epidural compared to opioids in labour (maternal outcomes) | ||||||
| Patient or population: women in labour | ||||||
| Outcomes | Anticipated absolute effects* (95% CI) | Relative effect | № of participants | Quality of the evidence | Comments | |
| Risk with opioids | Risk with epidural | |||||
| Pain intensity measured using pain score in labour (lower scores = less pain) | SMD 2.64 lower | ‐ | 1133 | ⊕⊕⊝⊝ | ‐ | |
| Satisfaction with pain relief ‐ proportion rating excellent or very good | Study population | Average RR 1.47 | 1911 | ⊕⊕⊝⊝ | ‐ | |
| 500 per 1000 | 735 per 1000 | |||||
| Assisted vaginal birth | Study population | RR 1.44 | 9948 | ⊕⊕⊝⊝ | ‐ | |
| 99 per 1000 | 142 per 1000 | |||||
| Caesarean section | Study population | RR 1.07 | 10,350 | ⊕⊕⊕⊝ | ‐ | |
| 114 per 1000 | 122 per 1000 | |||||
| Side effects (maternal) ‐ long‐term backache | Study population | RR 1.00 | 814 | ⊕⊕⊕⊝ | ‐ | |
| 585 per 1000 | 585 per 1000 | |||||
| Admission to special care baby unit/neonatal intensive care unit (as defined by trialists) | Study population | RR 1.03 | 4488 | ⊕⊕⊕⊝ | ‐ | |
| 204 per 1000 | 210 per 1000 (194 to 228) | |||||
| Apgar score less than 7 at 5 minutes | Study population | RR 0.73 | 8752 | ⊕⊕⊝⊝ | ‐ | |
| 17 per 1000 | 12 per 1000 | |||||
| *The risk in the intervention group (and its 95% confidence interval) is based on the assumed risk in the comparison group and the relative effect of the intervention (and its 95% CI). | ||||||
| GRADE Working Group grades of evidence | ||||||
| 1Downgraded due to limitation of study design (‐1). | ||||||
Background
This review was last updated (Anim‐Somuah 2011) as one of a series of Cochrane Reviews examining pain management in labour. These reviews contributed to an overview of systematic reviews of pain management for women in labour (Jones 2012), and shared a generic protocol (Jones 2011). This current review is an update from the previous version (Anim‐Somuah 2011).
Description of the condition
Pain relief is an important issue for women in labour. The level of pain experienced and the effectiveness of pain relief may influence a woman's satisfaction with labour and the birth and may have immediate and long‐term emotional and psychological effects (Christiansen 2002). The type of pain relief used in labour may impact on breastfeeding and mother‐infant interaction (Walker 1997).
Women experience varying degrees of pain in labour and exhibit an equally varying range of responses to it. An individual's reaction to the pain of labour may be influenced by the circumstances of her labour, the environment, her cultural background, preparation for labour and the support available to her (Brownridge 1991; McCrea 2000; Rowlands 1998). Need for pain relief in labour is also influenced by the type of onset of labour (spontaneous or induced) and medical interventions such as instrumental vaginal delivery and episiotomy. Several methods of relieving pain in labour and various coping strategies have been advocated, ranging from limited intervention such as breathing exercises to medical techniques like epidural analgesia. Regardless of the intensity of the pain experienced and response generated, it is important that whatever method is used to ameliorate maternal discomfort, it is both effective and safe for the mother and baby.
Relaxation therapies, distraction techniques, hypnosis Madden 2016) and continuous support (Bohren 2017) are believed to help women in labour to use their own resources to cope with pain. Other non‐pharmacological methods used for relieving pain include acupressure, acupuncture, reflexology, aromatherapy, transcutaneous electrical nerve stimulation and intradermal injection of sterile water (Martensson 1999). Reported effectiveness of these methods varies (Dowswell 2009; Ranta 1994; Smith 2011a; Smith 2011b). There are data to show that women who have continuous intrapartum support are less likely to have pain relief in labour (Bohren 2017; Lieberman 2002), and measures, such as labouring in water, massage, acupuncture and hypnosis, may be helpful therapies for pain management in labour (Chang 2002; Cluett 2009; Cyna 2004). Efficacy of other methods such as audioanalgesia and music therapy remains to be assessed (Cluett 2009). Pharmacological methods like inhalation of nitrous oxide, parenteral injection of opioids and regional analgesia in the form of epidural and combined spinal epidural are also commonly used to relieve pain in labour.
Description of the intervention
Epidural analgesia was first used in obstetric practice in 1946 and its use in labour has steadily increased over the past 20 years, with more than 20% of women in the UK, 60% in the USA and increasing numbers of women in China choosing this form of pain relief (DOH 2005; Grant 2015; Hu 2016; Sng 2015). However, there is considerable variation in the availability and use of epidural analgesia between hospitals in the same country and between different countries across the world.
Epidural analgesia is a central nerve blockade technique, which involves the injection of a local anaesthetic with or without an adjunct such as the opioid fentanyl, into the epidural space of the lower region of the spine close to the nerves that transmit painful stimuli from the contracting uterus and birth canal. Protocols for the care of women using epidural analgesia vary among hospitals. Epidural solutions are administered either by bolus, continuous infusion or patient‐controlled pump. An intermittent technique involves injections of local anaesthetic through a catheter positioned in the epidural space. Boluses of higher concentrations, as used in the earlier years, have been associated with a dense motor block resulting in reduced mobility, decreased pelvic tone and loss of the bearing‐down sensations usually experienced in the second stage of labour (Thornton 2001). More recently there has been a trend to use a lower concentration of local anaesthetic in combination with a variety of opiates; these combinations provide analgesic effect while allowing the woman to maintain some motor function, such as the ability to move during her labour and retain her ability to bear down (COMET 2001; Russell 2000; Sng 2015), and avoid an assisted vaginal birth such as the use of forceps. Combined‐spinal‐epidural (CSE) involves a single injection of local anaesthetic or opiate or both into the cerebral spinal fluid, as well as insertion of the epidural catheter. CSE combines the advantages of spinal analgesia (faster onset of pain relief,from the time of injection and more reliable analgesia) with the advantages of epidural analgesia, such as continuing pain relief, potentially maintained throughout the entire duration of labour (Simmons 2012; Sng 2015)
How the intervention might work
Epidural analgesia is considered to be the most effective method for reducing pain in labour (Brownridge 1991; Howell 2001). The anaesthetic inhibits nerve conduction by blocking sodium channels in nerve membranes, thereby preventing the propagation of nerve impulses along these fibres. Blocking of painful impulses from the nerves as they cross the epidural space results in analgesia which is usually apparent within 10 to 20 minutes of administration. The anaesthetic placed in the epidural space exerts a concentration‐specific effect, affecting all the types of sensation of the blocked nerves to varying degrees, such that administration of a lower‐dose anaesthetic (e.g. 0.125% bupivacaine, 0.1% or 0.2% ropivacaine) selectively blocks painful stimuli whilst largely preserving motor function. Traditionally, higher doses of local anaesthetic were used, leading to excessive motor blockade that limited mobility in labour (Sng 2015). Epidural analgesia allows the woman to remain alert during labour. The regional administration of epidural drugs may help avoid some systemic side effects of analgesic medication on the baby, such as opioid‐induced neonatal respiratory depression. A functioning epidural allows the option of regional anaesthesia for interventions such as caesarean section or manual removal of retained placenta, thereby avoiding the risks associated with general anaesthesia (Hibbard 1996). However, spinal anaesthesia can also be used for this purpose.
Why it is important to do this review
Although epidural analgesia usually provides effective pain relief in labour, it may be associated with unwanted effects for the mother and baby. Reported maternal complications may include hypotension (a reduction in maternal blood pressure (BP)). Severe sudden hypotension (sometimes defined as more than a 20% decrease in baseline BP) may result in a clinically significant decrease in utero‐placental blood flow, which could potentially affect delivery of oxygen to the baby. This may especially compromise a baby with inadequate reserves (Vincent 1998). For this reason, intravenous fluids may be given before administering the epidural drugs (fluid preload) to attenuate the decrease in maternal BP. Side effects such as itchiness, drowsiness, shivering and fever have also been reported (Buggy 1995; Eberle 1996). Women may develop urinary retention while using epidural analgesia. This may necessitate the insertion of a catheter to drain the bladder. Urinary retention in the postpartum period has been attributed to long labours in women using epidural analgesia (Liang 2002). Less common side effects reported are accidental puncture of the dura, which can cause severe headache (post‐dural puncture headache (1%) (Stride 1993)). This resolves spontaneously in some women; however, a blood patch may be needed when the headache is persistent. This involves a sterile injection of 15 mL to 20 mL of the woman's fresh blood into the epidural space (Bromage 1999; Vincent 1998). This resolves the headache for 60% of women.
Epidural analgesia may influence the course of labour. There have been suggested associations with malpositions of the fetal head, prolonged labour, increased use of oxytocin and of instrumental deliveries (Eberle 1996);. Effects of epidural analgesia on the neonate may be mixed. Higher cord pH values and less naloxone use at birth have been reported (Halpern 1998), as has a greater need for neonatal resuscitation (COMET 2001). It has been suggested that babies of women who use epidural analgesia may be more prone to low blood sugar in the first hours after birth (Swanström 1981b).
Objectives
To assess the effectiveness and safety of all types of epidural analgesia, including combined‐spinal‐epidural (CSE) on the mother and the baby, when compared with non‐epidural or no pain relief during labour.
Methods
Criteria for considering studies for this review
Types of studies
Randomised controlled trials (RCTs) comparing all types of epidural analgesia including CSE with alternative forms of pain relief not involving regional analgesia or no pain relief in labour. We included abstracts of unpublished manuscripts of RCTs, provided there was sufficient information to assess eligibility and risk of bias, and excluded quasi‐randomised trials. We excluded studies with a high level of attrition (more than 25%). We have not included cluster‐randomised trials in this update.
Types of participants
Pregnant women requesting pain relief in labour, regardless of parity and whether labour was spontaneous or induced.
Types of interventions
We considered all forms of epidural administration, compared with any form of pain relief not involving regional blockade, or no pain relief. Trials comparing different techniques of epidural are the subject of another review (Simmons 2012).
The previous version of this review was one in a series of Cochrane Reviews examining pain management in labour that contributed to an overview of systematic reviews. They shared a generic protocol. To avoid duplication, the different methods of pain management were listed in a specific order, from 1 to 15. Individual reviews focusing on particular interventions included comparisons with only the intervention above it on the list. The list is as follows:
-
Placebo/no treatment
-
Hypnosis (Madden 2016)
-
Biofeedback (Barragán 2011)
-
Intracutaneous or subcutaneous sterile water injection (Derry 2012)
-
Immersion in water (Cluett 2009)
-
Aromatherapy (Smith 2011a)
-
Relaxation techniques (yoga, music, audio) (Smith 2018a)
-
Acupuncture or acupressure (Smith 2011b)
-
Manual methods (massage, reflexology) (Smith 2018b)
-
Transcutaneous electrical nerve stimulation (TENS) (Dowswell 2009)
-
Inhaled analgesia (Klomp 2012)
-
Opioids (Ullman 2010)
-
Non‐opioid drugs (Othman 2011)
-
Local anaesthetic nerve blocks (Novikova 2011)
-
Epidural (including combined spinal epidural) (Simmons 2012)
Accordingly, where data are available, this review includes comparisons of any form of epidural administration, compared with: 1. placebo/no treatment; 2. hypnosis; 3. biofeedback; 4. intracutaneous or subcutaneous sterile water injection; 5. immersion in water; 6. aromatherapy; 7. relaxation techniques (yoga, music, audio); 8. acupuncture or acupressure; 9. manual methods (massage, reflexology); 10. TENS; 11. inhaled analgesia; 12. opioids; 13. non‐opioid drugs; and 14. local anaesthetic nerve blocks.
Types of outcome measures
Primary outcomes
Effectiveness of interventions
Pain intensity (as defined by trialists)
Satisfaction with pain relief (as defined by trialists)
Sense of control in labour (as defined by trialists)
Satisfaction with childbirth experience (as defined by trialists)
Need for other means of pain relief
Safety of interventions
Effect (negative) on mother/baby interaction
Breastfeeding (at specified time points)
Assisted vaginal birth
Caesarean section
Side effects (for mother)
-
Long‐term backache (as defined by trial authors)
-
Maternal hypotension (as defined by authors)
-
Postnatal depression (authors' definition, treatment for depression or self‐reported)
-
Motor blockade
-
Respiratory depression requiring oxygen administration
-
Uterine rupture
-
Headache
-
Headache requiring blood patch
-
Venous thromboembolic events
-
Perineal trauma requiring suturing
-
Nausea or vomiting or both
-
Itching
-
Fever
-
Shivers
-
Drowsiness
-
Urinary retention
-
Catheterisation during labour
-
Other morbidity (e.g. impaired consciousness, meningitis, intensive care unit admission, paralysis)
-
Malposition (as defined by trial authors)
-
Surgical amniotomy
Side effects (for baby)
-
Acidosis, as defined by cord blood arterial pH less than 7.2
-
Acidosis, as defined by cord blood arterial pH less than 7.15
-
Naloxone administration
-
Neonatal hypoglycaemia (less than or equal to 1.67 mmol/l)
-
Birth trauma
-
Long‐term neonatal complication
-
Meconium staining of liquor
Admission to special care baby unit/neonatal intensive care unit (as defined by trialists)
Apgar score less than seven at five minutes
Poor infant outcomes at long‐term follow‐up (as defined by trialists, e.g. seizures, disability in childhood)
Other outcomes
Cost (as defined by trialists)
Secondary outcomes
Length of first stage of labour
Length of second stage of labour
Oxytocin augmentation
Caesarean section for fetal distress
Caesarean section for dystocia
Search methods for identification of studies
The following Methods section of this review is based on a standard template used by Cochrane Pregnancy and Childbirth.
Electronic searches
[For this update], We searched Cochrane Pregnancy and Childbirth’s Trials Register by contacting their Information Specialist (30 April 2017).
The Register is a database containing over 24,000 reports of controlled trials in the field of pregnancy and childbirth. It represents over 30 years of searching. For full current search methods used to populate Pregnancy and Childbirth’s Trials Register including the detailed search strategies for CENTRAL, MEDLINE, Embase and CINAHL; the list of handsearched journals and conference proceedings, and the list of journals reviewed via the current awareness service, please follow this link to the editorial information about the Cochrane Pregnancy and Childbirth in the Cochrane Library and select the ‘Specialized Register ’ section from the options on the left side of the screen.
Briefly, Cochrane Pregnancy and Childbirth’s Trials Register is maintained by their Information Specialist and contains trials identified from:
-
monthly searches of the Cochrane Central Register of Controlled Trials (CENTRAL);
-
weekly searches of MEDLINE (Ovid);
-
weekly searches of Embase (Ovid);
-
monthly searches of CINAHL (EBSCO);
-
handsearches of 30 journals and the proceedings of major conferences;
-
weekly current awareness alerts for a further 44 journals plus monthly BioMed Central email alerts.
Search results are screened by two people and the full text of all relevant trial reports identified through the searching activities described above is reviewed. Based on the intervention described, each trial report is assigned a number that corresponds to a specific Pregnancy and Childbirth review topic (or topics), and is then added to the Register. The Information Specialist searches the Register for each review using this topic number rather than keywords. This results in a more specific search set that has been fully accounted for in the relevant review sections (Included studies; Excluded studies; Studies awaiting classification).
We also searched ClinicalTrials.gov and the WHO International Clinical Trials Registry Platform (ICTRP) for unpublished, planned and ongoing trial reports (30 April 2017) (See: Appendix 1 for search methods used).
Searching other resources
We searched the reference lists of retrieved studies.
We did not apply any language or date restrictions.
Data collection and analysis
For methods used in the previous version of this review, seeAnim‐Somuah 2011.
For this update, we used the following methods for assessing the trial reports that we identified as a result of the updated search.
The following Methods section of this review is based on a standard template used by Cochrane Pregnancy and Childbirth.
Selection of studies
Two review authors independently assessed for inclusion all the potential studies identified as a result of the search strategy. We resolved any disagreement through discussion or, if required, we consulted a third review author.
Data extraction and management
We designed a form to extract data. For eligible studies, two review authors extracted the data using the agreed form. We resolved discrepancies through discussion or, if required, we consulted a third review author. We entered data into Review Manager 5 software (RevMan 2014) and checked them for accuracy.
When information about any of the above was unclear, we planned to contact authors of the original reports to provide further details.
Assessment of risk of bias in included studies
Two review authors independently assessed risks of bias for each study, using the criteria outlined in the Cochrane Handbook for Systematic Reviews of Interventions (Higgins 2011). We resolved any disagreement by discussion or by involving a third assessor.
(1) Random sequence generation (checking for possible selection bias)
We described for each included study the method used to generate the allocation sequence in sufficient detail to allow an assessment of whether it should produce comparable groups.
We assessed the method as:
-
low risk of bias (any truly random process, e.g. random‐number table; computer random‐number generator);
-
high risk of bias (any non‐random process, e.g. odd or even date of birth; hospital or clinic record number);
-
unclear risk of bias.
(2) Allocation concealment (checking for possible selection bias)
We described for each included study the method used to conceal allocation to interventions prior to assignment and assessed whether intervention allocation could have been foreseen in advance of or during recruitment, or changed after assignment.
We assessed the methods as:
-
low risk of bias (e.g. telephone or central randomisation; consecutively‐numbered sealed opaque envelopes);
-
high risk of bias (open random allocation; unsealed or non‐opaque envelopes, alternation; date of birth);
-
unclear risk of bias.
(3.1) Blinding of participants and personnel (checking for possible performance bias)
We described for each included study the methods used, if any, to blind study participants and personnel from knowledge of which intervention a participant received. We considered that studies were at low risk of bias if they were blinded, or if we judged that the lack of blinding was unlikely to affect results. We assessed blinding separately for different outcomes or classes of outcomes.
We assessed the methods as:
-
low, high or unclear risk of bias for participants;
-
low, high or unclear risk of bias for personnel.
(3.2) Blinding of outcome assessment (checking for possible detection bias)
We described for each included study the methods used, if any, to blind outcome assessors from knowledge of which intervention a participant received. We assessed blinding separately for different outcomes or classes of outcomes.
We assessed methods used to blind outcome assessment as:
-
low, high or unclear risk of bias.
(4) Incomplete outcome data (checking for possible attrition bias due to the amount, nature and handling of incomplete outcome data)
We described for each included study, and for each outcome or class of outcomes, the completeness of data including attrition and exclusions from the analysis. We stated whether attrition and exclusions were reported and the numbers included in the analysis at each stage (compared with the total randomised participants), reasons for attrition or exclusion where reported, and whether missing data were balanced across groups or were related to outcomes. Where sufficient information was reported, or could be supplied by the trial authors, we planned to re‐include missing data in the analyses which we undertook.
We assessed methods as:
-
low risk of bias (e.g. no missing outcome data; missing outcome data balanced across groups);
-
high risk of bias (e.g. numbers or reasons for missing data imbalanced across groups; ‘as treated’ analysis, done with substantial departure of intervention received from that assigned at randomisation);
-
unclear risk of bias.
(5) Selective reporting (checking for reporting bias)
We described for each included study how we investigated the possibility of selective outcome reporting bias and what we found.
We assessed the methods as:
-
low risk of bias (where it is clear that all of the study’s prespecified outcomes and all expected outcomes of interest to the review have been reported);
-
high risk of bias (where not all the study’s prespecified outcomes have been reported; one or more reported primary outcomes were not prespecified; outcomes of interest are reported incompletely and so cannot be used; study fails to include results of a key outcome that would have been expected to have been reported);
-
unclear risk of bias.
(6) Other bias (checking for bias due to problems not covered by (1) to (5) above)
We described for each included study any important concerns we had about other possible sources of bias.
(7) Overall risk of bias
We made explicit judgements about whether studies were at high risk of bias, according to the criteria given in the Cochrane Handbook (Higgins 2011). With reference to (1) to (6) above, we planned to assess the likely magnitude and direction of the bias and whether we considered it likely to impact on the findings. In future updates, we will explore the impact of the level of bias through undertaking sensitivity analyses (see Sensitivity analysis).
Assessment of the quality of the evidence using the GRADE approach
For this update we assessed the quality of the evidence using the GRADE approach, as outlined in the GRADE handbook in order to assess the quality of the body of evidence relating to the following outcomes for the main comparison: epidural anaesthesia versus opioids.
-
Pain intensity (as defined by trialists)
-
Satisfaction with pain relief (as defined by trialists)
-
Assisted vaginal birth
-
Caesarean section
-
Side effects (for mother): long‐term backache (as defined by trialists)
-
Admission to special care baby unit/neonatal intensive care unit (as defined by trialists)
-
Apgar score less than seven at five minutes
We used the GRADEpro Guideline Development Tool to import data from Review Manager 5 (RevMan 2014) in order to create a ’Summary of findings’ table. We produced a summary of the intervention effect and a measure of quality for each of the above outcomes, using the GRADE approach. This uses five considerations (study limitations, consistency of effect, imprecision, indirectness and publication bias) to assess the quality of the body of evidence for each outcome. The evidence can be downgraded from 'high quality' by one level for serious (or by two levels for very serious) limitations, depending on assessments for risk of bias, indirectness of evidence, serious inconsistency, imprecision of effect estimates or potential publication bias.
Measures of treatment effect
Dichotomous data
For dichotomous data, we presented results as a summary risk ratio (RR) with a 95% confidence interval (CI).
Continuous data
We used the mean difference (MD) if outcomes were measured in the same way between trials. We used the standardised mean difference (SMD) to combine trials that measured the same outcome, but used different methods.
Unit of analysis issues
Cluster‐randomised trials
We include no cluster‐randomised trials in this update (2018). In future updates, we will include cluster‐randomised trials in the analyses along with individually‐randomised trials. We will adjust their sample sizes using the methods described in the Cochrane Handbook using an estimate of the intracluster correlation co‐efficient (ICC) derived from the trial if possible, from a similar trial or from a study of a similar population. If we use ICCs from other sources, we will report this and conduct sensitivity analyses to investigate the effect of variation in the ICC. If we identify both cluster‐randomised trials and individually‐randomised trials, we plan to synthesise the relevant information. We will consider it reasonable to combine the results from both if there is little heterogeneity between the study designs and if we consider the interaction between the effect of intervention and the choice of randomisation unit to be unlikely.
We will also acknowledge heterogeneity in the randomisation unit and perform a sensitivity analysis to investigate the effects of the randomisation unit.
Cross‐over trials
Cross‐over designs are not a valid study design for this review.
Other unit of analysis issues
Multiple pregnancies
Most of the data in the review are from trials recruiting women with singleton pregnancies only, and in those trials which included women with multiple pregnancies or which did not specify whether such women were included, the number of such pregnancies was likely to be a small proportion of the sample. We therefore did not adjust findings for multiple pregnancies to take account of possible non‐independence of outcomes for babies from the same pregnancy.
Trials with more than two treatment groups
In this update, trials with more than two treatment groups contributed data into different comparisons and so unit‐of‐analysis errors were not an issue. In future updates, where necessary, we plan to follow the methods as described in the Cochrane Handbook (16.5.4) in order to avoid unit‐of‐analysis errors (combine groups to create a single pair‐wise comparison or select one pair of interventions and exclude others).
Dealing with missing data
For included studies, we noted levels of attrition. In future updates, if we include more eligible studies, we will explore the impact of including studies with high levels of missing data in the overall assessment of treatment effect, by using sensitivity analysis.
For all outcomes, we conducted analyses as far as possible on an intention‐to‐treat basis, i.e. we attempted to include all participants randomised to each group in the analyses. The denominator for each outcome in each trial was the number randomised minus any participants whose outcomes were known to be missing.
Assessment of heterogeneity
We assessed statistical heterogeneity in each meta‐analysis using the Tau2, I2 and Chi2 statistics. We regarded heterogeneity as substantial if I2 was greater than 30% and either Tau2 was greater than zero, or there was a low P value (less than 0.10) in the Chi2 test for heterogeneity. If we identified substantial heterogeneity (above 30%), we planned to explore it by prespecified subgroup analysis.
Assessment of reporting biases
If there were 10 or more studies in the meta‐analysis for important outcomes we investigated reporting biases (such as publication bias) using funnel plots. We assessed the funnel plots' asymmetry visually. Where asymmetry was suggested by a visual assessment, we reported this in the Results. We may perform exploratory analyses to investigate the asymmetry in future updates. Funnel plots are displayed for GRADE outcomes.
Data synthesis
We carried out statistical analysis using the Review Manager 5 software (RevMan 2014). We used fixed‐effect meta‐analysis for combining data where it was reasonable to assume that studies were estimating the same underlying treatment effect, i.e. where trials were examining the same intervention, and we judged the trials’ populations and methods to be sufficiently similar.
If there was clinical heterogeneity sufficient to expect that the underlying treatment effects differed between trials, or if we found substantial statistical heterogeneity, we used random‐effects meta‐analysis to produce an overall summary if an average treatment effect across trials was considered clinically meaningful. We considered the random‐effects summary as the average range of possible treatment effects and we discussed the clinical implications of treatment effects differing between trials. If the average treatment effect was not clinically meaningful, we did not combine trials. If we used random‐effects analyses, we present the results as the average treatment effect with a 95% confidence interval, and the estimates of Tau2 and I2.
Subgroup analysis and investigation of heterogeneity
We planned to investigate substantial heterogeneity using subgroup analyses.
For the primary outcomes, where data were available, we planned the following subgroup analyses:
-
Spontaneous labour versus induced labour.
-
Primigravida versus multiparous.
-
Term versus preterm birth.
-
Continuous support in labour versus no continuous support.
We planned to assess subgroup differences by interaction tests available within RevMan (RevMan 2014) and to report the results of subgroup analyses quoting the Chi2 statistic and P value, and the interaction test I2 value. We did not carry out planned subgroup analyses because a complete breakdown of the separate subgroup categories was rarely provided.
We conducted a post hoc subgroup analysis of trials conducted after 2005 for the outcome of assisted vaginal birth for the main comparison of epidural versus opioids, in response to peer referee comments.
Sensitivity analysis
We planned to carry out sensitivity analyses to explore the effect of risks of bias assessed by concealment of allocation, high attrition rates, or both, with studies of high or unclear risk of bias being excluded from the analyses in order to assess whether this made any difference to the overall result. We conducted this sensitivity analysis, where possible, for the outcomes maternal satisfaction with pain relief; and need for additional means of pain relief.
Results
Description of studies
Results of the search
See: Figure 1.

Study flow diagram.
We retrieved 424 trial reports to assess in the April 2017 search, including two trials (three reports) that were awaiting further classification in the previous version of the review (Moreno 1997; Vavrinkova 2005). We screened out 379 reports and assessed 45 full‐text trial reports. Some trials had more than one report.
We included 16 new trials (in 24 reports) and 13 of these trials contributed data to this update (De Orange 2011; Douma 2011; Freeman 2014; Genc 2015; Ismail 2012; Jaitley 2011; Khadem 2013; Liu 2015; Logtenberg 2017; Sabry 2011; Stocki 2011; Tveit 2012; Xing 2015). Chen 2008b and Jain 2012 did not contribute data. One report was an additional study to a trial that was already included in the review and did not contribute any new data (Evron 2008). We excluded nine studies (in 13 reports) and added an additional report to an already excluded trial. Six trials (in eight reports) are awaiting further classification due to lack of information to enable assessment. We have attempted to contact and are awaiting response from three trial authors (Antipin 2014; Gupta 2016 ; Weissman 2006), but were unable to find contact details for the remaining three (Kamali 2016; Marshalov 2012; Vavrinkova 2005).
We have also excluded Chen 2000, which was not a randomised controlled trial (RCT), and Nafisi 2006 which was a quasi‐RCT, but were both included in the last update.
Overall, this review now includes 52 studies, 12 of which did not contribute data (Camann 1992; Chen 2008a; Chen 2008b; Evron 2007; Jain 2012; Lian 2008; Morris 1994; Rabie 2006; Scavone 2002; Shifman 2007; Sullivan 2002; Witoonpanich 1984). Of these 12, two (Chen 2008b; Jain 2012) did not report any outcomes of this review; four (Camann 1992; Evron 2007; Lian 2008; Shifman 2007) did not report them in a format that could be included in the analysis; there were limited data from only an abstract in five (Chen 2008a; Rabie 2006; Scavone 2002; Sullivan 2002; Witoonpanich 1984), and one study (Morris 1994) reported unclear cross‐over data.
Included studies
Of the 40 RCTs contributing data, 34 compared epidural with opioids, seven trials compared epidural with no analgesia, one trial compared epidural with acu‐stimulation, one trial compared epidural with inhaled analgesia, and one trial compared epidural with continuous midwifery support and other analgesia. Three trials (Jaitley 2011; Liu 2015; Long 2003) included multiple intervention arms and contributed data to epidural compared with opioids, and epidural compared with no analgesia. Liu 2015 also contributed data to epidural compared with acu‐stimulation.
The trials that did not contribute data compared epidural with: no analgesia (four trials) (Chen 2008a; Chen 2008b; Lian 2008; Shifman 2007); intravenous (IV) sufentanil (one trial) (Camann 1992); intramuscular (IM) tramadol (one trial) (Jain 2012); PCA pethidine (one trial) (Evron 2007); IV and IM hydromorphone (two trials) (Scavone 2002; Sullivan 2002); IV fentanyl (one trial) (Morris 1994); PCA remifentanil (one trial) (Rabie 2006); and IM pethidine or pentazocine (one trial) (Witoonpanich 1984).
Settings
All trials were conducted in a hospital setting.
Trials comparing epidural and opioid analgesia took place in the USA (5167 women) (Bofill 1997; Clark 1998; Gambling 1998; Head 2002; Hogg 2000; Lucas 2001; Ramin 1995; Sharma 1997; Sharma 2002; Thorp 1993), the Netherlands (1948 women) (Douma 2011; Freeman 2014; Logtenberg 2017), Egypt (90 women) (El‐Kerdawy 2010; Sabry 2011), Israel (313 women) (Evron 2008; Stocki 2011), France (90 women) (Grandjean 1979), Canada (477 women) (Halpern 2004; Muir 1996; Muir 2000), United Kingdom (985 women) (Howell 2001; Loughnan 2000), Kuwait (1140 women) (Ismail 2012), India (216 women) (Jain 2003; Jaitley 2011), Malaysia (192 women) (Jalil 2009), China (200 women) (Liu 2015; Long 2003), Denmark (112 women) (Philipsen 1989), Sweden (28 women) (Thalme 1974), Norway (39 women) (Tveit 2012), and Finland (72 women) (Nikkola 1997; Volmanen 2008).
Eleven trials took place between 1990 and 2000: Bofill 1997 1995 ‐ 1996; Clark 1998 1995 ‐ 1996; Gambling 1998 1994 ‐ 1995; Halpern 2004 1997 ‐ 1999; Howell 2001 1992 ‐ 1997; Loughnan 2000 1992 ‐ 1995; Lucas 2001 1996 ‐ 1998; Ramin 1995 1993 ‐ 1994; Sharma 1997 1995 ‐ 1996; Sharma 2002 1998 ‐ 2000; Thorp 1993 1990 ‐ 1992. Six trials took place between 2000 and 2010: Douma 2011 2008 ‐ 2010; Evron 2008 2003; Jalil 2009 2005 ‐ 2006; Sabry 2011 2008 ‐ 2009; Stocki 2011 2010. Ismail 2012 was conducted between 2009 and 2011. Three trials took place between 2010 ‐ 2013: Freeman 2014 2011 ‐ 2012; Liu 2015 2010 ‐ 2013; Logtenberg 2017 2012 ‐ 2013. Dates were not stated in 14 trials (El‐Kerdawy 2010; Grandjean 1979; Head 2002; Hogg 2000; Jain 2003; Jaitley 2011; Long 2003; Muir 1996; Muir 2000; Nikkola 1997; Philipsen 1989; Thalme 1974; Tveit 2012; Volmanen 2008).
Trials comparing epidural and placebo or no treatment took place in China (508 women) (Liu 2015; Long 2003; Xing 2015), and one was set in Brazil (70 women) (De Orange 2011), Turkey (100 women) (Genc 2015), India (90 women) (Jaitley 2011), and Mexico (129 women) (Morgan‐Ortiz 1999). One study took place from 1997 to 1998 (Morgan‐Ortiz 1999), three studies were all conducted between 2010 and 2014: De Orange 2011 2010; Genc 2015 2012 ‐ 2014; Liu 2015 2010 – 2013; Xing 2015 2013 ‐ 2014, and two studies did not specify the study dates (Jaitley 2011; Long 2003).
One trial Liu 2015 (2010 ‐ 2013) conducted in China also compared epidural and acu‐stimulation.
One trial (Khadem 2013), comparing epidural and inhaled analgesia, took place in Iran between 2010 and 2011.
One trial (Dickinson 2002), comparing epidural and continuous support with other analgesia, was conducted in Australia between 1997 and 1999.
Funding and declarations of interest
The majority of trials did not state funding sources. Four were funded by the hospitals in which the trials took place: Bofill 1997 was by the Vicksburg Hospital Medical Foundation; Douma 2011 the Department of Anesthesiology, Leiden University Medical Centre; Sharma 2002 was solely from institutional or departmental sources of their host hospital; Tveit 2012 was by the Sorlandet Hospital HF, Sorlandets Kompetansefond and Helse Sor‐Ost, Norway. Most were funded by medical research grants, foundations, or combinations of the two: Dickinson 2002 was funded by National Health and Medical Research Council Grant 970076, Australia; Evron 2008 was supported by National Institute for Health Grant GM 061655 (Bethesda, MD), the Gheens Foundation (Louisville, KY), the Joseph Drown Foundation (Los Angeles, CA), and the Commonwealth of Kentucky Research Challenge Trust Fund (Louisville, KY); Freeman 2014 grant from ZonMW (Dutch Organization for Health Care Research and Development); Halpern 2004 was supported by Physicians Services Incorporated Foundation, Toronto; Alberta Heritage Fund; Clinical Teaching and Research Grant, College of Medicine, University of Saskatchewan; Medical Services Incorporated of Alberta; Grace Maternity Research Foundation Grant; and Dalhousie University Department of Anaesthesia; Howell 2001 was funded by WellBeing, a grant from the North Staffordshire Medical Institute, and a grant from the NHS(E) West Midlands Research and Development Programme; Jalil 2009 was funded by a short‐term grant from the Universiti Sains Malaysia; Khadem 2013 by the Women’s Health Research Center of Mashhad University of Medical Sciences; Loughnan 2000 by the National Health Service Executive, North Thames; Nikkola 1997 was supported by funds from Instrumentarium Research Foundation, Finland and funds from Turku University Hospital, Finland; Stocki 2011 this study was supported by a research grant for Anesthesiologists from the Hadassah Hebrew University Medical Center, Jerusalem; Thalme 1974 supported by a grant from the Swedish Medical Research Council; and Xing 2015 was supported by the Scientific and Technological Key Project of Nanning City (no. 20133189). Sabry 2011 was self‐funded.
De Orange 2011, Douma 2011, Evron 2008, Freeman 2014, Genc 2015, Ismail 2012, Sabry 2011, Xing 2015 all stated they had no conflicts of interest to declare. Stocki 2011 reported that two authors received money for travel to conference to present the paper from Oridion®, a company who had provided equipment for their trial. No other trials stated whether or not they had conflicts to declare.
Participants
Twenty of the 40 trials recruited primiparous women (Bofill 1997; Clark 1998; Dickinson 2002; El‐Kerdawy 2010; Genc 2015; Halpern 2004; Howell 2001; Ismail 2012; Jain 2003; Khadem 2013; Loughnan 2000; Morgan‐Ortiz 1999; Muir 1996; Muir 2000; Nikkola 1997; Sabry 2011; Sharma 2002; Thalme 1974; Thorp 1993; Xing 2015); three stated that they recruited multiparous women (Grandjean 1979; Jalil 2009; Stocki 2011); five recruited both primiparous and multiparous women (Gambling 1998; Jaitley 2011; Lucas 2001; Philipsen 1989; Sharma 1997); and parity was not reported in the remaining 12 trials. Most of the trials included women at more than 36 weeks' gestation in spontaneous labour with no obstetric or medical complications. Exceptions were Dickinson 2002 and Loughnan 2000, who included women in both spontaneous and induced labours; Lucas 2001, who recruited only women with pregnancy‐induced hypertension in both spontaneous and induced labours; Freeman 2014 and Logtenberg 2017, who recruited from 32 weeks' gestation; and Head 2002, Hogg 2000 and El‐Kerdawy 2010, who included only women with pre‐eclampsia at more than 24 weeks' gestation in labour.
Interventions and comparisons
Epidural analgesia compared with opioid analgesia (34 trials involving 10,440 women)
Epidural techniques and drugs varied between the trials. Ten trials administered a fluid preload (Bofill 1997; Clark 1998; Gambling 1998; Head 2002; Jalil 2009; Lucas 2001; Philipsen 1989; Sharma 1997; Sharma 2002; Thalme 1974). Bupivacaine or levobupivacaine was used for the epidural analgesia in most of the trials when reported. Exceptions were Grandjean 1979, which used lignocaine, and Long 2003 using ropivacaine. In Evron 2008 epidural analgesia was given with ropivacaine, with or without a combination of IV remifentanil or acetaminophen. The agents used in the epidural were not mentioned in two trials (Freeman 2014; Hogg 2000). Bupivacaine was supplemented with fentanyl in nine of the trials (El‐Kerdawy 2010; Gambling 1998; Halpern 2004; Head 2002; Jain 2003; Lucas 2001; Sharma 1997; Sharma 2002; Volmanen 2008), with pethidine in one (Muir 1996), and with tramadol in another (Jaitley 2011). Levobupivacaine was supplemented with fentanyl in one trial (Ismail 2012), in a continuous infusion. Continuous infusion was reported in another 12 studies (Bofill 1997; El‐Kerdawy 2010; Gambling 1998; Head 2002; Jain 2003; Jalil 2009; Logtenberg 2017; Lucas 2001; Ramin 1995, Sharma 1997; Sharma 2002; Tveit 2012). In all these trials, except for Jalil 2009, Logtenberg 2017, and Tveit 2012, a bolus of 0.25% of bupivacaine was used followed by infusion of 0.0125 % to maintain epidural analgesia. Jalil 2009, Logtenberg 2017, and Tveit 2012 used a bolus dose of 0.2% ropivacaine, followed by continuous epidural infusion of 0.2% ropivacaine either with fentanyl (Jalil 2009; Tveit 2012), or sufentanil (Logtenberg 2017). Two trials used a much higher concentration of bupivacaine: Philipsen 1989 used 0.375% bupivacaine and Nikkola 1997 used 0.5%. Patient‐controlled epidural analgesia (PCEA) was used in seven trials (Evron 2008; Halpern 2004; Liu 2015; Long 2003; Muir 1996; Sharma 2002; Stocki 2011). Only four of the trials (Gambling 1998; Ismail 2012; Long 2003; Sabry 2011) used combined‐spinal epidural. In Gambling 1998 spinal block was achieved with sufentanil alone and epidural infusion was started immediately following the intrathecal administration of the opoid, whereas the spinal block in Long 2003 was achieved with ropivacaine supplemented with fentanyl and epidural analgesia was given only after dissipation of the spinal analgesia. Levobupivacaine and fentanyl (total volume of 2 mL) were injected intrathecally and the spinal needle was removed in Ismail 2012. Sabry 2011 was a multi‐armed trial with four epidural arms: two arms with combined spinal epidural, and two epidural arms; and the analgesia in each arm was either bupivacaine and fentanyl, or lidocaine and fentanyl. For this review, we combined the four arms. Epidural use was discontinued in the second stage of labour in three studies (Loughnan 2000; Nikkola 1997; Philipsen 1989).
Opioids compared included: pethidine (16 trials, 6494 women) (Clark 1998; Gambling 1998; Head 2002; Hogg 2000; Howell 2001; Jalil 2009; Loughnan 2000; Lucas 2001; Muir 1996; Philipsen 1989; Ramin 1995; Sabry 2011; Sharma 1997; Sharma 2002; Thalme 1974; Thorp 1993); butorphanol (one trial, 100 women) (Bofill 1997); fentanyl (three trials, 447 women) (Halpern 2004; Muir 2000; Nikkola 1997); remifentanil (nine trials, 3462 women) (Douma 2011; El‐Kerdawy 2010; Evron 2008; Freeman 2014; Ismail 2012; Logtenberg 2017; Stocki 2011; Tveit 2012; Volmanen 2008); phenoperidine (one trial, 90 women) (Grandjean 1979); tramadol (one trial, 90 women) (Jaitley 2011); pethidine and tramadol (one trial, 126 women) (Jain 2003); pethidine or no analgesia (one trial, 80 women) (Long 2003); and ondansetron, or acu‐stimulation, or no analgesia (one trial, 120 women) (Liu 2015). Opioids were administered as patient‐controlled intravenous analgesia (PCIA) (19 trials) (Douma 2011; El‐Kerdawy 2010; Freeman 2014; Halpern 2004; Head 2002; Hogg 2000; Ismail 2012; Liu 2015; Logtenberg 2017; Long 2003; Lucas 2001; Muir 1996; Muir 2000; Nikkola 1997; Sharma 1997; Sharma 2002; Stocki 2011; Tveit 2012; Volmanen 2008), IV injection (9 trials) (Bofill 1997; Clark 1998; Evron 2008; Gambling 1998; Grandjean 1979; Jaitley 2011; Ramin 1995; Sabry 2011; Thorp 1993), and IM injection (five trials) (Howell 2001; Jain 2003; Jalil 2009; Loughnan 2000; Philipsen 1989). The route of administration was unclear in one trial (Thalme 1974).
Epidural analgesia compared with no analgesia or placebo (seven trials involving 897 women)
All seven of these trials used bupivacaine or ropivacaine for the epidural analgesia. Ropivacaine was supplemented with sufentanil in one trial (Liu 2015). Bupivacaine was supplemented with fentanyl bolus injections in Genc 2015, and with tramadol in Jaitley 2011. Morgan‐Ortiz 1999 used bupivacaine but gave no further information about the epidural. PCEA was used in two trials (Liu 2015; Long 2003). Long 2003 also used combined‐spinal‐epidural, along with De Orange 2011 and Xing 2015. In De Orange 2011 spinal block was achieved with bupivacaine and sufentanil and epidural infusion was started immediately following the intrathecal administration, whereas the spinal block in Long 2003 was achieved with ropivacaine supplemented with fentanyl and epidural analgesia was given only after dissipation of the spinal analgesia. Xing 2015 injected sufentanil intrathecally until the visual analogue scale (VAS) was three or higher, when a continuous infusion of ropivacaine and sufentanil began.
Comparison groups were not well described in two trials (190 women: Genc 2015; Jaitley 2011), although none of the women in the comparison groups had epidural analgesia. It appears that women in the control group of Jaitley 2011 did not receive pain relief; It is unclear if these women were able to request analgesia or if they were restricted to no analgesia. Women in the control groups of Liu 2015, Long 2003, Morgan‐Ortiz 1999 and Xing 2015 had no analgesia (four trials, 637 women). Both epidural and control group in De Orange 2011 were given continuous support during delivery by a doula or trained lay person, and had access to Swiss exercise balls, massage, and music therapy (one trial, 70 women).
Epidural analgesia compared with acu‐stimulation (one trial involving 60 women)
Liu 2015 used ropivacaine supplemented with sufentanil in PCEA compared with acu‐stimulation. The women in the acu‐stimulation group received pulse stimulus at acupoints – Jiaji points (T 10‐L 3) and Ciliao (BL 32). Stimulation was delivered at 100 Hz with burst frequency 2 Hz, intensity 15‐30 mA, for a duration of 30 minutes.
Epidural analgesia compared with inhaled analgesia (one trial involving 86 women)
One trial (Khadem 2013), compared epidural with inhaled nitrous oxide. Following a fluid preload, bupivacaine with fentanyl was given to women at 5 cm dilatation followed by an increase in bupivacaine concentration if required. Women in the nitrous oxide group, inhaled the gas with a mask throughout each contraction and breathed room air between the contractions. Two women were excluded because of "giddiness" due to the nitrous oxide.
Epidural analgesia compared with continuous care (one trial involving 992 women)
One trial (Dickinson 2002), compared combined‐spinal‐epidural with fentanyl and bupivacaine in nulliparous women. A fluid preload was given to the women in the epidural group. Following onset of analgesia, the women controlled the epidural until the birth with bupivacaine and pethidine. The comparison group received one‐to‐one continuous midwifery support along with usual analgesia choices such as IM pethidine, nitrous oxide inhalation, TENS, and/or non‐pharmacological forms of pain relief as requested.
Outcomes
The following primary outcomes were reported in the included trials: pain intensity (12 trials); maternal satisfaction with pain relief (17 trials); sense of control in labour (two trials); satisfaction with the childbirth experience (one trial); need for additional means of pain relief (19 trials); breastfeeding (one trial); assisted vaginal birth (34 trials); caesarean section (38 trials);
Side effects for mother: long‐term backache (three trials); maternal hypotension (10 trials); postnatal depression (one trial); motor blockade (three trials); respiratory depression requiring oxygen (five trials); headache (five trials); perineal trauma requiring suturing (two trials); nausea and vomiting (17 trials); itching (eight trials); fever (10 trials); shivering (two trials); drowsiness (seven trials); urinary retention (five trials); catheterisation (two trials); malposition (four trials); surgical amniotomy (two trials);
Side effects for baby: acidosis arterial pH less than 7.2 (eight trials); acidosis arterial pH less than 7.15 (three trials); naloxone administration (10 studies); meconium staining (five trials); admission to special care baby unit (eight trials); Apgar score of less than seven at five minutes (23 trials).
No trial reported on the following primary outcomes: uterine rupture, headache requiring blood patch, venous thromboembolic events,other maternal morbidity (e.g. impaired consciousness, meningitis, intensive care unit admission, paralysis; effect (negative) on mother/baby interaction; neonatal hypoglycaemia, birth trauma, long‐term neonatal complication, and cost.
The following secondary outcomes were reported in the meta‐analysis: length of first stage of labour (10 studies); length of second stage of labour (18 studies); oxytocin augmentation (22 trials); caesarean section for fetal distress (13 trials); and caesarean section for dystocia (14 trials).
SeeCharacteristics of included studies for details of the individual trials.
Excluded studies
We excluded 38 studies (52 publications) for the following reasons.
-
Not RCT or inadequate randomisation (Anwar 2015; Buchan 1973; Chen 2000; Cutura 2011; Jouppila 1976; Jouppila 1980; Leong 2000; Moreno 1997; Noble 1971; Ryhanen 1984; Solek‐Pastuszka 2009; Stourac 2014; Tugrul 2006; Wassen 2015)
-
All women received epidural and interventions did not satisfy review's inclusion criteria (Abboud 1982; Ginosar 2002; Ginosar 2003; Gupta 2013; Hood 1993; John 2013; Justins 1983; Kujansuu 1987; Lassner 1981; MacKenzie 1996; Martin 2003; McGrath 1992; Polley 2000; Wong 2005; Wong 2009)
-
Interventions did not satisfy review's inclusion criteria (Manninen 2000)
-
Quasi‐randomised trials (Kurjak 1974; Nafisi 2006; Neri 1986; Swanström 1981)
-
Intervention was post‐caesarean not in labour (Zakowski 1994)
-
High exclusion rate from analysis (Revill 1979 (28%); Robinson 1980 (30%); Intention‐to‐treat analysis not used (Robinson 1997)
SeeCharacteristics of excluded studies for details of the individual studies.
Risk of bias in included studies
See Figure 2; Figure 3 for 'Risk of bias' graph and 'Risk of bias' summary figures.

Risk of bias graph: review authors' judgements about each risk of bias item presented as percentages across all included studies.

Risk of bias summary: review authors' judgements about each risk of bias item for each included study.
Allocation
Random sequence generation
All included studies stated that women were randomly allocated to epidural analgesia and control groups. Out of the 40 trials contributing data, information about generation of the randomisation sequence was clearly described in 25 studies (low risk). Of these, 20 trials used computerised randomisation (Bofill 1997; Clark 1998; De Orange 2011; Douma 2011; Evron 2008; Freeman 2014; Gambling 1998; Halpern 2004; Head 2002; Howell 2001; Ismail 2012; Logtenberg 2017; Loughnan 2000; Lucas 2001; Ramin 1995; Sharma 1997; Sharma 2002; Thorp 1993; Tveit 2012; Volmanen 2008). Randomisation was achieved with random number tables in two studies (Jain 2003; Liu 2015); using a blocked group in one study (Dickinson 2002); using random numbers generated by a calculator in one study (Khadem 2013); and shuffling cards in groups of eight in another study (Stocki 2011). We assessed the randomisation sequence as being at high risk of bias in one study; Jaitley 2011 reported using randomisation but also stated that the intervention group was subdivided with no reference to randomisation method. Sequence generation was not described clearly in the remaining 14 studies which we assessed to be at unclear risk of bias (El‐Kerdawy 2010; Genc 2015; Grandjean 1979; Hogg 2000; Jalil 2009; Long 2003; Morgan‐Ortiz 1999; Muir 1996; Muir 2000; Nikkola 1997; Philipsen 1989; Sabry 2011; Thalme 1974; Xing 2015).
Allocation concealment
We assessed allocation concealment as being at low risk of bias in 19 of the 40 trials and described as using "sequentially numbered sealed opaque envelopes" or "sealed opaque envelopes" (Clark 1998; De Orange 2011; Dickinson 2002; Douma 2011; Evron 2008; Halpern 2004; Head 2002, Howell 2001; Ismail 2012; Jain 2003; Logtenberg 2017; Loughnan 2000; Lucas 2001; Muir 2000; Ramin 1995; Sharma 1997; Stocki 2011; Tveit 2012; Volmanen 2008). In the remaining 21 trials the methods used to conceal allocation were not described or the methods were not clear (Bofill 1997; El‐Kerdawy 2010; Freeman 2014; Gambling 1998; Genc 2015; Grandjean 1979; Hogg 2000; Jaitley 2011; Jalil 2009; Khadem 2013; Liu 2015; Long 2003; Morgan‐Ortiz 1999; Muir 1996; Nikkola 1997; Philipsen 1989; Sabry 2011; Sharma 2002; Thalme 1974; Thorp 1993; Xing 2015).
Blinding
Participants and personnel
We rated two studies at low risk of performance bias: Evron 2008 used a PCIA syringe filled with a saline infusion; and Volmanen 2008 reported that both women and staff were blinded as to which medication was administered. We have noted where there had been any attempt to blind study participants, caregivers or outcome assessors to group allocation. With a complex intervention such as an epidural analgesia, it is often not feasible to blind women or staff to group assignment; 18 trials did not blind women or staff (Bofill 1997; Clark 1998; De Orange 2011; Dickinson 2002; Douma 2011; El‐Kerdawy 2010; Freeman 2014; Genc 2015; Ismail 2012; Jaitley 2011; Jalil 2009; Khadem 2013; Liu 2015; Logtenberg 2017; Sabry 2011; Stocki 2011; Tveit 2012; Xing 2015), and blinding was not clear in the remaining 20 trials.
Outcome assessment
Outcome assessors were not blinded in 13 trials (De Orange 2011; Douma 2011; Freeman 2014; Genc 2015; Ismail 2012; Jaitley 2011; Jalil 2009; Khadem 2013; Liu 2015; Logtenberg 2017; Sabry 2011; Stocki 2011; Xing 2015), and it was unclear whether the remaining 27 trials attempted to blind outcome assessors.
Incomplete outcome data
Intention‐to‐treat analysis was used in all included trials for outcome data extracted. Nineteen trials had low or no loss to follow‐up and we assessed them as being at low risk of attrition bias (Bofill 1997; De Orange 2011; El‐Kerdawy 2010; Evron 2008; Gambling 1998; Halpern 2004; Howell 2001; Ismail 2012; Jain 2003; Jalil 2009; Loughnan 2000; Lucas 2001; Philipsen 1989; Sabry 2011; Sharma 2002; Stocki 2011; Thalme 1974; Thorp 1993; Volmanen 2008). Loss to follow‐up was present in 12 high‐risk studies due to high numbers of women not receiving the allocated intervention (Clark 1998; Dickinson 2002; Head 2002; Hogg 2000; Nikkola 1997; Ramin 1995; Sharma 1997), or for reasons which are not adequately explained (Douma 2011; Freeman 2014; Khadem 2013; Logtenberg 2017; Tveit 2012). Small numbers of exclusions and inadequate reporting of loss to follow‐up was observed in the remaining trials (Genc 2015; Grandjean 1979; Jaitley 2011; Liu 2015; Long 2003; Morgan‐Ortiz 1999; Muir 1996; Muir 2000; Xing 2015).
Selective reporting
For 17 of the trials, all prespecified outcomes from the methods section were reported within the results (low risk) (Bofill 1997; De Orange 2011; Douma 2011; El‐Kerdawy 2010; Freeman 2014; Halpern 2004; Head 2002; Ismail 2012; Jalil 2009; Long 2003; Loughnan 2000; Morgan‐Ortiz 1999; Nikkola 1997; Stocki 2011; Thorp 1993; Tveit 2012; Volmanen 2008). Fourteen of the studies either failed to report on outcomes which were prespecified within the Methods section or the reported outcomes were incomplete such that data could not be analysed (high risk) (Clark 1998; Evron 2008; Gambling 1998; Howell 2001; Jain 2003; Lucas 2001; Muir 1996; Muir 2000; Philipsen 1989; Ramin 1995; Sharma 1997; Sharma 2002; Thalme 1974; Xing 2015). The remaining nine studies provided insufficient information to make a judgement on selective reporting bias and we judged them to be at unclear risk of bias (Dickinson 2002; Genc 2015; Grandjean 1979; Hogg 2000; Jaitley 2011; Khadem 2013; Liu 2015; Logtenberg 2017; Sabry 2011).
Other potential sources of bias
Other potential sources of bias included imbalanced groups (Bofill 1997; Lucas 2001), trials stopping early before required sample size were recruited (Halpern 2004; Thorp 1993), high cross‐over rates (Dickinson 2002; Philipsen 1989), failure to report on assisted vaginal births for longer second stage of labour (Thalme 1974), and general poor reporting (Xing 2015). No other potential sources of bias were evident in 17 of the trials (Clark 1998; De Orange 2011; El‐Kerdawy 2010; Evron 2008; Gambling 1998; Head 2002; Howell 2001; Ismail 2012; Jain 2003; Loughnan 2000; Nikkola 1997; Ramin 1995; Sabry 2011; Sharma 1997; Sharma 2002; Stocki 2011; Volmanen 2008), and there was insufficient information in the remaining 15 trials (Douma 2011; Freeman 2014; Genc 2015; Grandjean 1979; Hogg 2000; Jaitley 2011; Jalil 2009; Khadem 2013; Liu 2015; Logtenberg 2017; Long 2003; Morgan‐Ortiz 1999; Muir 1996; Muir 2000; Tveit 2012).
Effects of interventions
1. Epidural versus opioids (34 trials involving 10,440 women)
Primary outcomes
Effects of interventions
Pain intensity (as defined by trialists)
Different tools including visual analogue scores (VAS) were used to measure pain intensity, ranging from 0 to 10 and 0 to 100. For all the comparisons in general a lower pain score represented less pain intensity.
Lower pain scores were reported in the epidural group than in the opioids group (standardised mean difference (SMD) ‐2.64, 95% confidence interval (CI) ‐4.56 to ‐0.73; random‐effects; 1133 women; studies = 5; I2 = 98%; Analysis 1.1; low‐quality evidence) but heterogeneity was very high for this outcome and different VAS used may have contributed to heterogeneity.
Satisfaction with pain relief (as defined by trialists)
There was high heterogeneity in all outcomes relating to maternal satisfaction which included more than one study in the meta‐analysis, so we used random‐effects analysis throughout, and the results should be interpreted with caution. Women's satisfaction with pain relief in labour favoured epidural (lower score = more satisfied) (mean difference (MD) ‐3.36 VAS score, 95% CI ‐5.41 to ‐1.31; random‐effects; 1166 women; studies = 3; I2 = 98%; Tau2 = 3.14; Chi2 = 117.61; P < 0.00001; Analysis 1.3). Epidural was favoured in perception of pain relief in both first (MD ‐12.05 VAS score, 95% CI ‐19.35 to ‐4.75; random‐effects; 194 women; studies = 3; I2 = 68%; Tau2 = 27.96; Chi2 = 6.23; P = 0.04; Analysis 1.4), and second stages of labour (MD ‐20.75 VAS score, 95% CI ‐22.50 to ‐19.01; 164 women; studies = 2; I2 = 26%; Analysis 1.5) (lower VAS score = lower perception of pain). More women (707/931 compared to 490/980) in the epidural group rated their pain relief as excellent or very good (average risk ratio (RR) 1.47, 95% CI 1.03 to 2.08; 1911 women; studies = 7; I2 = 97%; Tau2 = 0.19; Chi2 = 201.68; P < 0.00001; Analysis 1.6; low‐quality evidence), and reported higher satisfaction scores with pain relief than those receiving opioids (SMD 0.51, 95% CI 0.10 to 0.91; random‐effects; 3171 women; studies = 7; I2 = 95%; Tau2 = 0.26; Chi2 = 132.17; P < 0.00001; Analysis 1.7). Heterogeneity was high for this outcome, with large differences between size and direction of effect. One study measured the time (minutes) from administration to when the women reported satisfaction with the pain relief, which was less in the epidural group (MD ‐6.70 minutes, 95% CI ‐8.02 to ‐5.38; 82 women; Analysis 1.8).
Sense of control in labour (as defined by trialists)
There was no clear difference between the groups for women reporting poor control in labour (RR 1.17, 95% CI 0.62 to 2.21; 344 women; studies = 1; Analysis 1.9).
Satisfaction with childbirth experience (as defined by trialists)
There was no clear difference between the groups for women reporting satisfaction with the childbirth experience (proportions rating satisfied or very satisfied) (RR 0.95, 95% CI 0.87 to 1.03; 332 women; studies = 1; Analysis 1.10).
Need for other means of pain relief
Fewer women in the epidural group required additional analgesia (average RR 0.10, 95% CI 0.04 to 0.25; 5099 women; studies = 16; I2 = 73%; Tau2 = 1.89; Chi2 = 52.07; P < 0.00001; Analysis 1.11). Heterogeneity was high in this outcome; no trial favoured opioids but six reported no clear difference between groups. The funnel plot for this outcome was asymmetrical, suggesting that the effect size was more pronounced in small studies. The three trials that carried slightly more weight in the analysis showed a smaller effect (funnel plot not shown).
Safety of interventions
Assisted vaginal birth
The assisted vaginal birth rate was higher in the epidural group (RR 1.44, 95% CI 1.29 to 1.60; 9948 women; studies = 30; Analysis 1.12; low‐quality evidence). The funnel plot for this outcome (Figure 4) suggests some publication bias.

Funnel plot of comparison: 1 Epidural versus opioids, outcome: 1.12 Assisted vaginal birth.
Post hoc subgroup analysis of trials conducted after 2005 showed no effect on assisted vaginal birth between epidural and non‐epidural groups
Caesarean section
The caesarean section rate was no different between the groups (RR 1.07, 95% CI 0.96 to 1.18; 10,350 women; studies = 33; Analysis 1.13; moderate‐quality evidence). The funnel plot for this outcome (Figure 5) appears to be symmetrical.

Funnel plot of comparison: 1 Epidural versus opioids, outcome: 1.13 Caesarean section.
Effect (negative) on mother/baby interaction and Breastfeeding (at specified time points) were not reported by any study under this comparison.
Side effects (for mother)
Long‐term backache (as defined by trial authors)
There was no clear difference between the groups for women reporting long‐term backache (RR 1.00, 95% CI 0.89 to 1.12; 814 women; studies = 2; Analysis 1.14; moderate‐quality evidence).
Maternal hypotension (as defined by authors)
More women experienced hypotension in the epidural group than in the opioid group (average RR 11.34, 95% CI 1.89 to 67.95; 4212 women; studies = 10; I2 = 87%; Tau2 = 6.64; Chi² = 66.89; P < 0.00001; Analysis 1.15), but heterogeneity was high for this outcome. The funnel plot was difficult to interpret because there were only 10 trials contributing data, but there does appear to be some asymmetry suggesting possible publication bias (funnel plot not shown).
Postnatal depression (authors' definition, treatment for depression or self‐reported)
There was no clear difference between the groups for women who developed postnatal depression (RR 0.63, 95% CI 0.38 to 1.05; 313 women; studies = 1; Analysis 1.16).
Motor blockade
Twenty‐three out of 125 women in the epidural group experienced a motor blockade (RR 31.71, 95% CI 4.16 to 241.99; 322 women; studies = 3; Analysis 1.17).
Respiratory depression requiring oxygen administration
Fewer women in the epidural group experienced respiratory depression requiring oxygen administration (average RR 0.23, 95% CI 0.05 to 0.97; 2031 women; studies = 5; I2 = 42%; Tau2 = 0.81; Chi2 = 3.48; P = 0.18; Analysis 1.18). Statistical heterogeneity was present for this outcome.
Headache
There was no clear difference between the groups on incidence of headaches (RR 1.06, 95% CI 0.74 to 1.54; 1938 women; studies = 4; Analysis 1.19).
Perineal trauma requiring suturing
There was no clear difference between the groups for women who had perineal tears that required suturing (RR 1.05, 95% CI 0.93 to 1.18; 369 women; studies = 1; Analysis 1.20).
Nausea or vomiting or both
Fewer women in the epidural group experienced nausea and vomiting (average RR 0.62, 95% CI 0.45 to 0.87; 4440 women; studies = 15; I2 = 70%; Tau2 = 0.24; Chi2 = 46.51, df = 14; P < 0.0001; Analysis 1.21), although heterogeneity was high for this outcome and the results should be interpreted with caution. The funnel plot does not appear to be symmetrical, which suggests that publication bias could be present (funnel plot not shown).
Itching
There was no clear difference between the groups for women who reported itching (average RR 1.19, 95% CI 0.81 to 1.77; 2900 women; studies = 8; Analysis 1.22).
Fever
More women experienced fever above 38 ºC in the epidural group (average RR 2.51, 95% CI 1.67 to 3.77; 4276 women; studies = 9; I2 = 66%; Tau2 = 0.21; Chi2 = 23.24; P = 0.003; Analysis 1.23), although heterogeneity was high for this outcome and the results should be interpreted with caution. The funnel plot was difficult to interpret because only 10 trials contributed data, but there does appear to be some asymmetry, suggesting possible publication bias (funnel plot not shown).
Shivers
One small trial found no clear difference between groups for women shivering (RR 5.00, 95% CI 0.27 to 92.62; 20 women; studies = 1; Analysis 1.24).
Drowsiness
There was no clear difference between groups for drowsiness (average RR 0.48, 95% CI 0.17 to 1.33; 740 women; studies = 6; I2 = 92%; Tau2 = 1.07; Chi2 = 59.48; P < 0.00001; Analysis 1.25), although heterogeneity was high for this outcome and results should be interpreted with caution.
Urinary retention and catheterisation during labour
More women in the epidural group had urinary retention compared with the opioid group (RR 14.18, 95% CI 4.52 to 44.45; 343 women; studies = 4; Analysis 1.26). One trial reported catheterisation in labour but detected no clear difference between groups (RR 5.68, 95% CI 0.71 to 45.68; 111 women; studies = 1; Analysis 1.27).
Malposition (as defined by trial authors)
Malposition appears to be more common in the epidural group, but the lower limit of the CI just crosses the line of no effect, so this result is unclear (RR 1.40, 95% CI 0.98 to 1.99; 673 women; studies = 4; Analysis 1.28).
Surgical amniotomy
Two studies reported this outcome and found no clear difference between the groups (average RR 1.03, 95% CI 0.74 to 1.43; 211 women; studies = 2; I2 = 81%; Tau2 = 0.05; Chi2 = 5.18; P = 0.02; Analysis 1.29). There was substantial heterogeneity in this analysis.
Uterine rupture, Headache requiring blood patch, Venous thromboembolic events and Other morbidity were not reported in these trials.
Side effects (for baby)
Acidosis as defined by cord blood arterial pH less than 7.2
Fewer babies born to the women with epidural analgesia had low arterial cord pH of below 7.2 compared with those who received opioids (RR 0.81, 95% CI 0.69 to 0.94; 4783 babies; studies = 8; Analysis 1.30).
Acidosis as defined by cord blood arterial pH less than 7.15
There was no clear difference between groups in babies who were born with very low arterial blood pH of below 7.15 (RR 1.17, 95% CI 0.64 to 2.14; 480 babies; studies = 3; Analysis 1.31).
Naloxone administration
Fewer babies of women in the epidural group required naloxone administration (RR 0.15, 95% CI 0.10 to 0.23; 2645 babies; studies = 10; Analysis 1.32). The funnel plot was difficult to interpret because only 10 trials contributed data, but there does appear to be some asymmetry, suggesting publication bias (funnel plot not shown).
Meconium staining of liquor
Meconium staining of liquor was observed in similar numbers across the two groups (RR 1.01, 95% CI 0.84 to 1.21; 2295 women; studies = 5; Analysis 1.33).
Side effects of Neonatal hypoglycaemia (less than or equal to 1.67 mmol/l), Birth trauma, and Long‐term neonatal complication were not reported in these trials.
Admission to special care baby unit/neonatal intensive care unit (as defined by trialists)
There was no clear difference between groups in babies who were admitted to special care baby unit (RR 1.03, 95% CI 0.95 to 1.12; 4488 babies; studies = 8; Analysis 1.34; moderate‐quality evidence).
Apgar score less than seven at five minutes
There was no clear difference between groups in babies who had low Apgar scores at five minutes (RR 0.73, 95% CI 0.52 to 1.02; 8752 babies; studies = 22; Analysis 1.35; low‐quality evidence). The funnel plot does not show signs of publication bias (Figure 6).

Funnel plot of comparison: 1 Epidural versus opioids, outcome: 1.35 Apgar score less than 7 at 5 minutes.
Poor infant outcomes at long‐term follow‐up (as defined by trialists, e.g. seizures, disability in childhood) were not reported in these trials.
Other outcomes
Cost (as defined by trialists) was not reported in these trials.
Secondary outcomes
Length of first and second stages of labour
Both first and second stages of labour were shorter for the women who received opioids (MD 32.28 minutes, 95% CI 18.34 to 46.22; 2259 women; studies = 9; Analysis 1.36; and MD 15.38 minutes, 95% CI 8.97 to 21.79; random‐effects; 4979 women; studies = 16; I2 = 88%; Tau2 = 112.92; Chi2 = 130.33; P < 0.00001; Analysis 1.37, respectively). Heterogeneity was particularly high for second stage where three trials appeared to favour epidural. Both funnel plots appear to show asymmetry and publication bias is possible (funnel plots not shown).
Oxytocin augmentation
Oxytocin augmentation occurred more in the epidural group, but the lower limit of the confidence interval touches the line of no effect (average RR 1.12, 95% CI 1.00 to 1.26; 8351 women; studies = 19; I2 = 80%; Tau2 = 0.04; Chi2 = 89.51; P < 0.00001; Analysis 1.38), although again, heterogeneity was high and results should be interpreted with caution. The funnel plot showed some asymmetry, which suggests possible publication bias (funnel plot not shown).
Caesarean section for fetal distress and caesarean section for dystocia
There was no clear difference between the groups for caesarean section for fetal distress (RR 1.32, 95% CI 0.97 to 1.79; 5753 women; studies = 12; Analysis 1.39) or for dystocia (RR 0.93, 95% CI 0.79 to 1.11; 5938 women; studies = 13; Analysis 1.40). Funnel plots for these outcomes did not appear to show signs of asymmetry (funnel plots not shown).
2. Epidural versus placebo/no‐treatment (seven trials involving 897 women)
Primary outcomes
Pain intensity (as defined by trialists)
Women in the epidural group experienced reduced pain compared to those in the placebo or no‐treatment group (SMD ‐9.55, 95% CI ‐12.91 to ‐6.19; 120 women; studies = 2; I2 = 84%; Tau2 = 4.97; Chi2 = 6.40; P = 0.01; Analysis 2.1). There was, however, substantial heterogeneity between the studies. Another single study suggests that the perception of pain intensity was low among women who received epidural both during the first stage of labour (lower VAS score = less pain) (MD ‐55.90 VAS score, 95% CI ‐61.09 to ‐50.71; 60 women; Analysis 2.2) as well as during the second stage of labour (MD ‐55.70 VAS score, 95% CI ‐63.54 to ‐47.86; 60 women; Analysis 2.3). Nonetheless, there was no clear difference in pain intensity between groups in one study (RR 0.03, 95% CI 0.00 to 0.41; 60 women; Analysis 2.4).
Satisfaction with pain relief (as defined by trialists)
A higher proportion of women in the epidural group rated their satisfaction with pain relief as excellent or very good (RR 1.32, 95% CI 1.05 to 1.65; 70 women; studies = 1; Analysis 2.5).
Sense of control in labour (as defined by trialists)
There was no clear difference in this outcome between the groups (RR 0.89, 95% CI 0.52 to 1.50; 130 women; studies = 2; Analysis 2.6).
Need for other means of pain relief
There was no clear difference in this outcome between the groups (RR 0.14, 95% CI 0.02 to 1.14; 355 women; studies = 2; Analysis 2.7).
Satisfaction with childbirth experience (as defined by trialists) was not reported in any trial.
Safety of interventions
Assisted vaginal birth
There was no clear difference in this outcome between the groups (average RR 3.41, 95% CI 0.62 to 18.80; 515 women; studies = 4; I2 = 30%; Tau2 = 0.69; Chi2 = 2.84; P = 0.24; Analysis 2.8).
Caesarean section
Fewer women in the epidural group underwent caesarean section compared to women in the placebo or no‐treatment group (average RR 0.46, 95% CI 0.23 to 0.90; 578 women; studies = 5; Analysis 2.9).
Effect (negative) on mother/baby interaction, Breastfeeding (at specified time points) were not reported in any trial.
Side effects (for mother)
Motor blockade, Headache
The included study did not report any events for the above outcomes in either group (Analysis 2.10; Analysis 2.11).
Perineal trauma requiring suturing
There was no clear difference in this outcome between the groups (RR 0.86, 95% CI 0.50 to 1.50; 285 women; studies = 1; Analysis 2.12).
Nausea and/or vomiting
There was no clear difference in this outcome between the groups (average RR 11.00, 95% CI 0.62 to 193.80; 160 women; studies = 2; Analysis 2.13).
Itching
There was no clear difference in this outcome between the groups (RR 3.00, 95% CI 0.13 to 70.83; 60 women; studies = 1; Analysis 2.14).
Fever
There was no clear difference in this outcome between the groups (RR 11.00, 95% CI 0.63 to 191.69; 70 women; studies = 1; Analysis 2.15).
Shivers
Women in the epidural group experienced higher incidence of shivering compared to women in the placebo or no‐treatment group (RR 8.00, 95% CI 1.04 to 61.62; 100 women; studies = 1; Analysis 2.16).
Drowsiness
There was no clear difference in this outcome between the groups (RR 7.00, 95% CI 0.37 to 132.10; 100 women; studies = 1; Analysis 2.17).
Urinary retention
There was no clear difference in this outcome between the groups (RR 3.00, 95% CI 0.32 to 28.21; 160 women; studies = 2; Analysis 2.18).
Maternal hypotension (as defined by authors), Postnatal depression (authors' definition, treatment for depression or self‐reported), Long‐term backache (as defined by trial authors), Respiratory depression requiring oxygen administration, Uterine rupture, Headache requiring blood patch, Venous thromboembolic events were not reported in any trial. Catheterisation during labour, Other morbidity (e.g. impaired consciousness, meningitis, intensive care unit admission, paralysis), Malposition (as defined by trial authors), Surgical amniotomy were not reported in these trials.
Side effects (for baby)
Apgar score less than seven at five minutes
The included study did not report any events for the above outcome in either group (Analysis 2.19).
Acidosis as defined by cord blood arterial pH less than 7.2, Acidosis as defined by cord blood arterial pH less than 7.15, Naloxone administration, Neonatal hypoglycaemia (less than or equal to 1.67 mmol/l), Birth trauma, Long‐term neonatal complication, Meconium staining of liquor, Admission to special care baby unit/neonatal intensive care unit (as defined by trialists), Poor infant outcomes at long‐term follow‐up (as defined by trialists, e.g. seizures, disability in childhood) were not reported in any trial under this comparison.
Other outcomes
Cost (as defined by trialists) was not reported in the included studies.
Secondary outcomes
Length of first stage of labour, length of second stage of labour, oxytocin augmentation, caesarean section for fetal distress, caesarean section for dystocia
There was no clear difference between the groups for length of first stage of labour (minutes) (MD ‐55.09 minutes, 95% CI ‐186.26 to 76.09; random‐effects; 189 women; studies = 2; I2 = 92%; Tau2 = 8236.28; Chi2 = 12.10; P = 0.0005; Analysis 2.20); length of second stage of labour (MD 7.66 minutes, 95% CI ‐6.12 to 21.45; random‐effects; 344 women; studies = 4; I2 = 78%; Tau2 = 148.06; Chi2 = 13.87; P = 0.003; Analysis 2.21); oxytocin augmentation (RR 0.89, 95% CI 0.63 to 1.24; 415 women; studies = 3; Analysis 2.22); caesarean section for fetal distress (RR 1.00, 95% CI 0.06 to 15.55; 100 women; studies = 1; Analysis 2.23); caesarean section for dystocia (RR 2.00, 95% CI 0.19 to 21.36; 100 women; studies = 1; Analysis 2.24). There was substantial heterogeneity present for the length of first and second stages of labour.
3. Epidural versus Acu‐stimulation (one trial involving 60 women)
Primary outcomes
Effects of interventions
Pain intensity (as defined by trialists)
Women in the epidural group reported lower pain scores in labour than those in the acu‐stimulation group (SMD ‐53.00, 95% CI ‐57.98 to ‐48.02; Analysis 3.1).
This trial did not report Satisfaction with pain relief (as defined by trialists), Sense of control in labour (as defined by trialists), Satisfaction with childbirth experience (as defined by trialists), or Need for other means of pain relief.
Safety of interventions
Assisted vaginal birth and caesarean section
There was no clear difference between groups for assisted vaginal birth (RR 1.00, 95% CI 0.15 to 6.64; Analysis 3.2) or caesarean section (RR 2.00, 95% CI 0.19 to 20.90; Analysis 3.3).
Effect (negative) on mother/baby interaction and Breastfeeding (at specified time points) were not reported in this trial.
Side effects (for mother)
There was no clear difference between group for maternal hypotension (RR 3.00, 95% CI 0.13 to 70.83; Analysis 3.4) or urinary retention (RR 3.00, 95% CI 0.13 to 70.83; Analysis 3.5). There were no reports of nausea or vomiting in either group (Analysis 3.6). These were the only side effects reported in this trial.
No Side effects (for baby), Neonatal outcomes or Other outcomes were reported.
Secondary outcomes
Length of second stage of labour
Shorter second stages were reported for women in the acu‐stimulation group (minutes) (MD 17.90 minutes, 95% CI 5.66 to 30.14; Analysis 3.7).
Oxytocin augmentation
There was no clear difference between groups in the proportion of women receiving oxytocin augmentation (RR 1.08, 95% CI 0.59 to 1.97; Analysis 3.8).
Length of first stage of labour, Caesarean section for fetal distress, and Caesarean section for dystocia were not reported in this trial.
4. Epidural versus inhaled analgesia (one trial involving 86 women)
Only one trial contributed to this comparison and reported only two outcomes relevant to this review.
Satisfaction with pain relief
More women rated epidural very good or excellent compared with inhaled analgesia (RR 2.18, 95% CI 1.31 to 3.62; Analysis 4.1).
Caesarean section
There was no clear difference between the groups in caesarean section rate (RR 0.63, 95% CI 0.16 to 2.47; Analysis 4.2).
5. Epidural versus continuous support (one trial involving 992 women)
The comparison group in this study (Dickinson 2002) received one‐to‐one continuous midwifery support along with usual analgesia choices such as IM pethidine, nitrous oxide inhalation, TENS, and/or non‐pharmacological forms of pain relief.
Primary outcomes
Effects of interventions
Satisfaction with pain relief
All women in the epidural group and 494 out of 499 women in the non‐epidural group rated their pain relief as 'excellent or very good' (RR 1.01, 95% CI 1.00 to 1.02; Analysis 5.1). No women in the epidural group requested other means of pain relief compared to 262 out of 499 in the non‐epidural group (RR 0.00, 95% CI 0.00 to 0.03; Analysis 5.2).
Pain intensity (as defined by trialists), Sense of control in labour (as defined by trialists), and Satisfaction with childbirth experience (as defined by trialists) were not reported in this trial.
Safety of interventions
Assisted vaginal birth and caesarean section
There was no clear difference between groups for assisted vaginal birth (RR 1.16, 95% CI 0.96 to 1.39; Analysis 5.3) and caesarean section (RR 1.21, 95% CI 0.91 to 1.62; Analysis 5.4).
Effect (negative) on mother/baby interaction and Breastfeeding (at specified time points) were not reported in this trial.
Side effects (for mother)
There was no clear difference between groups for women with long‐term backache (RR 0.88, 95% CI 0.69 to 1.11; Analysis 5.5), headaches (RR 0.96, 95% CI 0.79 to 1.17; Analysis 5.6), and nausea and vomiting (RR 1.12, 95% CI 0.80 to 1.57; Analysis 5.7). More women in the epidural group were catheterised during labour (RR 1.16, 95% CI 1.04 to 1.29; Analysis 5.8). No other maternal side effects were reported in the trial.
Side effects (for baby)
Side effects, Admission to special care baby unit/neonatal intensive care unit, and Poor infant outcomes at long‐term follow‐up were not reported in this trial.
There was no clear difference between groups in Apgar scores of less than seven at five minutes (RR 2.02, 95% CI 0.61 to 6.68; Analysis 5.9).
Other outcomes
Cost was not reported in this trial.
Secondary outcomes
No secondary outcomes were reported in this trial.
Subgroup analysis
We did not carry out planned subgroup analyses because a complete breakdown of the separate subgroup categories was not provided.
We conducted one post hoc subgroup analysis of trials conducted after 2005, to assess whether more recent modern epidural techniques still showed an increased incidence of assisted vaginal birth
Sensitivity analysis
We conducted sensitivity analyses for two primary outcomes: Satisfaction with pain relief; and Need for other means of pain relief. We excluded from the analysis studies with a high or unclear risk of bias for allocation concealment or incomplete outcome data for these two outcomes. There were sufficient studies in comparisons 1, 2, and 5 to conduct this sensitivity analysis.
Comparison 1. Epidural versus opioids
Removing studies with unsatisfactory allocation concealment in Satisfaction with pain relief had an impact on the pooled effect size, resulting in no clear difference between the groups (average RR 1.42, 95% CI 0.70 to 2.92; 1372 women; studies = 4; I2 = 99%; Analysis 1.41), albeit with substantial heterogeneity. We noted a similar finding when studies with incomplete outcome data were removed (average RR 1.23, 95% CI 0.97 to 1.55; 923 women; studies = 3; I2 = 94%; Analysis 1.42).
Removing the studies with unsatisfactory allocation concealment (average RR 0.12, 95% CI 0.03 to 0.53; 3043 women; studies = 9; I2 = 75%; Analysis 1.43) and incomplete outcome data (average RR 0.15, 95% CI 0.05 to 0.45; 3740 women; studies = 9; I2 = 78%; Analysis 1.44) for the outcome Need for other pain relief made little difference to the meta‐analyses.
Comparison 2. Epidural versus placebo/no treatment
The sensitivity analysis for Need for additional pain relief widened CIs and the effect of epidural remained unclear, when studies with unsatisfactory allocation concealment (RR 0.33, 95% CI 0.01 to 7.91; 70 women; studies = 1; Analysis 2.25), and incomplete outcome data (RR 0.33, 95% CI 0.01 to 7.91; 70 women; studies = 1; Analysis 2.26) were removed. Only one study contributed to the analysis for Satisfaction with pain relief, so a sensitivity analysis was not appropriate.
Discussion
Summary of main results
We include data from 40 trials, involving over 11,000 women. Thirty‐four trials compared epidural with opioids, seven trials compared epidural with no analgesia, one trial compared epidural with acu‐stimulation, one trial compared epidural with inhaled analgesia, and one trial compared epidural with continuous midwifery support and other analgesia.
Comparing epidural with opioids, women with epidural analgesia reported lower pain intensity as expressed by lower pain scores and a higher proportion were satisfied with their pain relief, reporting it to be "excellent or very good". There was a substantial amount of statistical heterogeneity in both these outcomes. More women in the epidural group experienced assisted vaginal birth, although there appears to be a larger effect reported in the small studies contributing data to this outcome, so the results should be interpreted with caution. In addition, post hoc subgroup analysis showed that this effect was no longer present in studies after 2005, suggesting that more modern techniques of epidural analgesia such as using lower doses of local anaesthetic and avoiding epidural infusions may not affect this outcome. There were no clear differences between caesarean section rates, and maternal long‐term backache. There were also no clear differences between groups for the neonatal outcomes, admission to neonatal intensive care unit and Apgar score less than seven at five minutes. We downgraded evidence for study design, inconsistency, imprecision in effect estimates, and possible publication bias.
Side effects were reported in both epidural and opioid groups. Women with epidural experienced more hypotension, motor blockade, fever, and urinary retention. They also had longer first and second stages of labour, and were more likely to have oxytocin augmentation than the women in the opioid group. The women in the opioid group had more respiratory depression requiring oxygen, and nausea and vomiting. Babies born to women in the opioid group were more likely to have had naloxone administration. There was no clear difference between groups for postnatal depression, headache, itching, shivering, or drowsiness. Maternal morbidity and long‐term neonatal outcomes were not reported.
We detected substantial heterogeneity for many outcomes in the epidural versus opioid comparison. Exploration of heterogeneity was not possible using subgroup analysis, but we investigated the effect of trial quality using prespecified sensitivity analysis. Heterogeneity could not be explained by sensitivity analyses. Varying epidural protocols and different types of opioids used may have contributed to heterogeneity. There was considerable variation in outcome measures in trials reporting women's satisfaction with pain relief, as previously discussed. None of the trials reporting maternal hypotension gave their definitions for this outcome, so there may be substantial differences here. Heterogeneity for the outcomes of length of labour and use of oxytocin augmentation may be explained by variations in clinical practice as to when labour begins and when oxytocin is required.
Epidural analgesia resulted in less reported pain when compared with placebo or no treatment, and acu‐stimulation. Pain intensity was not reported in the trials that compared epidural with inhaled analgesia, or continuous support. Maternal satisfaction was greater in epidural groups when compared with no treatment/placebo, inhaled analgesia or continuous support, although most of both epidural and continuous support trials reported their pain relief to be excellent. Few trials reported on serious maternal side effects.
Overall completeness and applicability of evidence
Some limitations of our analysis should be noted. Eleven studies reported women's perception of pain as an outcome but we could not extract the data from these studies for meta‐analysis, because trials measured this outcome differently and reported the data in a format not compatible with the software used. These studies used various forms of VAS scores as a way of measuring women's perception of pain, but it was not possible to extract the data presented. In three of the studies (Bofill 1997; Sharma 1997; Sharma 2002) data were in graphical representation only. For two of the studies (Dickinson 2002; Muir 1996), it was unclear as to whether the data presented were means or medians. Philipsen 1989 used medians; Gambling 1998, Nikkola 1997 and Thorp 1993 measured this outcome at different time intervals and we therefore could not combine the data. Two studies (Jain 2003; Loughnan 2000), presented their data as the number of women experiencing different levels of pain.
Trials varied in the characteristics of participants, labour management protocols and the epidural regimen and opioids used. These factors may influence the course of labour, pain relief requirements and outcomes such as duration of labour, oxytocin augmentation and instrumental delivery. Combining studies using a high concentration of a local anaesthetic agent for epidural analgesia with low‐concentration techniques, and combining studies maintaining a block in the second stage of labour to those discontinuing may influence some outcomes, in particular the duration of labour and assisted vaginal births.
We had planned subgroup analyses based on parity, spontaneous labour versus induced labour, term versus preterm, continuous support in labour versus no continuous support, in an attempt to explore whether these variations had any effect on the results. However, data on the separate subgroups were rarely provided and so it was not possible to conduct any subgroup analysis.
Epidural dose and technique impact have been shown to affect the incidence of assisted vaginal birth when more concentrated epidural solutions are used (COMET 2001; Sultan 2013).
Most women in the control group were randomised to opioids and the effect on some outcomes may therefore be applicable to the use of opioids in labour rather than to all other non‐epidural forms of analgesia or no pain relief. Some women randomised to non‐epidural analgesia received epidural as well. To a lesser extent, some women in the epidural arm did not receive the intervention, due to rapid labour. We included only data based on an intention‐to‐treat analysis. However, this approach may make the results difficult to interpret.
The evidence presented in this review needs to be interpreted taking these limitations into account.
Quality of the evidence
Risk of bias varied throughout the included trials (see Figure 2; Figure 3). Most of the trials were not well reported and were assessed to be at unclear risk of bias in many domains. Only two trials contributing data were assessed as using inadequate random sequence generation, and all trials either concealed allocation or did not report this domain clearly. No trial reported blinding outcome assessors and only two blinded participants and staff, although the nature of many of the interventions made this difficult. We rated most trials at low risk of attrition and reporting biases, although some were at high or unclear risk of both.
We assessed the quality of the evidence of seven outcomes comparing epidural and opioid analgesia using the GRADE approach (see summary of findings Table for the main comparison). We graded evidence for pain intensity, satisfaction with pain relief, assisted vaginal birth, and Apgar score less than seven at five minutes as low quality. We rated caesarean section, side effects ‐ long‐term backache, and admission to neonatal intensive care unit as moderate‐quality evidence. We downgraded evidence for study design limitations, high statistical heterogeneity, imprecision of effect estimates, and possible publication bias.
Potential biases in the review process
We took steps to minimise bias, although we are aware that bias may be present in our review. Two review authors independently assessed studies for eligibility and extracted the data as necessary. We resolved discrepancies through discussion or if required we consulted a third review author. Two review authors also performed GRADE assessments independently and resolved discrepancies though discussion.
Agreements and disagreements with other studies or reviews
An extensive body of evidence exists assessing pharmacological methods of pain relief, include inhalation of nitrous oxide (Klomp 2012), opioids (Ullman 2010), and local anaesthetic nerve block (Novikova 2011). This review is an update of the previous version of the Cochrane Review of epidural versus non‐epidural or no analgesia in labour. Thirteen new studies have provided additional data to the review. The addition of these new data has not greatly altered the conclusions of this review, other than low‐quality evidence showing that epidural analgesia is effective in increasing maternal satisfaction with pain relief. Six additional trials, awaiting clarification (Antipin 2014; Gupta 2016; Kamali 2016; Marshalov 2012; Vavrinkova 2005; Weissman 2006), may be included in future updates, and have the potential to alter the current conclusions of the review.

Study flow diagram.

Risk of bias graph: review authors' judgements about each risk of bias item presented as percentages across all included studies.

Risk of bias summary: review authors' judgements about each risk of bias item for each included study.

Funnel plot of comparison: 1 Epidural versus opioids, outcome: 1.12 Assisted vaginal birth.

Funnel plot of comparison: 1 Epidural versus opioids, outcome: 1.13 Caesarean section.

Funnel plot of comparison: 1 Epidural versus opioids, outcome: 1.35 Apgar score less than 7 at 5 minutes.

Comparison 1 Epidural versus opioids, Outcome 1 Pain score in labour.

Comparison 1 Epidural versus opioids, Outcome 2 Pain intensity severe or intolerable.

Comparison 1 Epidural versus opioids, Outcome 3 Woman's perception of pain relief in labour.

Comparison 1 Epidural versus opioids, Outcome 4 Woman's perception of pain relief during first stage of labour.

Comparison 1 Epidural versus opioids, Outcome 5 Woman's perception of pain relief during the second stage of labour.

Comparison 1 Epidural versus opioids, Outcome 6 Satisfaction with pain relief in labour ‐ proportion rating excellent or very good.

Comparison 1 Epidural versus opioids, Outcome 7 Satisfaction with pain relief in labour ‐ continuous data.

Comparison 1 Epidural versus opioids, Outcome 8 Time of administration of pain relief to time pain relief was satisfactory (minutes).
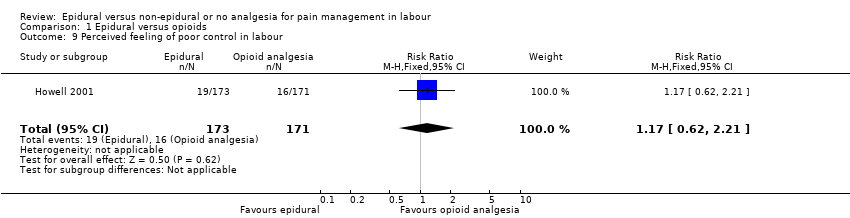
Comparison 1 Epidural versus opioids, Outcome 9 Perceived feeling of poor control in labour.

Comparison 1 Epidural versus opioids, Outcome 10 Satisfaction with childbirth experience ‐ proportion rating satisfied to very satisfied.

Comparison 1 Epidural versus opioids, Outcome 11 Need for additional means of pain relief.

Comparison 1 Epidural versus opioids, Outcome 12 Assisted vaginal birth.

Comparison 1 Epidural versus opioids, Outcome 13 Caesarean section.

Comparison 1 Epidural versus opioids, Outcome 14 Long‐term backache.

Comparison 1 Epidural versus opioids, Outcome 15 Hypotension as defined by trial authors.

Comparison 1 Epidural versus opioids, Outcome 16 Postnatal depression (authors definition, on medication, or self‐reported).

Comparison 1 Epidural versus opioids, Outcome 17 Motor blockade.

Comparison 1 Epidural versus opioids, Outcome 18 Respiratory depression requiring oxygen administration.

Comparison 1 Epidural versus opioids, Outcome 19 Headache.

Comparison 1 Epidural versus opioids, Outcome 20 Perineal trauma requiring suturing.

Comparison 1 Epidural versus opioids, Outcome 21 Nausea and vomiting.

Comparison 1 Epidural versus opioids, Outcome 22 Itch.

Comparison 1 Epidural versus opioids, Outcome 23 Fever > 38 º C.

Comparison 1 Epidural versus opioids, Outcome 24 Shivering.

Comparison 1 Epidural versus opioids, Outcome 25 Drowsiness.

Comparison 1 Epidural versus opioids, Outcome 26 Urinary retention.

Comparison 1 Epidural versus opioids, Outcome 27 Catheterisation during labour.

Comparison 1 Epidural versus opioids, Outcome 28 Malposition.

Comparison 1 Epidural versus opioids, Outcome 29 Surgical amniotomy.

Comparison 1 Epidural versus opioids, Outcome 30 Acidosis defined by cord arterial pH < 7.2 at delivery.

Comparison 1 Epidural versus opioids, Outcome 31 Acidosis defined by cord arterial pH < 7.15.

Comparison 1 Epidural versus opioids, Outcome 32 Naloxone administration.

Comparison 1 Epidural versus opioids, Outcome 33 Meconium staining of liquor.

Comparison 1 Epidural versus opioids, Outcome 34 Neonatal intensive care unit admission.

Comparison 1 Epidural versus opioids, Outcome 35 Apgar score less than 7 at 5 minutes.

Comparison 1 Epidural versus opioids, Outcome 36 Length of first stage of labour (minutes).

Comparison 1 Epidural versus opioids, Outcome 37 Length of second stage of labour (minutes).

Comparison 1 Epidural versus opioids, Outcome 38 Oxytocin augmentation.

Comparison 1 Epidural versus opioids, Outcome 39 Caesarean section for fetal distress.

Comparison 1 Epidural versus opioids, Outcome 40 Caesarean section for dystocia.

Comparison 1 Epidural versus opioids, Outcome 41 Sensitivity analysis ‐ allocation concealment: Maternal satisfaction with pain relief in labour ‐ proportion rating excellent or very good.

Comparison 1 Epidural versus opioids, Outcome 42 Sensitivity analysis ‐ incomplete outcome data: Maternal satisfaction with pain relief in labour ‐ proportion rating excellent or very good.

Comparison 1 Epidural versus opioids, Outcome 43 Sensitivity analysis ‐ allocation concealment: Need for additional means of pain relief.

Comparison 1 Epidural versus opioids, Outcome 44 Sensitivity analysis ‐ incomplete outcome data: Need for additional means of pain relief.

Comparison 2 Epidural versus placebo/no treatment, Outcome 1 Pain score in labour.

Comparison 2 Epidural versus placebo/no treatment, Outcome 2 Woman's perception of pain relief during first stage of labour.

Comparison 2 Epidural versus placebo/no treatment, Outcome 3 Woman's perception of pain relief during the second stage of labour.
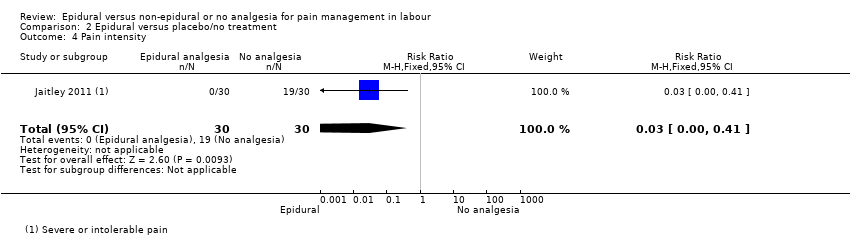
Comparison 2 Epidural versus placebo/no treatment, Outcome 4 Pain intensity.

Comparison 2 Epidural versus placebo/no treatment, Outcome 5 Satisfaction with pain relief in labour ‐ proportion rating excellent or very good.

Comparison 2 Epidural versus placebo/no treatment, Outcome 6 Perceived feeling of poor control in labour.

Comparison 2 Epidural versus placebo/no treatment, Outcome 7 Need for additional means of pain relief.

Comparison 2 Epidural versus placebo/no treatment, Outcome 8 Instrumental delivery.

Comparison 2 Epidural versus placebo/no treatment, Outcome 9 Caesarean section.

Comparison 2 Epidural versus placebo/no treatment, Outcome 10 Motor blockade.

Comparison 2 Epidural versus placebo/no treatment, Outcome 11 Headache.

Comparison 2 Epidural versus placebo/no treatment, Outcome 12 Perineal trauma requiring suturing.

Comparison 2 Epidural versus placebo/no treatment, Outcome 13 Nausea and vomiting.

Comparison 2 Epidural versus placebo/no treatment, Outcome 14 Itch.

Comparison 2 Epidural versus placebo/no treatment, Outcome 15 Fever > 38 º C.

Comparison 2 Epidural versus placebo/no treatment, Outcome 16 Shivering.

Comparison 2 Epidural versus placebo/no treatment, Outcome 17 Drowsiness.

Comparison 2 Epidural versus placebo/no treatment, Outcome 18 Urinary retention.

Comparison 2 Epidural versus placebo/no treatment, Outcome 19 Apgar score less than 7 at 5 minutes.

Comparison 2 Epidural versus placebo/no treatment, Outcome 20 Length of first stage of labour (minutes).

Comparison 2 Epidural versus placebo/no treatment, Outcome 21 Length of second stage of labour (minutes).

Comparison 2 Epidural versus placebo/no treatment, Outcome 22 Oxytocin augmentation.

Comparison 2 Epidural versus placebo/no treatment, Outcome 23 Caesarean section for fetal distress.

Comparison 2 Epidural versus placebo/no treatment, Outcome 24 Caesarean section for dystocia.

Comparison 2 Epidural versus placebo/no treatment, Outcome 25 Sensitivity analysis ‐ allocation concealment: Need for additional means of pain relief.
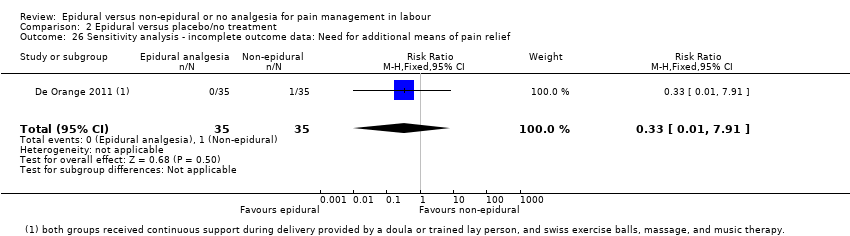
Comparison 2 Epidural versus placebo/no treatment, Outcome 26 Sensitivity analysis ‐ incomplete outcome data: Need for additional means of pain relief.

Comparison 3 Epidural versus TENS, Outcome 1 Maternal pain score in labour.

Comparison 3 Epidural versus TENS, Outcome 2 Instrumental delivery.

Comparison 3 Epidural versus TENS, Outcome 3 Caesarean section.

Comparison 3 Epidural versus TENS, Outcome 4 Hypotension as defined by trial authors.

Comparison 3 Epidural versus TENS, Outcome 5 Urinary retention.

Comparison 3 Epidural versus TENS, Outcome 6 Nausea and vomiting.

Comparison 3 Epidural versus TENS, Outcome 7 Length of second stage of labour (minutes).

Comparison 3 Epidural versus TENS, Outcome 8 Oxytocin augmentation.

Comparison 4 Epidural versus inhaled analgesia, Outcome 1 Maternal satisfaction with pain relief in labour ‐ proportion rating excellent or very good.

Comparison 4 Epidural versus inhaled analgesia, Outcome 2 Caesarean section.

Comparison 5 Epidural versus continuous support, Outcome 1 Satisfaction with pain relief in labour ‐ proportion rating excellent or very good.

Comparison 5 Epidural versus continuous support, Outcome 2 Need for additional means of pain relief.

Comparison 5 Epidural versus continuous support, Outcome 3 Instrumental delivery.

Comparison 5 Epidural versus continuous support, Outcome 4 Caesarean section.

Comparison 5 Epidural versus continuous support, Outcome 5 Long‐term backache.

Comparison 5 Epidural versus continuous support, Outcome 6 Headache.

Comparison 5 Epidural versus continuous support, Outcome 7 Nausea and vomiting.
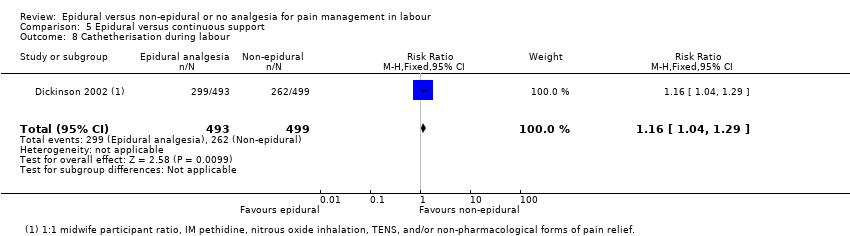
Comparison 5 Epidural versus continuous support, Outcome 8 Cathetherisation during labour.

Comparison 5 Epidural versus continuous support, Outcome 9 Apgar score less than 7 at 5 minutes.
| Epidural compared to opioids in labour (maternal outcomes) | ||||||
| Patient or population: women in labour | ||||||
| Outcomes | Anticipated absolute effects* (95% CI) | Relative effect | № of participants | Quality of the evidence | Comments | |
| Risk with opioids | Risk with epidural | |||||
| Pain intensity measured using pain score in labour (lower scores = less pain) | SMD 2.64 lower | ‐ | 1133 | ⊕⊕⊝⊝ | ‐ | |
| Satisfaction with pain relief ‐ proportion rating excellent or very good | Study population | Average RR 1.47 | 1911 | ⊕⊕⊝⊝ | ‐ | |
| 500 per 1000 | 735 per 1000 | |||||
| Assisted vaginal birth | Study population | RR 1.44 | 9948 | ⊕⊕⊝⊝ | ‐ | |
| 99 per 1000 | 142 per 1000 | |||||
| Caesarean section | Study population | RR 1.07 | 10,350 | ⊕⊕⊕⊝ | ‐ | |
| 114 per 1000 | 122 per 1000 | |||||
| Side effects (maternal) ‐ long‐term backache | Study population | RR 1.00 | 814 | ⊕⊕⊕⊝ | ‐ | |
| 585 per 1000 | 585 per 1000 | |||||
| Admission to special care baby unit/neonatal intensive care unit (as defined by trialists) | Study population | RR 1.03 | 4488 | ⊕⊕⊕⊝ | ‐ | |
| 204 per 1000 | 210 per 1000 (194 to 228) | |||||
| Apgar score less than 7 at 5 minutes | Study population | RR 0.73 | 8752 | ⊕⊕⊝⊝ | ‐ | |
| 17 per 1000 | 12 per 1000 | |||||
| *The risk in the intervention group (and its 95% confidence interval) is based on the assumed risk in the comparison group and the relative effect of the intervention (and its 95% CI). | ||||||
| GRADE Working Group grades of evidence | ||||||
| 1Downgraded due to limitation of study design (‐1). | ||||||
| Outcome or subgroup title | No. of studies | No. of participants | Statistical method | Effect size |
| 1 Pain score in labour Show forest plot | 5 | 1133 | Std. Mean Difference (IV, Random, 95% CI) | ‐2.64 [‐4.56, ‐0.73] |
| 2 Pain intensity severe or intolerable Show forest plot | 1 | 60 | Risk Ratio (M‐H, Fixed, 95% CI) | 0.0 [0.0, 0.0] |
| 3 Woman's perception of pain relief in labour Show forest plot | 3 | 1166 | Mean Difference (IV, Random, 95% CI) | ‐3.36 [‐5.41, ‐1.31] |
| 4 Woman's perception of pain relief during first stage of labour Show forest plot | 3 | 194 | Mean Difference (IV, Random, 95% CI) | ‐12.05 [‐19.35, ‐4.75] |
| 5 Woman's perception of pain relief during the second stage of labour Show forest plot | 2 | 164 | Mean Difference (IV, Fixed, 95% CI) | ‐20.75 [‐22.50, ‐19.01] |
| 6 Satisfaction with pain relief in labour ‐ proportion rating excellent or very good Show forest plot | 7 | 1911 | Risk Ratio (M‐H, Random, 95% CI) | 1.47 [1.03, 2.08] |
| 7 Satisfaction with pain relief in labour ‐ continuous data Show forest plot | 7 | 3171 | Std. Mean Difference (IV, Random, 95% CI) | 0.51 [0.10, 0.91] |
| 8 Time of administration of pain relief to time pain relief was satisfactory (minutes) Show forest plot | 1 | 82 | Mean Difference (IV, Fixed, 95% CI) | ‐6.70 [‐8.02, ‐5.38] |
| 9 Perceived feeling of poor control in labour Show forest plot | 1 | 344 | Risk Ratio (M‐H, Fixed, 95% CI) | 1.17 [0.62, 2.21] |
| 10 Satisfaction with childbirth experience ‐ proportion rating satisfied to very satisfied Show forest plot | 1 | 332 | Risk Ratio (M‐H, Fixed, 95% CI) | 0.95 [0.87, 1.03] |
| 11 Need for additional means of pain relief Show forest plot | 16 | 5099 | Risk Ratio (M‐H, Random, 95% CI) | 0.10 [0.04, 0.25] |
| 12 Assisted vaginal birth Show forest plot | 30 | 9948 | Risk Ratio (M‐H, Fixed, 95% CI) | 1.44 [1.29, 1.60] |
| 13 Caesarean section Show forest plot | 33 | 10350 | Risk Ratio (M‐H, Fixed, 95% CI) | 1.07 [0.96, 1.18] |
| 14 Long‐term backache Show forest plot | 2 | 814 | Risk Ratio (M‐H, Fixed, 95% CI) | 1.00 [0.89, 1.12] |
| 15 Hypotension as defined by trial authors Show forest plot | 10 | 4212 | Risk Ratio (M‐H, Random, 95% CI) | 11.34 [1.89, 67.95] |
| 16 Postnatal depression (authors definition, on medication, or self‐reported) Show forest plot | 1 | 313 | Risk Ratio (M‐H, Fixed, 95% CI) | 0.63 [0.38, 1.05] |
| 17 Motor blockade Show forest plot | 3 | 322 | Risk Ratio (M‐H, Fixed, 95% CI) | 31.71 [4.16, 241.99] |
| 18 Respiratory depression requiring oxygen administration Show forest plot | 5 | 2031 | Risk Ratio (M‐H, Random, 95% CI) | 0.23 [0.05, 0.97] |
| 19 Headache Show forest plot | 4 | 1938 | Risk Ratio (M‐H, Fixed, 95% CI) | 1.06 [0.74, 1.54] |
| 20 Perineal trauma requiring suturing Show forest plot | 1 | 369 | Risk Ratio (M‐H, Fixed, 95% CI) | 1.05 [0.93, 1.18] |
| 21 Nausea and vomiting Show forest plot | 15 | 4440 | Risk Ratio (M‐H, Random, 95% CI) | 0.62 [0.45, 0.87] |
| 22 Itch Show forest plot | 8 | 2900 | Risk Ratio (M‐H, Fixed, 95% CI) | 1.19 [0.81, 1.77] |
| 23 Fever > 38 º C Show forest plot | 9 | 4276 | Risk Ratio (M‐H, Random, 95% CI) | 2.51 [1.67, 3.77] |
| 24 Shivering Show forest plot | 1 | 20 | Risk Ratio (M‐H, Fixed, 95% CI) | 5.0 [0.27, 92.62] |
| 25 Drowsiness Show forest plot | 6 | 740 | Risk Ratio (M‐H, Random, 95% CI) | 0.48 [0.17, 1.33] |
| 26 Urinary retention Show forest plot | 4 | 343 | Risk Ratio (M‐H, Fixed, 95% CI) | 14.18 [4.52, 44.45] |
| 27 Catheterisation during labour Show forest plot | 1 | 111 | Risk Ratio (M‐H, Random, 95% CI) | 5.68 [0.71, 45.68] |
| 28 Malposition Show forest plot | 4 | 673 | Risk Ratio (M‐H, Fixed, 95% CI) | 1.40 [0.98, 1.99] |
| 29 Surgical amniotomy Show forest plot | 2 | 211 | Risk Ratio (M‐H, Random, 95% CI) | 1.03 [0.74, 1.43] |
| 30 Acidosis defined by cord arterial pH < 7.2 at delivery Show forest plot | 8 | 4783 | Risk Ratio (M‐H, Fixed, 95% CI) | 0.81 [0.69, 0.94] |
| 31 Acidosis defined by cord arterial pH < 7.15 Show forest plot | 3 | 480 | Risk Ratio (M‐H, Fixed, 95% CI) | 1.17 [0.64, 2.14] |
| 32 Naloxone administration Show forest plot | 10 | 2645 | Risk Ratio (M‐H, Fixed, 95% CI) | 0.15 [0.10, 0.23] |
| 33 Meconium staining of liquor Show forest plot | 5 | 2295 | Risk Ratio (M‐H, Fixed, 95% CI) | 1.01 [0.84, 1.21] |
| 34 Neonatal intensive care unit admission Show forest plot | 8 | 4488 | Risk Ratio (M‐H, Fixed, 95% CI) | 1.03 [0.95, 1.12] |
| 35 Apgar score less than 7 at 5 minutes Show forest plot | 22 | 8752 | Risk Ratio (M‐H, Fixed, 95% CI) | 0.73 [0.52, 1.02] |
| 36 Length of first stage of labour (minutes) Show forest plot | 9 | 2259 | Mean Difference (IV, Fixed, 95% CI) | 32.28 [18.34, 46.22] |
| 37 Length of second stage of labour (minutes) Show forest plot | 16 | 4979 | Mean Difference (IV, Random, 95% CI) | 15.38 [8.97, 21.79] |
| 38 Oxytocin augmentation Show forest plot | 19 | 8351 | Risk Ratio (M‐H, Random, 95% CI) | 1.12 [1.00, 1.26] |
| 39 Caesarean section for fetal distress Show forest plot | 12 | 5753 | Risk Ratio (M‐H, Fixed, 95% CI) | 1.32 [0.97, 1.79] |
| 40 Caesarean section for dystocia Show forest plot | 13 | 5938 | Risk Ratio (M‐H, Fixed, 95% CI) | 0.93 [0.79, 1.11] |
| 41 Sensitivity analysis ‐ allocation concealment: Maternal satisfaction with pain relief in labour ‐ proportion rating excellent or very good Show forest plot | 4 | 1372 | Risk Ratio (M‐H, Random, 95% CI) | 1.42 [0.70, 2.92] |
| 42 Sensitivity analysis ‐ incomplete outcome data: Maternal satisfaction with pain relief in labour ‐ proportion rating excellent or very good Show forest plot | 3 | 923 | Risk Ratio (M‐H, Random, 95% CI) | 1.23 [0.97, 1.55] |
| 43 Sensitivity analysis ‐ allocation concealment: Need for additional means of pain relief Show forest plot | 9 | 3043 | Risk Ratio (M‐H, Random, 95% CI) | 0.12 [0.03, 0.53] |
| 44 Sensitivity analysis ‐ incomplete outcome data: Need for additional means of pain relief Show forest plot | 9 | 3740 | Risk Ratio (M‐H, Random, 95% CI) | 0.15 [0.05, 0.45] |
| Outcome or subgroup title | No. of studies | No. of participants | Statistical method | Effect size |
| 1 Pain score in labour Show forest plot | 2 | 120 | Std. Mean Difference (IV, Random, 95% CI) | ‐9.55 [‐12.91, ‐6.19] |
| 2 Woman's perception of pain relief during first stage of labour Show forest plot | 1 | 60 | Mean Difference (IV, Fixed, 95% CI) | ‐55.90 [‐61.09, ‐50.71] |
| 3 Woman's perception of pain relief during the second stage of labour Show forest plot | 1 | 60 | Mean Difference (IV, Fixed, 95% CI) | ‐55.70 [‐63.54, ‐47.86] |
| 4 Pain intensity Show forest plot | 1 | 60 | Risk Ratio (M‐H, Fixed, 95% CI) | 0.03 [0.00, 0.41] |
| 5 Satisfaction with pain relief in labour ‐ proportion rating excellent or very good Show forest plot | 1 | 70 | Risk Ratio (M‐H, Fixed, 95% CI) | 1.32 [1.05, 1.65] |
| 6 Perceived feeling of poor control in labour Show forest plot | 2 | 130 | Risk Ratio (M‐H, Fixed, 95% CI) | 0.89 [0.52, 1.50] |
| 7 Need for additional means of pain relief Show forest plot | 2 | 355 | Risk Ratio (M‐H, Fixed, 95% CI) | 0.14 [0.02, 1.14] |
| 8 Instrumental delivery Show forest plot | 4 | 515 | Risk Ratio (M‐H, Random, 95% CI) | 3.41 [0.62, 18.80] |
| 9 Caesarean section Show forest plot | 5 | 578 | Risk Ratio (M‐H, Fixed, 95% CI) | 0.46 [0.23, 0.90] |
| 10 Motor blockade Show forest plot | 1 | 60 | Risk Ratio (M‐H, Fixed, 95% CI) | 0.0 [0.0, 0.0] |
| 11 Headache Show forest plot | 1 | 60 | Risk Ratio (M‐H, Fixed, 95% CI) | 0.0 [0.0, 0.0] |
| 12 Perineal trauma requiring suturing Show forest plot | 1 | 285 | Risk Ratio (M‐H, Fixed, 95% CI) | 0.86 [0.50, 1.50] |
| 13 Nausea and vomiting Show forest plot | 2 | 160 | Risk Ratio (M‐H, Random, 95% CI) | 11.00 [0.62, 193.80] |
| 14 Itch Show forest plot | 1 | 60 | Risk Ratio (M‐H, Fixed, 95% CI) | 3.0 [0.13, 70.83] |
| 15 Fever > 38 º C Show forest plot | 1 | 70 | Risk Ratio (M‐H, Fixed, 95% CI) | 11.0 [0.63, 191.69] |
| 16 Shivering Show forest plot | 1 | 100 | Risk Ratio (M‐H, Fixed, 95% CI) | 8.0 [1.04, 61.62] |
| 17 Drowsiness Show forest plot | 1 | 100 | Risk Ratio (M‐H, Random, 95% CI) | 7.0 [0.37, 132.10] |
| 18 Urinary retention Show forest plot | 2 | 160 | Risk Ratio (M‐H, Fixed, 95% CI) | 3.0 [0.32, 28.21] |
| 19 Apgar score less than 7 at 5 minutes Show forest plot | 1 | 60 | Risk Ratio (M‐H, Fixed, 95% CI) | 0.0 [0.0, 0.0] |
| 20 Length of first stage of labour (minutes) Show forest plot | 2 | 189 | Mean Difference (IV, Random, 95% CI) | ‐55.09 [‐186.26, 76.09] |
| 21 Length of second stage of labour (minutes) Show forest plot | 4 | 344 | Mean Difference (IV, Random, 95% CI) | 7.66 [‐6.12, 21.45] |
| 22 Oxytocin augmentation Show forest plot | 3 | 415 | Risk Ratio (M‐H, Fixed, 95% CI) | 0.89 [0.63, 1.24] |
| 23 Caesarean section for fetal distress Show forest plot | 1 | 100 | Risk Ratio (M‐H, Fixed, 95% CI) | 1.0 [0.06, 15.55] |
| 24 Caesarean section for dystocia Show forest plot | 1 | 100 | Risk Ratio (M‐H, Fixed, 95% CI) | 2.0 [0.19, 21.36] |
| 25 Sensitivity analysis ‐ allocation concealment: Need for additional means of pain relief Show forest plot | 1 | 70 | Risk Ratio (M‐H, Fixed, 95% CI) | 0.33 [0.01, 7.91] |
| 26 Sensitivity analysis ‐ incomplete outcome data: Need for additional means of pain relief Show forest plot | 1 | 70 | Risk Ratio (M‐H, Fixed, 95% CI) | 0.33 [0.01, 7.91] |
| Outcome or subgroup title | No. of studies | No. of participants | Statistical method | Effect size |
| 1 Maternal pain score in labour Show forest plot | 1 | 60 | Mean Difference (IV, Fixed, 95% CI) | ‐53.00 [‐57.98, ‐48.02] |
| 2 Instrumental delivery Show forest plot | 1 | 60 | Risk Ratio (M‐H, Fixed, 95% CI) | 1.0 [0.15, 6.64] |
| 3 Caesarean section Show forest plot | 1 | 60 | Risk Ratio (M‐H, Fixed, 95% CI) | 2.0 [0.19, 20.90] |
| 4 Hypotension as defined by trial authors Show forest plot | 1 | 60 | Risk Ratio (M‐H, Fixed, 95% CI) | 3.0 [0.13, 70.83] |
| 5 Urinary retention Show forest plot | 1 | 60 | Risk Ratio (M‐H, Fixed, 95% CI) | 3.0 [0.13, 70.83] |
| 6 Nausea and vomiting Show forest plot | 1 | 60 | Risk Ratio (M‐H, Fixed, 95% CI) | 0.0 [0.0, 0.0] |
| 7 Length of second stage of labour (minutes) Show forest plot | 1 | 60 | Mean Difference (IV, Fixed, 95% CI) | 17.90 [5.66, 30.14] |
| 8 Oxytocin augmentation Show forest plot | 1 | 60 | Risk Ratio (M‐H, Fixed, 95% CI) | 1.08 [0.59, 1.97] |
| Outcome or subgroup title | No. of studies | No. of participants | Statistical method | Effect size |
| 1 Maternal satisfaction with pain relief in labour ‐ proportion rating excellent or very good Show forest plot | 1 | 86 | Risk Ratio (M‐H, Fixed, 95% CI) | 2.18 [1.31, 3.62] |
| 2 Caesarean section Show forest plot | 1 | 86 | Risk Ratio (M‐H, Fixed, 95% CI) | 0.63 [0.16, 2.47] |
| Outcome or subgroup title | No. of studies | No. of participants | Statistical method | Effect size |
| 1 Satisfaction with pain relief in labour ‐ proportion rating excellent or very good Show forest plot | 1 | 992 | Risk Ratio (M‐H, Fixed, 95% CI) | 1.01 [1.00, 1.02] |
| 2 Need for additional means of pain relief Show forest plot | 1 | 992 | Risk Ratio (M‐H, Fixed, 95% CI) | 0.00 [0.00, 0.03] |
| 3 Instrumental delivery Show forest plot | 1 | 992 | Risk Ratio (M‐H, Fixed, 95% CI) | 1.16 [0.96, 1.39] |
| 4 Caesarean section Show forest plot | 1 | 992 | Risk Ratio (M‐H, Fixed, 95% CI) | 1.21 [0.91, 1.62] |
| 5 Long‐term backache Show forest plot | 1 | 992 | Risk Ratio (M‐H, Fixed, 95% CI) | 0.88 [0.69, 1.11] |
| 6 Headache Show forest plot | 1 | 992 | Risk Ratio (M‐H, Fixed, 95% CI) | 0.96 [0.79, 1.17] |
| 7 Nausea and vomiting Show forest plot | 1 | 992 | Risk Ratio (M‐H, Fixed, 95% CI) | 1.12 [0.80, 1.57] |
| 8 Cathetherisation during labour Show forest plot | 1 | 992 | Risk Ratio (M‐H, Fixed, 95% CI) | 1.16 [1.04, 1.29] |
| 9 Apgar score less than 7 at 5 minutes Show forest plot | 1 | 992 | Risk Ratio (M‐H, Fixed, 95% CI) | 2.02 [0.61, 6.68] |