Antibióticos profilácticos para la inhibición del trabajo de parto prematuro con membranas intactas
Referencias
References to studies included in this review
References to studies excluded from this review
Additional references
References to other published versions of this review
Characteristics of studies
Characteristics of included studies [ordered by study ID]
Ir a:
| Methods | Single‐centre prospective placebo‐controlled randomised clinical trial. Dallas, Texas US. | |
| Participants | 86 women 24‐34 weeks' gestation (mean 30 weeks), in preterm labour (cervical change with contractions). Multiple births were included. Multiple births were included. | |
| Interventions | IV ampicillin 2 g with sulbactam 1 g every 6 h x 8 doses, followed by ampicillin ‐ clavulanate 250 mg every 8 h x 5 days or placebo. | |
| Outcomes | Primary outcome: delivery > 36 weeks. Other outcomes ‐ maternal: preterm delivery, days of prolongation (in time categories, not mean days), adverse drug reaction. | |
| Notes | Pre‐trial sample size estimation, 39 required in each arm. 86 were randomised, 8 post‐randomisation exclusions. Neither tocolysis nor maternal corticosteroid steroids were used. | |
| Risk of bias | ||
| Bias | Authors' judgement | Support for judgement |
| Random sequence generation (selection bias) | Low risk | Computer‐generated random numbers table. |
| Allocation concealment (selection bias) | Low risk | "Consecutive, numbered, sealed envelopes". Did not state whether opaque however, assignment was by pharmacist. |
| Blinding of participants and personnel (performance bias) | Low risk | Placebo‐controlled using identical administration regimen in the 2 study groups. |
| Blinding of outcome assessment (detection bias) | Low risk | Not clear, but probably low risk. Placebo‐controlled trial. |
| Selective reporting (reporting bias) | Low risk | All expected outcome results reported |
| Incomplete outcome data (attrition bias) | Low risk | < 10% drop‐out rate (total of 6 women) ‐ due to delivery before study commenced or delivered elsewhere. No further information. |
| Incomplete outcome data longer term outcomes (attrition bias) | Unclear risk | Not applicable. |
| Other bias | Low risk | None apparent. |
| Methods | Single‐centre prospective placebo‐controlled randomised clinical trial. Ohio State University Centre, US. | |
| Participants | 117 women 24‐35 weeks' gestation in preterm labour receiving tocolysis. | |
| Interventions | IV ceftizoxime 2 g every 8 h for 5 days (initially), later reduced to 3 days because of patients' refusal. | |
| Outcomes | Primary outcome: delivery > 35 weeks. Other outcomes ‐ | |
| Notes | Pre‐trial sample size estimation indicated that 64 participants were required in each arm. Findings are compared with other study findings in commentary. Toclolytics given to all women. | |
| Risk of bias | ||
| Bias | Authors' judgement | Support for judgement |
| Random sequence generation (selection bias) | Low risk | Computer‐generated randomisation schedule. Stratification by twin pregnancy. |
| Allocation concealment (selection bias) | Low risk | By the pharmacy. |
| Blinding of participants and personnel (performance bias) | Low risk | "double‐blind placebo controlled trial" using identical administration regimen in the two study groups. |
| Blinding of outcome assessment (detection bias) | Low risk | Not clear, but probably low risk. Placebo‐controlled trial. |
| Selective reporting (reporting bias) | Low risk | All expected outcome results reported |
| Incomplete outcome data (attrition bias) | Low risk | Complete follow‐up. |
| Incomplete outcome data longer term outcomes (attrition bias) | Unclear risk | Not applicable. |
| Other bias | Low risk | None apparent. |
| Methods | Multicentre placebo‐controlled randomised clinical trial across 161 centres (2 x 2 factorial design). | |
| Participants | 6295 women at less than 37 weeks' gestation. (GA at entry was approximately 31 weeks). | |
| Interventions | 4 study groups as follows (all oral administration): n = 6241. | |
| Outcomes | Primary outcome: Composite neonatal outcome of neonatal death or major adverse outcome ‐ i.e. chronic lung disease or major cerebral abnormality on ultrasound before hospital discharge. Long‐term follow‐up on a subset of enrolled infants at 7 years of age as follows: Functional impairment was assessed using the Mark III Multi‐Attribute Health Status classification system. Primary outcome was defined as any level of functional impairment (severe, moderate or mild). Other outcomes included death, behaviour (using the Strengths and Difficulties questionnaire) prespecified questions on respiratory symptoms, hospital admissions, convulsions, other prespecified medical conditions and demographic data. Educational attainment was evaluated for the subset of children in England using data from National Cirriculum Tests at 7 years of age (Key Stage 1). | |
| Notes | Pre‐trial sample size estimation based on primary outcome measure. | |
| Risk of bias | ||
| Bias | Authors' judgement | Support for judgement |
| Random sequence generation (selection bias) | Low risk | Computer‐generated randomly generated blocks of 4. |
| Allocation concealment (selection bias) | Low risk | Sequentially numbered boxes of identical appearance dispensed centrally. |
| Blinding of participants and personnel (performance bias) | Low risk | Placebo‐controlled trial using identical administration regimen in the 2 study groups. |
| Blinding of outcome assessment (detection bias) | Low risk | Not clear, but probably low risk. Placebo‐controlled trial. |
| Selective reporting (reporting bias) | Low risk | All expected outcome results reported. |
| Incomplete outcome data (attrition bias) | Low risk | 40 women (<1%) were lost to follow‐up ‐ fairly consistent across the groups. |
| Incomplete outcome data longer term outcomes (attrition bias) | Low risk | Long‐term follow‐up at 7 years of age was undertaken for the infants of women enrolled in the UK only; 71% of all children eligible for follow‐up (representing 50% of the total trial population) were included in this assessment. |
| Other bias | Low risk | None apparent. |
| Methods | Single‐centre placebo‐controlled randomised clinical trial. Montevideo, Uruguay. | |
| Participants | 96 women 24 to 34 weeks' gestation, singleton pregnancy, intact amniotic membranes, no cerclage, diagnosis of threatened preterm labour, cervical dilatation of < 4 cm. Exclusions: haemorrhage, congenital anomalies, polyhydramnios, clinical urinary infection, fetal growth retardation, maternal pathologies such as diabetes/hypertension/pre‐eclampsia, allergies to amoxicillin. | |
| Interventions | Amoxicillin 1000 mg sulbactam 500 mg IV every 8 h during first 48 h, then amoxicillin 250 mg sulbactam 250 mg every 8 h for 5 days. Control: placebo IV fluid, then tablets that look exactly the same as intervention. | |
| Outcomes | Primary outcomes: delivery prior to 37 weeks, delivery prior to 32 weeks, delivery within 7 days. Other outcomes: neonatal/fetal ‐ Apgar score < 7 at 1 min, RDS, Intraventricular haemorrhage all grades, fetal deaths, neonatal deaths, neonatal sepsis, gestation at birth, BW. | |
| Notes | Prior sample size estimation indicated that 40 participants were required in each arm. Tocolysis and maternal corticosteroids were included as part of the study protocol. Multiple pregnancy excluded. Laboratory sponsored. All data analysed before knowing if belonged to treatment or control group. | |
| Risk of bias | ||
| Bias | Authors' judgement | Support for judgement |
| Random sequence generation (selection bias) | Low risk | "a simple randomisation was generated by computer" . " The Laboratory that manufactured the manufactured amoxicillin‐sulbactam, randomised both the antibiotic and the placebo". |
| Allocation concealment (selection bias) | Unclear risk | Sealed envelopes were used. Consecutive or opaque not mentioned however they were prepared by the laboratory. |
| Blinding of participants and personnel (performance bias) | Low risk | Placebo‐controlled trial using identical administration regimens in the 2 study groups. "All study personnel and participants were blinded to treatment assignment for the duration of the study." |
| Blinding of outcome assessment (detection bias) | Low risk | Not clear, but probably low risk. Placebo‐controlled trial. |
| Selective reporting (reporting bias) | Low risk | All expected outcome results reported. |
| Incomplete outcome data (attrition bias) | Low risk | Complete follow‐up. |
| Incomplete outcome data longer term outcomes (attrition bias) | Unclear risk | Not applicable. |
| Other bias | Low risk | None apparent. |
| Methods | Single‐centre placebo‐controlled randomised clinical trial. Denver, Colorado, Canada. | |
| Participants | 117 women < 35 weeks' gestation (mean 30.5 weeks) in preterm labour receiving tocolysis. Exclusions: ruptured membranes, multiple pregnancy, suspected fetal compromise, maternal infection and other maternal medical conditions. | |
| Interventions | IV clindamycin 900 mg every 8 h x 9 doses or identical placebo. IV therapy was followed by oral clindamycin 300 mg every 6 h x 4 days or identical placebo. | |
| Outcomes | Primary outcome: delivery > 36 weeks. Other outcomes ‐ | |
| Notes | Pre‐trial sample size estimation indicated that 57 participants were required in each arm. Additional information on the 14 exclusions (5 antibiotic group, 9 placebo) was received. Tocolysis was included as part of the study protocol. | |
| Risk of bias | ||
| Bias | Authors' judgement | Support for judgement |
| Random sequence generation (selection bias) | Low risk | "computer generated random numbers list." |
| Allocation concealment (selection bias) | Low risk | By pharmacist. |
| Blinding of participants and personnel (performance bias) | Low risk | Placebo‐controlled trial using identical administration regimens in the 2 study groups. |
| Blinding of outcome assessment (detection bias) | Low risk | Not clear, but probably low risk. Placebo‐controlled trial. |
| Selective reporting (reporting bias) | Low risk | All expected outcome results reported. |
| Incomplete outcome data (attrition bias) | Low risk | 12% (14 women) post‐randomisation exclusions. 2 women withdrew consent, 1 woman delivered for fetal distress, 3 women developed chorioamnionitis, 1 women for undiagnosed twins, 6 women were excluded for unknown reasons, 1 woman due to a pharmacy error. All exclusions mentioned. |
| Incomplete outcome data longer term outcomes (attrition bias) | Unclear risk | Not applicable. |
| Other bias | Low risk | None apparent. |
| Methods | Single‐centre placebo‐controlled randomised clinical trial. San Antonio, Texas, US. | |
| Participants | 103 women 24‐35 weeks' gestation (mean 31 weeks), in preterm labour, receiving tocolysis. | |
| Interventions | IV ampicillin 2 g every 6 h x 12 doses, plus oral erythromycin (333 mg every 8 h x 7 days) or identical placebos. | |
| Outcomes | Primary outcome: mean GA at delivery, mean BW. Other outcomes ‐ | |
| Notes | Pre‐trial sample size estimation indicated that 50 participants were required in each arm. 8 post‐randomisation exclusions. Tocolysis was included as part of the study protocol. | |
| Risk of bias | ||
| Bias | Authors' judgement | Support for judgement |
| Random sequence generation (selection bias) | Unclear risk | States "assigned randomly in a 1:1 ratio" but does not state how the random sequence was generated. |
| Allocation concealment (selection bias) | Low risk | By pharmacist. |
| Blinding of participants and personnel (performance bias) | Low risk | Placebo‐controlled trial using identical administration regimens in the 2 study groups. |
| Blinding of outcome assessment (detection bias) | Low risk | Not clear, but probably low risk. Placebo‐controlled trial. |
| Selective reporting (reporting bias) | Low risk | All expected outcome results reported. |
| Incomplete outcome data (attrition bias) | Low risk | 8% (8 women) post‐randomisation exclusions. Only 1 lost to follow‐up. 3 women had additional antibiotics, 2 women delivered prior to study commencement, 1 woman withdrew consent, 1 woman to allergic reaction, 1 woman lost to follow‐up. |
| Incomplete outcome data longer term outcomes (attrition bias) | Unclear risk | Not applicable. |
| Other bias | Low risk | None apparent. |
| Methods | Single‐centre placebo‐controlled randomised clinical trial. San Antonio, Texas, US. | |
| Participants | 91 women 24‐33 weeks' gestation (mean 30 weeks) in preterm labour receiving tocolysis. Exclusions: ruptured membranes, suspected fetal compromise, maternal medical conditions or clinical evidence of maternal infection. Multiple births were included. | |
| Interventions | IV ampicillin 2 g/sulbactam 1 g every 6 h x 12 doses plus oral indomethacin (50 mg load, then 25 mg every 6 h x 7 doses) or corresponding placebos. | |
| Outcomes | Primary outcomes: mean BW and GA at delivery. Other outcomes ‐ Maternal: infection, adverse drug reaction. | |
| Notes | Pre‐trial sample size estimation indicated that 49 participants were required in each arm. 5 post‐randomisation exclusions. "The enrolment was halted early (91 enrolled vs 98 projected patients) for administrative reasons." Toclolytics was part of the study protocol. | |
| Risk of bias | ||
| Bias | Authors' judgement | Support for judgement |
| Random sequence generation (selection bias) | Unclear risk | States "assigned randomly in a 1:1 ratio" but does not state how the random sequence was generated. |
| Allocation concealment (selection bias) | Low risk | By pharmacist. |
| Blinding of participants and personnel (performance bias) | Low risk | Placebo‐controlled trial using identical administration regimens in the 2 study groups. |
| Blinding of outcome assessment (detection bias) | Low risk | Not clear, but probably low risk. Placebo‐controlled trial. |
| Selective reporting (reporting bias) | Low risk | All expected outcome results reported. |
| Incomplete outcome data (attrition bias) | Low risk | 6% (5 women) post‐randomisation exclusions. 1 woman delivered pre‐study commencement, 1 woman was given additional antibiotics, 3 women were lost to follow‐up. |
| Incomplete outcome data longer term outcomes (attrition bias) | Unclear risk | Not applicable. |
| Other bias | Low risk | None apparent. |
| Methods | Multicentre placebo‐controlled randomised clinical trial across 3 centres in South Africa. | |
| Participants | 82 women 26‐34 weeks' gestation (mean 31 weeks) in preterm labour receiving tocolysis. Exclusions: ruptured membranes, antepartum haemorrhage, infection, maternal medical conditions, multiple pregnancy. | |
| Interventions | IV ampicillin 1 g every 6 h x 4 doses followed by oral amoxicillin 500 mg every 8 h x 5 days, plus metronidazole 1 gm stat then 400 mg orally every 8 h for 5 days. | |
| Outcomes | Primary outcome: perinatal mortality. Other outcomes: Maternal: puerperal infection, median days of prolongation, adverse drug reaction. Neonatal: mean GA at delivery, mean BW, neonatal hospital stay, major neonatal morbidity. | |
| Notes | Multicentre trial ‐ 3 centres. Pre‐trial sample size estimation indicated that 220 participants were required in each group. Study was stopped after 82 women were randomised because of poor recruitment rates. 4 post‐randomisation exclusion. Toclolytics was part of the study protocol: Indomethacin 100 mg rectally twice daily for 48 h with concomitant hexoprenaline. | |
| Risk of bias | ||
| Bias | Authors' judgement | Support for judgement |
| Random sequence generation (selection bias) | Unclear risk | "Randmisation, based on group sequential system, was centrally controlled by the MRC Perinatal Mortality Research Unit Capetown." |
| Allocation concealment (selection bias) | Low risk | Stated "opaque, sealed, numbered randomisation envelopes". |
| Blinding of participants and personnel (performance bias) | High risk | Use of placebo was not reported. stated "control group received no antibiotics". |
| Blinding of outcome assessment (detection bias) | High risk | Blinding not reported and no use of placebo. |
| Selective reporting (reporting bias) | Low risk | All expected outcome results reported. |
| Incomplete outcome data (attrition bias) | Low risk | 5% (4 women) post‐randomisation exclusion. 2 women due to protocol violation and 1 woman due to twin pregnancy and 1 woman due to intrauterine death (congenital syphilis). |
| Incomplete outcome data longer term outcomes (attrition bias) | Unclear risk | Not applicable. |
| Other bias | Unclear risk | Following a "initial analysis', the study was stopped early due to difficulty in enrolling sufficient numbers of women. |
| Methods | Single‐centre placebo‐controlled randomised clinical trial. Chile. | |
| Participants | 196 women thought to be in labour between 22 and 36 weeks' gestation, singleton pregnancy, with intact membranes, and cervical dilatation < 5 cm. | |
| Interventions | Oral amoxicillin 250 mg every 8 h and erythromycin 500 mg orally every 6 h for 7 days, or corresponding placebo. | |
| Outcomes | Primary outcomes: RDS, prolongation of pregnancy (median days). Other outcomes: frequency of preterm delivery < 37 weeks and < 34 weeks and perinatal mortality, neonatal sepsis and other morbidity indices. | |
| Notes | Pre‐trial sample size estimation indicated that for a 30% reduction in RDS ˜ 260 participants were required in each group. 23 post‐randomisation exclusions. Study medications supplied by Laboratorio Chile. Tocolysis and maternal corticosteroids were included as part of the study protocol. | |
| Risk of bias | ||
| Bias | Authors' judgement | Support for judgement |
| Random sequence generation (selection bias) | Unclear risk | States 'simple randomisation using tables'. |
| Allocation concealment (selection bias) | Unclear risk | Details not provided. |
| Blinding of participants and personnel (performance bias) | Low risk | Placebo‐controlled trial using identical administration regimens in the 2 study groups. |
| Blinding of outcome assessment (detection bias) | Low risk | Not clear, but probably low risk. Placebo‐controlled trial. |
| Selective reporting (reporting bias) | Low risk | All expected outcome results reported. |
| Incomplete outcome data (attrition bias) | Low risk | 12% (23 women) post‐randomisation exclusions. 13 women were lost to follow‐up and 10 women did not complete treatment. |
| Incomplete outcome data longer term outcomes (attrition bias) | Unclear risk | Not applicable. |
| Other bias | Low risk | None apparent. |
| Methods | Single‐centre placebo‐controlled randomised clinical trial. Iran. | |
| Participants | 80 women, with idiopathic preterm labour, between 26‐34 weeks ‐ cervical dilatation greater than 1 cm and less than 5 cm, cervical effacement of equal or more than 80%, 4 uterine contractions in 20 minutes, or 8 in 60 minutes with progressive cervical change unresponsive to hydration and sedation. Exclusions: 1. presence of a recognised cause of preterm labour or obstetric complication, such as placenta praevia, multiple gestation, abruptio placenta, cervical cerclage, known uterine or fetal anomaly, pregnancy‐induced hypertension, premature rupture of membranes, intrauterine fetal death or fetal growth retardation. 2. known or suspected infection such chorioamnionitis, urinary tract infection, pneumonia. 3. fetal indication for delivery 4. clinically significant maternal cardiac, respiratory, liver, renal or immunologic disease 5. use of antibiotics within 2 weeks of commencement of study. | |
| Interventions | 400 mg erythromycin or an identical‐appearing placebo tablet every 6 h for 10 days. | |
| Outcomes | Primary: interval to delivery, prolonging pregnancy. Other outcomes: GA at delivery, mean BW, neonatal admission to NICU. | |
| Notes | Tocolysis and maternal corticosteroids were included as part of the study protocol. | |
| Risk of bias | ||
| Bias | Authors' judgement | Support for judgement |
| Random sequence generation (selection bias) | Unclear risk | No mention of sequence generation. stated "assigned randomly". |
| Allocation concealment (selection bias) | Unclear risk | Sealed envelopes ‐ whether opaque or sequentially numbered not stated. |
| Blinding of participants and personnel (performance bias) | Low risk | Placebo‐controlled trial using identical administration regimens in the 2 study groups. |
| Blinding of outcome assessment (detection bias) | Low risk | Not clear, but probably low risk. Placebo‐controlled trial. |
| Selective reporting (reporting bias) | Unclear risk | Pre‐specified trial outcome measures were not detailed. Neonatal outcomes were not reported. |
| Incomplete outcome data (attrition bias) | Low risk | 94 enrolled ‐ 14 patients excluded from analysis (15%) (9 due to pregnancy complications fetal distress, pre‐eclampsia, vaginal bleeding, chorioamnionitis); 3 received wrong doses of treatment, 5 had were lost to follow‐up and 3 stopped medication. |
| Incomplete outcome data longer term outcomes (attrition bias) | Unclear risk | Not applicable. |
| Other bias | Low risk | None apparent. |
| Methods | Single‐centre randomised trial. Germany. | |
| Participants | 129 women in preterm labour and with intact membranes. | |
| Interventions | Immediate treatment with mezlocillin 2 g IV every 8 h for 3 days. | |
| Outcomes | Primary: incidence of preterm birth and chorioamnionitis. Other outcomes: incidence of bacterial vaginosis, use of corticosteroids and tocolytics. | |
| Notes | No mention of multiple pregnancy or GA at recruitment. No neonatal outcomes reported. Tocolysis and maternal corticosteroids were included as part of the study protocol. Authors contacted for additional data and information on study methods. | |
| Risk of bias | ||
| Bias | Authors' judgement | Support for judgement |
| Random sequence generation (selection bias) | Unclear risk | Random numbers generation not described. Stated "prospective randomized trial". |
| Allocation concealment (selection bias) | Unclear risk | Stated "those assigned to no antibiotic treatment". |
| Blinding of participants and personnel (performance bias) | High risk | Use of placebo was not reported. |
| Blinding of outcome assessment (detection bias) | High risk | Blinding not reported and no use of placebo. |
| Selective reporting (reporting bias) | Unclear risk | Neonatal outcomes were not reported. |
| Incomplete outcome data (attrition bias) | Unclear risk | Unclear if there were any lost to follow‐up. |
| Incomplete outcome data longer term outcomes (attrition bias) | Unclear risk | Not applicable. |
| Other bias | Low risk | None apparent. |
| Methods | Multicentre placebo‐controlled randomised clinical trial across 4 centres in the US. | |
| Participants | 277 women 24‐34 weeks' gestation (mean 30.5 weeks) in preterm labour receiving tocolysis. Exclusions: ruptured membranes, multiple pregnancy, suspected fetal compromise, suspected imminent delivery, suspected maternal infection, recent antibiotic use. | |
| Interventions | IV ampicillin 1 g every 4 h concomitant IV erythromycin 250 mg every 6 h both for 48 h followed by oral amoxicillin 250 mg every 8 h and erythromycin 333 mg every 8 h for 5 days. | |
| Outcomes | Primary outcomes: days prolongation of pregnancy, frequency of preterm delivery. Secondary: perinatal mortality and morbidity. Other outcomes ‐ Maternal: adverse drug reaction, infection, Neonatal: BW, NICU stay. | |
| Notes | Multicentre trial ‐ 6 centres. Pre‐trial sample size estimation indicated that 350 participants were required for each group. Interim analysis revealed much lower baseline rate of the neonatal morbidity index than was predicted (14% vs 40%). Trial was halted after 277 enrolments. 2 post‐randomisation exclusions. Additional information on trial methods were received. Tocolysis and maternal corticosteroids were included as part of the study protocol. | |
| Risk of bias | ||
| Bias | Authors' judgement | Support for judgement |
| Random sequence generation (selection bias) | Low risk | Computer‐generated random numbers. |
| Allocation concealment (selection bias) | Low risk | Randomly assigned at an independent centre using computerised randomisation process with stratification by study centre. |
| Blinding of participants and personnel (performance bias) | Low risk | Placebo‐controlled trial using identical administration regimens in the 2 study groups. |
| Blinding of outcome assessment (detection bias) | Low risk | Not clear, but probably low risk. Placebo‐controlled trial. |
| Selective reporting (reporting bias) | Low risk | All expected outcome results reported. |
| Incomplete outcome data (attrition bias) | Low risk | < 2% (4 women) post‐randomisation exclusions. 1 woman delivered pre‐study commencement, 1 woman diagnosed with a urinary tract infection, 2 women were lost to follow‐up. |
| Incomplete outcome data longer term outcomes (attrition bias) | Unclear risk | Not applicable. |
| Other bias | Low risk | None apparent. |
| Methods | Multicentre placebo‐controlled randomised clinical trial across 6 centres in Denmark. | |
| Participants | 112 women thought to be in labour between 26 and 34 weeks, singleton pregnancy, cervical dilatation < 4 cm. Exclusion criteria ‐ suspected chorioamnionitis, severe pre‐eclampsia. | |
| Interventions | IV ampicillin 2 g every 6 h for 24 h, followed by pivampicillin 500 mg orally for 7 days, plus IV metronidazole 500 mg every 8 h for 24 h, followed by metronidazole 400 mg orally every 8 h for 7 days, or identical placebo. | |
| Outcomes | Primary outcomes: difference in median days of prolongation of pregnancy of 8 days, difference in mean BW of 200 g. Other outcomes: clinical chorioamnionitis, preterm birth < 37 weeks, Apgar scores, admissions to NICU, days on ventilation, neonatal sepsis. | |
| Notes | Multicentre trial ‐ 6 centres. Pre‐trial sample size estimation indicated that 200 participants were required. The study was stopped just over half‐way because of poor recruitment (110 recruited). 2 post‐randomisation exclusions. Also presented were results for eligible women not included, who were of higher GA, raising a concern about generalisability. Study medications supplied by LEO Pharmaceutical Products, Copenhagen, Denmark. | |
| Risk of bias | ||
| Bias | Authors' judgement | Support for judgement |
| Random sequence generation (selection bias) | Low risk | Computer‐generated numbers stratified by centre. |
| Allocation concealment (selection bias) | Low risk | Block randomisation by pharmaceutical company using consecutively numbered identical packages. |
| Blinding of participants and personnel (performance bias) | Low risk | Placebo‐controlled trial using identical administration regimens in the 2 study groups. |
| Blinding of outcome assessment (detection bias) | Low risk | Stated "those assessing the outcomes were blinded to the allocation". |
| Selective reporting (reporting bias) | Low risk | All expected outcome results reported. |
| Incomplete outcome data (attrition bias) | Low risk | < 2 % (2 women) post‐randomisation exclusions. 1 woman had a twin pregnancy and 1 woman did not receive any treatment and allocation code could not be found. |
| Incomplete outcome data longer term outcomes (attrition bias) | Unclear risk | Not applicable. |
| Other bias | Low risk | None apparent. |
| Methods | Single‐centre randomised trial. Washington, Seattle, US. | |
| Participants | 56 women < 34 weeks' gestation (mean 31 weeks) in preterm labour receiving tocolysis. | |
| Interventions | IV mezlocillin 3 g IV every 6 h for 5 days and oral erythromycin 333 mg every 8 h for 10 days. | |
| Outcomes | Primary: latency, and BW. Secondary: mean BW, mean GA, maternal infection, prolongation of pregnancy > 7 days, maternal adverse drug reaction, neonatal antibiotic therapy, RDS, hospital stay, Apgar scores, perinatal mortality. | |
| Notes | No pre‐trial power calculations. Partly sponsored by Miles Pharmaceutical Co., Inc. Amniocentesis for lung maturity where possible. women. Tocolysis was were included as part of the study protocol. | |
| Risk of bias | ||
| Bias | Authors' judgement | Support for judgement |
| Random sequence generation (selection bias) | Unclear risk | Sequence generation not mentioned. |
| Allocation concealment (selection bias) | Unclear risk | Stated "Randomly assigned in a blinded fashion". |
| Blinding of participants and personnel (performance bias) | Low risk | Placebo‐controlled trial using identical administration regimens in the 2 study groups. |
| Blinding of outcome assessment (detection bias) | Low risk | Not clear, but probably low risk. Placebo‐controlled trial. |
| Selective reporting (reporting bias) | Low risk | All expected outcome results reported. |
| Incomplete outcome data (attrition bias) | Low risk | Complete follow‐up. |
| Incomplete outcome data longer term outcomes (attrition bias) | Unclear risk | Not applicable. |
| Other bias | Low risk | None apparent. |
BW: birthweight
GA: gestational age
GBS: Group B Streptococcus
h: hour(s)
IV: intravenously
NEC: necrotising enterocolitis
NICU: neonatal intensive care unit
PROM: premature rupture of membranes
RDS: respiratory distress syndrome
stat: immediately
vs: versus
Characteristics of excluded studies [ordered by study ID]
Ir a:
| Study | Reason for exclusion |
| Additional information on methods and outcomes to assess eligibility was requested from the authors and had not been forthcoming at the time of the review. | |
| Personal communication on a planned trial. Unable to locate publication or author. | |
| The intervention in this trial was not an antibiotic. | |
| The authors had not provided information on the 47% post‐randomisation exclusions at the time of the review. | |
| The authors had not provided information on the 36% post‐randomisation exclusions at the time of the review. | |
| Women were not in labour. | |
| The authors had not provided information on the 27% post‐randomisation exclusions at the time of the review. | |
| Included women with ruptured membranes. | |
| Included women with ruptured membranes. | |
| Included women with rupture membranes. | |
| Abstract only with insufficient information on methods and outcomes to enable assessment. Authors were contacted with no response. | |
| Quasi‐random method of treatment allocation was used. | |
| Quasi‐random method of treatment allocation was used. | |
| Abstract only. Included women with ruptured membranes. | |
| Quasi‐random method of treatment allocation was used. | |
| Included women with ruptured membranes. |
Data and analyses
| Outcome or subgroup title | No. of studies | No. of participants | Statistical method | Effect size |
| 1 Perinatal mortality Show forest plot | 10 | 7304 | Risk Ratio (M‐H, Fixed, 95% CI) | 1.22 [0.88, 1.69] |
| Analysis 1.1  Comparison 1 Any antibiotics versus no antibiotics, Outcome 1 Perinatal mortality. | ||||
| 2 Stillbirth Show forest plot | 8 | 7080 | Risk Ratio (M‐H, Fixed, 95% CI) | 0.73 [0.43, 1.26] |
| Analysis 1.2  Comparison 1 Any antibiotics versus no antibiotics, Outcome 2 Stillbirth. | ||||
| 3 Neonatal death Show forest plot | 9 | 7248 | Risk Ratio (M‐H, Fixed, 95% CI) | 1.57 [1.03, 2.40] |
| Analysis 1.3  Comparison 1 Any antibiotics versus no antibiotics, Outcome 3 Neonatal death. | ||||
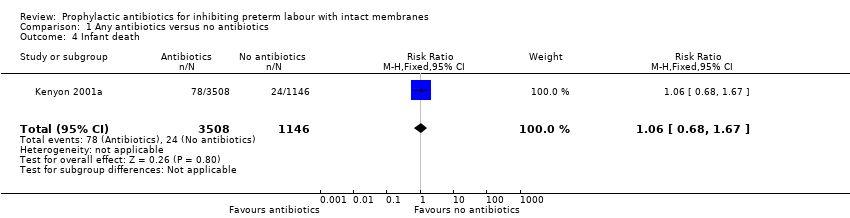
| 4 Infant death Show forest plot | 1 | 4654 | Risk Ratio (M‐H, Fixed, 95% CI) | 1.06 [0.68, 1.67] |
| Analysis 1.4  Comparison 1 Any antibiotics versus no antibiotics, Outcome 4 Infant death. | ||||
| 5 Any functional impairment at 7 years of age. Show forest plot | 1 | 3052 | Risk Ratio (M‐H, Fixed, 95% CI) | 1.10 [0.99, 1.23] |
| Analysis 1.5 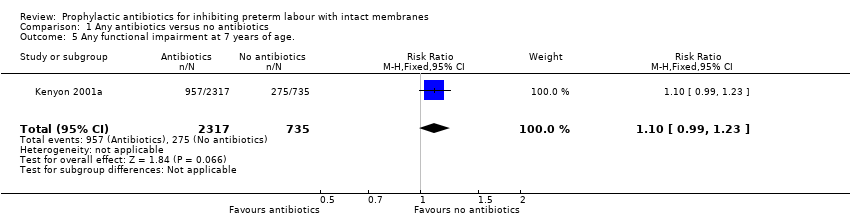 Comparison 1 Any antibiotics versus no antibiotics, Outcome 5 Any functional impairment at 7 years of age.. | ||||
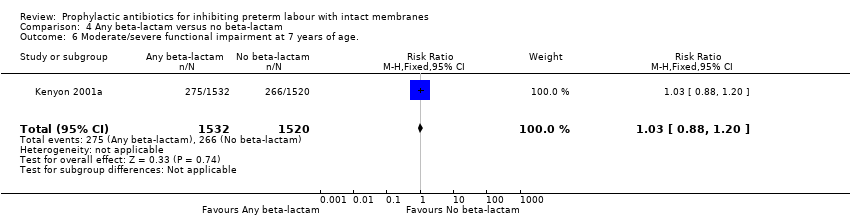
| 6 Moderate/severe functional impairment at 7 years of age. Show forest plot | 1 | 3052 | Risk Ratio (M‐H, Fixed, 95% CI) | 1.07 [0.89, 1.28] |
| Analysis 1.6 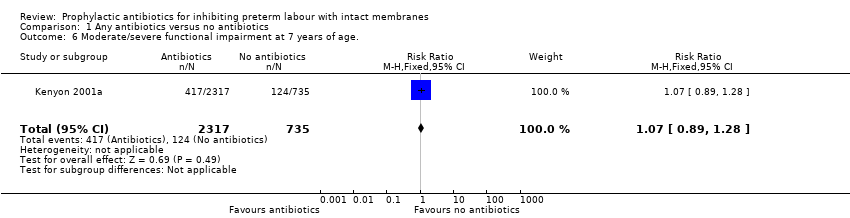 Comparison 1 Any antibiotics versus no antibiotics, Outcome 6 Moderate/severe functional impairment at 7 years of age.. | ||||
| 7 Cerebral palsy at 7 years Show forest plot | 1 | 3173 | Risk Ratio (M‐H, Fixed, 95% CI) | 1.82 [0.99, 3.34] |
| Analysis 1.7 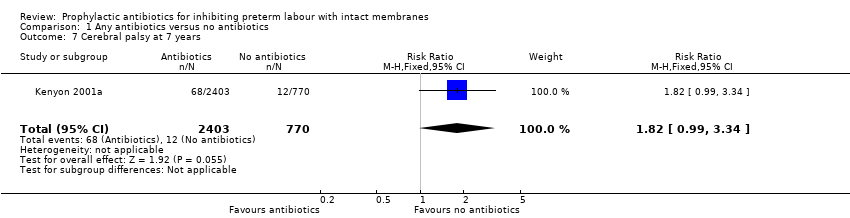 Comparison 1 Any antibiotics versus no antibiotics, Outcome 7 Cerebral palsy at 7 years. | ||||
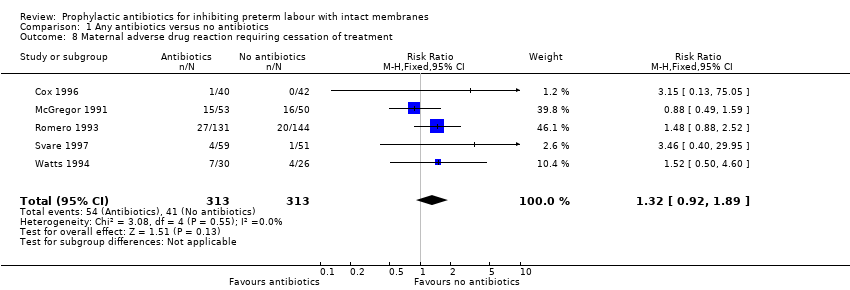
| 8 Maternal adverse drug reaction requiring cessation of treatment Show forest plot | 5 | 626 | Risk Ratio (M‐H, Fixed, 95% CI) | 1.32 [0.92, 1.89] |
| Analysis 1.8  Comparison 1 Any antibiotics versus no antibiotics, Outcome 8 Maternal adverse drug reaction requiring cessation of treatment. | ||||
| 9 Maternal infection Show forest plot | 10 | 7371 | Risk Ratio (M‐H, Fixed, 95% CI) | 0.74 [0.63, 0.86] |
| Analysis 1.9  Comparison 1 Any antibiotics versus no antibiotics, Outcome 9 Maternal infection. | ||||
| 10 Delay in birth (subgrouped by interval) Show forest plot | 9 | Risk Ratio (M‐H, Fixed, 95% CI) | Subtotals only | |
| Analysis 1.10 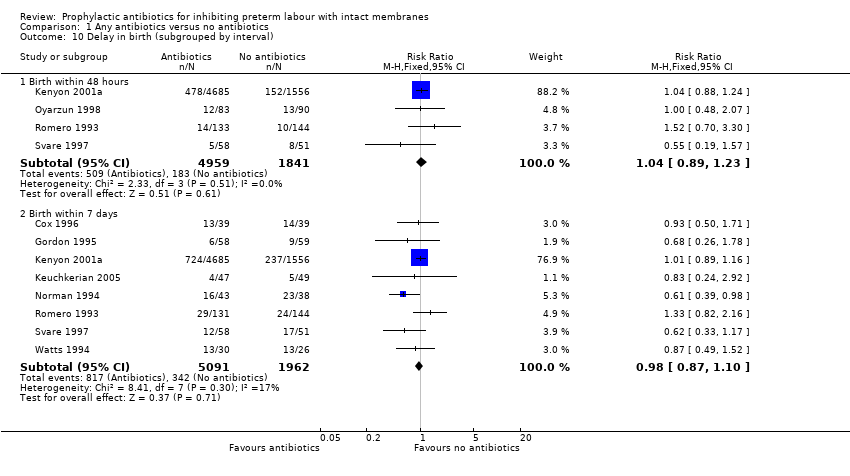 Comparison 1 Any antibiotics versus no antibiotics, Outcome 10 Delay in birth (subgrouped by interval). | ||||
| 10.1 Birth within 48 hours | 4 | 6800 | Risk Ratio (M‐H, Fixed, 95% CI) | 1.04 [0.89, 1.23] |
| 10.2 Birth within 7 days | 8 | 7053 | Risk Ratio (M‐H, Fixed, 95% CI) | 0.98 [0.87, 1.10] |
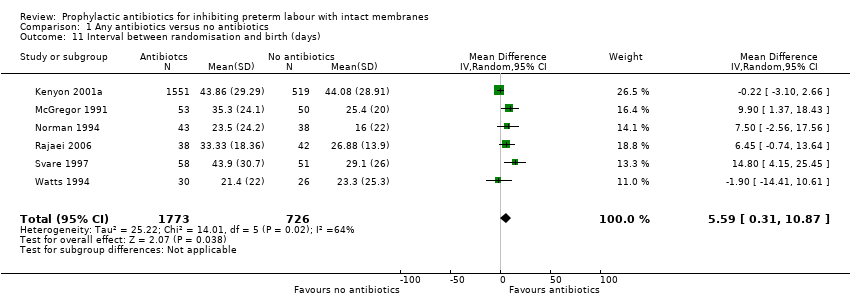
| 11 Interval between randomisation and birth (days) Show forest plot | 6 | 2499 | Mean Difference (IV, Random, 95% CI) | 5.59 [0.31, 10.87] |
| Analysis 1.11  Comparison 1 Any antibiotics versus no antibiotics, Outcome 11 Interval between randomisation and birth (days). | ||||
| 12 Preterm birth (< 36 or < 37 weeks) Show forest plot | 10 | 7387 | Risk Ratio (M‐H, Fixed, 95% CI) | 0.98 [0.92, 1.05] |
| Analysis 1.12  Comparison 1 Any antibiotics versus no antibiotics, Outcome 12 Preterm birth (< 36 or < 37 weeks). | ||||
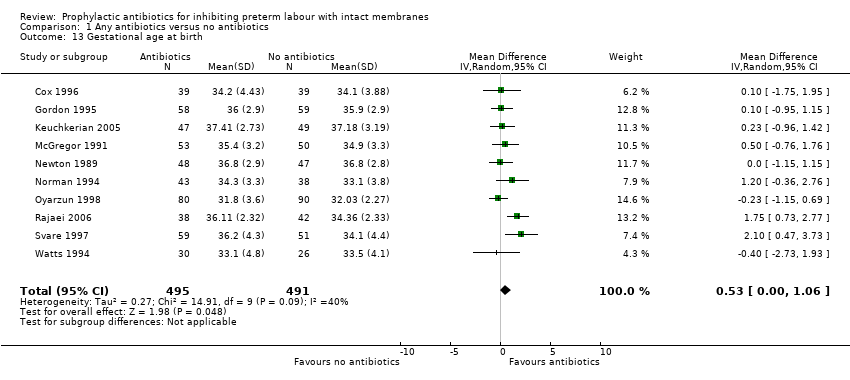
| 13 Gestational age at birth Show forest plot | 10 | 986 | Mean Difference (IV, Random, 95% CI) | 0.53 [0.00, 1.06] |
| Analysis 1.13  Comparison 1 Any antibiotics versus no antibiotics, Outcome 13 Gestational age at birth. | ||||
| 14 Birthweight Show forest plot | 12 | 7531 | Mean Difference (IV, Random, 95% CI) | 58.38 [‐26.24, 143.00] |
| Analysis 1.14 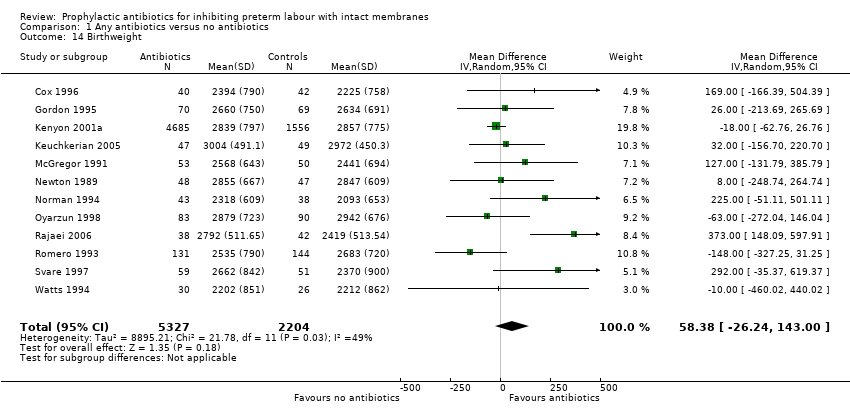 Comparison 1 Any antibiotics versus no antibiotics, Outcome 14 Birthweight. | ||||
| 15 Birthweight < 2500 g Show forest plot | 5 | 6628 | Risk Ratio (M‐H, Random, 95% CI) | 0.97 [0.81, 1.15] |
| Analysis 1.15  Comparison 1 Any antibiotics versus no antibiotics, Outcome 15 Birthweight < 2500 g. | ||||
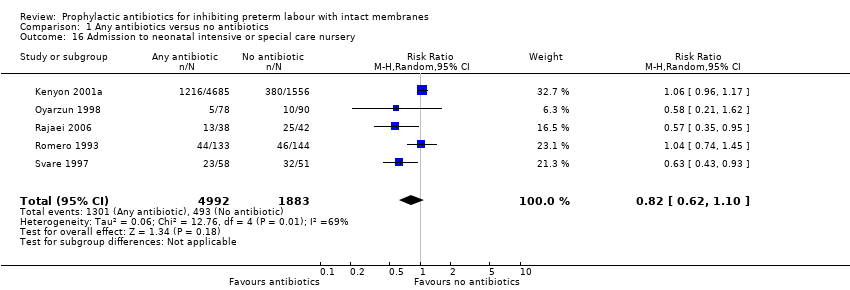
| 16 Admission to neonatal intensive or special care nursery Show forest plot | 5 | 6875 | Risk Ratio (M‐H, Random, 95% CI) | 0.82 [0.62, 1.10] |
| Analysis 1.16  Comparison 1 Any antibiotics versus no antibiotics, Outcome 16 Admission to neonatal intensive or special care nursery. | ||||
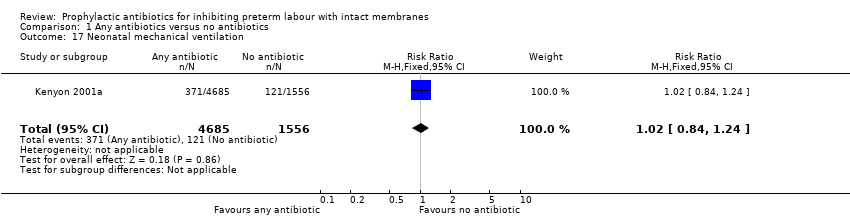
| 17 Neonatal mechanical ventilation Show forest plot | 1 | 6241 | Risk Ratio (M‐H, Fixed, 95% CI) | 1.02 [0.84, 1.24] |
| Analysis 1.17  Comparison 1 Any antibiotics versus no antibiotics, Outcome 17 Neonatal mechanical ventilation. | ||||
| 18 Respiratory distress syndrome Show forest plot | 9 | 7200 | Risk Ratio (M‐H, Fixed, 95% CI) | 0.99 [0.84, 1.16] |
| Analysis 1.18 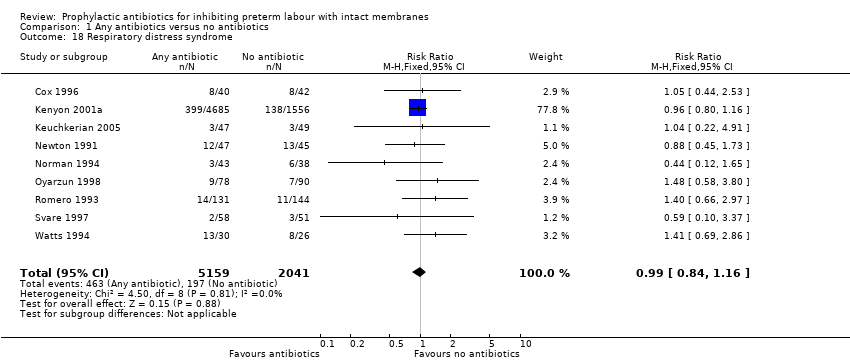 Comparison 1 Any antibiotics versus no antibiotics, Outcome 18 Respiratory distress syndrome. | ||||
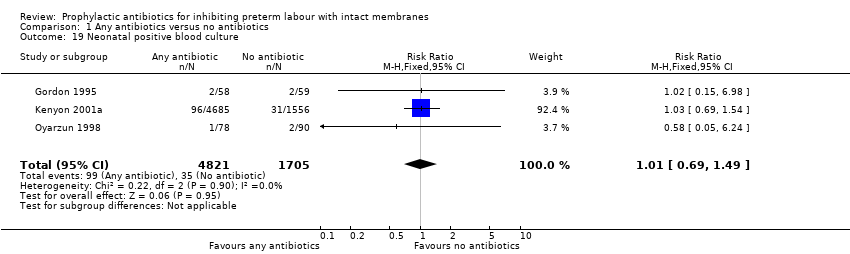
| 19 Neonatal positive blood culture Show forest plot | 3 | 6526 | Risk Ratio (M‐H, Fixed, 95% CI) | 1.01 [0.69, 1.49] |
| Analysis 1.19  Comparison 1 Any antibiotics versus no antibiotics, Outcome 19 Neonatal positive blood culture. | ||||
| 20 Neonatal sepsis Show forest plot | 10 | 7386 | Risk Ratio (M‐H, Fixed, 95% CI) | 0.86 [0.64, 1.16] |
| Analysis 1.20  Comparison 1 Any antibiotics versus no antibiotics, Outcome 20 Neonatal sepsis. | ||||
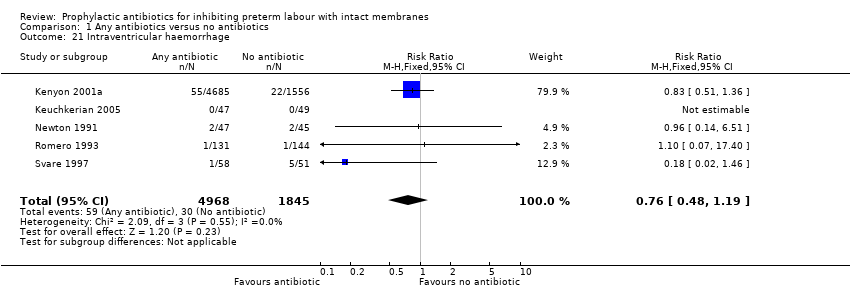
| 21 Intraventricular haemorrhage Show forest plot | 5 | 6813 | Risk Ratio (M‐H, Fixed, 95% CI) | 0.76 [0.48, 1.19] |
| Analysis 1.21  Comparison 1 Any antibiotics versus no antibiotics, Outcome 21 Intraventricular haemorrhage. | ||||
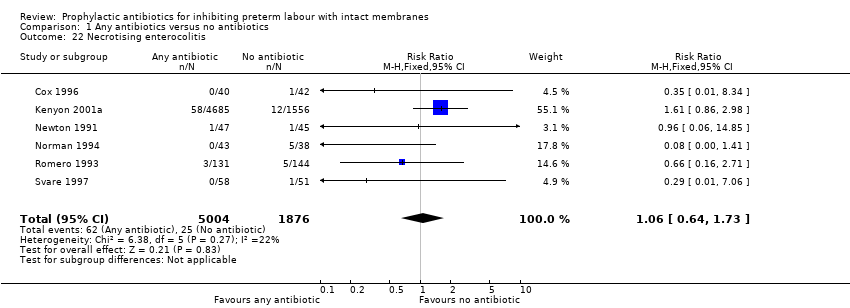
| 22 Necrotising enterocolitis Show forest plot | 6 | 6880 | Risk Ratio (M‐H, Fixed, 95% CI) | 1.06 [0.64, 1.73] |
| Analysis 1.22  Comparison 1 Any antibiotics versus no antibiotics, Outcome 22 Necrotising enterocolitis. | ||||
| 23 Major cerebral abnormality Show forest plot | 1 | 6241 | Risk Ratio (M‐H, Fixed, 95% CI) | 1.00 [0.66, 1.51] |
| Analysis 1.23 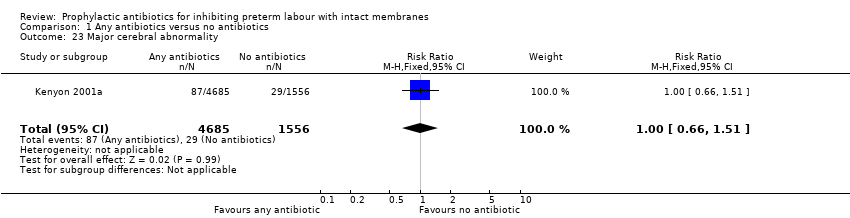 Comparison 1 Any antibiotics versus no antibiotics, Outcome 23 Major cerebral abnormality. | ||||
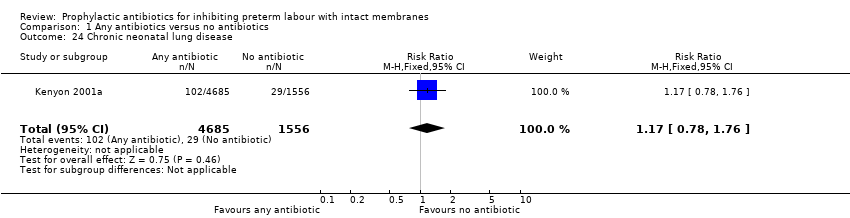
| 24 Chronic neonatal lung disease Show forest plot | 1 | 6241 | Risk Ratio (M‐H, Fixed, 95% CI) | 1.17 [0.78, 1.76] |
| Analysis 1.24  Comparison 1 Any antibiotics versus no antibiotics, Outcome 24 Chronic neonatal lung disease. | ||||
| Outcome or subgroup title | No. of studies | No. of participants | Statistical method | Effect size |
| 1 Perinatal mortality Show forest plot | 10 | Risk Ratio (M‐H, Fixed, 95% CI) | Subtotals only | |
| Analysis 2.1 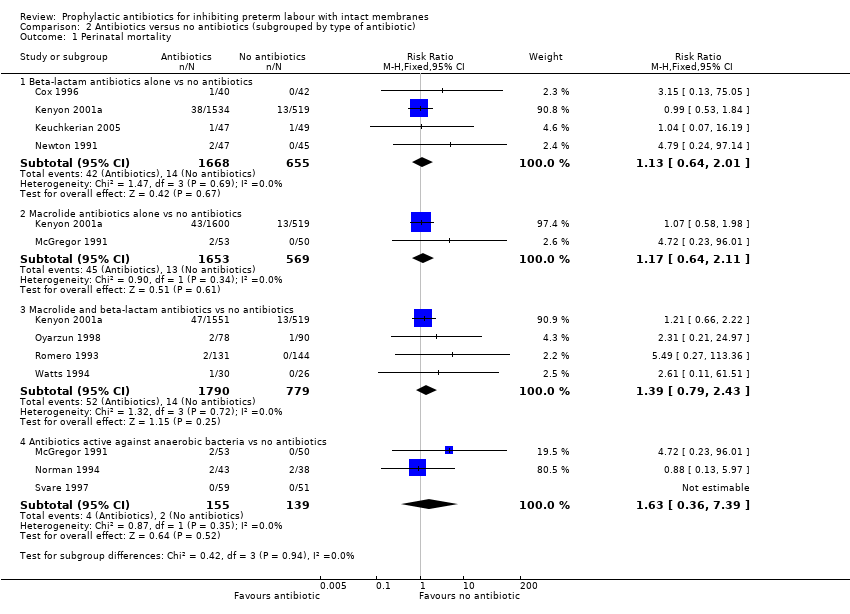 Comparison 2 Antibiotics versus no antibiotics (subgrouped by type of antibiotic), Outcome 1 Perinatal mortality. | ||||
| 1.1 Beta‐lactam antibiotics alone vs no antibiotics | 4 | 2323 | Risk Ratio (M‐H, Fixed, 95% CI) | 1.13 [0.64, 2.01] |
| 1.2 Macrolide antibiotics alone vs no antibiotics | 2 | 2222 | Risk Ratio (M‐H, Fixed, 95% CI) | 1.17 [0.64, 2.11] |
| 1.3 Macrolide and beta‐lactam antibiotics vs no antibiotics | 4 | 2569 | Risk Ratio (M‐H, Fixed, 95% CI) | 1.39 [0.79, 2.43] |
| 1.4 Antibiotics active against anaerobic bacteria vs no antibiotics | 3 | 294 | Risk Ratio (M‐H, Fixed, 95% CI) | 1.63 [0.36, 7.39] |
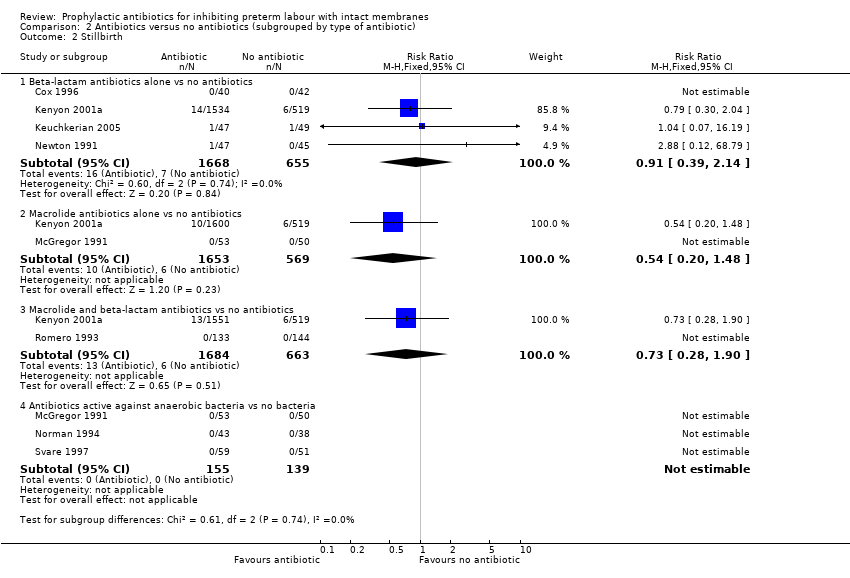
| 2 Stillbirth Show forest plot | 8 | Risk Ratio (M‐H, Fixed, 95% CI) | Subtotals only | |
| Analysis 2.2  Comparison 2 Antibiotics versus no antibiotics (subgrouped by type of antibiotic), Outcome 2 Stillbirth. | ||||
| 2.1 Beta‐lactam antibiotics alone vs no antibiotics | 4 | 2323 | Risk Ratio (M‐H, Fixed, 95% CI) | 0.91 [0.39, 2.14] |
| 2.2 Macrolide antibiotics alone vs no antibiotics | 2 | 2222 | Risk Ratio (M‐H, Fixed, 95% CI) | 0.54 [0.20, 1.48] |
| 2.3 Macrolide and beta‐lactam antibiotics vs no antibiotics | 2 | 2347 | Risk Ratio (M‐H, Fixed, 95% CI) | 0.73 [0.28, 1.90] |
| 2.4 Antibiotics active against anaerobic bacteria vs no bacteria | 3 | 294 | Risk Ratio (M‐H, Fixed, 95% CI) | 0.0 [0.0, 0.0] |
| 3 Neonatal death Show forest plot | 9 | Risk Ratio (M‐H, Fixed, 95% CI) | Subtotals only | |
| Analysis 2.3  Comparison 2 Antibiotics versus no antibiotics (subgrouped by type of antibiotic), Outcome 3 Neonatal death. | ||||
| 3.1 Beta‐lactam antibiotics alone vs no antibiotics | 4 | 2323 | Risk Ratio (M‐H, Fixed, 95% CI) | 1.32 [0.61, 2.86] |
| 3.2 Macrolide antibiotics alone vs no antibiotics | 2 | 2222 | Risk Ratio (M‐H, Fixed, 95% CI) | 1.68 [0.77, 3.64] |
| 3.3 Macrolide and beta‐lactam antibiotics vs no antibiotics | 3 | 2513 | Risk Ratio (M‐H, Fixed, 95% CI) | 1.83 [0.88, 3.82] |
| 3.4 Antibiotics active against anaerobic bacteria vs no antibiotics | 3 | 294 | Risk Ratio (M‐H, Fixed, 95% CI) | 1.63 [0.36, 7.39] |
| 4 Infant death Show forest plot | 1 | Risk Ratio (M‐H, Fixed, 95% CI) | Subtotals only | |
| Analysis 2.4 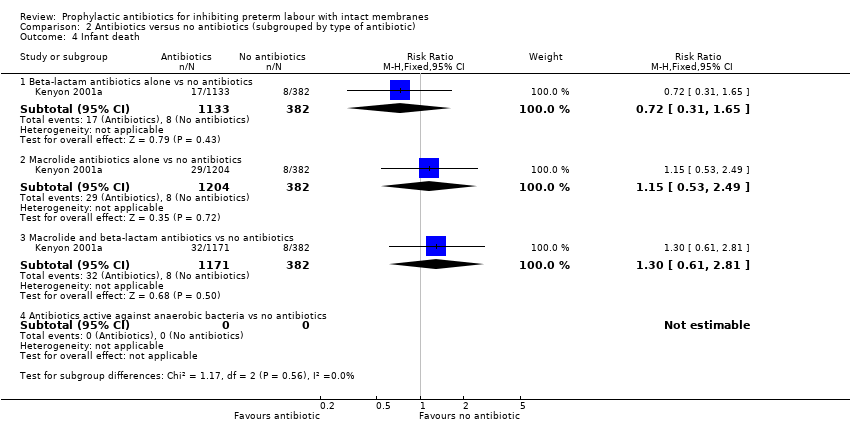 Comparison 2 Antibiotics versus no antibiotics (subgrouped by type of antibiotic), Outcome 4 Infant death. | ||||
| 4.1 Beta‐lactam antibiotics alone vs no antibiotics | 1 | 1515 | Risk Ratio (M‐H, Fixed, 95% CI) | 0.72 [0.31, 1.65] |
| 4.2 Macrolide antibiotics alone vs no antibiotics | 1 | 1586 | Risk Ratio (M‐H, Fixed, 95% CI) | 1.15 [0.53, 2.49] |
| 4.3 Macrolide and beta‐lactam antibiotics vs no antibiotics | 1 | 1553 | Risk Ratio (M‐H, Fixed, 95% CI) | 1.30 [0.61, 2.81] |
| 4.4 Antibiotics active against anaerobic bacteria vs no antibiotics | 0 | 0 | Risk Ratio (M‐H, Fixed, 95% CI) | 0.0 [0.0, 0.0] |
| 5 Any functional impairment at 7 years of age. Show forest plot | 1 | Risk Ratio (M‐H, Fixed, 95% CI) | Subtotals only | |
| Analysis 2.5 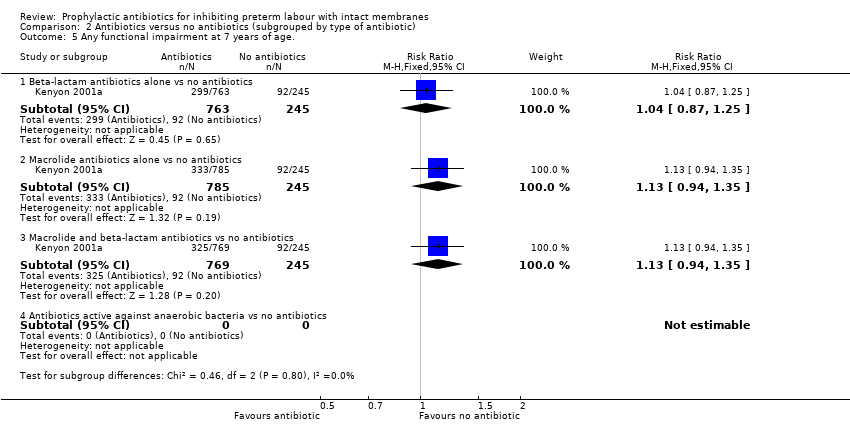 Comparison 2 Antibiotics versus no antibiotics (subgrouped by type of antibiotic), Outcome 5 Any functional impairment at 7 years of age.. | ||||
| 5.1 Beta‐lactam antibiotics alone vs no antibiotics | 1 | 1008 | Risk Ratio (M‐H, Fixed, 95% CI) | 1.04 [0.87, 1.25] |
| 5.2 Macrolide antibiotics alone vs no antibiotics | 1 | 1030 | Risk Ratio (M‐H, Fixed, 95% CI) | 1.13 [0.94, 1.35] |
| 5.3 Macrolide and beta‐lactam antibiotics vs no antibiotics | 1 | 1014 | Risk Ratio (M‐H, Fixed, 95% CI) | 1.13 [0.94, 1.35] |
| 5.4 Antibiotics active against anaerobic bacteria vs no antibiotics | 0 | 0 | Risk Ratio (M‐H, Fixed, 95% CI) | 0.0 [0.0, 0.0] |
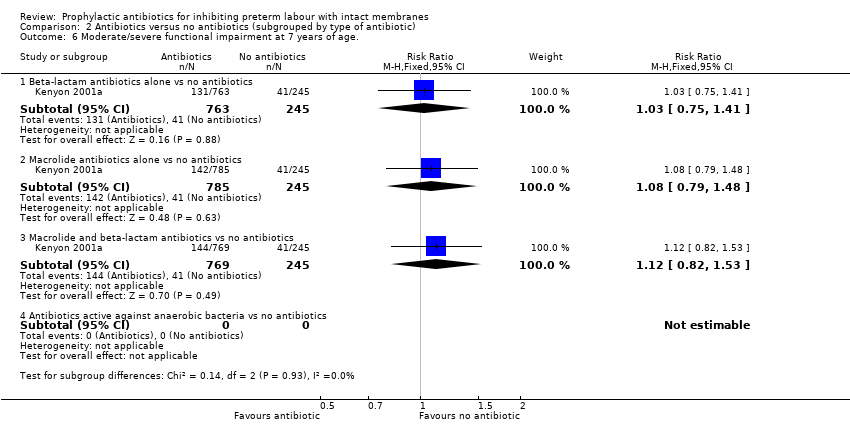
| 6 Moderate/severe functional impairment at 7 years of age. Show forest plot | 1 | Risk Ratio (M‐H, Fixed, 95% CI) | Subtotals only | |
| Analysis 2.6  Comparison 2 Antibiotics versus no antibiotics (subgrouped by type of antibiotic), Outcome 6 Moderate/severe functional impairment at 7 years of age.. | ||||
| 6.1 Beta‐lactam antibiotics alone vs no antibiotics | 1 | 1008 | Risk Ratio (M‐H, Fixed, 95% CI) | 1.03 [0.75, 1.41] |
| 6.2 Macrolide antibiotics alone vs no antibiotics | 1 | 1030 | Risk Ratio (M‐H, Fixed, 95% CI) | 1.08 [0.79, 1.48] |
| 6.3 Macrolide and beta‐lactam antibiotics vs no antibiotics | 1 | 1014 | Risk Ratio (M‐H, Fixed, 95% CI) | 1.12 [0.82, 1.53] |
| 6.4 Antibiotics active against anaerobic bacteria vs no antibiotics | 0 | 0 | Risk Ratio (M‐H, Fixed, 95% CI) | 0.0 [0.0, 0.0] |
| 7 Cerebral palsy at 7 years of age Show forest plot | 1 | Risk Ratio (M‐H, Random, 95% CI) | Subtotals only | |
| Analysis 2.7  Comparison 2 Antibiotics versus no antibiotics (subgrouped by type of antibiotic), Outcome 7 Cerebral palsy at 7 years of age. | ||||
| 7.1 Beta‐lactam antibiotics alone vs no antibiotics | 1 | 1049 | Risk Ratio (M‐H, Random, 95% CI) | 1.22 [0.41, 3.63] |
| 7.2 Macrolide antibiotics alone vs no antibiotics | 1 | 1073 | Risk Ratio (M‐H, Random, 95% CI) | 1.42 [0.48, 4.15] |
| 7.3 Macrolide and beta‐lactam antibiotics vs no antibiotics | 1 | 1052 | Risk Ratio (M‐H, Random, 95% CI) | 2.83 [1.02, 7.88] |
| 7.4 Antibiotics active against anaerobic bacteria vs no antibiotics | 0 | 0 | Risk Ratio (M‐H, Random, 95% CI) | 0.0 [0.0, 0.0] |
| 8 Maternal adverse drug reaction requiring cessation of treatment Show forest plot | 5 | Risk Ratio (M‐H, Fixed, 95% CI) | Subtotals only | |
| Analysis 2.8  Comparison 2 Antibiotics versus no antibiotics (subgrouped by type of antibiotic), Outcome 8 Maternal adverse drug reaction requiring cessation of treatment. | ||||
| 8.1 Beta‐lactam antibiotics alone vs no antibiotics | 1 | 82 | Risk Ratio (M‐H, Fixed, 95% CI) | 3.15 [0.13, 75.05] |
| 8.2 Macrolide antibiotics alone vs no antibiotics | 1 | 103 | Risk Ratio (M‐H, Fixed, 95% CI) | 0.88 [0.49, 1.59] |
| 8.3 Macrolide and beta‐lactam antibiotics vs no antibiotics | 2 | 331 | Risk Ratio (M‐H, Fixed, 95% CI) | 1.49 [0.93, 2.40] |
| 8.4 Antibiotics active against anaerobic bacteria vs no antibiotics | 2 | 213 | Risk Ratio (M‐H, Fixed, 95% CI) | 1.04 [0.59, 1.83] |
| 9 Maternal infection Show forest plot | 10 | Risk Ratio (M‐H, Random, 95% CI) | Subtotals only | |
| Analysis 2.9 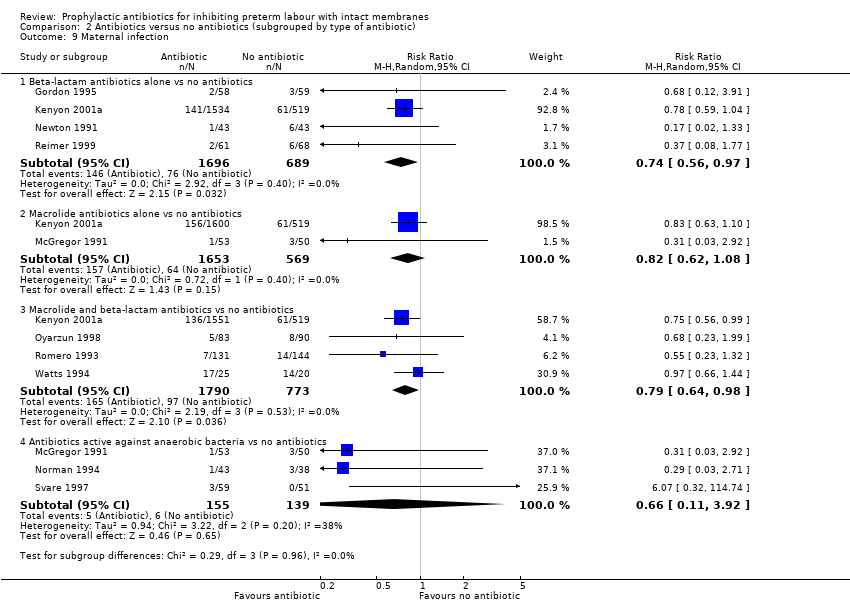 Comparison 2 Antibiotics versus no antibiotics (subgrouped by type of antibiotic), Outcome 9 Maternal infection. | ||||
| 9.1 Beta‐lactam antibiotics alone vs no antibiotics | 4 | 2385 | Risk Ratio (M‐H, Random, 95% CI) | 0.74 [0.56, 0.97] |
| 9.2 Macrolide antibiotics alone vs no antibiotics | 2 | 2222 | Risk Ratio (M‐H, Random, 95% CI) | 0.82 [0.62, 1.08] |
| 9.3 Macrolide and beta‐lactam antibiotics vs no antibiotics | 4 | 2563 | Risk Ratio (M‐H, Random, 95% CI) | 0.79 [0.64, 0.98] |
| 9.4 Antibiotics active against anaerobic bacteria vs no antibiotics | 3 | 294 | Risk Ratio (M‐H, Random, 95% CI) | 0.66 [0.11, 3.92] |
| 10 Birth within 48 hours of randomisation Show forest plot | 4 | Risk Ratio (M‐H, Fixed, 95% CI) | Subtotals only | |
| Analysis 2.10 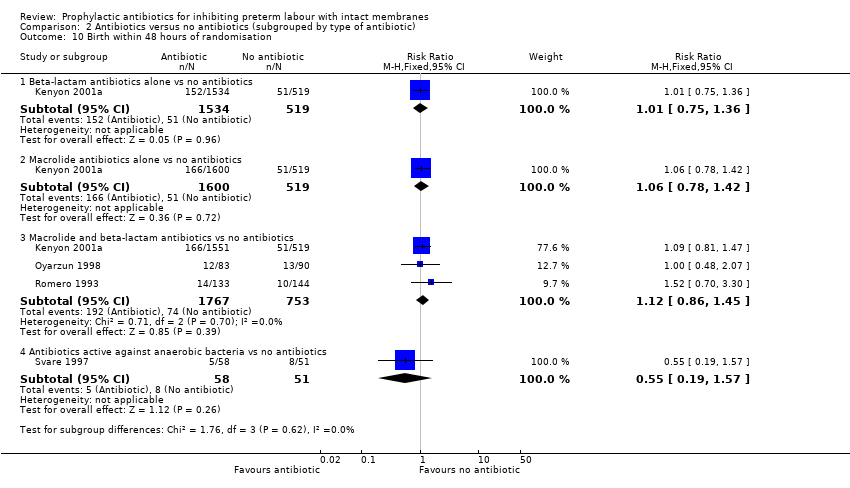 Comparison 2 Antibiotics versus no antibiotics (subgrouped by type of antibiotic), Outcome 10 Birth within 48 hours of randomisation. | ||||
| 10.1 Beta‐lactam antibiotics alone vs no antibiotics | 1 | 2053 | Risk Ratio (M‐H, Fixed, 95% CI) | 1.01 [0.75, 1.36] |
| 10.2 Macrolide antibiotics alone vs no antibiotics | 1 | 2119 | Risk Ratio (M‐H, Fixed, 95% CI) | 1.06 [0.78, 1.42] |
| 10.3 Macrolide and beta‐lactam antibiotics vs no antibiotics | 3 | 2520 | Risk Ratio (M‐H, Fixed, 95% CI) | 1.12 [0.86, 1.45] |
| 10.4 Antibiotics active against anaerobic bacteria vs no antibiotics | 1 | 109 | Risk Ratio (M‐H, Fixed, 95% CI) | 0.55 [0.19, 1.57] |
| 11 Interval between randomisation and birth (days) Show forest plot | 7 | Mean Difference (IV, Random, 95% CI) | Subtotals only | |
| Analysis 2.11  Comparison 2 Antibiotics versus no antibiotics (subgrouped by type of antibiotic), Outcome 11 Interval between randomisation and birth (days). | ||||
| 11.1 Beta‐lactam antibiotics alone vs no antibiotics | 1 | 2053 | Mean Difference (IV, Random, 95% CI) | ‐0.09 [‐2.96, 2.78] |
| 11.2 Macrolide antibiotics alone vs no antibiotics | 3 | 2302 | Mean Difference (IV, Random, 95% CI) | 4.26 [‐2.88, 11.41] |
| 11.3 Macrolide and beta‐lactam antibiotics vs no antibiotics | 3 | 2221 | Mean Difference (IV, Random, 95% CI) | ‐0.27 [‐2.95, 2.41] |
| 11.4 Antibiotics active against anaerobic bacteria vs no antibiotics | 3 | 293 | Mean Difference (IV, Random, 95% CI) | 10.50 [4.95, 16.06] |
| 12 Preterm birth (< 36 or < 37 weeks' gestation) Show forest plot | 10 | Risk Ratio (M‐H, Random, 95% CI) | Subtotals only | |
| Analysis 2.12 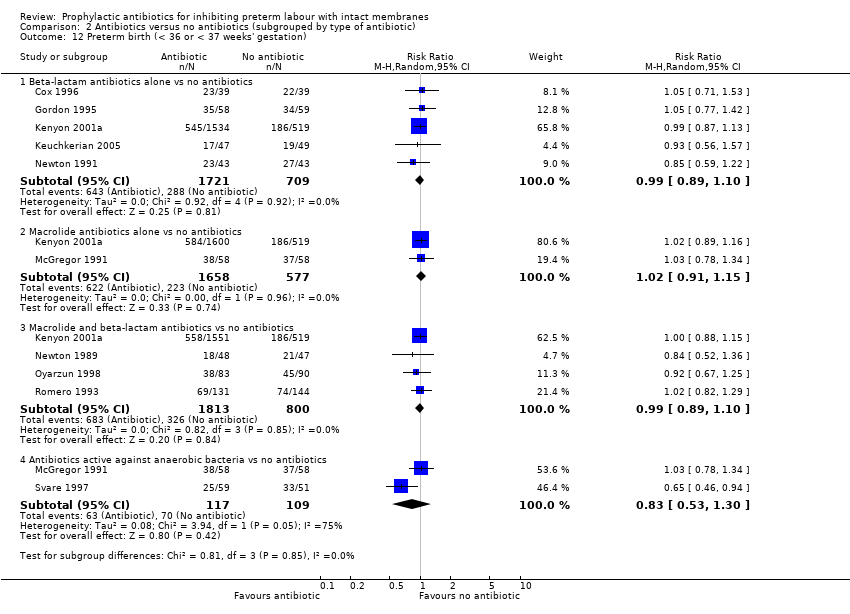 Comparison 2 Antibiotics versus no antibiotics (subgrouped by type of antibiotic), Outcome 12 Preterm birth (< 36 or < 37 weeks' gestation). | ||||
| 12.1 Beta‐lactam antibiotics alone vs no antibiotics | 5 | 2430 | Risk Ratio (M‐H, Random, 95% CI) | 0.99 [0.89, 1.10] |
| 12.2 Macrolide antibiotics alone vs no antibiotics | 2 | 2235 | Risk Ratio (M‐H, Random, 95% CI) | 1.02 [0.91, 1.15] |
| 12.3 Macrolide and beta‐lactam antibiotics vs no antibiotics | 4 | 2613 | Risk Ratio (M‐H, Random, 95% CI) | 0.99 [0.89, 1.10] |
| 12.4 Antibiotics active against anaerobic bacteria vs no antibiotics | 2 | 226 | Risk Ratio (M‐H, Random, 95% CI) | 0.83 [0.53, 1.30] |
| 13 Respiratory distress syndrome Show forest plot | 5 | Risk Ratio (M‐H, Fixed, 95% CI) | Subtotals only | |
| Analysis 2.13  Comparison 2 Antibiotics versus no antibiotics (subgrouped by type of antibiotic), Outcome 13 Respiratory distress syndrome. | ||||
| 13.1 Beta‐lactam antibiotics alone vs no antibiotics | 3 | 3278 | Risk Ratio (M‐H, Fixed, 95% CI) | 0.93 [0.75, 1.16] |
| 13.2 Macrolide antibiotics alone vs no antibiotics | 1 | 3156 | Risk Ratio (M‐H, Fixed, 95% CI) | 0.94 [0.75, 1.18] |
| 13.3 Macrolide and beta‐lactam antibiotics vs no antibiotics | 2 | 3382 | Risk Ratio (M‐H, Fixed, 95% CI) | 1.04 [0.84, 1.29] |
| 13.4 Antibiotics active against anaerobic bacteria vs no antibiotics | 1 | 109 | Risk Ratio (M‐H, Fixed, 95% CI) | 0.59 [0.10, 3.37] |
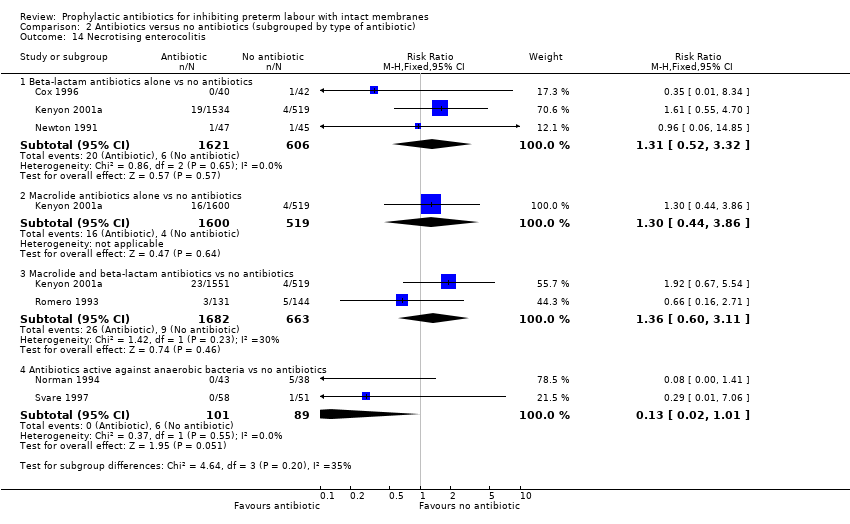
| 14 Necrotising enterocolitis Show forest plot | 6 | Risk Ratio (M‐H, Fixed, 95% CI) | Subtotals only | |
| Analysis 2.14  Comparison 2 Antibiotics versus no antibiotics (subgrouped by type of antibiotic), Outcome 14 Necrotising enterocolitis. | ||||
| 14.1 Beta‐lactam antibiotics alone vs no antibiotics | 3 | 2227 | Risk Ratio (M‐H, Fixed, 95% CI) | 1.31 [0.52, 3.32] |
| 14.2 Macrolide antibiotics alone vs no antibiotics | 1 | 2119 | Risk Ratio (M‐H, Fixed, 95% CI) | 1.30 [0.44, 3.86] |
| 14.3 Macrolide and beta‐lactam antibiotics vs no antibiotics | 2 | 2345 | Risk Ratio (M‐H, Fixed, 95% CI) | 1.36 [0.60, 3.11] |
| 14.4 Antibiotics active against anaerobic bacteria vs no antibiotics | 2 | 190 | Risk Ratio (M‐H, Fixed, 95% CI) | 0.13 [0.02, 1.01] |
| 15 Intraventricular haemorrhage Show forest plot | 5 | Risk Ratio (M‐H, Fixed, 95% CI) | Subtotals only | |
| Analysis 2.15 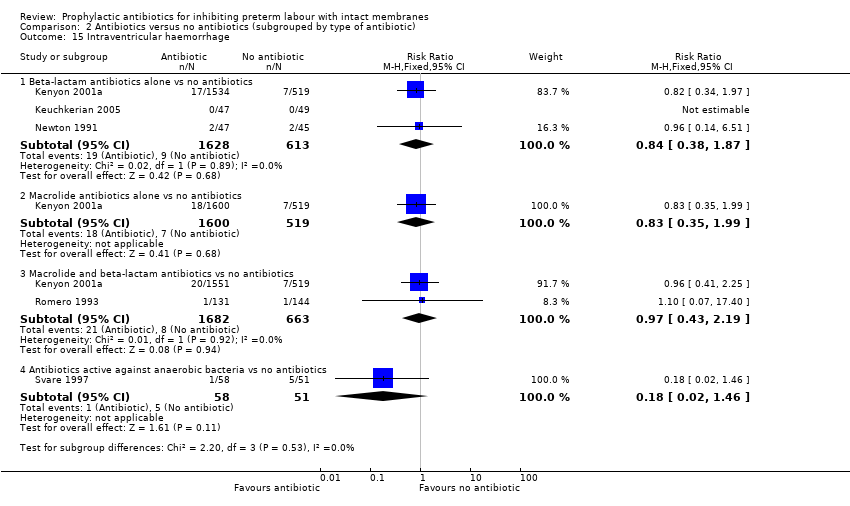 Comparison 2 Antibiotics versus no antibiotics (subgrouped by type of antibiotic), Outcome 15 Intraventricular haemorrhage. | ||||
| 15.1 Beta‐lactam antibiotics alone vs no antibiotics | 3 | 2241 | Risk Ratio (M‐H, Fixed, 95% CI) | 0.84 [0.38, 1.87] |
| 15.2 Macrolide antibiotics alone vs no antibiotics | 1 | 2119 | Risk Ratio (M‐H, Fixed, 95% CI) | 0.83 [0.35, 1.99] |
| 15.3 Macrolide and beta‐lactam antibiotics vs no antibiotics | 2 | 2345 | Risk Ratio (M‐H, Fixed, 95% CI) | 0.97 [0.43, 2.19] |
| 15.4 Antibiotics active against anaerobic bacteria vs no antibiotics | 1 | 109 | Risk Ratio (M‐H, Fixed, 95% CI) | 0.18 [0.02, 1.46] |
| Outcome or subgroup title | No. of studies | No. of participants | Statistical method | Effect size |
| 1 Perinatal mortality Show forest plot | 4 | 6740 | Risk Ratio (M‐H, Fixed, 95% CI) | 1.20 [0.89, 1.60] |
| Analysis 3.1 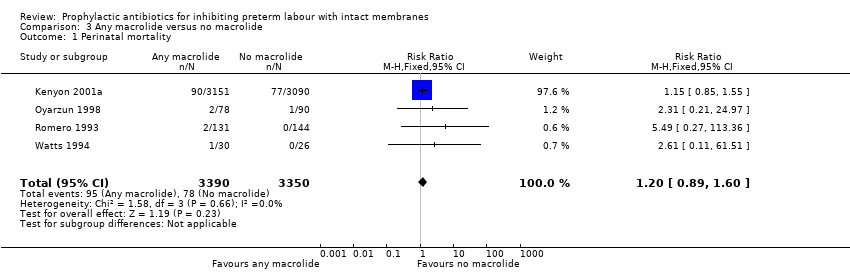 Comparison 3 Any macrolide versus no macrolide, Outcome 1 Perinatal mortality. | ||||
| 2 Stillbirth Show forest plot | 2 | 6518 | Risk Ratio (M‐H, Fixed, 95% CI) | 0.70 [0.41, 1.20] |
| Analysis 3.2 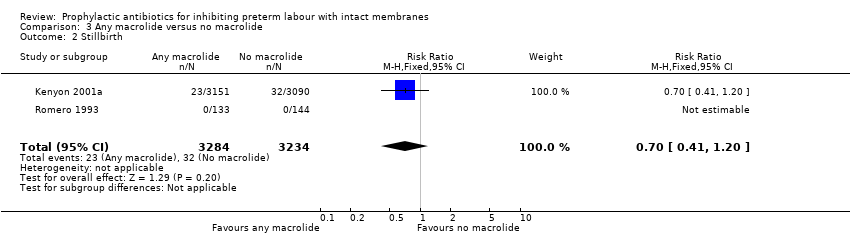 Comparison 3 Any macrolide versus no macrolide, Outcome 2 Stillbirth. | ||||
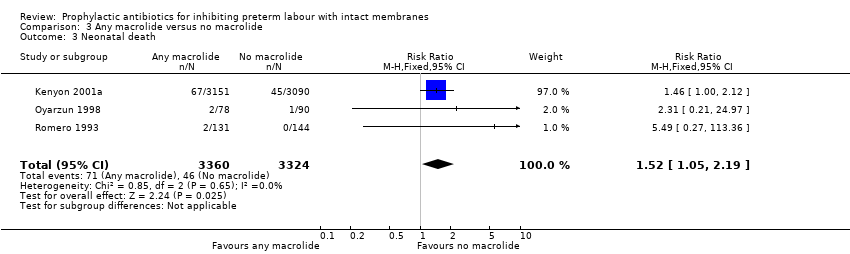
| 3 Neonatal death Show forest plot | 3 | 6684 | Risk Ratio (M‐H, Fixed, 95% CI) | 1.52 [1.05, 2.19] |
| Analysis 3.3  Comparison 3 Any macrolide versus no macrolide, Outcome 3 Neonatal death. | ||||
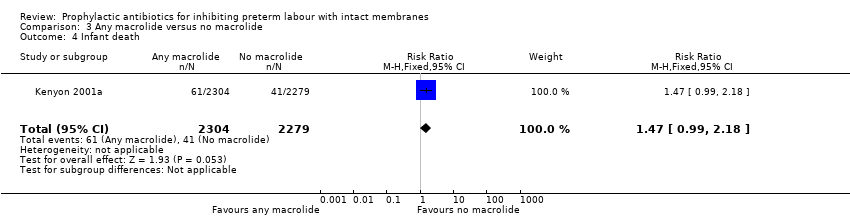
| 4 Infant death Show forest plot | 1 | 4583 | Risk Ratio (M‐H, Fixed, 95% CI) | 1.47 [0.99, 2.18] |
| Analysis 3.4  Comparison 3 Any macrolide versus no macrolide, Outcome 4 Infant death. | ||||
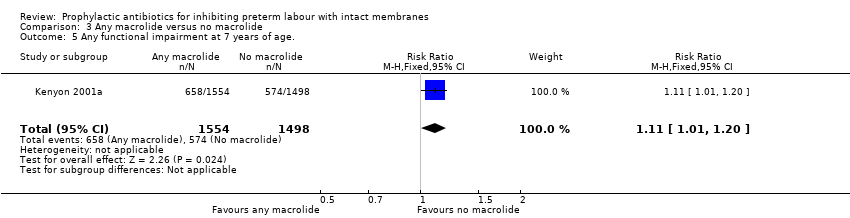
| 5 Any functional impairment at 7 years of age. Show forest plot | 1 | 3052 | Risk Ratio (M‐H, Fixed, 95% CI) | 1.11 [1.01, 1.20] |
| Analysis 3.5  Comparison 3 Any macrolide versus no macrolide, Outcome 5 Any functional impairment at 7 years of age.. | ||||
| 6 Moderate/severe functional impairment at 7 years of age. Show forest plot | 1 | 3052 | Risk Ratio (M‐H, Fixed, 95% CI) | 1.08 [0.93, 1.26] |
| Analysis 3.6 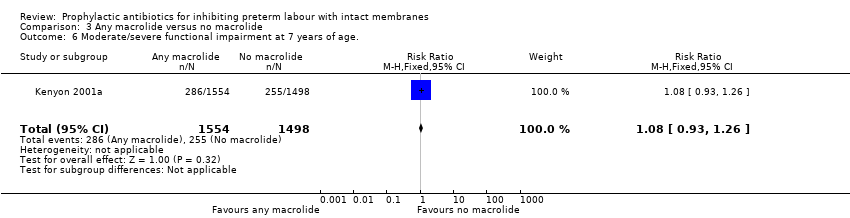 Comparison 3 Any macrolide versus no macrolide, Outcome 6 Moderate/severe functional impairment at 7 years of age.. | ||||
| 7 Cerebral palsy at 7 years Show forest plot | 1 | 3173 | Risk Ratio (M‐H, Fixed, 95% CI) | 1.90 [1.20, 3.01] |
| Analysis 3.7  Comparison 3 Any macrolide versus no macrolide, Outcome 7 Cerebral palsy at 7 years. | ||||
| 8 Maternal adverse drug reaction requiring cessation of treatment Show forest plot | 2 | 331 | Risk Ratio (M‐H, Fixed, 95% CI) | 1.49 [0.93, 2.40] |
| Analysis 3.8 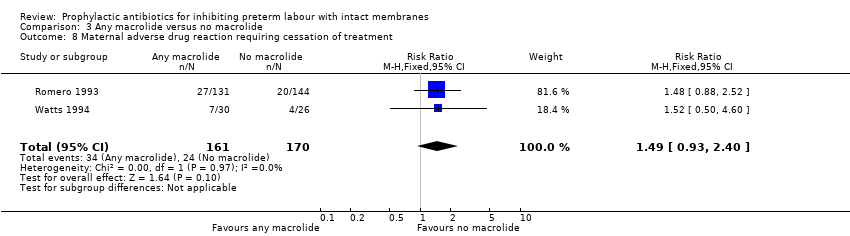 Comparison 3 Any macrolide versus no macrolide, Outcome 8 Maternal adverse drug reaction requiring cessation of treatment. | ||||
| 9 Maternal infection Show forest plot | 4 | 6745 | Risk Ratio (M‐H, Random, 95% CI) | 0.66 [0.41, 1.07] |
| Analysis 3.9  Comparison 3 Any macrolide versus no macrolide, Outcome 9 Maternal infection. | ||||
| 10 Birth within 48 hours of randomisation Show forest plot | 3 | 6691 | Risk Ratio (M‐H, Fixed, 95% CI) | 1.08 [0.94, 1.25] |
| Analysis 3.10  Comparison 3 Any macrolide versus no macrolide, Outcome 10 Birth within 48 hours of randomisation. | ||||
| 11 Interval between randomisation and birth (days) Show forest plot | 3 | 6386 | Mean Difference (IV, Random, 95% CI) | 1.07 [‐3.58, 5.72] |
| Analysis 3.11 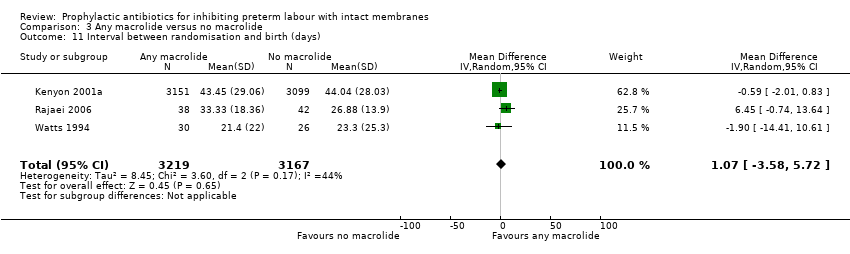 Comparison 3 Any macrolide versus no macrolide, Outcome 11 Interval between randomisation and birth (days). | ||||
| 12 Preterm birth (< 36 or < 37 weeks) Show forest plot | 4 | 6784 | Risk Ratio (M‐H, Fixed, 95% CI) | 1.01 [0.95, 1.07] |
| Analysis 3.12 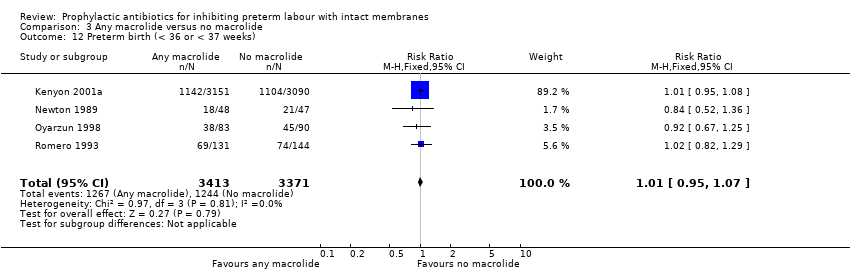 Comparison 3 Any macrolide versus no macrolide, Outcome 12 Preterm birth (< 36 or < 37 weeks). | ||||
| 13 Respiratory distress syndrome Show forest plot | 4 | 6740 | Risk Ratio (M‐H, Fixed, 95% CI) | 1.04 [0.90, 1.21] |
| Analysis 3.13  Comparison 3 Any macrolide versus no macrolide, Outcome 13 Respiratory distress syndrome. | ||||
| 14 Intraventricular haemorrhage Show forest plot | 2 | 6516 | Risk Ratio (M‐H, Fixed, 95% CI) | 0.96 [0.62, 1.49] |
| Analysis 3.14  Comparison 3 Any macrolide versus no macrolide, Outcome 14 Intraventricular haemorrhage. | ||||
| 15 Necrotising enterocolitis Show forest plot | 2 | 6516 | Risk Ratio (M‐H, Fixed, 95% CI) | 1.16 [0.74, 1.80] |
| Analysis 3.15 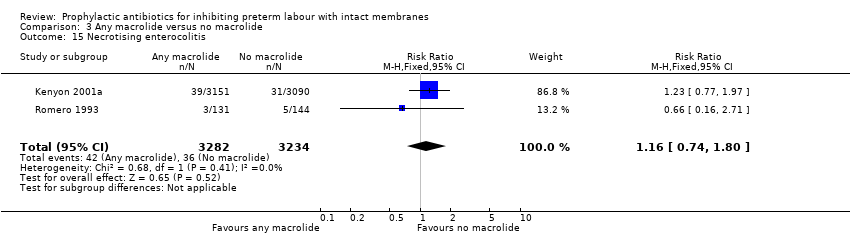 Comparison 3 Any macrolide versus no macrolide, Outcome 15 Necrotising enterocolitis. | ||||
| Outcome or subgroup title | No. of studies | No. of participants | Statistical method | Effect size |
| 1 Perinatal mortality Show forest plot | 8 | 7109 | Risk Ratio (M‐H, Fixed, 95% CI) | 1.12 [0.84, 1.48] |
| Analysis 4.1  Comparison 4 Any beta‐lactam versus no beta‐lactam, Outcome 1 Perinatal mortality. | ||||
| 2 Stillbirth Show forest plot | 6 | 6887 | Risk Ratio (M‐H, Fixed, 95% CI) | 1.10 [0.76, 1.58] |
| Analysis 4.2  Comparison 4 Any beta‐lactam versus no beta‐lactam, Outcome 2 Stillbirth. | ||||
| 3 Neonatal death Show forest plot | 7 | 7053 | Risk Ratio (M‐H, Fixed, 95% CI) | 1.51 [1.06, 2.15] |
| Analysis 4.3 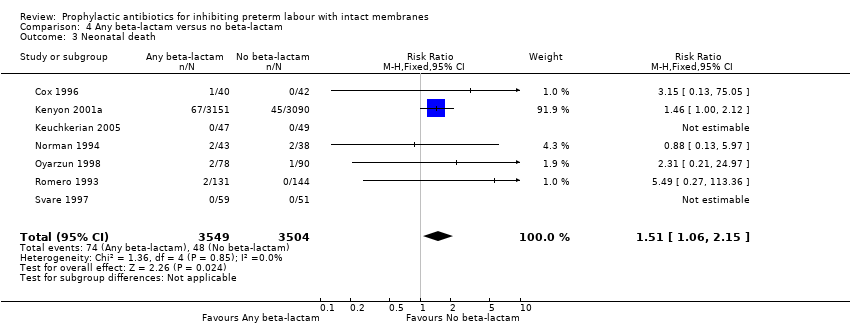 Comparison 4 Any beta‐lactam versus no beta‐lactam, Outcome 3 Neonatal death. | ||||
| 4 Infant death Show forest plot | 1 | 4654 | Risk Ratio (M‐H, Fixed, 95% CI) | 0.94 [0.64, 1.38] |
| Analysis 4.4 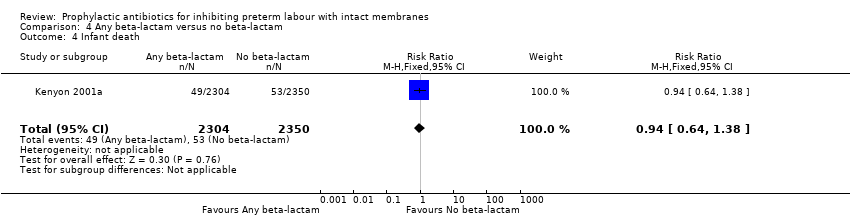 Comparison 4 Any beta‐lactam versus no beta‐lactam, Outcome 4 Infant death. | ||||
| 5 Any functional impairment at 7 years of age. Show forest plot | 1 | 3052 | Risk Ratio (M‐H, Fixed, 95% CI) | 1.02 [0.93, 1.11] |
| Analysis 4.5  Comparison 4 Any beta‐lactam versus no beta‐lactam, Outcome 5 Any functional impairment at 7 years of age.. | ||||
| 6 Moderate/severe functional impairment at 7 years of age. Show forest plot | 1 | 3052 | Risk Ratio (M‐H, Fixed, 95% CI) | 1.03 [0.88, 1.20] |
| Analysis 4.6  Comparison 4 Any beta‐lactam versus no beta‐lactam, Outcome 6 Moderate/severe functional impairment at 7 years of age.. | ||||
| 7 Cerebral palsy at 7 years Show forest plot | 1 | 3173 | Risk Ratio (M‐H, Fixed, 95% CI) | 1.67 [1.06, 2.61] |
| Analysis 4.7  Comparison 4 Any beta‐lactam versus no beta‐lactam, Outcome 7 Cerebral palsy at 7 years. | ||||
| 8 Maternal adverse drug reaction requiring cessation of treatment Show forest plot | 4 | 523 | Risk Ratio (M‐H, Fixed, 95% CI) | 1.61 [1.02, 2.54] |
| Analysis 4.8 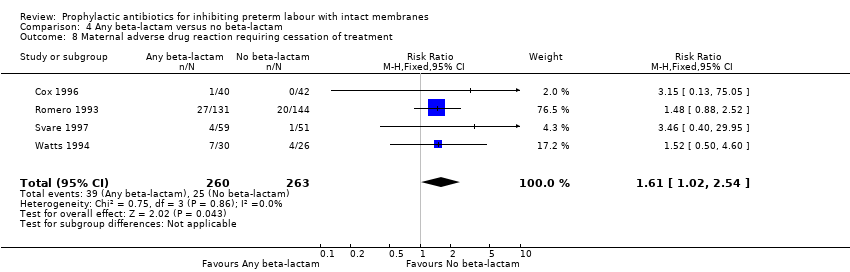 Comparison 4 Any beta‐lactam versus no beta‐lactam, Outcome 8 Maternal adverse drug reaction requiring cessation of treatment. | ||||
| 9 Maternal infection Show forest plot | 8 | 7182 | Risk Ratio (M‐H, Fixed, 95% CI) | 0.80 [0.69, 0.92] |
| Analysis 4.9  Comparison 4 Any beta‐lactam versus no beta‐lactam, Outcome 9 Maternal infection. | ||||
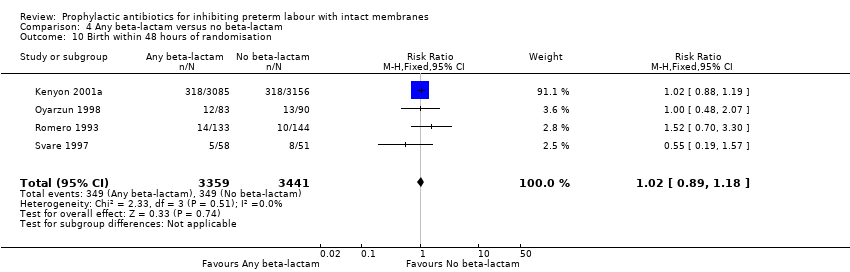
| 10 Birth within 48 hours of randomisation Show forest plot | 4 | 6800 | Risk Ratio (M‐H, Fixed, 95% CI) | 1.02 [0.89, 1.18] |
| Analysis 4.10  Comparison 4 Any beta‐lactam versus no beta‐lactam, Outcome 10 Birth within 48 hours of randomisation. | ||||
| 11 Interval between randomisation and birth (days) Show forest plot | 3 | 6386 | Mean Difference (IV, Random, 95% CI) | 3.92 [‐5.08, 12.92] |
| Analysis 4.11 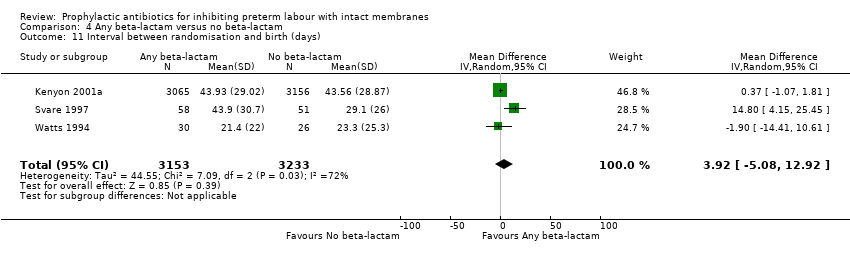 Comparison 4 Any beta‐lactam versus no beta‐lactam, Outcome 11 Interval between randomisation and birth (days). | ||||
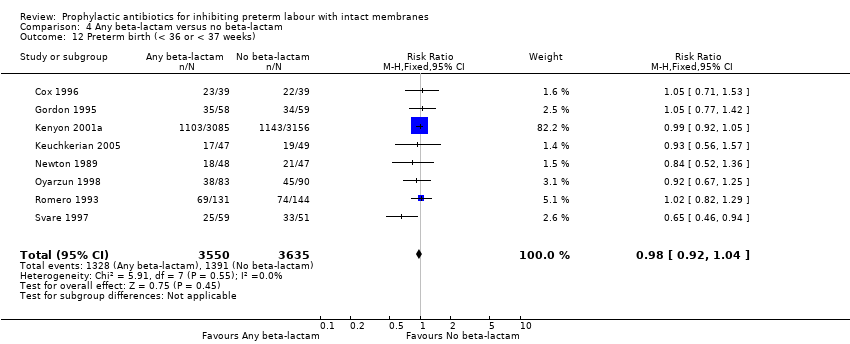
| 12 Preterm birth (< 36 or < 37 weeks) Show forest plot | 8 | 7185 | Risk Ratio (M‐H, Fixed, 95% CI) | 0.98 [0.92, 1.04] |
| Analysis 4.12  Comparison 4 Any beta‐lactam versus no beta‐lactam, Outcome 12 Preterm birth (< 36 or < 37 weeks). | ||||
| 13 Respiratory distress syndrome Show forest plot | 8 | 7108 | Risk Ratio (M‐H, Fixed, 95% CI) | 1.02 [0.88, 1.19] |
| Analysis 4.13  Comparison 4 Any beta‐lactam versus no beta‐lactam, Outcome 13 Respiratory distress syndrome. | ||||
| 14 Intraventricular haemorrhage Show forest plot | 4 | 6721 | Risk Ratio (M‐H, Fixed, 95% CI) | 0.86 [0.56, 1.31] |
| Analysis 4.14 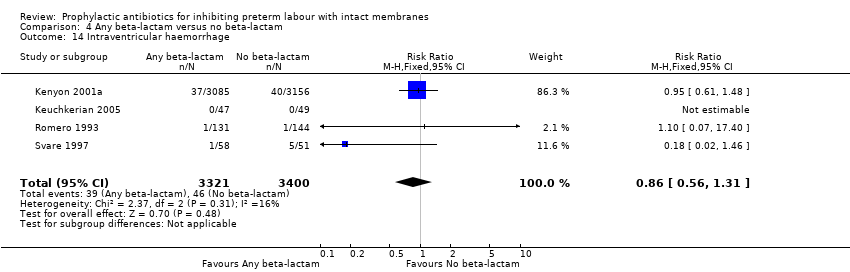 Comparison 4 Any beta‐lactam versus no beta‐lactam, Outcome 14 Intraventricular haemorrhage. | ||||
| 15 Necrotising enterocolitis Show forest plot | 5 | 6788 | Risk Ratio (M‐H, Random, 95% CI) | 0.72 [0.27, 1.92] |
| Analysis 4.15  Comparison 4 Any beta‐lactam versus no beta‐lactam, Outcome 15 Necrotising enterocolitis. | ||||

'Risk of bias' graph: review authors' judgements about each risk of bias item presented as percentages across all included studies.
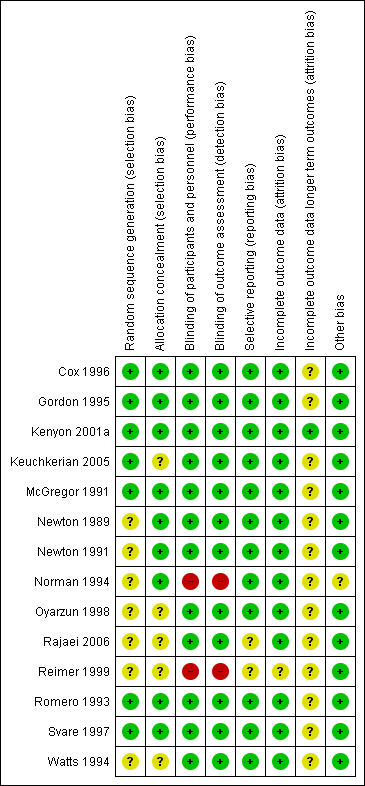
'Risk of bias' summary: review authors' judgements about each risk of bias item for each included study.
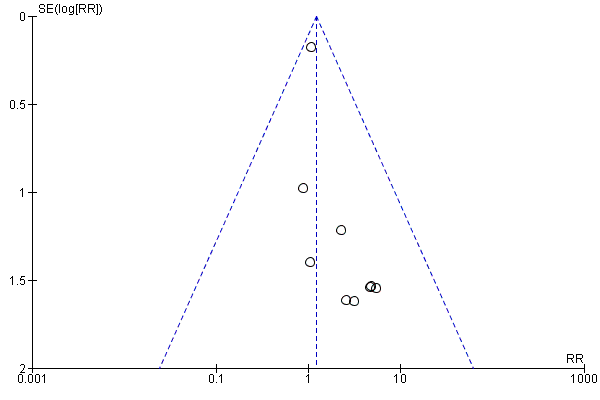
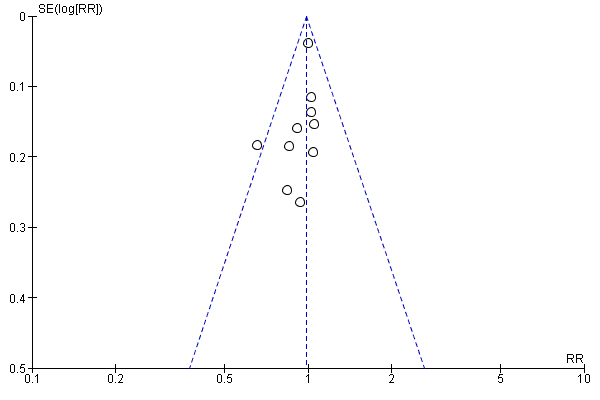
Funnel plot of comparison: 1 Any antibiotics versus no antibiotics, outcome: 1.1 Perinatal mortality.
Funnel plot of comparison: 1 Any antibiotics versus no antibiotics, outcome: 1.12 Preterm birth (< 36 or < 37 weeks).
Funnel plot of comparison: 1 Any antibiotics versus no antibiotics, outcome: 1.20 Neonatal sepsis.

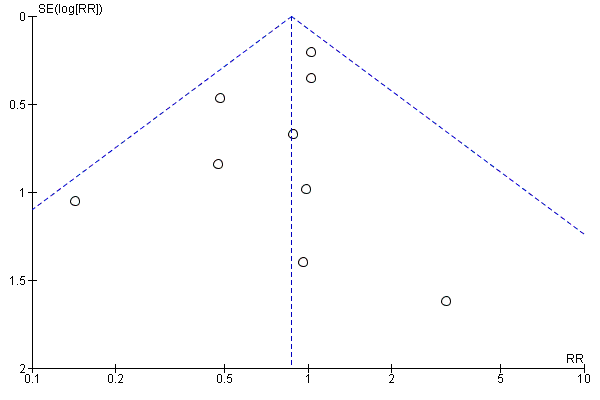
Funnel plot of comparison: 1 Any antibiotics versus no antibiotics, outcome: 1.9 Maternal infection.

Comparison 1 Any antibiotics versus no antibiotics, Outcome 1 Perinatal mortality.
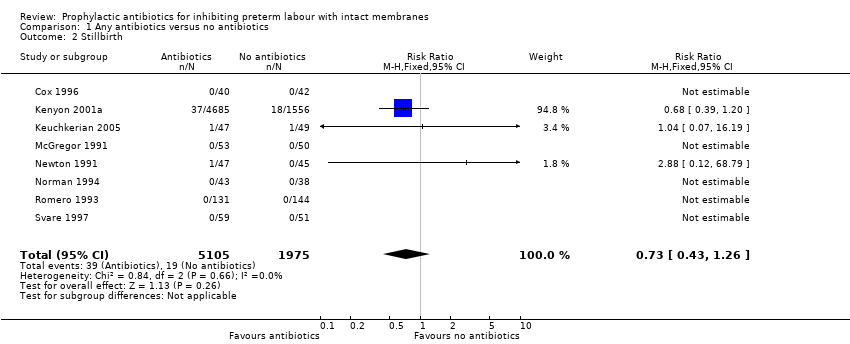
Comparison 1 Any antibiotics versus no antibiotics, Outcome 2 Stillbirth.
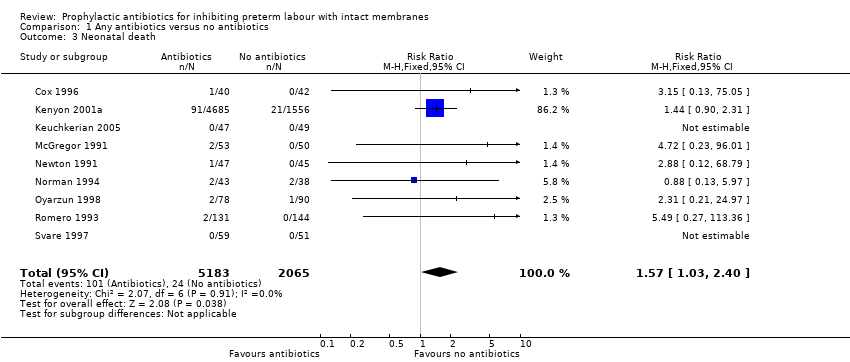
Comparison 1 Any antibiotics versus no antibiotics, Outcome 3 Neonatal death.
Comparison 1 Any antibiotics versus no antibiotics, Outcome 4 Infant death.

Comparison 1 Any antibiotics versus no antibiotics, Outcome 5 Any functional impairment at 7 years of age..

Comparison 1 Any antibiotics versus no antibiotics, Outcome 6 Moderate/severe functional impairment at 7 years of age..

Comparison 1 Any antibiotics versus no antibiotics, Outcome 7 Cerebral palsy at 7 years.
Comparison 1 Any antibiotics versus no antibiotics, Outcome 8 Maternal adverse drug reaction requiring cessation of treatment.

Comparison 1 Any antibiotics versus no antibiotics, Outcome 9 Maternal infection.

Comparison 1 Any antibiotics versus no antibiotics, Outcome 10 Delay in birth (subgrouped by interval).
Comparison 1 Any antibiotics versus no antibiotics, Outcome 11 Interval between randomisation and birth (days).

Comparison 1 Any antibiotics versus no antibiotics, Outcome 12 Preterm birth (< 36 or < 37 weeks).
Comparison 1 Any antibiotics versus no antibiotics, Outcome 13 Gestational age at birth.

Comparison 1 Any antibiotics versus no antibiotics, Outcome 14 Birthweight.

Comparison 1 Any antibiotics versus no antibiotics, Outcome 15 Birthweight < 2500 g.
Comparison 1 Any antibiotics versus no antibiotics, Outcome 16 Admission to neonatal intensive or special care nursery.
Comparison 1 Any antibiotics versus no antibiotics, Outcome 17 Neonatal mechanical ventilation.

Comparison 1 Any antibiotics versus no antibiotics, Outcome 18 Respiratory distress syndrome.
Comparison 1 Any antibiotics versus no antibiotics, Outcome 19 Neonatal positive blood culture.

Comparison 1 Any antibiotics versus no antibiotics, Outcome 20 Neonatal sepsis.
Comparison 1 Any antibiotics versus no antibiotics, Outcome 21 Intraventricular haemorrhage.
Comparison 1 Any antibiotics versus no antibiotics, Outcome 22 Necrotising enterocolitis.

Comparison 1 Any antibiotics versus no antibiotics, Outcome 23 Major cerebral abnormality.
Comparison 1 Any antibiotics versus no antibiotics, Outcome 24 Chronic neonatal lung disease.

Comparison 2 Antibiotics versus no antibiotics (subgrouped by type of antibiotic), Outcome 1 Perinatal mortality.
Comparison 2 Antibiotics versus no antibiotics (subgrouped by type of antibiotic), Outcome 2 Stillbirth.

Comparison 2 Antibiotics versus no antibiotics (subgrouped by type of antibiotic), Outcome 3 Neonatal death.

Comparison 2 Antibiotics versus no antibiotics (subgrouped by type of antibiotic), Outcome 4 Infant death.

Comparison 2 Antibiotics versus no antibiotics (subgrouped by type of antibiotic), Outcome 5 Any functional impairment at 7 years of age..
Comparison 2 Antibiotics versus no antibiotics (subgrouped by type of antibiotic), Outcome 6 Moderate/severe functional impairment at 7 years of age..

Comparison 2 Antibiotics versus no antibiotics (subgrouped by type of antibiotic), Outcome 7 Cerebral palsy at 7 years of age.

Comparison 2 Antibiotics versus no antibiotics (subgrouped by type of antibiotic), Outcome 8 Maternal adverse drug reaction requiring cessation of treatment.

Comparison 2 Antibiotics versus no antibiotics (subgrouped by type of antibiotic), Outcome 9 Maternal infection.

Comparison 2 Antibiotics versus no antibiotics (subgrouped by type of antibiotic), Outcome 10 Birth within 48 hours of randomisation.

Comparison 2 Antibiotics versus no antibiotics (subgrouped by type of antibiotic), Outcome 11 Interval between randomisation and birth (days).

Comparison 2 Antibiotics versus no antibiotics (subgrouped by type of antibiotic), Outcome 12 Preterm birth (< 36 or < 37 weeks' gestation).

Comparison 2 Antibiotics versus no antibiotics (subgrouped by type of antibiotic), Outcome 13 Respiratory distress syndrome.
Comparison 2 Antibiotics versus no antibiotics (subgrouped by type of antibiotic), Outcome 14 Necrotising enterocolitis.

Comparison 2 Antibiotics versus no antibiotics (subgrouped by type of antibiotic), Outcome 15 Intraventricular haemorrhage.

Comparison 3 Any macrolide versus no macrolide, Outcome 1 Perinatal mortality.

Comparison 3 Any macrolide versus no macrolide, Outcome 2 Stillbirth.
Comparison 3 Any macrolide versus no macrolide, Outcome 3 Neonatal death.
Comparison 3 Any macrolide versus no macrolide, Outcome 4 Infant death.
Comparison 3 Any macrolide versus no macrolide, Outcome 5 Any functional impairment at 7 years of age..

Comparison 3 Any macrolide versus no macrolide, Outcome 6 Moderate/severe functional impairment at 7 years of age..
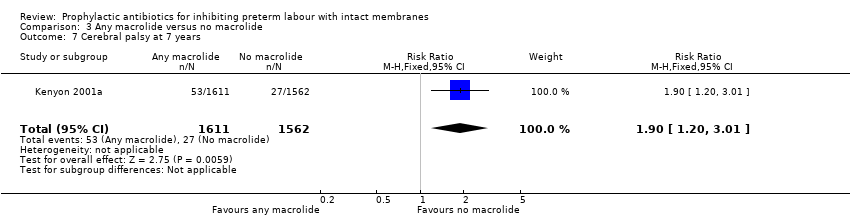
Comparison 3 Any macrolide versus no macrolide, Outcome 7 Cerebral palsy at 7 years.

Comparison 3 Any macrolide versus no macrolide, Outcome 8 Maternal adverse drug reaction requiring cessation of treatment.

Comparison 3 Any macrolide versus no macrolide, Outcome 9 Maternal infection.

Comparison 3 Any macrolide versus no macrolide, Outcome 10 Birth within 48 hours of randomisation.

Comparison 3 Any macrolide versus no macrolide, Outcome 11 Interval between randomisation and birth (days).

Comparison 3 Any macrolide versus no macrolide, Outcome 12 Preterm birth (< 36 or < 37 weeks).

Comparison 3 Any macrolide versus no macrolide, Outcome 13 Respiratory distress syndrome.
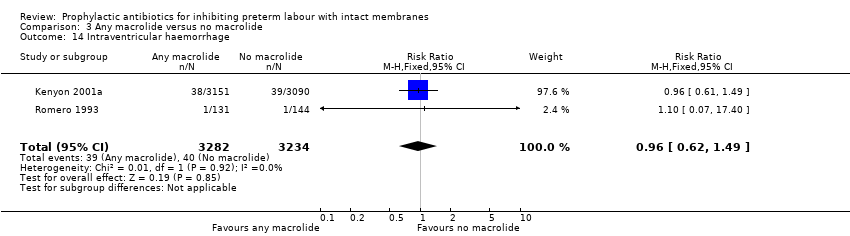
Comparison 3 Any macrolide versus no macrolide, Outcome 14 Intraventricular haemorrhage.

Comparison 3 Any macrolide versus no macrolide, Outcome 15 Necrotising enterocolitis.
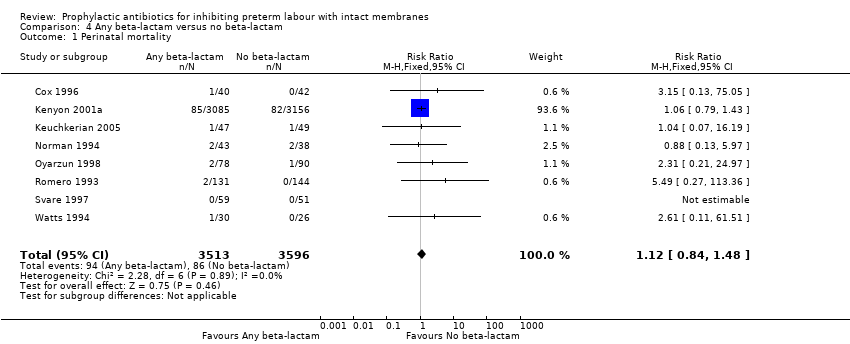
Comparison 4 Any beta‐lactam versus no beta‐lactam, Outcome 1 Perinatal mortality.

Comparison 4 Any beta‐lactam versus no beta‐lactam, Outcome 2 Stillbirth.

Comparison 4 Any beta‐lactam versus no beta‐lactam, Outcome 3 Neonatal death.

Comparison 4 Any beta‐lactam versus no beta‐lactam, Outcome 4 Infant death.
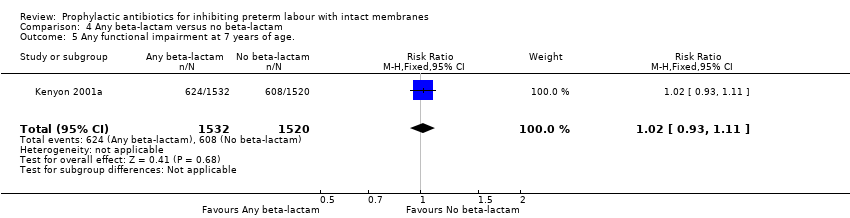
Comparison 4 Any beta‐lactam versus no beta‐lactam, Outcome 5 Any functional impairment at 7 years of age..
Comparison 4 Any beta‐lactam versus no beta‐lactam, Outcome 6 Moderate/severe functional impairment at 7 years of age..

Comparison 4 Any beta‐lactam versus no beta‐lactam, Outcome 7 Cerebral palsy at 7 years.

Comparison 4 Any beta‐lactam versus no beta‐lactam, Outcome 8 Maternal adverse drug reaction requiring cessation of treatment.

Comparison 4 Any beta‐lactam versus no beta‐lactam, Outcome 9 Maternal infection.
Comparison 4 Any beta‐lactam versus no beta‐lactam, Outcome 10 Birth within 48 hours of randomisation.

Comparison 4 Any beta‐lactam versus no beta‐lactam, Outcome 11 Interval between randomisation and birth (days).
Comparison 4 Any beta‐lactam versus no beta‐lactam, Outcome 12 Preterm birth (< 36 or < 37 weeks).

Comparison 4 Any beta‐lactam versus no beta‐lactam, Outcome 13 Respiratory distress syndrome.

Comparison 4 Any beta‐lactam versus no beta‐lactam, Outcome 14 Intraventricular haemorrhage.

Comparison 4 Any beta‐lactam versus no beta‐lactam, Outcome 15 Necrotising enterocolitis.
| Outcome or subgroup title | No. of studies | No. of participants | Statistical method | Effect size |
| 1 Perinatal mortality Show forest plot | 10 | 7304 | Risk Ratio (M‐H, Fixed, 95% CI) | 1.22 [0.88, 1.69] |
| 2 Stillbirth Show forest plot | 8 | 7080 | Risk Ratio (M‐H, Fixed, 95% CI) | 0.73 [0.43, 1.26] |
| 3 Neonatal death Show forest plot | 9 | 7248 | Risk Ratio (M‐H, Fixed, 95% CI) | 1.57 [1.03, 2.40] |
| 4 Infant death Show forest plot | 1 | 4654 | Risk Ratio (M‐H, Fixed, 95% CI) | 1.06 [0.68, 1.67] |
| 5 Any functional impairment at 7 years of age. Show forest plot | 1 | 3052 | Risk Ratio (M‐H, Fixed, 95% CI) | 1.10 [0.99, 1.23] |
| 6 Moderate/severe functional impairment at 7 years of age. Show forest plot | 1 | 3052 | Risk Ratio (M‐H, Fixed, 95% CI) | 1.07 [0.89, 1.28] |
| 7 Cerebral palsy at 7 years Show forest plot | 1 | 3173 | Risk Ratio (M‐H, Fixed, 95% CI) | 1.82 [0.99, 3.34] |
| 8 Maternal adverse drug reaction requiring cessation of treatment Show forest plot | 5 | 626 | Risk Ratio (M‐H, Fixed, 95% CI) | 1.32 [0.92, 1.89] |
| 9 Maternal infection Show forest plot | 10 | 7371 | Risk Ratio (M‐H, Fixed, 95% CI) | 0.74 [0.63, 0.86] |
| 10 Delay in birth (subgrouped by interval) Show forest plot | 9 | Risk Ratio (M‐H, Fixed, 95% CI) | Subtotals only | |
| 10.1 Birth within 48 hours | 4 | 6800 | Risk Ratio (M‐H, Fixed, 95% CI) | 1.04 [0.89, 1.23] |
| 10.2 Birth within 7 days | 8 | 7053 | Risk Ratio (M‐H, Fixed, 95% CI) | 0.98 [0.87, 1.10] |
| 11 Interval between randomisation and birth (days) Show forest plot | 6 | 2499 | Mean Difference (IV, Random, 95% CI) | 5.59 [0.31, 10.87] |
| 12 Preterm birth (< 36 or < 37 weeks) Show forest plot | 10 | 7387 | Risk Ratio (M‐H, Fixed, 95% CI) | 0.98 [0.92, 1.05] |
| 13 Gestational age at birth Show forest plot | 10 | 986 | Mean Difference (IV, Random, 95% CI) | 0.53 [0.00, 1.06] |
| 14 Birthweight Show forest plot | 12 | 7531 | Mean Difference (IV, Random, 95% CI) | 58.38 [‐26.24, 143.00] |
| 15 Birthweight < 2500 g Show forest plot | 5 | 6628 | Risk Ratio (M‐H, Random, 95% CI) | 0.97 [0.81, 1.15] |
| 16 Admission to neonatal intensive or special care nursery Show forest plot | 5 | 6875 | Risk Ratio (M‐H, Random, 95% CI) | 0.82 [0.62, 1.10] |
| 17 Neonatal mechanical ventilation Show forest plot | 1 | 6241 | Risk Ratio (M‐H, Fixed, 95% CI) | 1.02 [0.84, 1.24] |
| 18 Respiratory distress syndrome Show forest plot | 9 | 7200 | Risk Ratio (M‐H, Fixed, 95% CI) | 0.99 [0.84, 1.16] |
| 19 Neonatal positive blood culture Show forest plot | 3 | 6526 | Risk Ratio (M‐H, Fixed, 95% CI) | 1.01 [0.69, 1.49] |
| 20 Neonatal sepsis Show forest plot | 10 | 7386 | Risk Ratio (M‐H, Fixed, 95% CI) | 0.86 [0.64, 1.16] |
| 21 Intraventricular haemorrhage Show forest plot | 5 | 6813 | Risk Ratio (M‐H, Fixed, 95% CI) | 0.76 [0.48, 1.19] |
| 22 Necrotising enterocolitis Show forest plot | 6 | 6880 | Risk Ratio (M‐H, Fixed, 95% CI) | 1.06 [0.64, 1.73] |
| 23 Major cerebral abnormality Show forest plot | 1 | 6241 | Risk Ratio (M‐H, Fixed, 95% CI) | 1.00 [0.66, 1.51] |
| 24 Chronic neonatal lung disease Show forest plot | 1 | 6241 | Risk Ratio (M‐H, Fixed, 95% CI) | 1.17 [0.78, 1.76] |
| Outcome or subgroup title | No. of studies | No. of participants | Statistical method | Effect size |
| 1 Perinatal mortality Show forest plot | 10 | Risk Ratio (M‐H, Fixed, 95% CI) | Subtotals only | |
| 1.1 Beta‐lactam antibiotics alone vs no antibiotics | 4 | 2323 | Risk Ratio (M‐H, Fixed, 95% CI) | 1.13 [0.64, 2.01] |
| 1.2 Macrolide antibiotics alone vs no antibiotics | 2 | 2222 | Risk Ratio (M‐H, Fixed, 95% CI) | 1.17 [0.64, 2.11] |
| 1.3 Macrolide and beta‐lactam antibiotics vs no antibiotics | 4 | 2569 | Risk Ratio (M‐H, Fixed, 95% CI) | 1.39 [0.79, 2.43] |
| 1.4 Antibiotics active against anaerobic bacteria vs no antibiotics | 3 | 294 | Risk Ratio (M‐H, Fixed, 95% CI) | 1.63 [0.36, 7.39] |
| 2 Stillbirth Show forest plot | 8 | Risk Ratio (M‐H, Fixed, 95% CI) | Subtotals only | |
| 2.1 Beta‐lactam antibiotics alone vs no antibiotics | 4 | 2323 | Risk Ratio (M‐H, Fixed, 95% CI) | 0.91 [0.39, 2.14] |
| 2.2 Macrolide antibiotics alone vs no antibiotics | 2 | 2222 | Risk Ratio (M‐H, Fixed, 95% CI) | 0.54 [0.20, 1.48] |
| 2.3 Macrolide and beta‐lactam antibiotics vs no antibiotics | 2 | 2347 | Risk Ratio (M‐H, Fixed, 95% CI) | 0.73 [0.28, 1.90] |
| 2.4 Antibiotics active against anaerobic bacteria vs no bacteria | 3 | 294 | Risk Ratio (M‐H, Fixed, 95% CI) | 0.0 [0.0, 0.0] |
| 3 Neonatal death Show forest plot | 9 | Risk Ratio (M‐H, Fixed, 95% CI) | Subtotals only | |
| 3.1 Beta‐lactam antibiotics alone vs no antibiotics | 4 | 2323 | Risk Ratio (M‐H, Fixed, 95% CI) | 1.32 [0.61, 2.86] |
| 3.2 Macrolide antibiotics alone vs no antibiotics | 2 | 2222 | Risk Ratio (M‐H, Fixed, 95% CI) | 1.68 [0.77, 3.64] |
| 3.3 Macrolide and beta‐lactam antibiotics vs no antibiotics | 3 | 2513 | Risk Ratio (M‐H, Fixed, 95% CI) | 1.83 [0.88, 3.82] |
| 3.4 Antibiotics active against anaerobic bacteria vs no antibiotics | 3 | 294 | Risk Ratio (M‐H, Fixed, 95% CI) | 1.63 [0.36, 7.39] |
| 4 Infant death Show forest plot | 1 | Risk Ratio (M‐H, Fixed, 95% CI) | Subtotals only | |
| 4.1 Beta‐lactam antibiotics alone vs no antibiotics | 1 | 1515 | Risk Ratio (M‐H, Fixed, 95% CI) | 0.72 [0.31, 1.65] |
| 4.2 Macrolide antibiotics alone vs no antibiotics | 1 | 1586 | Risk Ratio (M‐H, Fixed, 95% CI) | 1.15 [0.53, 2.49] |
| 4.3 Macrolide and beta‐lactam antibiotics vs no antibiotics | 1 | 1553 | Risk Ratio (M‐H, Fixed, 95% CI) | 1.30 [0.61, 2.81] |
| 4.4 Antibiotics active against anaerobic bacteria vs no antibiotics | 0 | 0 | Risk Ratio (M‐H, Fixed, 95% CI) | 0.0 [0.0, 0.0] |
| 5 Any functional impairment at 7 years of age. Show forest plot | 1 | Risk Ratio (M‐H, Fixed, 95% CI) | Subtotals only | |
| 5.1 Beta‐lactam antibiotics alone vs no antibiotics | 1 | 1008 | Risk Ratio (M‐H, Fixed, 95% CI) | 1.04 [0.87, 1.25] |
| 5.2 Macrolide antibiotics alone vs no antibiotics | 1 | 1030 | Risk Ratio (M‐H, Fixed, 95% CI) | 1.13 [0.94, 1.35] |
| 5.3 Macrolide and beta‐lactam antibiotics vs no antibiotics | 1 | 1014 | Risk Ratio (M‐H, Fixed, 95% CI) | 1.13 [0.94, 1.35] |
| 5.4 Antibiotics active against anaerobic bacteria vs no antibiotics | 0 | 0 | Risk Ratio (M‐H, Fixed, 95% CI) | 0.0 [0.0, 0.0] |
| 6 Moderate/severe functional impairment at 7 years of age. Show forest plot | 1 | Risk Ratio (M‐H, Fixed, 95% CI) | Subtotals only | |
| 6.1 Beta‐lactam antibiotics alone vs no antibiotics | 1 | 1008 | Risk Ratio (M‐H, Fixed, 95% CI) | 1.03 [0.75, 1.41] |
| 6.2 Macrolide antibiotics alone vs no antibiotics | 1 | 1030 | Risk Ratio (M‐H, Fixed, 95% CI) | 1.08 [0.79, 1.48] |
| 6.3 Macrolide and beta‐lactam antibiotics vs no antibiotics | 1 | 1014 | Risk Ratio (M‐H, Fixed, 95% CI) | 1.12 [0.82, 1.53] |
| 6.4 Antibiotics active against anaerobic bacteria vs no antibiotics | 0 | 0 | Risk Ratio (M‐H, Fixed, 95% CI) | 0.0 [0.0, 0.0] |
| 7 Cerebral palsy at 7 years of age Show forest plot | 1 | Risk Ratio (M‐H, Random, 95% CI) | Subtotals only | |
| 7.1 Beta‐lactam antibiotics alone vs no antibiotics | 1 | 1049 | Risk Ratio (M‐H, Random, 95% CI) | 1.22 [0.41, 3.63] |
| 7.2 Macrolide antibiotics alone vs no antibiotics | 1 | 1073 | Risk Ratio (M‐H, Random, 95% CI) | 1.42 [0.48, 4.15] |
| 7.3 Macrolide and beta‐lactam antibiotics vs no antibiotics | 1 | 1052 | Risk Ratio (M‐H, Random, 95% CI) | 2.83 [1.02, 7.88] |
| 7.4 Antibiotics active against anaerobic bacteria vs no antibiotics | 0 | 0 | Risk Ratio (M‐H, Random, 95% CI) | 0.0 [0.0, 0.0] |
| 8 Maternal adverse drug reaction requiring cessation of treatment Show forest plot | 5 | Risk Ratio (M‐H, Fixed, 95% CI) | Subtotals only | |
| 8.1 Beta‐lactam antibiotics alone vs no antibiotics | 1 | 82 | Risk Ratio (M‐H, Fixed, 95% CI) | 3.15 [0.13, 75.05] |
| 8.2 Macrolide antibiotics alone vs no antibiotics | 1 | 103 | Risk Ratio (M‐H, Fixed, 95% CI) | 0.88 [0.49, 1.59] |
| 8.3 Macrolide and beta‐lactam antibiotics vs no antibiotics | 2 | 331 | Risk Ratio (M‐H, Fixed, 95% CI) | 1.49 [0.93, 2.40] |
| 8.4 Antibiotics active against anaerobic bacteria vs no antibiotics | 2 | 213 | Risk Ratio (M‐H, Fixed, 95% CI) | 1.04 [0.59, 1.83] |
| 9 Maternal infection Show forest plot | 10 | Risk Ratio (M‐H, Random, 95% CI) | Subtotals only | |
| 9.1 Beta‐lactam antibiotics alone vs no antibiotics | 4 | 2385 | Risk Ratio (M‐H, Random, 95% CI) | 0.74 [0.56, 0.97] |
| 9.2 Macrolide antibiotics alone vs no antibiotics | 2 | 2222 | Risk Ratio (M‐H, Random, 95% CI) | 0.82 [0.62, 1.08] |
| 9.3 Macrolide and beta‐lactam antibiotics vs no antibiotics | 4 | 2563 | Risk Ratio (M‐H, Random, 95% CI) | 0.79 [0.64, 0.98] |
| 9.4 Antibiotics active against anaerobic bacteria vs no antibiotics | 3 | 294 | Risk Ratio (M‐H, Random, 95% CI) | 0.66 [0.11, 3.92] |
| 10 Birth within 48 hours of randomisation Show forest plot | 4 | Risk Ratio (M‐H, Fixed, 95% CI) | Subtotals only | |
| 10.1 Beta‐lactam antibiotics alone vs no antibiotics | 1 | 2053 | Risk Ratio (M‐H, Fixed, 95% CI) | 1.01 [0.75, 1.36] |
| 10.2 Macrolide antibiotics alone vs no antibiotics | 1 | 2119 | Risk Ratio (M‐H, Fixed, 95% CI) | 1.06 [0.78, 1.42] |
| 10.3 Macrolide and beta‐lactam antibiotics vs no antibiotics | 3 | 2520 | Risk Ratio (M‐H, Fixed, 95% CI) | 1.12 [0.86, 1.45] |
| 10.4 Antibiotics active against anaerobic bacteria vs no antibiotics | 1 | 109 | Risk Ratio (M‐H, Fixed, 95% CI) | 0.55 [0.19, 1.57] |
| 11 Interval between randomisation and birth (days) Show forest plot | 7 | Mean Difference (IV, Random, 95% CI) | Subtotals only | |
| 11.1 Beta‐lactam antibiotics alone vs no antibiotics | 1 | 2053 | Mean Difference (IV, Random, 95% CI) | ‐0.09 [‐2.96, 2.78] |
| 11.2 Macrolide antibiotics alone vs no antibiotics | 3 | 2302 | Mean Difference (IV, Random, 95% CI) | 4.26 [‐2.88, 11.41] |
| 11.3 Macrolide and beta‐lactam antibiotics vs no antibiotics | 3 | 2221 | Mean Difference (IV, Random, 95% CI) | ‐0.27 [‐2.95, 2.41] |
| 11.4 Antibiotics active against anaerobic bacteria vs no antibiotics | 3 | 293 | Mean Difference (IV, Random, 95% CI) | 10.50 [4.95, 16.06] |
| 12 Preterm birth (< 36 or < 37 weeks' gestation) Show forest plot | 10 | Risk Ratio (M‐H, Random, 95% CI) | Subtotals only | |
| 12.1 Beta‐lactam antibiotics alone vs no antibiotics | 5 | 2430 | Risk Ratio (M‐H, Random, 95% CI) | 0.99 [0.89, 1.10] |
| 12.2 Macrolide antibiotics alone vs no antibiotics | 2 | 2235 | Risk Ratio (M‐H, Random, 95% CI) | 1.02 [0.91, 1.15] |
| 12.3 Macrolide and beta‐lactam antibiotics vs no antibiotics | 4 | 2613 | Risk Ratio (M‐H, Random, 95% CI) | 0.99 [0.89, 1.10] |
| 12.4 Antibiotics active against anaerobic bacteria vs no antibiotics | 2 | 226 | Risk Ratio (M‐H, Random, 95% CI) | 0.83 [0.53, 1.30] |
| 13 Respiratory distress syndrome Show forest plot | 5 | Risk Ratio (M‐H, Fixed, 95% CI) | Subtotals only | |
| 13.1 Beta‐lactam antibiotics alone vs no antibiotics | 3 | 3278 | Risk Ratio (M‐H, Fixed, 95% CI) | 0.93 [0.75, 1.16] |
| 13.2 Macrolide antibiotics alone vs no antibiotics | 1 | 3156 | Risk Ratio (M‐H, Fixed, 95% CI) | 0.94 [0.75, 1.18] |
| 13.3 Macrolide and beta‐lactam antibiotics vs no antibiotics | 2 | 3382 | Risk Ratio (M‐H, Fixed, 95% CI) | 1.04 [0.84, 1.29] |
| 13.4 Antibiotics active against anaerobic bacteria vs no antibiotics | 1 | 109 | Risk Ratio (M‐H, Fixed, 95% CI) | 0.59 [0.10, 3.37] |
| 14 Necrotising enterocolitis Show forest plot | 6 | Risk Ratio (M‐H, Fixed, 95% CI) | Subtotals only | |
| 14.1 Beta‐lactam antibiotics alone vs no antibiotics | 3 | 2227 | Risk Ratio (M‐H, Fixed, 95% CI) | 1.31 [0.52, 3.32] |
| 14.2 Macrolide antibiotics alone vs no antibiotics | 1 | 2119 | Risk Ratio (M‐H, Fixed, 95% CI) | 1.30 [0.44, 3.86] |
| 14.3 Macrolide and beta‐lactam antibiotics vs no antibiotics | 2 | 2345 | Risk Ratio (M‐H, Fixed, 95% CI) | 1.36 [0.60, 3.11] |
| 14.4 Antibiotics active against anaerobic bacteria vs no antibiotics | 2 | 190 | Risk Ratio (M‐H, Fixed, 95% CI) | 0.13 [0.02, 1.01] |
| 15 Intraventricular haemorrhage Show forest plot | 5 | Risk Ratio (M‐H, Fixed, 95% CI) | Subtotals only | |
| 15.1 Beta‐lactam antibiotics alone vs no antibiotics | 3 | 2241 | Risk Ratio (M‐H, Fixed, 95% CI) | 0.84 [0.38, 1.87] |
| 15.2 Macrolide antibiotics alone vs no antibiotics | 1 | 2119 | Risk Ratio (M‐H, Fixed, 95% CI) | 0.83 [0.35, 1.99] |
| 15.3 Macrolide and beta‐lactam antibiotics vs no antibiotics | 2 | 2345 | Risk Ratio (M‐H, Fixed, 95% CI) | 0.97 [0.43, 2.19] |
| 15.4 Antibiotics active against anaerobic bacteria vs no antibiotics | 1 | 109 | Risk Ratio (M‐H, Fixed, 95% CI) | 0.18 [0.02, 1.46] |
| Outcome or subgroup title | No. of studies | No. of participants | Statistical method | Effect size |
| 1 Perinatal mortality Show forest plot | 4 | 6740 | Risk Ratio (M‐H, Fixed, 95% CI) | 1.20 [0.89, 1.60] |
| 2 Stillbirth Show forest plot | 2 | 6518 | Risk Ratio (M‐H, Fixed, 95% CI) | 0.70 [0.41, 1.20] |
| 3 Neonatal death Show forest plot | 3 | 6684 | Risk Ratio (M‐H, Fixed, 95% CI) | 1.52 [1.05, 2.19] |
| 4 Infant death Show forest plot | 1 | 4583 | Risk Ratio (M‐H, Fixed, 95% CI) | 1.47 [0.99, 2.18] |
| 5 Any functional impairment at 7 years of age. Show forest plot | 1 | 3052 | Risk Ratio (M‐H, Fixed, 95% CI) | 1.11 [1.01, 1.20] |
| 6 Moderate/severe functional impairment at 7 years of age. Show forest plot | 1 | 3052 | Risk Ratio (M‐H, Fixed, 95% CI) | 1.08 [0.93, 1.26] |
| 7 Cerebral palsy at 7 years Show forest plot | 1 | 3173 | Risk Ratio (M‐H, Fixed, 95% CI) | 1.90 [1.20, 3.01] |
| 8 Maternal adverse drug reaction requiring cessation of treatment Show forest plot | 2 | 331 | Risk Ratio (M‐H, Fixed, 95% CI) | 1.49 [0.93, 2.40] |
| 9 Maternal infection Show forest plot | 4 | 6745 | Risk Ratio (M‐H, Random, 95% CI) | 0.66 [0.41, 1.07] |
| 10 Birth within 48 hours of randomisation Show forest plot | 3 | 6691 | Risk Ratio (M‐H, Fixed, 95% CI) | 1.08 [0.94, 1.25] |
| 11 Interval between randomisation and birth (days) Show forest plot | 3 | 6386 | Mean Difference (IV, Random, 95% CI) | 1.07 [‐3.58, 5.72] |
| 12 Preterm birth (< 36 or < 37 weeks) Show forest plot | 4 | 6784 | Risk Ratio (M‐H, Fixed, 95% CI) | 1.01 [0.95, 1.07] |
| 13 Respiratory distress syndrome Show forest plot | 4 | 6740 | Risk Ratio (M‐H, Fixed, 95% CI) | 1.04 [0.90, 1.21] |
| 14 Intraventricular haemorrhage Show forest plot | 2 | 6516 | Risk Ratio (M‐H, Fixed, 95% CI) | 0.96 [0.62, 1.49] |
| 15 Necrotising enterocolitis Show forest plot | 2 | 6516 | Risk Ratio (M‐H, Fixed, 95% CI) | 1.16 [0.74, 1.80] |
| Outcome or subgroup title | No. of studies | No. of participants | Statistical method | Effect size |
| 1 Perinatal mortality Show forest plot | 8 | 7109 | Risk Ratio (M‐H, Fixed, 95% CI) | 1.12 [0.84, 1.48] |
| 2 Stillbirth Show forest plot | 6 | 6887 | Risk Ratio (M‐H, Fixed, 95% CI) | 1.10 [0.76, 1.58] |
| 3 Neonatal death Show forest plot | 7 | 7053 | Risk Ratio (M‐H, Fixed, 95% CI) | 1.51 [1.06, 2.15] |
| 4 Infant death Show forest plot | 1 | 4654 | Risk Ratio (M‐H, Fixed, 95% CI) | 0.94 [0.64, 1.38] |
| 5 Any functional impairment at 7 years of age. Show forest plot | 1 | 3052 | Risk Ratio (M‐H, Fixed, 95% CI) | 1.02 [0.93, 1.11] |
| 6 Moderate/severe functional impairment at 7 years of age. Show forest plot | 1 | 3052 | Risk Ratio (M‐H, Fixed, 95% CI) | 1.03 [0.88, 1.20] |
| 7 Cerebral palsy at 7 years Show forest plot | 1 | 3173 | Risk Ratio (M‐H, Fixed, 95% CI) | 1.67 [1.06, 2.61] |
| 8 Maternal adverse drug reaction requiring cessation of treatment Show forest plot | 4 | 523 | Risk Ratio (M‐H, Fixed, 95% CI) | 1.61 [1.02, 2.54] |
| 9 Maternal infection Show forest plot | 8 | 7182 | Risk Ratio (M‐H, Fixed, 95% CI) | 0.80 [0.69, 0.92] |
| 10 Birth within 48 hours of randomisation Show forest plot | 4 | 6800 | Risk Ratio (M‐H, Fixed, 95% CI) | 1.02 [0.89, 1.18] |
| 11 Interval between randomisation and birth (days) Show forest plot | 3 | 6386 | Mean Difference (IV, Random, 95% CI) | 3.92 [‐5.08, 12.92] |
| 12 Preterm birth (< 36 or < 37 weeks) Show forest plot | 8 | 7185 | Risk Ratio (M‐H, Fixed, 95% CI) | 0.98 [0.92, 1.04] |
| 13 Respiratory distress syndrome Show forest plot | 8 | 7108 | Risk Ratio (M‐H, Fixed, 95% CI) | 1.02 [0.88, 1.19] |
| 14 Intraventricular haemorrhage Show forest plot | 4 | 6721 | Risk Ratio (M‐H, Fixed, 95% CI) | 0.86 [0.56, 1.31] |
| 15 Necrotising enterocolitis Show forest plot | 5 | 6788 | Risk Ratio (M‐H, Random, 95% CI) | 0.72 [0.27, 1.92] |