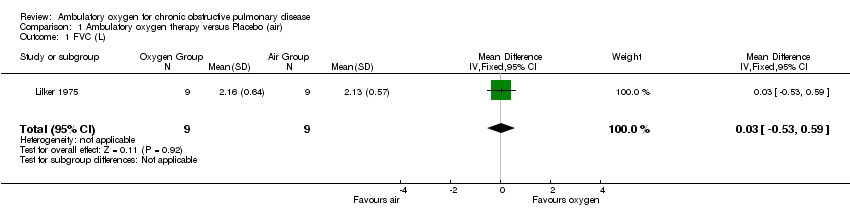
| 1 FVC (L) Show forest plot | 1 | 18 | Mean Difference (IV, Fixed, 95% CI) | 0.03 [‐0.53, 0.59] |
|
| 2 MVV (L/min) Show forest plot | 1 | 18 | Mean Difference (IV, Fixed, 95% CI) | ‐1.0 [‐8.45, 6.45] |
|
| 3 FEV1/FVC (%) Show forest plot | 1 | 18 | Mean Difference (IV, Fixed, 95% CI) | ‐4.0 [‐18.33, 10.33] |
|
| 4 RV (L) Show forest plot | 1 | 18 | Mean Difference (IV, Fixed, 95% CI) | ‐0.22 [‐1.47, 1.03] |
|
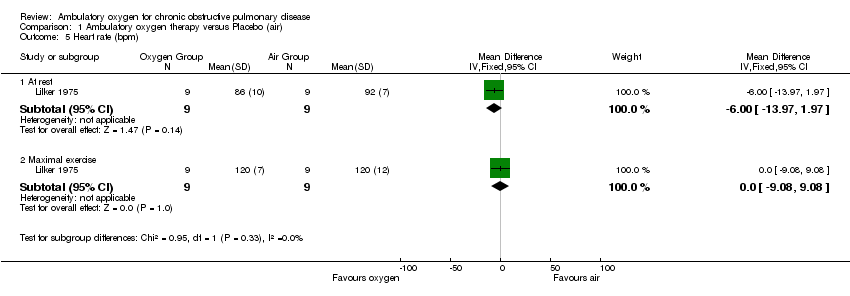
| 5 Heart rate (bpm) Show forest plot | 1 | | Mean Difference (IV, Fixed, 95% CI) | Subtotals only |
|
| 5.1 At rest | 1 | 18 | Mean Difference (IV, Fixed, 95% CI) | ‐6.0 [‐13.97, 1.97] |
| 5.2 Maximal exercise | 1 | 18 | Mean Difference (IV, Fixed, 95% CI) | 0.0 [‐9.08, 9.08] |
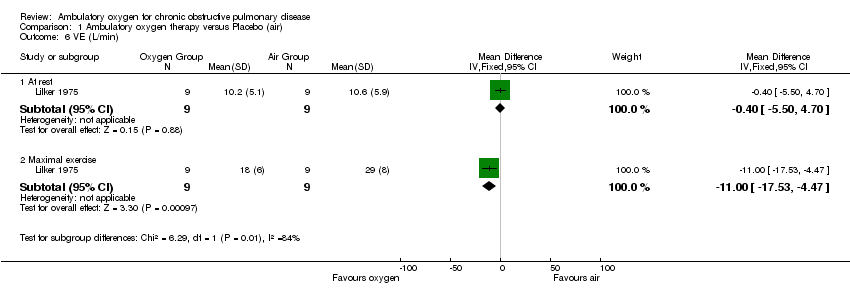
| 6 VE (L/min) Show forest plot | 1 | | Mean Difference (IV, Fixed, 95% CI) | Subtotals only |
|
| 6.1 At rest | 1 | 18 | Mean Difference (IV, Fixed, 95% CI) | ‐0.40 [‐5.50, 4.70] |
| 6.2 Maximal exercise | 1 | 18 | Mean Difference (IV, Fixed, 95% CI) | ‐11.0 [‐17.53, ‐4.47] |
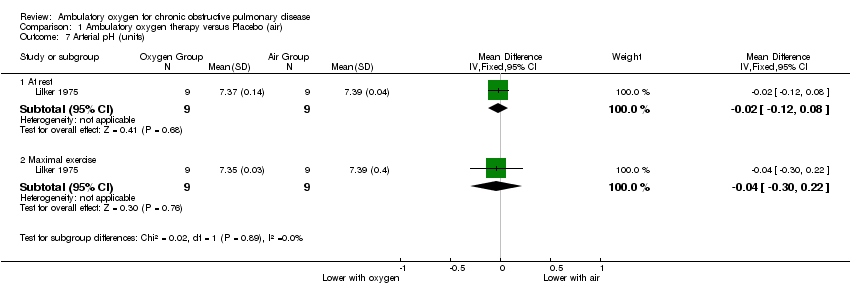
| 7 Arterial pH (units) Show forest plot | 1 | | Mean Difference (IV, Fixed, 95% CI) | Subtotals only |
|
| 7.1 At rest | 1 | 18 | Mean Difference (IV, Fixed, 95% CI) | ‐0.02 [‐0.12, 0.08] |
| 7.2 Maximal exercise | 1 | 18 | Mean Difference (IV, Fixed, 95% CI) | ‐0.04 [‐0.30, 0.22] |
| 8 PaCO2 (mm Hg) Show forest plot | 1 | | Mean Difference (IV, Fixed, 95% CI) | Subtotals only |
|
| 8.1 At rest | 1 | 18 | Mean Difference (IV, Fixed, 95% CI) | 2.0 [‐9.56, 13.56] |
| 8.2 Maximal exercise | 1 | 18 | Mean Difference (IV, Fixed, 95% CI) | ‐4.0 [‐20.37, 12.37] |
| 9 PaO2 (mm Hg) Show forest plot | 1 | | Mean Difference (IV, Fixed, 95% CI) | Subtotals only |
|
| 9.1 At rest | 1 | 18 | Mean Difference (IV, Fixed, 95% CI) | 17.0 [9.13, 24.87] |
| 9.2 Maximal exercise | 1 | 18 | Mean Difference (IV, Fixed, 95% CI) | 15.0 [‐2.59, 32.59] |
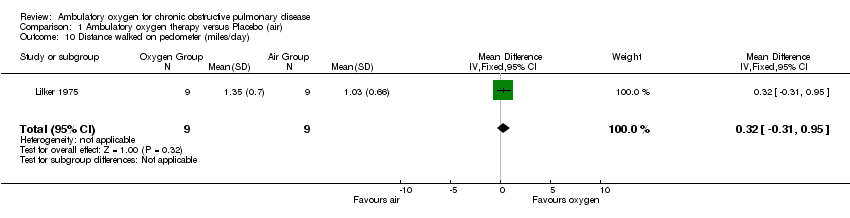
| 10 Distance walked on pedometer (miles/day) Show forest plot | 1 | 18 | Mean Difference (IV, Fixed, 95% CI) | 0.32 [‐0.31, 0.95] |
|
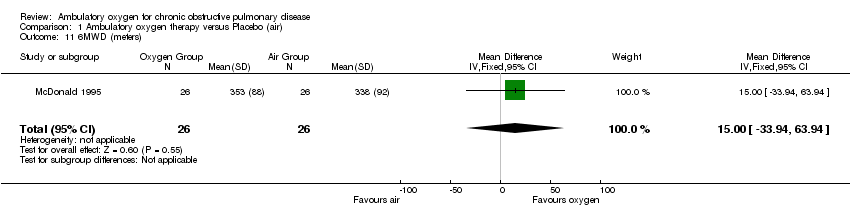
| 11 6MWD (meters) Show forest plot | 1 | 52 | Mean Difference (IV, Fixed, 95% CI) | 15.0 [‐33.94, 63.94] |
|
| 12 Borg score ‐ dyspnea (higher score worse) Show forest plot | 1 | | Mean Difference (IV, Fixed, 95% CI) | Subtotals only |
|
| 12.1 During 6MWD | 1 | 52 | Mean Difference (IV, Fixed, 95% CI) | ‐0.10 [‐0.79, 0.59] |
| 12.2 During step exercise test | 1 | 52 | Mean Difference (IV, Fixed, 95% CI) | ‐0.30 [‐0.98, 0.38] |
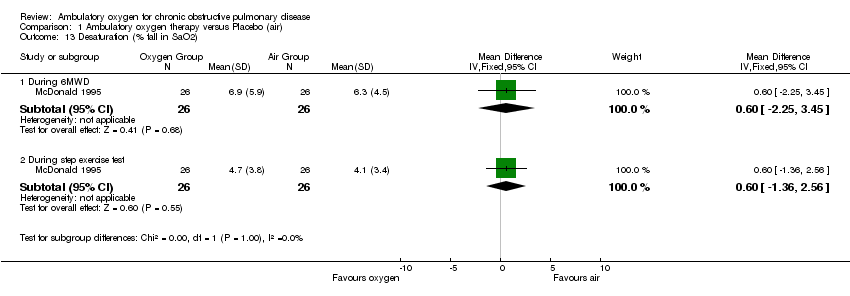
| 13 Desaturation (% fall in SaO2) Show forest plot | 1 | | Mean Difference (IV, Fixed, 95% CI) | Subtotals only |
|
| 13.1 During 6MWD | 1 | 52 | Mean Difference (IV, Fixed, 95% CI) | 0.60 [‐2.25, 3.45] |
| 13.2 During step exercise test | 1 | 52 | Mean Difference (IV, Fixed, 95% CI) | 0.60 [‐1.36, 2.56] |
| 14 Quality of life (Chronic respiratory disease questionnaire) Show forest plot | 1 | | Mean Difference (IV, Fixed, 95% CI) | Subtotals only |
|
| 14.1 Dyspnea | 1 | 52 | Mean Difference (IV, Fixed, 95% CI) | 2.0 [‐1.26, 5.26] |
| 14.2 Fatigue | 1 | 52 | Mean Difference (IV, Fixed, 95% CI) | 1.0 [‐1.17, 3.17] |
| 14.3 Emotional function | 1 | 52 | Mean Difference (IV, Fixed, 95% CI) | 1.0 [‐3.63, 5.63] |
| 14.4 Mastery | 1 | 52 | Mean Difference (IV, Fixed, 95% CI) | 1.0 [‐2.00, 4.00] |
| 15 Step exercise testing (number of steps) Show forest plot | 1 | 52 | Mean Difference (IV, Fixed, 95% CI) | 3.0 [‐6.52, 12.52] |
|
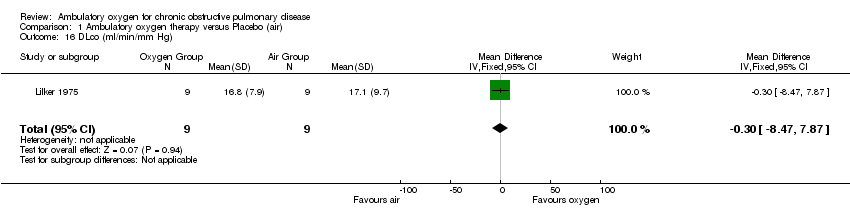
| 16 DLco (ml/min/mm Hg) Show forest plot | 1 | 18 | Mean Difference (IV, Fixed, 95% CI) | ‐0.30 [‐8.47, 7.87] |
|