Ambulatory oxygen for chronic obstructive pulmonary disease
Referencias
References to studies included in this review
References to studies excluded from this review
Additional references
Characteristics of studies
Characteristics of included studies [ordered by study ID]
Ir a:
| Methods | Randomised double blinded placebo controlled crossover trial. Study conducted in Toronto, Canada. | |
| Participants | Nine males patients with COPD and an arterial oxygen tension (PaO2) while sitting and breathing room air of less than 60mm Hg (hypoxemia) with clinical and ECG evidence for cor pulmonale were selected. All patients were stable and showed no subjective change or change in exercise tolerance for 3 months prior to the start of the study. | |
| Interventions | All patients were assigned five weeks of liquid oxygen therapy (at 2 L/min providing 19.7+‐2.2% oxygen) or five weeks of liquid air treatment in a double‐blinded randomised crossover order. All patients were taught how to use the portable gas apparatus (Linde walker) prior to start of study. All study measurements were also taught prior to the start of the study. All patients were visited at home once a week for study measurements and at the end of the five week period, all patients came into hospital for complete assessment. Exercise challenge consisted of a bicycle ergometer with progressively increasing workloads starting at 50 kilopond meters/min and increased by 50 kilopond meters every minute until patient stopped. There was a 10 day washout period (when no portable gas apparatus was supplied) after which coded gas apparatus were delivered to the patients home. | |
| Outcomes | All study measurements were done 4‐24 hours after patients stopped use of portable gas apparatus. FVC, MVV, FEV1/FVC, RV, RV/TLC, gas diffusion, heart rate, VE, arterial pH, PaCO2, PaO2, miles walked per day using pedometer, reticulocyte count, hematocrit, hemoglobin. | |
| Notes | Study used codes to conceal treatment allocation. Jadad score = 4 | |
| Risk of bias | ||
| Bias | Authors' judgement | Support for judgement |
| Allocation concealment? | Low risk | A ‐ Adequate |
| Methods | Randomised double blinded placebo controlled crossover trial. Study conducted in Victoria, Australia. | |
| Participants | Thirty‐six patients entered the study and 10 dropped out for various reasons. Data reported on 26 patients who completed the study. All patients had COPD without resting hypoxemia (PaO2 > 60 mmHg), baseline values were mean (SD): age 73(6), FEV1 0.9(0.4) L, DLco 10.6 (2.4) ml/mim/mm Hg, PCO2 41 (3.3) mm Hg, SaO2 94 (2.1). None of the patients had an exacerbation of their COPD in the preceding 3 months, none had symtomatic cardiac dysfunction, angina pectoris or locomotor disability. | |
| Interventions | All patients were assigned six weeks of portable gas oxygen cylinders (at 4 L/min intranasally) or six weeks of portable air treatment in a double‐blinded randomised crossover fashion. All patients were made familiar with diary cards and with performance of exercise tests. Exercise challenge consisted of step tests (patient stepped in time with a metronome at a previously determined level and until patient voluntarily stopped) and 6 minute walking distance (6MWD). All study measurements were done and taught prior to the start of the study. Study measurements were done at baseline and at the first and second six week periods. There was no mention in the study of a washout period. | |
| Outcomes | All study measurements were done with the patient using both air and oxygen irrespective of whether the patient was using air or oxygen in the preceding 6 weeks, the results were reported separately (only study measurements using air were used in the review as it was same methodology as the other study). Borg score, 6MWD, quality of life using CRDQ, symptom scores, SaO2. | |
| Notes | Study used camouflaged cylinders for treatment delivery. Jadad score = 4 | |
| Risk of bias | ||
| Bias | Authors' judgement | Support for judgement |
| Allocation concealment? | Low risk | A ‐ Adequate |
Characteristics of excluded studies [ordered by study ID]
Ir a:
| Study | Reason for exclusion |
| Delivery of oxygen or air, only when patients exercised three times a week for six weeks, for one hour per session. The two study groups consisted of a mixture of patients who were on long‐term oxygen therapy (5 in the air group and 6 in the oxygen group) data was not presented separately from those that did not have long‐term oxygen therapy. | |
| Transtracheal route of oxygen versus nasal cannula. | |
| Not an RCT but a narrative review. | |
| Short‐term/acute study, not a study of long‐term ambulatory oxygen therapy. | |
| Not an RCT but a questionnaire survey of patients currently using portable oxygen. | |
| Gaseous versus liquid oxygen with no placebo or control arm. | |
| Not a study of long‐term ambulatory oxygen therapy. Study tested patients in randomised fashion with 100% oxyen or room air and while they underwent exercise challenge using a treadmill. | |
| Not an RCT but a discussion of a proposed RCT. | |
| Not an RCT but a literature review. | |
| On demand oxygen versus continuous oxygen supply and no placebo or control group. | |
| Delivery of oxygen or air, only when patients exercised five times a week for 10 weeks, for 80 minutes per session. The intervention did not involve long‐term oxygen therapy. | |
| Study intervention included ambulatory oxygen therapy with either almitrine bismesylate (50‐100mg/day) or placebo with all patients receiving oxygen therapy. | |
| No placebo arm (study of different types of oxygen delivery systems) and also a short‐term/acute study, not a study of long‐term ambulatory oxygen therapy. | |
| Short‐term/acute study, not a study of long‐term ambulatory oxygen therapy. | |
| Short‐term/acute study, not a study of long‐term ambulatory oxygen therapy. |
Data and analyses
| Outcome or subgroup title | No. of studies | No. of participants | Statistical method | Effect size |
| 1 FVC (L) Show forest plot | 1 | 18 | Mean Difference (IV, Fixed, 95% CI) | 0.03 [‐0.53, 0.59] |
| Analysis 1.1  Comparison 1 Ambulatory oxygen therapy versus Placebo (air), Outcome 1 FVC (L). | ||||
| 2 MVV (L/min) Show forest plot | 1 | 18 | Mean Difference (IV, Fixed, 95% CI) | ‐1.0 [‐8.45, 6.45] |
| Analysis 1.2  Comparison 1 Ambulatory oxygen therapy versus Placebo (air), Outcome 2 MVV (L/min). | ||||
| 3 FEV1/FVC (%) Show forest plot | 1 | 18 | Mean Difference (IV, Fixed, 95% CI) | ‐4.0 [‐18.33, 10.33] |
| Analysis 1.3  Comparison 1 Ambulatory oxygen therapy versus Placebo (air), Outcome 3 FEV1/FVC (%). | ||||
| 4 RV (L) Show forest plot | 1 | 18 | Mean Difference (IV, Fixed, 95% CI) | ‐0.22 [‐1.47, 1.03] |
| Analysis 1.4  Comparison 1 Ambulatory oxygen therapy versus Placebo (air), Outcome 4 RV (L). | ||||
| 5 Heart rate (bpm) Show forest plot | 1 | Mean Difference (IV, Fixed, 95% CI) | Subtotals only | |
| Analysis 1.5  Comparison 1 Ambulatory oxygen therapy versus Placebo (air), Outcome 5 Heart rate (bpm). | ||||
| 5.1 At rest | 1 | 18 | Mean Difference (IV, Fixed, 95% CI) | ‐6.0 [‐13.97, 1.97] |
| 5.2 Maximal exercise | 1 | 18 | Mean Difference (IV, Fixed, 95% CI) | 0.0 [‐9.08, 9.08] |
| 6 VE (L/min) Show forest plot | 1 | Mean Difference (IV, Fixed, 95% CI) | Subtotals only | |
| Analysis 1.6  Comparison 1 Ambulatory oxygen therapy versus Placebo (air), Outcome 6 VE (L/min). | ||||
| 6.1 At rest | 1 | 18 | Mean Difference (IV, Fixed, 95% CI) | ‐0.40 [‐5.50, 4.70] |
| 6.2 Maximal exercise | 1 | 18 | Mean Difference (IV, Fixed, 95% CI) | ‐11.0 [‐17.53, ‐4.47] |
| 7 Arterial pH (units) Show forest plot | 1 | Mean Difference (IV, Fixed, 95% CI) | Subtotals only | |
| Analysis 1.7  Comparison 1 Ambulatory oxygen therapy versus Placebo (air), Outcome 7 Arterial pH (units). | ||||
| 7.1 At rest | 1 | 18 | Mean Difference (IV, Fixed, 95% CI) | ‐0.02 [‐0.12, 0.08] |
| 7.2 Maximal exercise | 1 | 18 | Mean Difference (IV, Fixed, 95% CI) | ‐0.04 [‐0.30, 0.22] |
| 8 PaCO2 (mm Hg) Show forest plot | 1 | Mean Difference (IV, Fixed, 95% CI) | Subtotals only | |
| Analysis 1.8  Comparison 1 Ambulatory oxygen therapy versus Placebo (air), Outcome 8 PaCO2 (mm Hg). | ||||
| 8.1 At rest | 1 | 18 | Mean Difference (IV, Fixed, 95% CI) | 2.0 [‐9.56, 13.56] |
| 8.2 Maximal exercise | 1 | 18 | Mean Difference (IV, Fixed, 95% CI) | ‐4.0 [‐20.37, 12.37] |
| 9 PaO2 (mm Hg) Show forest plot | 1 | Mean Difference (IV, Fixed, 95% CI) | Subtotals only | |
| Analysis 1.9  Comparison 1 Ambulatory oxygen therapy versus Placebo (air), Outcome 9 PaO2 (mm Hg). | ||||
| 9.1 At rest | 1 | 18 | Mean Difference (IV, Fixed, 95% CI) | 17.0 [9.13, 24.87] |
| 9.2 Maximal exercise | 1 | 18 | Mean Difference (IV, Fixed, 95% CI) | 15.0 [‐2.59, 32.59] |
| 10 Distance walked on pedometer (miles/day) Show forest plot | 1 | 18 | Mean Difference (IV, Fixed, 95% CI) | 0.32 [‐0.31, 0.95] |
| Analysis 1.10  Comparison 1 Ambulatory oxygen therapy versus Placebo (air), Outcome 10 Distance walked on pedometer (miles/day). | ||||
| 11 6MWD (meters) Show forest plot | 1 | 52 | Mean Difference (IV, Fixed, 95% CI) | 15.0 [‐33.94, 63.94] |
| Analysis 1.11  Comparison 1 Ambulatory oxygen therapy versus Placebo (air), Outcome 11 6MWD (meters). | ||||
| 12 Borg score ‐ dyspnea (higher score worse) Show forest plot | 1 | Mean Difference (IV, Fixed, 95% CI) | Subtotals only | |
| Analysis 1.12  Comparison 1 Ambulatory oxygen therapy versus Placebo (air), Outcome 12 Borg score ‐ dyspnea (higher score worse). | ||||
| 12.1 During 6MWD | 1 | 52 | Mean Difference (IV, Fixed, 95% CI) | ‐0.10 [‐0.79, 0.59] |
| 12.2 During step exercise test | 1 | 52 | Mean Difference (IV, Fixed, 95% CI) | ‐0.30 [‐0.98, 0.38] |
| 13 Desaturation (% fall in SaO2) Show forest plot | 1 | Mean Difference (IV, Fixed, 95% CI) | Subtotals only | |
| Analysis 1.13  Comparison 1 Ambulatory oxygen therapy versus Placebo (air), Outcome 13 Desaturation (% fall in SaO2). | ||||
| 13.1 During 6MWD | 1 | 52 | Mean Difference (IV, Fixed, 95% CI) | 0.60 [‐2.25, 3.45] |
| 13.2 During step exercise test | 1 | 52 | Mean Difference (IV, Fixed, 95% CI) | 0.60 [‐1.36, 2.56] |
| 14 Quality of life (Chronic respiratory disease questionnaire) Show forest plot | 1 | Mean Difference (IV, Fixed, 95% CI) | Subtotals only | |
| Analysis 1.14  Comparison 1 Ambulatory oxygen therapy versus Placebo (air), Outcome 14 Quality of life (Chronic respiratory disease questionnaire). | ||||
| 14.1 Dyspnea | 1 | 52 | Mean Difference (IV, Fixed, 95% CI) | 2.0 [‐1.26, 5.26] |
| 14.2 Fatigue | 1 | 52 | Mean Difference (IV, Fixed, 95% CI) | 1.0 [‐1.17, 3.17] |
| 14.3 Emotional function | 1 | 52 | Mean Difference (IV, Fixed, 95% CI) | 1.0 [‐3.63, 5.63] |
| 14.4 Mastery | 1 | 52 | Mean Difference (IV, Fixed, 95% CI) | 1.0 [‐2.00, 4.00] |
| 15 Step exercise testing (number of steps) Show forest plot | 1 | 52 | Mean Difference (IV, Fixed, 95% CI) | 3.0 [‐6.52, 12.52] |
| Analysis 1.15  Comparison 1 Ambulatory oxygen therapy versus Placebo (air), Outcome 15 Step exercise testing (number of steps). | ||||
| 16 DLco (ml/min/mm Hg) Show forest plot | 1 | 18 | Mean Difference (IV, Fixed, 95% CI) | ‐0.30 [‐8.47, 7.87] |
| Analysis 1.16  Comparison 1 Ambulatory oxygen therapy versus Placebo (air), Outcome 16 DLco (ml/min/mm Hg). | ||||
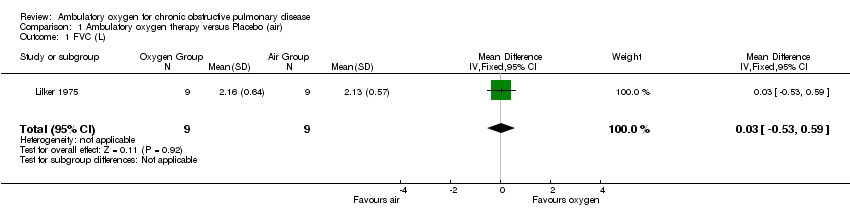
Comparison 1 Ambulatory oxygen therapy versus Placebo (air), Outcome 1 FVC (L).

Comparison 1 Ambulatory oxygen therapy versus Placebo (air), Outcome 2 MVV (L/min).

Comparison 1 Ambulatory oxygen therapy versus Placebo (air), Outcome 3 FEV1/FVC (%).

Comparison 1 Ambulatory oxygen therapy versus Placebo (air), Outcome 4 RV (L).
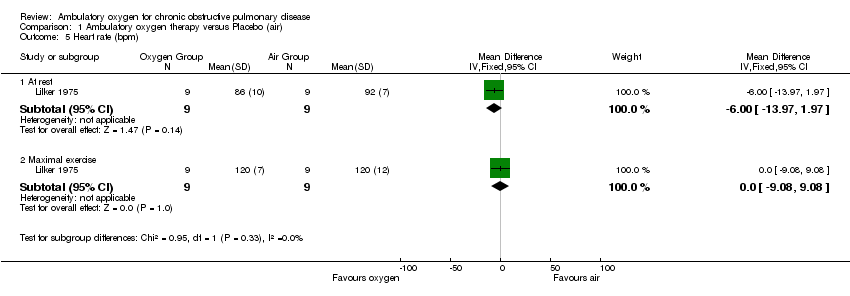
Comparison 1 Ambulatory oxygen therapy versus Placebo (air), Outcome 5 Heart rate (bpm).
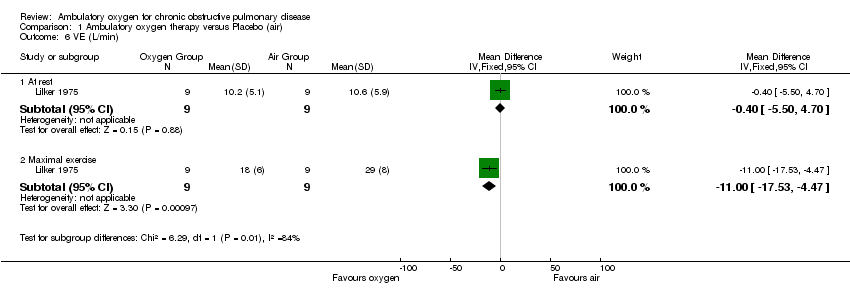
Comparison 1 Ambulatory oxygen therapy versus Placebo (air), Outcome 6 VE (L/min).
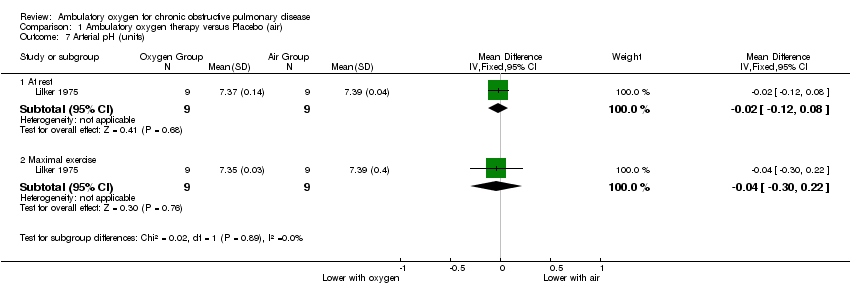
Comparison 1 Ambulatory oxygen therapy versus Placebo (air), Outcome 7 Arterial pH (units).

Comparison 1 Ambulatory oxygen therapy versus Placebo (air), Outcome 8 PaCO2 (mm Hg).

Comparison 1 Ambulatory oxygen therapy versus Placebo (air), Outcome 9 PaO2 (mm Hg).
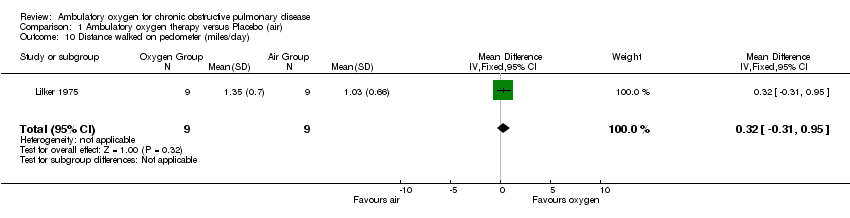
Comparison 1 Ambulatory oxygen therapy versus Placebo (air), Outcome 10 Distance walked on pedometer (miles/day).
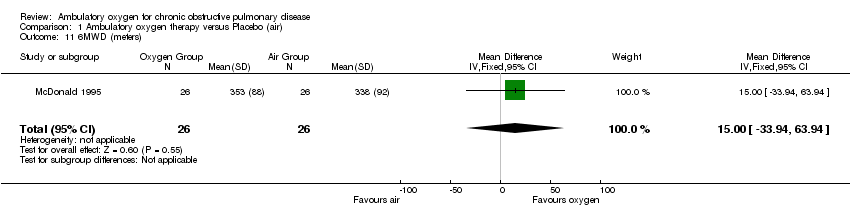
Comparison 1 Ambulatory oxygen therapy versus Placebo (air), Outcome 11 6MWD (meters).

Comparison 1 Ambulatory oxygen therapy versus Placebo (air), Outcome 12 Borg score ‐ dyspnea (higher score worse).
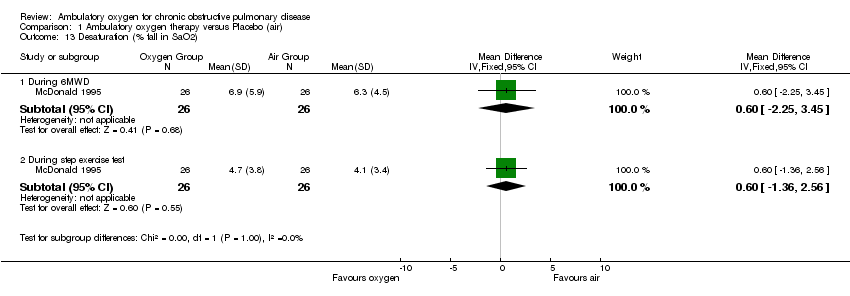
Comparison 1 Ambulatory oxygen therapy versus Placebo (air), Outcome 13 Desaturation (% fall in SaO2).

Comparison 1 Ambulatory oxygen therapy versus Placebo (air), Outcome 14 Quality of life (Chronic respiratory disease questionnaire).

Comparison 1 Ambulatory oxygen therapy versus Placebo (air), Outcome 15 Step exercise testing (number of steps).
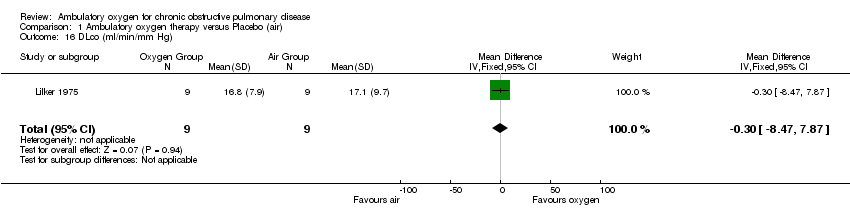
Comparison 1 Ambulatory oxygen therapy versus Placebo (air), Outcome 16 DLco (ml/min/mm Hg).
| Outcome or subgroup title | No. of studies | No. of participants | Statistical method | Effect size |
| 1 FVC (L) Show forest plot | 1 | 18 | Mean Difference (IV, Fixed, 95% CI) | 0.03 [‐0.53, 0.59] |
| 2 MVV (L/min) Show forest plot | 1 | 18 | Mean Difference (IV, Fixed, 95% CI) | ‐1.0 [‐8.45, 6.45] |
| 3 FEV1/FVC (%) Show forest plot | 1 | 18 | Mean Difference (IV, Fixed, 95% CI) | ‐4.0 [‐18.33, 10.33] |
| 4 RV (L) Show forest plot | 1 | 18 | Mean Difference (IV, Fixed, 95% CI) | ‐0.22 [‐1.47, 1.03] |
| 5 Heart rate (bpm) Show forest plot | 1 | Mean Difference (IV, Fixed, 95% CI) | Subtotals only | |
| 5.1 At rest | 1 | 18 | Mean Difference (IV, Fixed, 95% CI) | ‐6.0 [‐13.97, 1.97] |
| 5.2 Maximal exercise | 1 | 18 | Mean Difference (IV, Fixed, 95% CI) | 0.0 [‐9.08, 9.08] |
| 6 VE (L/min) Show forest plot | 1 | Mean Difference (IV, Fixed, 95% CI) | Subtotals only | |
| 6.1 At rest | 1 | 18 | Mean Difference (IV, Fixed, 95% CI) | ‐0.40 [‐5.50, 4.70] |
| 6.2 Maximal exercise | 1 | 18 | Mean Difference (IV, Fixed, 95% CI) | ‐11.0 [‐17.53, ‐4.47] |
| 7 Arterial pH (units) Show forest plot | 1 | Mean Difference (IV, Fixed, 95% CI) | Subtotals only | |
| 7.1 At rest | 1 | 18 | Mean Difference (IV, Fixed, 95% CI) | ‐0.02 [‐0.12, 0.08] |
| 7.2 Maximal exercise | 1 | 18 | Mean Difference (IV, Fixed, 95% CI) | ‐0.04 [‐0.30, 0.22] |
| 8 PaCO2 (mm Hg) Show forest plot | 1 | Mean Difference (IV, Fixed, 95% CI) | Subtotals only | |
| 8.1 At rest | 1 | 18 | Mean Difference (IV, Fixed, 95% CI) | 2.0 [‐9.56, 13.56] |
| 8.2 Maximal exercise | 1 | 18 | Mean Difference (IV, Fixed, 95% CI) | ‐4.0 [‐20.37, 12.37] |
| 9 PaO2 (mm Hg) Show forest plot | 1 | Mean Difference (IV, Fixed, 95% CI) | Subtotals only | |
| 9.1 At rest | 1 | 18 | Mean Difference (IV, Fixed, 95% CI) | 17.0 [9.13, 24.87] |
| 9.2 Maximal exercise | 1 | 18 | Mean Difference (IV, Fixed, 95% CI) | 15.0 [‐2.59, 32.59] |
| 10 Distance walked on pedometer (miles/day) Show forest plot | 1 | 18 | Mean Difference (IV, Fixed, 95% CI) | 0.32 [‐0.31, 0.95] |
| 11 6MWD (meters) Show forest plot | 1 | 52 | Mean Difference (IV, Fixed, 95% CI) | 15.0 [‐33.94, 63.94] |
| 12 Borg score ‐ dyspnea (higher score worse) Show forest plot | 1 | Mean Difference (IV, Fixed, 95% CI) | Subtotals only | |
| 12.1 During 6MWD | 1 | 52 | Mean Difference (IV, Fixed, 95% CI) | ‐0.10 [‐0.79, 0.59] |
| 12.2 During step exercise test | 1 | 52 | Mean Difference (IV, Fixed, 95% CI) | ‐0.30 [‐0.98, 0.38] |
| 13 Desaturation (% fall in SaO2) Show forest plot | 1 | Mean Difference (IV, Fixed, 95% CI) | Subtotals only | |
| 13.1 During 6MWD | 1 | 52 | Mean Difference (IV, Fixed, 95% CI) | 0.60 [‐2.25, 3.45] |
| 13.2 During step exercise test | 1 | 52 | Mean Difference (IV, Fixed, 95% CI) | 0.60 [‐1.36, 2.56] |
| 14 Quality of life (Chronic respiratory disease questionnaire) Show forest plot | 1 | Mean Difference (IV, Fixed, 95% CI) | Subtotals only | |
| 14.1 Dyspnea | 1 | 52 | Mean Difference (IV, Fixed, 95% CI) | 2.0 [‐1.26, 5.26] |
| 14.2 Fatigue | 1 | 52 | Mean Difference (IV, Fixed, 95% CI) | 1.0 [‐1.17, 3.17] |
| 14.3 Emotional function | 1 | 52 | Mean Difference (IV, Fixed, 95% CI) | 1.0 [‐3.63, 5.63] |
| 14.4 Mastery | 1 | 52 | Mean Difference (IV, Fixed, 95% CI) | 1.0 [‐2.00, 4.00] |
| 15 Step exercise testing (number of steps) Show forest plot | 1 | 52 | Mean Difference (IV, Fixed, 95% CI) | 3.0 [‐6.52, 12.52] |
| 16 DLco (ml/min/mm Hg) Show forest plot | 1 | 18 | Mean Difference (IV, Fixed, 95% CI) | ‐0.30 [‐8.47, 7.87] |