| 1 Tardive dyskinesia (TD) symptoms: no clinically important improvement (> 50% improvement on any TD scale) Show forest plot | 2 | 32 | Risk Ratio (M‐H, Fixed, 95% CI) | 1.12 [0.60, 2.09] |
|
| 1.1 Diazepam vs placebo ‐ short term | 1 | 17 | Risk Ratio (M‐H, Fixed, 95% CI) | 0.73 [0.24, 2.23] |
| 1.2 Diazepam vs TAU ‐ medium term | 1 | 15 | Risk Ratio (M‐H, Fixed, 95% CI) | 1.5 [0.71, 3.16] |
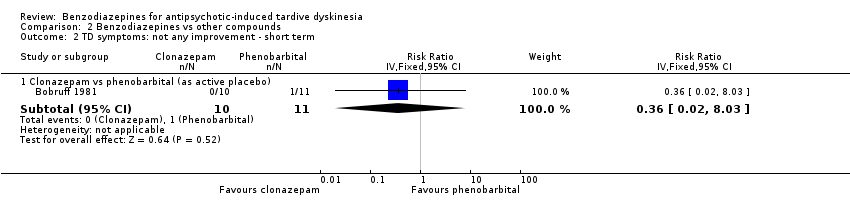
| 2 TD symptoms: not any improvement Show forest plot | 2 | 32 | Risk Ratio (IV, Fixed, 95% CI) | 1.49 [0.33, 6.74] |
|
| 2.1 Diazepam vs placebo ‐ short term | 1 | 17 | Risk Ratio (IV, Fixed, 95% CI) | 0.55 [0.04, 7.25] |
| 2.2 Diazepam vs TAU ‐ medium term | 1 | 15 | Risk Ratio (IV, Fixed, 95% CI) | 2.5 [0.39, 16.05] |
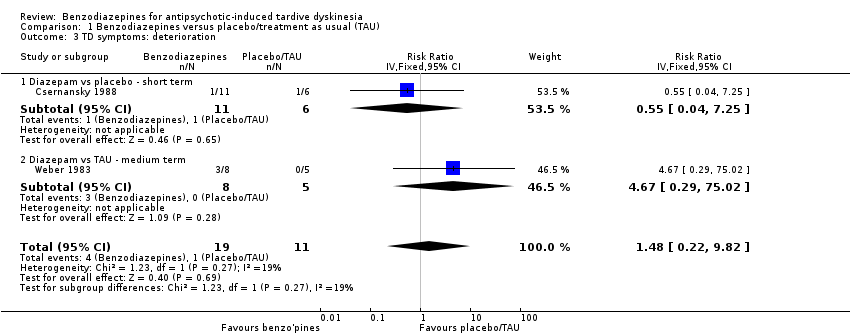
| 3 TD symptoms: deterioration Show forest plot | 2 | 30 | Risk Ratio (IV, Fixed, 95% CI) | 1.48 [0.22, 9.82] |
|
| 3.1 Diazepam vs placebo ‐ short term | 1 | 17 | Risk Ratio (IV, Fixed, 95% CI) | 0.55 [0.04, 7.25] |
| 3.2 Diazepam vs TAU ‐ medium term | 1 | 13 | Risk Ratio (IV, Fixed, 95% CI) | 4.67 [0.29, 75.02] |
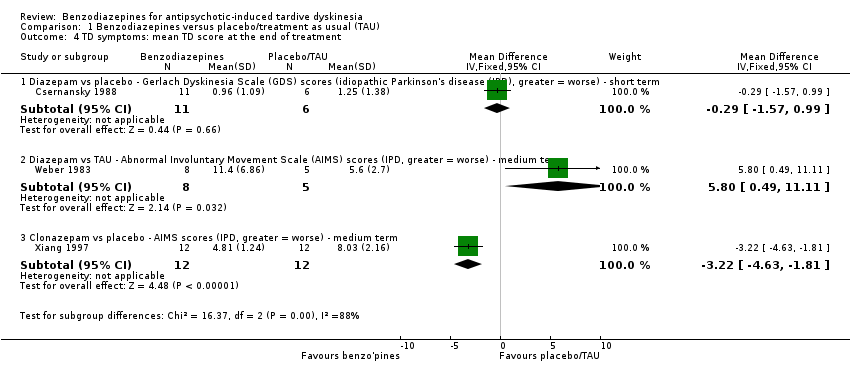
| 4 TD symptoms: mean TD score at the end of treatment Show forest plot | 3 | | Mean Difference (IV, Fixed, 95% CI) | Subtotals only |
|
| 4.1 Diazepam vs placebo ‐ Gerlach Dyskinesia Scale (GDS) scores (idiopathic Parkinson's disease (IPD), greater = worse) ‐ short term | 1 | 17 | Mean Difference (IV, Fixed, 95% CI) | ‐0.29 [‐1.57, 0.99] |
| 4.2 Diazepam vs TAU ‐ Abnormal Involuntary Movement Scale (AIMS) scores (IPD, greater = worse) ‐ medium term | 1 | 13 | Mean Difference (IV, Fixed, 95% CI) | 5.80 [0.49, 11.11] |
| 4.3 Clonazepam vs placebo ‐ AIMS scores (IPD, greater = worse) ‐ medium term | 1 | 24 | Mean Difference (IV, Fixed, 95% CI) | ‐3.22 [‐4.63, ‐1.81] |
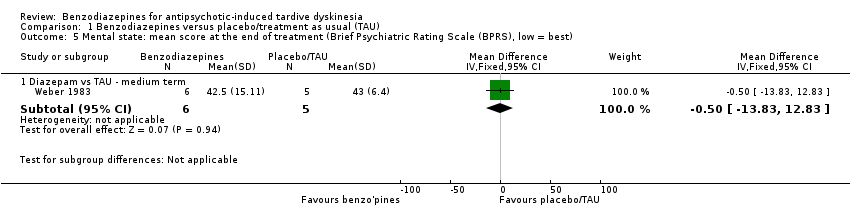
| 5 Mental state: mean score at the end of treatment (Brief Psychiatric Rating Scale (BPRS), low = best) Show forest plot | 1 | | Mean Difference (IV, Fixed, 95% CI) | Subtotals only |
|
| 5.1 Diazepam vs TAU ‐ medium term | 1 | 11 | Mean Difference (IV, Fixed, 95% CI) | ‐0.5 [‐13.83, 12.83] |
| 6 Leaving the study early Show forest plot | 3 | 56 | Risk Ratio (M‐H, Fixed, 95% CI) | 2.73 [0.15, 48.04] |
|
| 6.1 Clonazepam vs placebo ‐ medium term | 1 | 24 | Risk Ratio (M‐H, Fixed, 95% CI) | 0.0 [0.0, 0.0] |
| 6.2 Diazepam vs placebo ‐ short term | 1 | 17 | Risk Ratio (M‐H, Fixed, 95% CI) | 0.0 [0.0, 0.0] |
| 6.3 Diazepam vs TAU ‐ medium term | 1 | 15 | Risk Ratio (M‐H, Fixed, 95% CI) | 2.73 [0.15, 48.04] |