| 1 Failed apnoea reduction after 2 ‐ 7 days Show forest plot | 5 | 192 | Risk Ratio (M‐H, Fixed, 95% CI) | 0.44 [0.32, 0.60] |
|
| 1.1 Theophylline vs. control | 3 | 92 | Risk Ratio (M‐H, Fixed, 95% CI) | 0.42 [0.28, 0.63] |
| 1.2 Caffeine vs. control | 2 | 100 | Risk Ratio (M‐H, Fixed, 95% CI) | 0.46 [0.27, 0.78] |
| 2 Use of mechanical ventilation Show forest plot | 5 | 192 | Risk Ratio (M‐H, Fixed, 95% CI) | 0.34 [0.12, 0.97] |
|
| 2.1 Theophylline vs. control | 3 | 92 | Risk Ratio (M‐H, Fixed, 95% CI) | 0.38 [0.13, 1.16] |
| 2.2 Caffeine vs. control | 2 | 100 | Risk Ratio (M‐H, Fixed, 95% CI) | 0.2 [0.01, 3.66] |
| 3 Tachycardia or feed intolerance Show forest plot | 4 | 149 | Risk Ratio (M‐H, Fixed, 95% CI) | 4.69 [0.24, 89.88] |
|
| 3.1 Theophylline vs. control | 2 | 49 | Risk Ratio (M‐H, Fixed, 95% CI) | 4.69 [0.24, 89.88] |
| 3.2 Caffeine vs. control | 2 | 100 | Risk Ratio (M‐H, Fixed, 95% CI) | 0.0 [0.0, 0.0] |
| 4 PDA ligation Show forest plot | 1 | 827 | Risk Ratio (M‐H, Fixed, 95% CI) | 0.37 [0.21, 0.66] |
|
| 4.1 Caffeine vs. control | 1 | 827 | Risk Ratio (M‐H, Fixed, 95% CI) | 0.37 [0.21, 0.66] |
| 5 PMA at last oxygen therapy Show forest plot | 1 | 797 | Mean Difference (IV, Fixed, 95% CI) | ‐0.90 [‐1.54, ‐0.26] |
|
| 5.1 Caffeine vs. control | 1 | 797 | Mean Difference (IV, Fixed, 95% CI) | ‐0.90 [‐1.54, ‐0.26] |
| 6 PMA at last endo‐tracheal tube Show forest plot | 1 | 797 | Mean Difference (IV, Fixed, 95% CI) | ‐0.60 [‐1.03, ‐0.17] |
|
| 6.1 Caffeine vs. control | 1 | 797 | Mean Difference (IV, Fixed, 95% CI) | ‐0.60 [‐1.03, ‐0.17] |
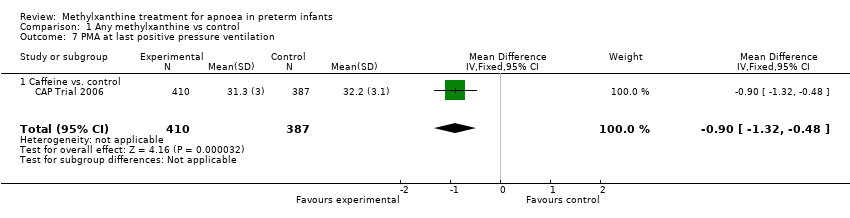
| 7 PMA at last positive pressure ventilation Show forest plot | 1 | 797 | Mean Difference (IV, Fixed, 95% CI) | ‐0.90 [‐1.32, ‐0.48] |
|
| 7.1 Caffeine vs. control | 1 | 797 | Mean Difference (IV, Fixed, 95% CI) | ‐0.90 [‐1.32, ‐0.48] |
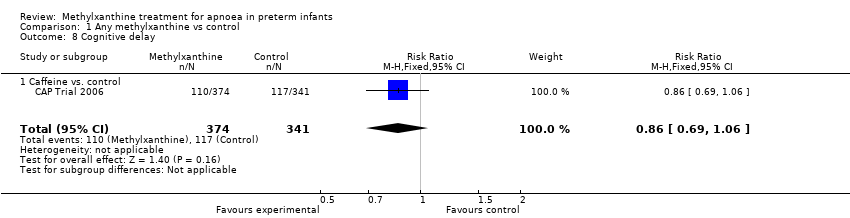
| 8 Cognitive delay Show forest plot | 1 | 715 | Risk Ratio (M‐H, Fixed, 95% CI) | 0.86 [0.69, 1.06] |
|
| 8.1 Caffeine vs. control | 1 | 715 | Risk Ratio (M‐H, Fixed, 95% CI) | 0.86 [0.69, 1.06] |
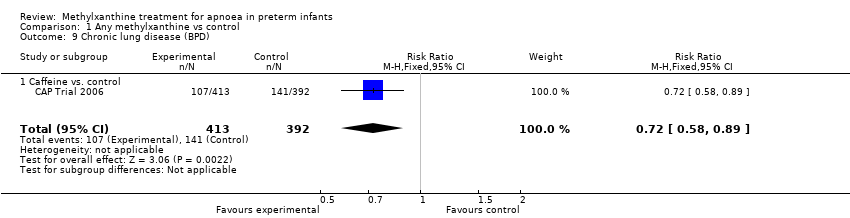
| 9 Chronic lung disease (BPD) Show forest plot | 1 | 805 | Risk Ratio (M‐H, Fixed, 95% CI) | 0.72 [0.58, 0.89] |
|
| 9.1 Caffeine vs. control | 1 | 805 | Risk Ratio (M‐H, Fixed, 95% CI) | 0.72 [0.58, 0.89] |
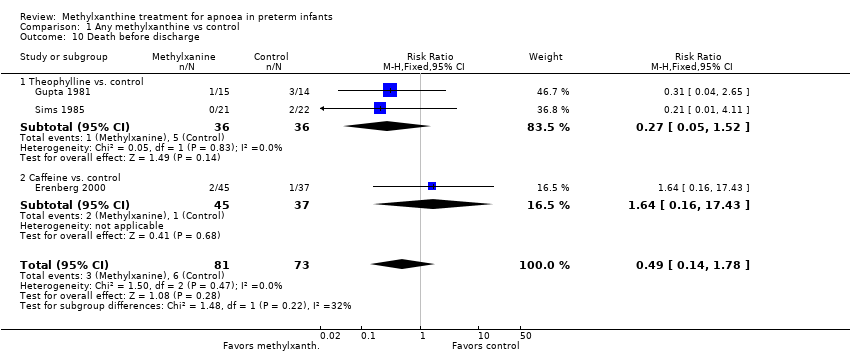
| 10 Death before discharge Show forest plot | 3 | 154 | Risk Ratio (M‐H, Fixed, 95% CI) | 0.49 [0.14, 1.78] |
|
| 10.1 Theophylline vs. control | 2 | 72 | Risk Ratio (M‐H, Fixed, 95% CI) | 0.27 [0.05, 1.52] |
| 10.2 Caffeine vs. control | 1 | 82 | Risk Ratio (M‐H, Fixed, 95% CI) | 1.64 [0.16, 17.43] |
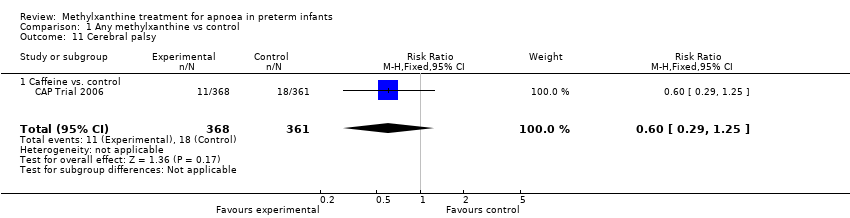
| 11 Cerebral palsy Show forest plot | 1 | 729 | Risk Ratio (M‐H, Fixed, 95% CI) | 0.60 [0.29, 1.25] |
|
| 11.1 Caffeine vs. control | 1 | 729 | Risk Ratio (M‐H, Fixed, 95% CI) | 0.60 [0.29, 1.25] |
| 12 Death or major disability by late infancy Show forest plot | 1 | 767 | Risk Ratio (M‐H, Fixed, 95% CI) | 0.85 [0.71, 1.01] |
|
| 12.1 Caffeine vs. control | 1 | 767 | Risk Ratio (M‐H, Fixed, 95% CI) | 0.85 [0.71, 1.01] |