Electrocardiograma (ECG) fetal para la monitorización del feto durante el trabajo de parto
Información
- DOI:
- https://doi.org/10.1002/14651858.CD000116.pub5Copiar DOI

- Base de datos:
-
- Cochrane Database of Systematic Reviews
- Versión publicada:
-
- 21 diciembre 2015see what's new
- Tipo:
-
- Intervention
- Etapa:
-
- Review
- Grupo Editorial Cochrane:
-
Grupo Cochrane de Embarazo y parto
- Copyright:
-
- Copyright © 2015 The Cochrane Collaboration. Published by John Wiley & Sons, Ltd.
Cifras del artículo
Altmetric:
Citado por:
Autores
Contributions of authors
JP Neilson has prepared and maintained the review.
Sources of support
Internal sources
-
The University of Liverpool, UK.
External sources
-
No sources of support supplied
Declarations of interest
None known.
Acknowledgements
Thanks for additional unpublished data from Dr Jenny Westgate (Westgate 1993), Dr Christophe Vayssiere (Vayssiere 2007), and Prof Karel Marsal (Amer‐Wahlin 2001).
Thanks also to Becky Davie and Sally Reynolds, student medical statisticians, who helped with the 'Risk of bias' assessments of included studies (and to Leanne Jones for her oversight).
This project was supported by the National Institute for Health Research, via Cochrane Infrastructure funding to Cochrane Pregnancy and Childbirth. The views and opinions expressed therein are those of the author and do not necessarily reflect those of the Systematic Reviews Programme, NIHR, NHS or the Department of Health.
Version history
| Published | Title | Stage | Authors | Version |
| 2015 Dec 21 | Fetal electrocardiogram (ECG) for fetal monitoring during labour | Review | James P Neilson | |
| 2013 May 31 | Fetal electrocardiogram (ECG) for fetal monitoring during labour | Review | James P Neilson | |
| 2012 Apr 18 | Fetal electrocardiogram (ECG) for fetal monitoring during labour | Review | James P Neilson | |
| 2006 Jul 19 | Fetal electrocardiogram (ECG) for fetal monitoring during labour | Review | James P Neilson | |
| 2003 Apr 22 | Fetal electrocardiogram (ECG) for fetal monitoring during labour | Review | James P Neilson | |
Differences between protocol and review
Methods updated. A 'Summary of findings' table has been added.
Keywords
MeSH
Medical Subject Headings (MeSH) Keywords
Medical Subject Headings Check Words
Female; Humans; Pregnancy;
PICO

'Risk of bias' graph: review authors' judgements about each risk of bias item presented as percentages across all included studies.
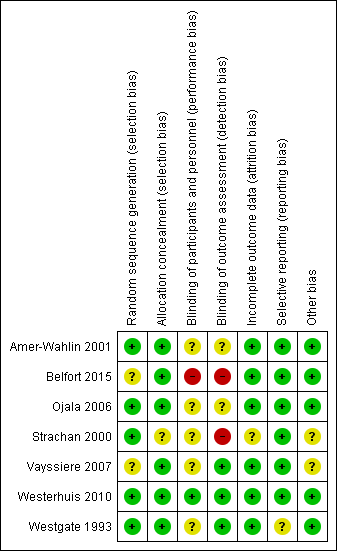
'Risk of bias' summary: review authors' judgements about each risk of bias item for each included study.
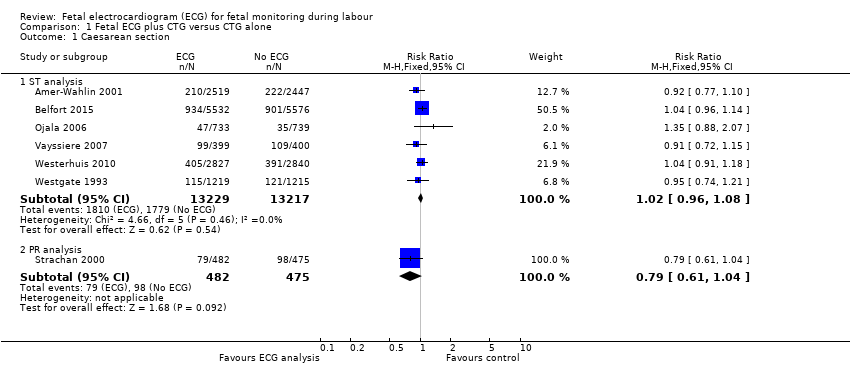
Comparison 1 Fetal ECG plus CTG versus CTG alone, Outcome 1 Caesarean section.
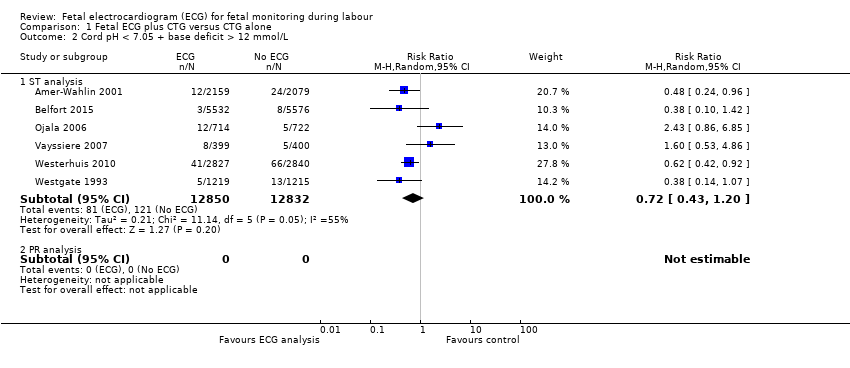
Comparison 1 Fetal ECG plus CTG versus CTG alone, Outcome 2 Cord pH < 7.05 + base deficit > 12 mmol/L.
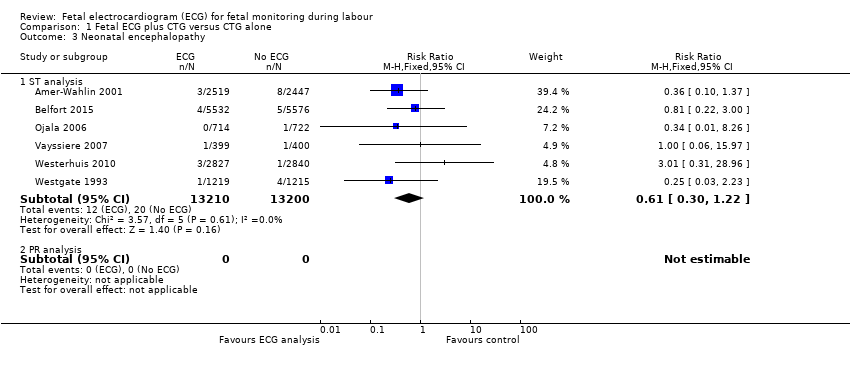
Comparison 1 Fetal ECG plus CTG versus CTG alone, Outcome 3 Neonatal encephalopathy.
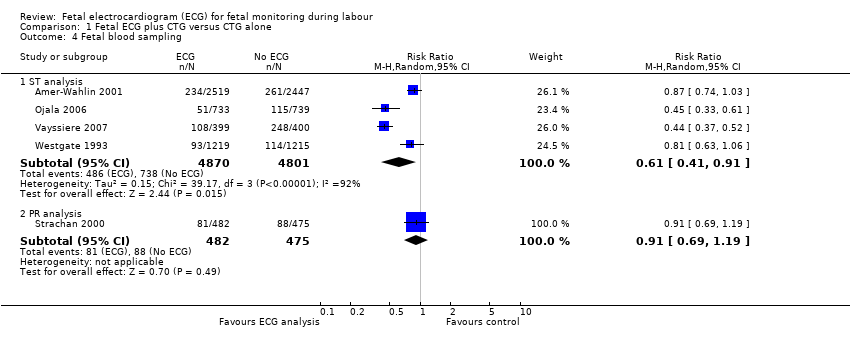
Comparison 1 Fetal ECG plus CTG versus CTG alone, Outcome 4 Fetal blood sampling.

Comparison 1 Fetal ECG plus CTG versus CTG alone, Outcome 5 Operative vaginal delivery.

Comparison 1 Fetal ECG plus CTG versus CTG alone, Outcome 6 Apgar score < 7 at 5 minutes.

Comparison 1 Fetal ECG plus CTG versus CTG alone, Outcome 7 Neonatal intubation.
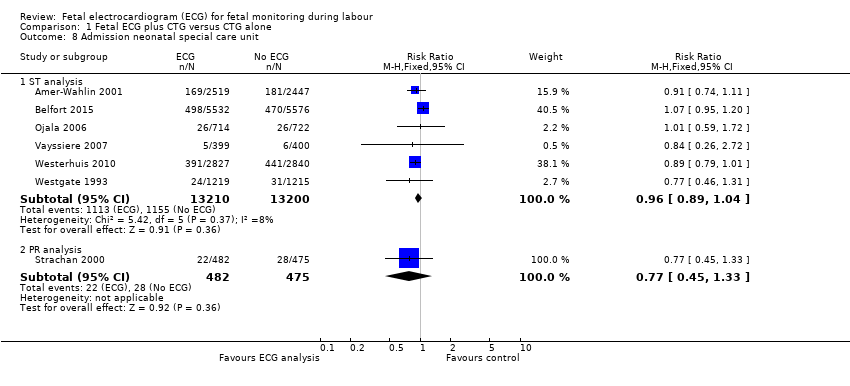
Comparison 1 Fetal ECG plus CTG versus CTG alone, Outcome 8 Admission neonatal special care unit.

Comparison 1 Fetal ECG plus CTG versus CTG alone, Outcome 9 Perinatal death.
| Fetal ECG (ST analysis) plus CTG versus CTG alone for fetal monitoring during labour | ||||||
| Patient or population: Pregnant women (and their fetuses) in labour, with a perceived need for continuous electronic fetal heart rate monitoring | ||||||
| Outcomes | Anticipated absolute effects* (95% CI) | Relative effect | № of participants | Quality of the evidence | Comments | |
| Risk with CTG alone | Risk with Fetal ECG plus CTG | |||||
| Caesarean section ‐ ST analysis | Study population | RR 1.02 | 26,446 | ⊕⊕⊕⊕ | ||
| 135 per 1000 | 137 per 1000 | |||||
| Moderate | ||||||
| 119 per 1000 | 121 per 1000 | |||||
| Cord pH less than 7.05 and base deficit greater than 12 mmol/L ‐ ST analysis | Study population | RR 0.72 | 25,682 | ⊕⊕⊕⊝ | ||
| 9 per 1000 | 7 per 1000 | |||||
| Moderate | ||||||
| 11 per 1000 | 8 per 1000 | |||||
| Neonatal encephalopathy ‐ ST analysis | Study population | RR 0.61 | 26,410 | ⊕⊕⊕⊕ | ||
| 2 per 1000 | 1 per 1000 | |||||
| Moderate | ||||||
| 2 per 1000 | 1 per 1000 | |||||
| Fetal blood sampling ‐ ST analysis | Study population | RR 0.61 | 9671 | ⊕⊕⊕⊕ | ||
| 154 per 1000 | 94 per 1000 | |||||
| Moderate | ||||||
| 131 per 1000 | 80 per 1000 | |||||
| Operative vaginal delivery ‐ ST analysis | Study population | RR 0.92 | 26,446 | ⊕⊕⊕⊕ | ||
| 113 per 1000 | 104 per 1000 | |||||
| Moderate | ||||||
| 133 per 1000 | 122 per 1000 | |||||
| Admission to neonatal special care unit ‐ ST analysis | Study population | RR 0.96 | 26410 | ⊕⊕⊕⊕ | ||
| 88 per 1000 | 84 per 1000 | |||||
| Moderate | ||||||
| 55 per 1000 | 53 per 1000 | |||||
| Perinatal death ‐ ST analysis | Study population | RR 1.71 | 26,446 | ⊕⊕⊕⊕ | ||
| 0 per 1000 | 1 per 1000 | |||||
| Moderate | ||||||
| 0 per 1000 | 1 per 1000 | |||||
| *The risk in the intervention group (and its 95% confidence interval) is based on the assumed risk in the comparison group and the relative effect of the intervention (and its 95% CI). | ||||||
| GRADE Working Group grades of evidence | ||||||
| 1 Some heterogeneity in findings (I2 55%) | ||||||
| Outcome or subgroup title | No. of studies | No. of participants | Statistical method | Effect size |
| 1 Caesarean section Show forest plot | 7 | Risk Ratio (M‐H, Fixed, 95% CI) | Subtotals only | |
| 1.1 ST analysis | 6 | 26446 | Risk Ratio (M‐H, Fixed, 95% CI) | 1.02 [0.96, 1.08] |
| 1.2 PR analysis | 1 | 957 | Risk Ratio (M‐H, Fixed, 95% CI) | 0.79 [0.61, 1.04] |
| 2 Cord pH < 7.05 + base deficit > 12 mmol/L Show forest plot | 6 | Risk Ratio (M‐H, Random, 95% CI) | Subtotals only | |
| 2.1 ST analysis | 6 | 25682 | Risk Ratio (M‐H, Random, 95% CI) | 0.72 [0.43, 1.20] |
| 2.2 PR analysis | 0 | 0 | Risk Ratio (M‐H, Random, 95% CI) | 0.0 [0.0, 0.0] |
| 3 Neonatal encephalopathy Show forest plot | 6 | Risk Ratio (M‐H, Fixed, 95% CI) | Subtotals only | |
| 3.1 ST analysis | 6 | 26410 | Risk Ratio (M‐H, Fixed, 95% CI) | 0.61 [0.30, 1.22] |
| 3.2 PR analysis | 0 | 0 | Risk Ratio (M‐H, Fixed, 95% CI) | 0.0 [0.0, 0.0] |
| 4 Fetal blood sampling Show forest plot | 5 | Risk Ratio (M‐H, Random, 95% CI) | Subtotals only | |
| 4.1 ST analysis | 4 | 9671 | Risk Ratio (M‐H, Random, 95% CI) | 0.61 [0.41, 0.91] |
| 4.2 PR analysis | 1 | 957 | Risk Ratio (M‐H, Random, 95% CI) | 0.91 [0.69, 1.19] |
| 5 Operative vaginal delivery Show forest plot | 7 | Risk Ratio (M‐H, Fixed, 95% CI) | Subtotals only | |
| 5.1 ST analysis | 6 | 26446 | Risk Ratio (M‐H, Fixed, 95% CI) | 0.92 [0.86, 0.99] |
| 5.2 PR analysis | 1 | 957 | Risk Ratio (M‐H, Fixed, 95% CI) | 0.94 [0.75, 1.17] |
| 6 Apgar score < 7 at 5 minutes Show forest plot | 6 | Risk Ratio (M‐H, Fixed, 95% CI) | Subtotals only | |
| 6.1 ST analysis | 5 | 15302 | Risk Ratio (M‐H, Fixed, 95% CI) | 0.95 [0.73, 1.24] |
| 6.2 PR analysis | 1 | 957 | Risk Ratio (M‐H, Fixed, 95% CI) | 0.42 [0.11, 1.62] |
| 7 Neonatal intubation Show forest plot | 3 | Risk Ratio (M‐H, Fixed, 95% CI) | Subtotals only | |
| 7.1 ST analysis | 2 | 12544 | Risk Ratio (M‐H, Fixed, 95% CI) | 1.37 [0.89, 2.11] |
| 7.2 PR analysis | 1 | 957 | Risk Ratio (M‐H, Fixed, 95% CI) | 0.74 [0.26, 2.11] |
| 8 Admission neonatal special care unit Show forest plot | 7 | Risk Ratio (M‐H, Fixed, 95% CI) | Subtotals only | |
| 8.1 ST analysis | 6 | 26410 | Risk Ratio (M‐H, Fixed, 95% CI) | 0.96 [0.89, 1.04] |
| 8.2 PR analysis | 1 | 957 | Risk Ratio (M‐H, Fixed, 95% CI) | 0.77 [0.45, 1.33] |
| 9 Perinatal death Show forest plot | 7 | Risk Ratio (M‐H, Fixed, 95% CI) | Subtotals only | |
| 9.1 ST analysis | 6 | 26446 | Risk Ratio (M‐H, Fixed, 95% CI) | 1.71 [0.67, 4.33] |
| 9.2 PR analysis | 1 | 957 | Risk Ratio (M‐H, Fixed, 95% CI) | 2.96 [0.12, 72.39] |