| 1 Total pain Show forest plot | 1 | | Mean Difference (IV, Fixed, 95% CI) | Subtotals only |
|
| 1.1 Three months of treatment | 1 | 35 | Mean Difference (IV, Fixed, 95% CI) | ‐4.95 [‐6.61, ‐3.29] |
| 1.2 Six months of treatment | 1 | 35 | Mean Difference (IV, Fixed, 95% CI) | ‐5.7 [‐7.51, ‐3.89] |
| 1.3 Six months after stopping treatment | 1 | 35 | Mean Difference (IV, Fixed, 95% CI) | ‐7.50 [‐9.38, ‐5.62] |
| 2 Pelvic pain Show forest plot | 1 | | Mean Difference (IV, Fixed, 95% CI) | Subtotals only |
|
| 2.1 Three months of treatment | 1 | 35 | Mean Difference (IV, Fixed, 95% CI) | ‐0.65 [‐0.90, ‐0.40] |
| 2.2 Six months of treatment | 1 | 35 | Mean Difference (IV, Fixed, 95% CI) | ‐1.40 [‐1.68, ‐1.12] |
| 2.3 Six months after stopping treatment | 1 | 35 | Mean Difference (IV, Fixed, 95% CI) | ‐1.05 [‐1.33, ‐0.77] |
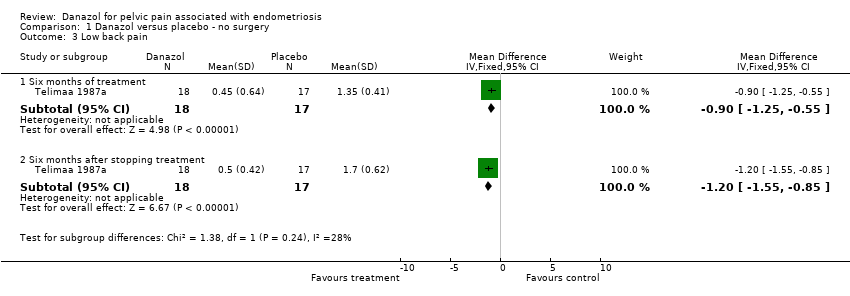
| 3 Low back pain Show forest plot | 1 | | Mean Difference (IV, Fixed, 95% CI) | Subtotals only |
|
| 3.1 Six months of treatment | 1 | 35 | Mean Difference (IV, Fixed, 95% CI) | ‐0.90 [‐1.25, ‐0.55] |
| 3.2 Six months after stopping treatment | 1 | 35 | Mean Difference (IV, Fixed, 95% CI) | ‐1.2 [‐1.55, ‐0.85] |
| 4 Defaecation pain Show forest plot | 1 | | Mean Difference (IV, Fixed, 95% CI) | Subtotals only |
|
| 4.1 6 months of treatment | 1 | 35 | Mean Difference (IV, Fixed, 95% CI) | ‐0.77 [‐1.10, ‐0.44] |
| 4.2 6 months after stopping treatment | 1 | 35 | Mean Difference (IV, Fixed, 95% CI) | ‐0.68 [‐0.99, ‐0.37] |
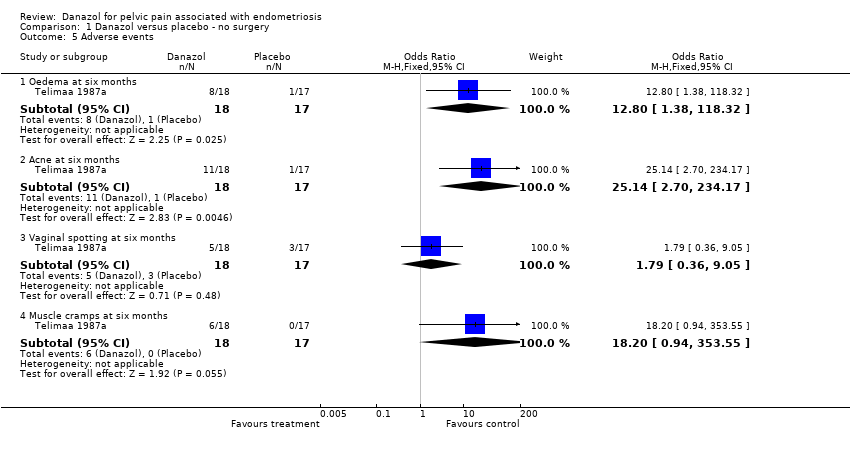
| 5 Adverse events Show forest plot | 1 | | Odds Ratio (M‐H, Fixed, 95% CI) | Subtotals only |
|
| 5.1 Oedema at six months | 1 | 35 | Odds Ratio (M‐H, Fixed, 95% CI) | 12.8 [1.38, 118.32] |
| 5.2 Acne at six months | 1 | 35 | Odds Ratio (M‐H, Fixed, 95% CI) | 25.14 [2.70, 234.17] |
| 5.3 Vaginal spotting at six months | 1 | 35 | Odds Ratio (M‐H, Fixed, 95% CI) | 1.79 [0.36, 9.05] |
| 5.4 Muscle cramps at six months | 1 | 35 | Odds Ratio (M‐H, Fixed, 95% CI) | 18.2 [0.94, 353.55] |
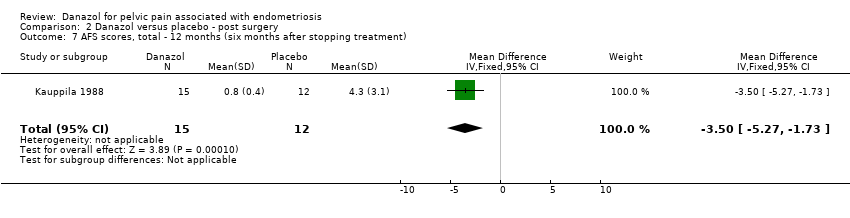
| 6 AFS scores, total ‐ 12 months (six months after stopping treatment) Show forest plot | 1 | 31 | Mean Difference (IV, Fixed, 95% CI) | ‐0.40 [‐1.58, 0.78] |
|
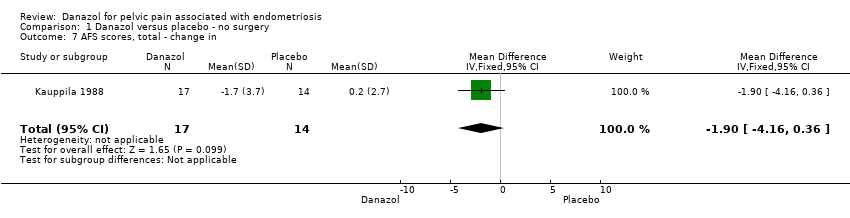
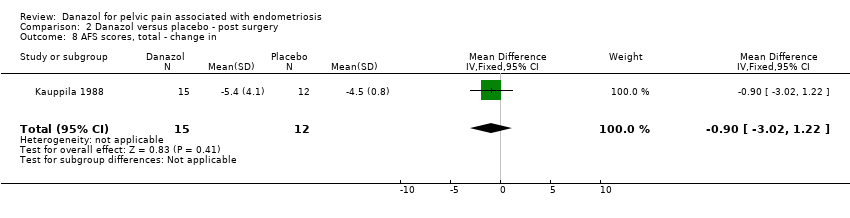
| 7 AFS scores, total ‐ change in Show forest plot | 1 | 31 | Mean Difference (IV, Fixed, 95% CI) | ‐1.9 [‐4.16, 0.36] |
|
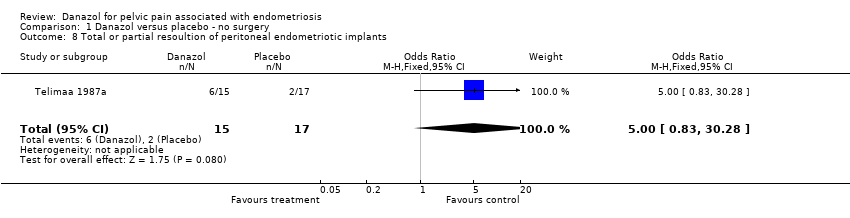
| 8 Total or partial resoultion of peritoneal endometriotic implants Show forest plot | 1 | 32 | Odds Ratio (M‐H, Fixed, 95% CI) | 5.0 [0.83, 30.28] |
|