Administración sistemática versus selectiva de antimicóticos para el control de las infecciones fúngicas en pacientes con cáncer
Información
- DOI:
- https://doi.org/10.1002/14651858.CD000026.pub2Copiar DOI

- Base de datos:
-
- Cochrane Database of Systematic Reviews
- Versión publicada:
-
- 04 septiembre 2014see what's new
- Tipo:
-
- Intervention
- Etapa:
-
- Review
- Grupo Editorial Cochrane:
-
Grupo Cochrane de Cáncer ginecológico, neurooncología y otros cánceres
- Copyright:
-
- Copyright © 2017 The Cochrane Collaboration. Published by John Wiley & Sons, Ltd.
Cifras del artículo
Altmetric:
Citado por:
Autores
Contributions of authors
PCG wrote the protocol and the draft manuscript, did the searches and performed the statistical analyses. Both authors read the papers and extracted the data independently. HKJ commented on the various versions of the draft.
Sources of support
Internal sources
-
Rigshospitalet, Copenhagen, Denmark.
External sources
-
No sources of support supplied
Declarations of interest
Peter C Gøtzsche ‐ nothing to declare
Helle Krogh Johansennothing ‐ nothing to declare
Acknowledgements
We are grateful to the following investigators for having provided additional information on their trials: Dr Ellen Benhamou, Dr Hans Brincker, Dr Masataka Fukuda, Dr Jesse L Goodman, Dr Richard M Hansen, Dr Wolfgang Kern, Dr Marcio Nucci, Dr Jan Palmblad, Dr Andrew T Pavia, Dr John R Perfect, Professor Philip A Pizzo, Dr Ben E de Pauw, Dr Andreas Schaffner, Professor Gérard Schaison, Dr Jan Tollemar, Professor John R Wingard, and Dr Drew J Winston. We are grateful for the translation of the Japanese articles provided by Dr Hiroto Takada. We thank Bristol‐Myers Squibb and Janssen‐Cilag for supplementary literature searches. Finally, we thank Dr Hans Brincker for a useful discussion and Professor Peter Skinhøj for comments on the first published version of this meta‐analysis.
The National Institute for Health Research (NIHR) is the largest single funder of the Cochrane Gynaecological, Neuro‐oncology, Orphan Cancer Group. The views and opinions expressed therein are those of the authors and do not necessarily reflect those of the NIHR, NHS or the Department of Health.
Version history
| Published | Title | Stage | Authors | Version |
| 2014 Sep 04 | Routine versus selective antifungal administration for control of fungal infections in patients with cancer | Review | Peter C Gøtzsche, Helle Krogh Johansen | |
| 2002 Apr 22 | Routine versus selective antifungal administration for control of fungal infections in patients with cancer | Review | Peter C Gøtzsche, Helle Krogh Johansen | |
Differences between protocol and review
We have not recorded dropouts due to toxicity as they were reported rarely and inconsistently. We have added harms and also death ascribed to fungal infection as our research has shown that this outcome is reliable (Due 2006), contrary to our expectations.
Keywords
MeSH
Medical Subject Headings (MeSH) Keywords
- Antifungal Agents [*therapeutic use];
- Immunocompromised Host;
- Mycoses [complications, mortality, *prevention & control];
- Neoplasms [*complications, immunology, mortality];
- Neutropenia [complications];
- Opportunistic Infections [complications, mortality, *prevention & control];
- Randomized Controlled Trials as Topic;
Medical Subject Headings Check Words
Humans;
PICO
Comparison 1 Antifungals versus placebo or no treatment, Outcome 1 Death.

Comparison 1 Antifungals versus placebo or no treatment, Outcome 2 Death related to fungal infection.

Comparison 1 Antifungals versus placebo or no treatment, Outcome 3 Invasive infections.

Comparison 1 Antifungals versus placebo or no treatment, Outcome 4 Colonisation.
Comparison 1 Antifungals versus placebo or no treatment, Outcome 5 Use of escape drug.
| Trial | Trial drug | Number of patients | Harms |
| EORTC 1989 | amphotericin B | 80 versus 77 | Treatment discontinuations: 6 pts on trial drug (infusion‐related toxicity, allergic reactions); Nephrotoxicity: 8 versus 3, none required dialysis and renal function restored later; Hypokalaemia: 33 versus 16 |
| Goldstone 1994 | amphotericin B | 64 versus 69 | Treatment discontinuations: 4 on trial drug (chills, rigour, hypotension, rash and bronchospasm); Elevated liver function tests: 26 versus 32; Nephrotoxicity: 1 on trial drug that did not require withdrawal of therapy |
| Kelsey 1999 | amphotericin B | 74 versus 87 | Treatment discontinuations: 5 on trial drug, 1 on placebo because of immediate reactions; Nephrotoxicity: 9 versus 6; Hypokalaemia: 1 versus 0; Clinical adverse events were very similar in the two groups |
| Penack 2006. | amphotericin B | 75 versus 57 | Treatment discontinuations: 2 (1 skin rash, 1 chills) versus 0; Other harms: "no differences in ... liver function tests, renal function parameters and hypokalaemia" |
| Perfect 1992 | amphotericin B | 91 versus 91 | More infusion‐related harms on active drug, but no data provided; No significant differences in renal function, hepatic enzymes or electrolytes (no data provided) |
| Pizzo 1982 | amphotericin B | 18 versus 16 | Treatment discontinuations: none; Rash: 2 versus 1; Azotaemia: 1 versus 0; liver enzyme elevations: 2 versus 3; Electrolyte abnormalities: 18 versus 16 |
| Riley 1994 | amphotericin B | 17 versus 18 | Treatment discontinuations: none; Renal function: no difference (P value 0.82 for blood urea, P value 0.63 for creatinine); Potassium supplements: no difference; Infusion reactions: none |
| Suda 1980 | amphotericin B | 39 versus 31 | Article is in Japanese |
| Tollemar 1993 | amphotericin B | 42 versus 42 | Treatment discontinuations: 4 versus 0 for infusion reactions; Potassium supplementation: no difference; Renal function: no useful data, but only small changes reported, compared to normal ranges |
| Fukuda 1994 | fluconazole | 37 versus 26 | Article is in Japanese |
| Goodman 1992 | fluconazole | 179 versus 177 | Treatment discontinuations: 1 on trial drug, 2 on placebo for clinical side effects, and 17 versus 11 for elevated liver function tests; in 7 versus 3, hepatic dysfunction contributed to death; Graft‐versus‐host disease or organ failure: 44 versus 24 deaths; Nausea: 13 versus 9; Skin rash: 9 versus 9; Eosinophilia in 6 versus 0 |
| Kern 1998 | fluconazole | 36 versus 32 | Bacteriaemia: 15 versus 7; Other harms similar: 5 versus 6 elevations in transaminases, 19 versus 17 nausea or vomiting, 3 versus 0 allergy |
| Rotstein 1999 | fluconazole | 141 versus 133 | Treatment discontinuations: none reported; Elevated liver enzymes: 17 versus 19; Rash: 51 versus 59; Nausea: 106 versus 95; Vomiting: 68 versus 85 |
| Schaffner 1995 | fluconazole | 76 versus 76 episodes | Treatment discontinuations: none reported; No data on harms ("no significant differences were found") |
| Slavin 1995 | fluconazole | 152 versus 148 | Treatment discontinuations: 32 versus 31 for abnormal liver function; Graft‐versus‐host disease: 102 versus 85; Nausea: 33 versus 22; Seizures: 8 versus 9; Liver enzymes: no differences |
| Winston 1993 | fluconazole | 124 versus 133 | Treatment discontinuations: none reported; Elevated liver enzymes: 25 versus 14; Nausea and vomiting: 9 versus 5; Rash: 13 versus 7; Other harms were similarly distributed |
| Yamac 1995 | fluconazole | 41 versus 29 | Treatment discontinuations: none reported; Other harms: no data |
| Acuna 1981 | ketoconazole | 28 versus 24 | No data |
| Benhamou 1991 | ketoconazole | 63 versus 62 | Treatment discontinuations: 38 versus 14 (among them 2 patients with veno‐occlusive disease, 1 hepatitis, 3 skin rash in active group; none in placebo group); Severe gastrointestinal intolerance: 4 versus 7; Three‐fold greater values than normal for transaminases: 13 versus 8 |
| Brincker 1983 | ketoconazole | 19 versus 19 | One patient on trial drug stopped treatment because of universal exanthema |
| Estey 1984 | ketoconazole | 77 versus 73 | Bacterial infections: 33 versus 24 |
| Hansen 1987 | ketoconazole | 27 versus 29 | Treatment discontinuations: 2 on trial drug (1 skin rash and 1 elevated liver function tests); Bacterial infections: 20% versus 15% of neutropenic episodes |
| Hughes 1983 | ketoconazole | 42 versus 22 | Treatment discontinuations:1 on trial drug (nausea and anorexia); Other harms: 2 nausea and anorexia, 1 abdominal pain, 1 transient rash, all on trial drug |
| Palmblad 1992 | ketoconazole | 55 versus 61 | Treatment discontinuations: 2 (elevated transaminases) versus 6 (1 elevated transaminases, 5 exanthema); Bacteriaemias: 37 versus 21 |
| Siegel 1982a | ketoconazole | 12 versus 13 | No data |
| Brincker 1978 | miconazole | 15 versus 15 | None ascribable to trial drug |
| Wingard 1987 | miconazole | 97 versus 111 | Treatment discontinuations: 1 (pruritis and flushing) versus 2 (1 rash, 1 nausea); Severe hypotension: 2 on trial drug |
| Caselli 1990 | itraconazole, amphotericin B, ketoconazole | 30 versus 10 | No data |
| Kaptan 2003 | itraconazole | 31 versus 24 | Treatment discontinuations: 2 on trial drug (cardiac arrhytmia and gastric irritation); "there was a clinical impression that hypokalaemia occurred at a greater rate in patients with itraconazole" |
| Menichetti 1999 | itraconazole | 201 versus 204 | Treatment discontinuations: 37 versus 27; Bacteriaemia: 47 versus 31; Elevated transaminases: 5 versus 3 |
| Nucci 2000 | itraconazole | 104 versus 106 | Treatment discontinuations: 3 versus 4; Skin rash: 3 versus 1; Elevated liver enzymes: 3 versus 4; Nausea: 2 on placebo |
| Vreugdenhil 1993 | itraconazole | 49 versus 49 | Treatment discontinuations: 1 (nausea) versus 1 (liver function deterioration); Liver function deterioration: 28 versus 22 episodes; Renal function deterioration: 4 versus 2 episodes |
| Outcome or subgroup title | No. of studies | No. of participants | Statistical method | Effect size |
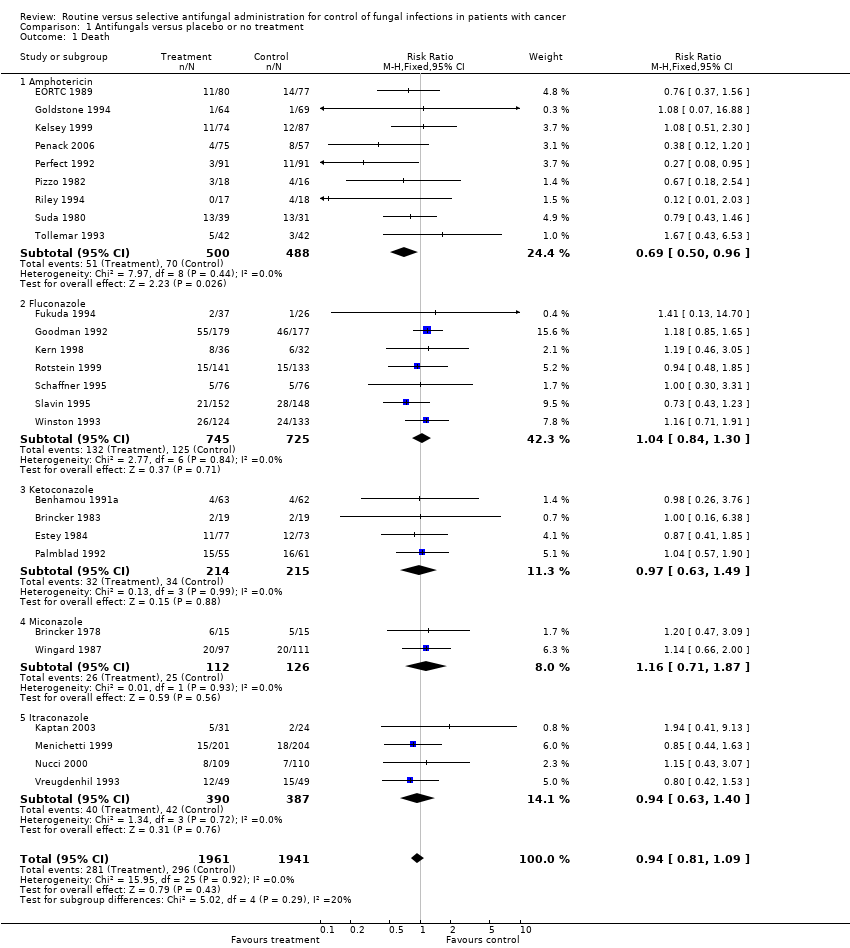
| 1 Death Show forest plot | 26 | 3902 | Risk Ratio (M‐H, Fixed, 95% CI) | 0.94 [0.81, 1.09] |
| 1.1 Amphotericin | 9 | 988 | Risk Ratio (M‐H, Fixed, 95% CI) | 0.69 [0.50, 0.96] |
| 1.2 Fluconazole | 7 | 1470 | Risk Ratio (M‐H, Fixed, 95% CI) | 1.04 [0.84, 1.30] |
| 1.3 Ketoconazole | 4 | 429 | Risk Ratio (M‐H, Fixed, 95% CI) | 0.97 [0.63, 1.49] |
| 1.4 Miconazole | 2 | 238 | Risk Ratio (M‐H, Fixed, 95% CI) | 1.16 [0.71, 1.87] |
| 1.5 Itraconazole | 4 | 777 | Risk Ratio (M‐H, Fixed, 95% CI) | 0.94 [0.63, 1.40] |
| 2 Death related to fungal infection Show forest plot | 23 | 3490 | Risk Ratio (M‐H, Fixed, 95% CI) | 0.52 [0.38, 0.71] |
| 2.1 Amphotericin | 9 | 988 | Risk Ratio (M‐H, Fixed, 95% CI) | 0.45 [0.26, 0.76] |
| 2.2 Fluconazole | 6 | 1213 | Risk Ratio (M‐H, Fixed, 95% CI) | 0.42 [0.24, 0.73] |
| 2.3 Ketoconazole | 3 | 304 | Risk Ratio (M‐H, Fixed, 95% CI) | 1.49 [0.55, 4.04] |
| 2.4 Miconazole | 1 | 208 | Risk Ratio (M‐H, Fixed, 95% CI) | 0.13 [0.01, 2.33] |
| 2.5 Itraconazole | 4 | 777 | Risk Ratio (M‐H, Fixed, 95% CI) | 0.70 [0.31, 1.56] |
| 3 Invasive infections Show forest plot | 30 | 4044 | Risk Ratio (M‐H, Fixed, 95% CI) | 0.50 [0.39, 0.64] |
| 3.1 Amphotericin | 8 | 855 | Risk Ratio (M‐H, Fixed, 95% CI) | 0.41 [0.24, 0.73] |
| 3.2 Fluconazole | 8 | 1539 | Risk Ratio (M‐H, Fixed, 95% CI) | 0.39 [0.27, 0.57] |
| 3.3 Ketoconazole | 7 | 562 | Risk Ratio (M‐H, Fixed, 95% CI) | 1.32 [0.68, 2.54] |
| 3.4 Miconazole | 2 | 238 | Risk Ratio (M‐H, Fixed, 95% CI) | 0.52 [0.20, 1.31] |
| 3.5 Itraconazole | 4 | 810 | Risk Ratio (M‐H, Fixed, 95% CI) | 0.53 [0.29, 0.97] |
| 3.6 Itraconazole/ketoconazole/amphotericin | 1 | 40 | Risk Ratio (M‐H, Fixed, 95% CI) | 0.0 [0.0, 0.0] |
| 4 Colonisation Show forest plot | 22 | Risk Ratio (M‐H, Random, 95% CI) | Subtotals only | |
| 4.1 Amphotericin | 3 | 378 | Risk Ratio (M‐H, Random, 95% CI) | 0.51 [0.33, 0.77] |
| 4.2 Fluconazole | 6 | 1393 | Risk Ratio (M‐H, Random, 95% CI) | 0.55 [0.33, 0.90] |
| 4.3 Ketoconazole | 8 | 626 | Risk Ratio (M‐H, Random, 95% CI) | 0.67 [0.51, 0.87] |
| 4.4 Miconazole | 2 | 238 | Risk Ratio (M‐H, Random, 95% CI) | 0.92 [0.37, 2.24] |
| 4.5 Itraconazole | 2 | 503 | Risk Ratio (M‐H, Random, 95% CI) | 0.91 [0.57, 1.45] |
| 4.6 Itraconazole/ketoconazole/amphotericin | 1 | 40 | Risk Ratio (M‐H, Random, 95% CI) | 0.57 [0.31, 1.04] |
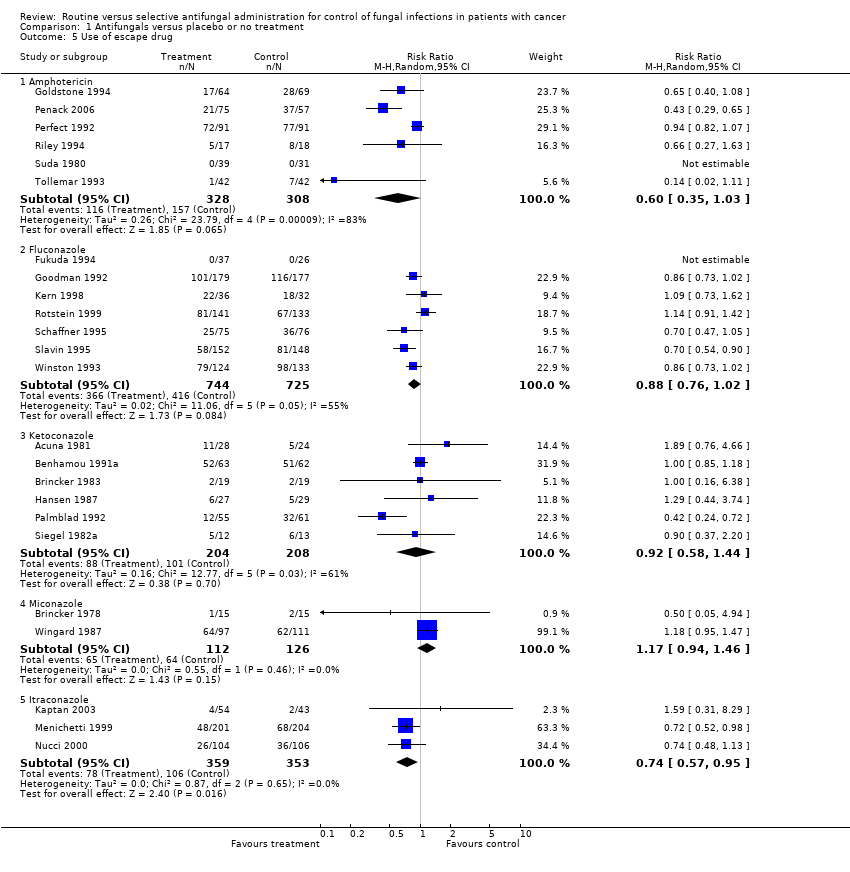
| 5 Use of escape drug Show forest plot | 24 | Risk Ratio (M‐H, Random, 95% CI) | Subtotals only | |
| 5.1 Amphotericin | 6 | 636 | Risk Ratio (M‐H, Random, 95% CI) | 0.60 [0.35, 1.03] |
| 5.2 Fluconazole | 7 | 1469 | Risk Ratio (M‐H, Random, 95% CI) | 0.88 [0.76, 1.02] |
| 5.3 Ketoconazole | 6 | 412 | Risk Ratio (M‐H, Random, 95% CI) | 0.92 [0.58, 1.44] |
| 5.4 Miconazole | 2 | 238 | Risk Ratio (M‐H, Random, 95% CI) | 1.17 [0.94, 1.46] |
| 5.5 Itraconazole | 3 | 712 | Risk Ratio (M‐H, Random, 95% CI) | 0.74 [0.57, 0.95] |