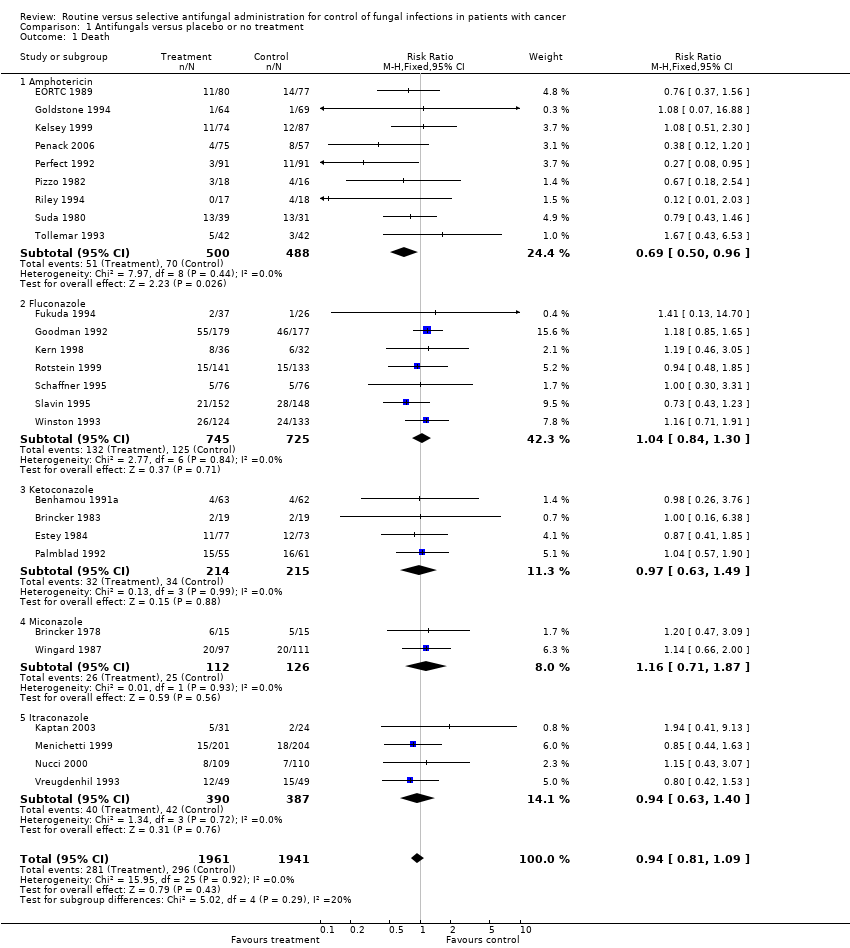
| 1 Death Show forest plot | 26 | 3902 | Risk Ratio (M‐H, Fixed, 95% CI) | 0.94 [0.81, 1.09] |
|
| 1.1 Amphotericin | 9 | 988 | Risk Ratio (M‐H, Fixed, 95% CI) | 0.69 [0.50, 0.96] |
| 1.2 Fluconazole | 7 | 1470 | Risk Ratio (M‐H, Fixed, 95% CI) | 1.04 [0.84, 1.30] |
| 1.3 Ketoconazole | 4 | 429 | Risk Ratio (M‐H, Fixed, 95% CI) | 0.97 [0.63, 1.49] |
| 1.4 Miconazole | 2 | 238 | Risk Ratio (M‐H, Fixed, 95% CI) | 1.16 [0.71, 1.87] |
| 1.5 Itraconazole | 4 | 777 | Risk Ratio (M‐H, Fixed, 95% CI) | 0.94 [0.63, 1.40] |
| 2 Death related to fungal infection Show forest plot | 23 | 3490 | Risk Ratio (M‐H, Fixed, 95% CI) | 0.52 [0.38, 0.71] |
|
| 2.1 Amphotericin | 9 | 988 | Risk Ratio (M‐H, Fixed, 95% CI) | 0.45 [0.26, 0.76] |
| 2.2 Fluconazole | 6 | 1213 | Risk Ratio (M‐H, Fixed, 95% CI) | 0.42 [0.24, 0.73] |
| 2.3 Ketoconazole | 3 | 304 | Risk Ratio (M‐H, Fixed, 95% CI) | 1.49 [0.55, 4.04] |
| 2.4 Miconazole | 1 | 208 | Risk Ratio (M‐H, Fixed, 95% CI) | 0.13 [0.01, 2.33] |
| 2.5 Itraconazole | 4 | 777 | Risk Ratio (M‐H, Fixed, 95% CI) | 0.70 [0.31, 1.56] |
| 3 Invasive infections Show forest plot | 30 | 4044 | Risk Ratio (M‐H, Fixed, 95% CI) | 0.50 [0.39, 0.64] |
|
| 3.1 Amphotericin | 8 | 855 | Risk Ratio (M‐H, Fixed, 95% CI) | 0.41 [0.24, 0.73] |
| 3.2 Fluconazole | 8 | 1539 | Risk Ratio (M‐H, Fixed, 95% CI) | 0.39 [0.27, 0.57] |
| 3.3 Ketoconazole | 7 | 562 | Risk Ratio (M‐H, Fixed, 95% CI) | 1.32 [0.68, 2.54] |
| 3.4 Miconazole | 2 | 238 | Risk Ratio (M‐H, Fixed, 95% CI) | 0.52 [0.20, 1.31] |
| 3.5 Itraconazole | 4 | 810 | Risk Ratio (M‐H, Fixed, 95% CI) | 0.53 [0.29, 0.97] |
| 3.6 Itraconazole/ketoconazole/amphotericin | 1 | 40 | Risk Ratio (M‐H, Fixed, 95% CI) | 0.0 [0.0, 0.0] |
| 4 Colonisation Show forest plot | 22 | | Risk Ratio (M‐H, Random, 95% CI) | Subtotals only |
|
| 4.1 Amphotericin | 3 | 378 | Risk Ratio (M‐H, Random, 95% CI) | 0.51 [0.33, 0.77] |
| 4.2 Fluconazole | 6 | 1393 | Risk Ratio (M‐H, Random, 95% CI) | 0.55 [0.33, 0.90] |
| 4.3 Ketoconazole | 8 | 626 | Risk Ratio (M‐H, Random, 95% CI) | 0.67 [0.51, 0.87] |
| 4.4 Miconazole | 2 | 238 | Risk Ratio (M‐H, Random, 95% CI) | 0.92 [0.37, 2.24] |
| 4.5 Itraconazole | 2 | 503 | Risk Ratio (M‐H, Random, 95% CI) | 0.91 [0.57, 1.45] |
| 4.6 Itraconazole/ketoconazole/amphotericin | 1 | 40 | Risk Ratio (M‐H, Random, 95% CI) | 0.57 [0.31, 1.04] |
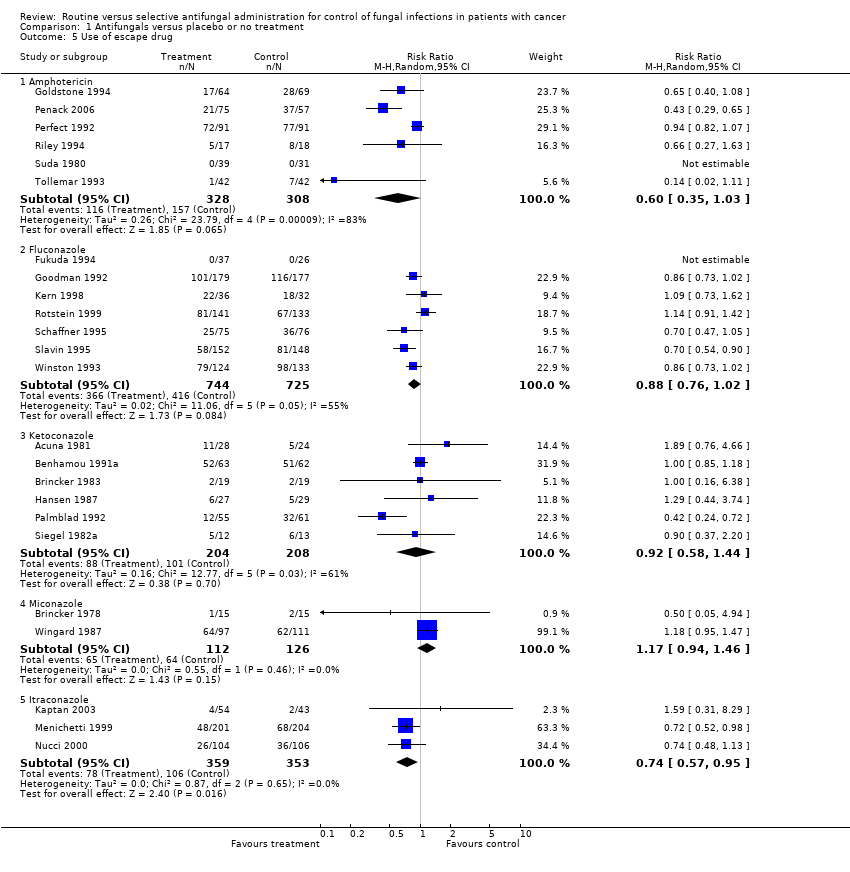
| 5 Use of escape drug Show forest plot | 24 | | Risk Ratio (M‐H, Random, 95% CI) | Subtotals only |
|
| 5.1 Amphotericin | 6 | 636 | Risk Ratio (M‐H, Random, 95% CI) | 0.60 [0.35, 1.03] |
| 5.2 Fluconazole | 7 | 1469 | Risk Ratio (M‐H, Random, 95% CI) | 0.88 [0.76, 1.02] |
| 5.3 Ketoconazole | 6 | 412 | Risk Ratio (M‐H, Random, 95% CI) | 0.92 [0.58, 1.44] |
| 5.4 Miconazole | 2 | 238 | Risk Ratio (M‐H, Random, 95% CI) | 1.17 [0.94, 1.46] |
| 5.5 Itraconazole | 3 | 712 | Risk Ratio (M‐H, Random, 95% CI) | 0.74 [0.57, 0.95] |