Advocacy interventions to reduce or eliminate violence and promote the physical and psychosocial well‐being of women who experience intimate partner abuse
Abstract
Background
Intimate partner abuse is common worldwide, damaging the short‐ and long‐term physical, mental, and emotional health of survivors and children. Advocacy may contribute to reducing abuse, empowering women to improve their situation by providing informal counselling and support for safety planning and increasing access to different services. Advocacy may be a stand‐alone service, accepting referrals from healthcare providers, or part of a multi‐component (and possibly multi‐agency) intervention provided by service staff or others.
Objectives
To assess the effects of advocacy interventions within or outside healthcare settings in women who have experienced intimate partner abuse.
Search methods
In April 2015, we searched CENTRAL, Ovid MEDLINE, EMBASE, and 10 other databases. We also searched WHO ICTRP, mRCT, and UK Clinical Research Network (UKCRN), and examined relevant websites and reference lists with forward citation tracking of included studies. For the original review we handsearched six key journals. We also contacted first authors of eligible papers and experts in the field.
Selection criteria
Randomised or quasi‐randomised controlled trials comparing advocacy interventions for women with experience of intimate partner abuse versus no intervention or usual care (if advocacy was minimal and fewer than 20% of women received it).
Data collection and analysis
Two review authors independently assessed risk of bias and undertook data extraction. We contacted authors for missing information needed to calculate statistics for the review and looked for adverse events.
Main results
We included 13 trials involving 2141 participants aged 15 to 65 years, frequently having low socioeconomic status.
The studies were quite heterogeneous in terms of methodology, study processes and design, including with regard to the duration of follow‐up (postintervention to three years), although this was not associated with differences in effect. The studies also had considerable clinical heterogeneity in relation to staff delivering advocacy; setting (community, shelter, antenatal, healthcare); advocacy intensity (from 30 minutes to 80 hours); and abuse severity. Three trials evaluated advocacy within multi‐component interventions. Eleven measured some form of abuse (eight scales), six assessed quality of life (three scales), and six measured depression (three scales). Countries and ethnic groups varied (one or more minority ethnic groups in the USA or UK, and local populations in Hong Kong and Peru). Setting was associated with intensity and duration of advocacy.
Risk of bias was high in five studies, moderate in five, and low in three. The quality of evidence (considering multiple factors such as risk of bias, study size, missing data) was moderate to low for brief advocacy and very low for intensive advocacy.
Incidence of abuse
Physical abuse
Moderate quality pooled data from two healthcare studies (moderate risk of bias) and one community study (low risk of bias), all with 12‐month follow‐up data, showed no effect on physical abuse for brief (< 12 hours) advocacy interventions (standardised mean difference (SMD) 0.00, 95% confidence interval (CI) ‐ 0.17 to 0.16; n = 558). One antenatal study (low risk of bias) showed an association between brief advocacy and reduced minor physical abuse at one year (mean difference (MD) change ‐ 1.00, 95% CI ‐ 1.82 to ‐ 0.18; n = 110). An antenatal, multi‐component study showed a greater likelihood of physical abuse ending (odds ratio (OR) 0.42, 95% CI 0.23 to 0.75) immediately after advocacy (number needed to treat (NNT) = 8); we cannot exclude impact from other components.
Low to very low quality evidence from two intensive advocacy trials (12 hours plus duration) showed reduced severe physical abuse in women leaving a shelter at 24 months (OR 0.39, 95% CI 0.20 to 0.77; NNT = 8), but not at 12 or 36 months.
Sexual abuse
Meta‐analysis of two studies (n = 239) showed no effect of advocacy on sexual abuse (SMD ‐ 0.12, 95% CI ‐ 0.37 to 0.14), agreeing with the change score (MD ‐ 0.07, 95% CI ‐ 0.30 to 0.16) from a third study and the OR (0.96, 95% CI 0.44 to 2.12) from a fourth antenatal, multi‐component study.
Emotional abuse
One study in antenatal care, rated at low risk of bias, showed reduced emotional abuse at ≤ 12‐month follow‐up (MD (change score) ‐ 4.24, 95% CI ‐ 6.42 to ‐ 2.06; n = 110).
Psychosocial health
Quality of life
Meta‐analysis of two studies (high risk of bias) showed intensive advocacy slightly improved overall quality of life of women recruited from shelters (MD 0.23, 95% CI 0.00 to 0.46; n = 343) at 12‐month follow‐up, with greater improvement in perceived physical quality of life from a primary care study (high risk of bias; MD 4.90, 95% CI 0.98 to 8.82) immediately postintervention.
Depression
Meta‐analysis of two studies in healthcare settings, one at high risk of bias and one at moderate risk, showed that fewer women developed depression (OR 0.31, 95% CI 0.15 to 0.65; n = 149; NNT = 4) with brief advocacy. One study at high risk of bias reported a slight reduction in depression in pregnant women immediately after the intervention (OR 0.51, 95% CI 0.20 to 1.29; n = 103; NNT = 8).
There was no evidence that intensive advocacy reduced depression at ≤ 12‐month follow‐up (MD ‐ 0.14, 95% CI ‐ 0.33 to 0.05; 3 studies; n = 446) or at two years (SMD − 0.12, 95% CI − 0.36 to 0.12; 1 study; n = 265).
Adverse effects
Two women died, one who was murdered by her partner and one who committed suicide. No evidence links either death to study participation.
Authors' conclusions
Results suggest some benefits from advocacy. However, most studies were underpowered. Clinical and methodological heterogeneity largely precluded pooling of trials. Therefore, there is uncertainty about the magnitude of benefit, the impact of abuse severity, and the setting.
Based on the evidence reviewed, intensive advocacy may improve short‐term quality of life and reduce physical abuse one to two years after the intervention for women recruited from domestic violence shelters or refuges. Brief advocacy may provide small short‐term mental health benefits and reduce abuse, particularly in pregnant women and for less severe abuse.
PICOs
Plain language summary
Advocacy interventions to help women who experience intimate partner abuse to access community resources
Background
Partner abuse (domestic violence) is common worldwide. It includes physical, emotional, and sexual abuse; threats; withholding money; causing injury; and long‐lasting physical and emotional health problems. Advocacy (active support by trained people) may help women make safety plans, deal with abuse, and access community resources.
Evidence on the effects of advocacy will help service planning and provision.
Method
We searched scientific literature worldwide up to April 2015 for clinical trials comparing advocacy for abused women with no care or usual care, to understand whether advocacy was safe and effective. We found 13 trials conducted in several countries, involving 2141 women from various ethnic groups, aged 15 to 65 years and often poor.
Studies varied in terms of advocacy duration (30 minutes to 80 hours) and participating staff (students, nurses, professional advocates, psychologists, social workers, community health workers, mothers in antenatal clinics, researchers). Eleven measured abuse, six assessed quality of life, and six measured depression. Three considered advocacy plus psychiatric help. Most studies followed up on the women for at least a year.
Studies recruited women from healthcare settings, domestic violence refuges/shelters, and community centres. Brief advocacy (up to 12 hours) was most common in healthcare settings, and intensive advocacy (more than 12 hours) was more common in other settings.
Key outcomes
Quality of the evidence
Five studies had design flaws that entailed a high risk of biasing their results, while five had moderate risk and three studies had low risk.
Physical abuse
After one year, brief advocacy had no effect in two healthcare studies of moderate quality or in one community study at low risk of bias, but it reduced minor abuse in another antenatal care study (low risk of bias). Another antenatal study showed reduced abuse immediately after brief advocacy (with one woman likely to benefit if eight received the advocacy), but women were also treated for depression, which may have affected results. Two studies provided weak evidence that intensive advocacy reduces physical abuse up to two years after the intervention (with one in eight women likely to benefit).
Sexual abuse
Four studies failed to show benefits from advocacy for sexual abuse.
Emotional abuse
One antenatal care study (low risk of bias) reported reduced emotional abuse at 12 months after advocacy.
Depression
Brief advocacy prevented depression in abused women attending healthcare services and pregnant women immediately after advocacy (with one woman likely to benefit for every four to eight treated). Intensive advocacy did not reduce depression in shelter women followed up at 12 and 24 months. The moderate‐to‐low quality evidence came mostly from studies with a low risk of bias.
Quality of life
Three brief advocacy trials found no benefit on quality of life. Intensive advocacy showed a weak benefit in two studies in domestic violence shelters/refuges. A primary care study (high risk of bias) showed improved motivation to do daily tasks immediately after advocacy.
Deaths
Two women died: one was murdered by her partner and one committed suicide; however, investigators did not consider these deaths to be related to the studies.
Conclusions
Intensive advocacy may improve everyday life for women in domestic violence shelters/refuges in the short term and reduce physical abuse one to two years after the intervention. There is no clear evidence that intensive advocacy reduces sexual, emotional, or overall abuse, or that it benefits women’s mental health. It is unclear whether brief advocacy (mostly given in healthcare settings) is effective, although it may provide short‐term mental health benefits and reduce abuse, particularly in pregnant women and those suffering less severe abuse.
We considered the results of several studies to be potentially biased because of weak study designs. There was little consistency between studies, with variations in the amount of advocacy given, the type of benefits measured, and the lengths of follow‐up periods. As a result, it was hard to combine their results, and we cannot be certain of how much advocacy interventions benefit women or the impact of the type of advocacy, the place it was given, or the severity of the abuse experienced by the women receiving the intervention.
Authors' conclusions
Summary of findings
| Intensive advocacy interventions for women who experience intimate partner abuse versus usual care at up to 12‐month follow‐up | ||||||
| Patient or population: women with intimate partner abuse | ||||||
| Outcomes | Illustrative comparative risks* (95% CI) | Relative effect | No. of participants | Quality of the evidence | Comments | |
| Assumed risk | Corresponding risk | |||||
| Control | Intensive advocacy interventions | |||||
| Physical abuse | The mean physical abuse in the control groups was | The mean physical abuse in the intervention groups was 0.12 lower (0.39 lower to 0.15 higher) | — | 265 | ⊕⊕⊝⊝ | |
| Physical abuse (dichotomous outcome) | Study population | OR 0.61 | 182 | ⊕⊝⊝⊝ | ||
| 453 per 1000 | 336 per 1000 (215 to 486) | |||||
| Moderate effect | ||||||
| Emotional abuse (dichotomous outcome) | Study population | OR 0.58 | 141 | ⊕⊕⊕⊝ | ||
| 557 per 1000 | 422 per 1000 (274 to 587) | |||||
| Moderate effect | ||||||
| Emotional abuse | The mean emotional abuse in the control groups was 1.4 | The mean emotional abuse in the intervention groups was 0.02 lower (0.16 lower to 0.12 higher) | — | 265 | ⊕⊝⊝⊝ | |
| Overall abuse Other study used Composite Abuse Scale (CAS)i (30 items presented in a 6‐point format requiring respondents to answer 'never', 'only once', 'several times', 'monthly', 'weekly' or 'daily' in a 12‐month period) | The mean overall abuse ranged across control groups from 0.58 to 27.10 | The mean overall abuse in the intervention groups was 0.23 standard deviations lower (0.53 lower to 0.08 higher) | — | 181 | ⊕⊝⊝⊝ | |
| Overall abuse (dichotomous outcome) | Study population | OR 0.72 | 103 | ⊕⊝⊝⊝ | ||
| 719 per 1000 | 648 per 1000 (426 to 821) | |||||
| Moderate effect | ||||||
| *The basis for the assumed risk (e.g. the median control group risk across studies) is provided in footnotes. The corresponding risk (and its 95% CI) is based on the assumed risk in the comparison group and the relative effect of the intervention (and its 95% CI). | ||||||
| GRADE Working Group grades of evidence | ||||||
| aInsufficient information available concerning random sequence generation, blinding and protection against contamination, and attrition bias. | ||||||
| Brief advocacy interventions for women who experience intimate partner abuse versus usual care at up to 12‐month follow‐up | |||||
| Patient or population: women with intimate partner abuse | |||||
| Outcomes | Illustrative comparative risks* (95% CI) | No. of participants | Quality of the evidence | Comments | |
| Assumed risk | Corresponding risk | ||||
| Control | Brief advocacy interventions | ||||
| Physical abuse | The mean physical abuse ranged across control groups from 0.45 to 12.6 | The mean physical abuse in the intervention groups was 0 standard deviations higher | 558 | ⊕⊕⊕⊝ | |
| Physical abuse by severity ‐ severe | The mean physical abuse by severity ‐ severe in the control groups was 0.17 | The mean physical abuse by severity ‐ severe in the intervention groups was 0.08 higher | 110 | ⊕⊕⊕⊝ | |
| Sexual abuse | The mean sexual abuse ranged across control groups from 0.10 to 0.14 | The mean sexual abuse in the intervention groups was 0.12 standard deviations lower | 239 | ⊕⊕⊕⊝ | |
| Sexual abuse | The mean sexual abuse in the control groups was − 0.06 | The mean sexual abuse in the intervention groups was 0.07 lower | 110 | ⊕⊕⊕⊝ | |
| Emotional abuse | The mean emotional abuse ranged across control groups from 12.11 to 24.80 | The mean emotional abuse in the intervention groups was 0.05 standard deviations lower | 558 | ⊕⊕⊝⊝ | |
| Emotional abuse | The mean emotional abuse in the control groups was − 1.92 | The mean emotional abuse in the intervention groups was 4.24 lower (6.42 lower to 2.06 lower) | 110 | ⊕⊕⊕⊝ | |
| Overall abuse | The mean overall abuse in the control groups was 23.39 | The mean overall abuse in the intervention groups was 7.74 standard deviations lower | 53 | ⊕⊕⊝⊝ | |
| *The basis for the assumed risk (e.g. the median control group risk across studies) is provided in footnotes. The corresponding risk (and its 95% CI) is based on the assumed risk in the comparison group and the relative effect of the intervention (and its 95% CI). | |||||
| GRADE Working Group grades of evidence | |||||
| aPartner Abuse Scale (PAS), physical subscale; 46‐item Severity of Violence Against Women Scale (SVAWS), physical violence subscale; Chinese version of the 39‐item Revised Conflicts Tactics Scale (CTS), psychological aggression subscale. | |||||
Background
Description of the condition
Intimate partner abuse
For the purpose of this review, intimate partner abuse (also known as domestic violence) is defined as the abuse of a woman by a male or female partner who currently is, or formerly was, in an intimate relationship with her. Intimate partner abuse perpetrated against male partners or ex‐partners also occurs, but it is not included in this review because the outcomes, and possibly the risks for partner violence, are likely to differ by gender. Most abuse with serious health and other consequences is committed by men against their female partners (Henwood 2000; Roe 2010). We also include abuse perpetrated by ex‐partners in the review, since a woman is often at greatest risk when she is preparing to leave or has just left her partner (Brownridge 2006). Women who leave violent relationships often continue to be abused, sometimes because the partner pursues them or because they choose to return (Campbell 2003; Campbell 2004; Holt 2013; Mullen 1999; Shalansky 1999). It is estimated that between 65% and 75% of women killed by abusive partners are leaving or have already ended the relationship (Wilson 1993). Intimate partner abuse may take various forms, including physical violence (ranging from slaps, punches, and kicks to choking, armed assault with a weapon, and homicide), sexual violence (such as forced sex or forced participation in sexual acts), emotionally abusive behaviours (such as stalking, surveillance, threats of abuse, threats to remove children from the household, prohibiting a woman from seeing her family and friends, ongoing belittlement or humiliation, and intimidation), economic restrictions (such as preventing a woman from working, confiscating her earnings, restricting access to funds), and other controlling behaviours (Watts 2002). The different forms of abuse often coexist, but they may also occur in isolation (Hegarty 2006).
Partner abuse may also coexist with other forms of violence within families, such as child abuse or elder abuse, but such abuse is not the focus of this review.
Prevalence of intimate partner abuse
The 2010/11 British Crime Survey found that 27% of women in England and Wales had some experience with domestic violence after the age of 16 (Chaplin 2011). Repeat victimisation accounted for three‐quarters (73%) of all such incidents. The global figure for prevalence of physical or intimate partner abuse reported by the World Health Organization (WHO) is 30% (WHO 2013a). Data collected in the United States in 2005 and in 2010 indicate that one out of every three to four women experience violence by a current or former partner at some point in their life, with 2 million injuries from intimate partner violence each year and nearly 18 million over their lifetimes (Black 2011; CDC 2008). The prevalence of intimate partner abuse among women seeking healthcare is higher than that of the general population (Feder 2009). In a primary care study, we found a lifetime experience of physical and sexual violence of 41%, with 17% of women experiencing such violence in the past year (Richardson 2002). Abuse of women by their partners is a global phenomenon, although most studies on it have taken place in industrialised countries (Krug 2002; Watts 2002). A WHO study that used standardised population‐based household surveys showed a lifetime prevalence of physical or sexual intimate partner abuse of 15% to 71% in 10 low‐ and middle‐income countries (Garcia‐Moreno 2006), while more recently, WHO 2013a cites a range of 23% to 37% depending on the region of the world.
The impact of intimate partner abuse on women's health
Intimate partner abuse can have short‐term and long‐term negative health consequences for survivors even after the abuse has ended (Campbell 2002). World Development Reports and statements from the United Nations emphasise that such violence is a significant cause of death and disability on a global scale (Ingram 2005; World Bank 2006), and the WHO highlights violence against women as a priority health issue (Krug 2002).
On average, two women in England and Wales are killed each week by their current or former partners. In 2008 to 2009, this cause accounted for 53% of all female homicide cases (Smith 2010). In the United States, it is estimated that partner abuse results in approximately 1200 female deaths each year (CDC 2003). Percentages may be even higher in less industrialised countries; internationally, the WHO reports that between 40% and 70% of female murder victims (depending on the country) were killed by a current or former partner (Krug 2002). Across all countries with available data, the WHO reports that partner violence is responsible for an average of 38% of all homicides of women (WHO 2013a).
Physical health of abused women
Intimate partner abuse is one of the most common causes of non‐fatal injury in women (Ellsberg 2008). In the USA, a review estimated that partner abuse to women accounted for 50% of all acute injuries and 21% of all injuries requiring urgent surgery (Guth 2000).
Abused women also experience many chronic health problems. The most consistent and largest physical health difference between abused and non‐abused women relates to gynaecological problems (e.g. sexually transmitted diseases (STDs), vaginal bleeding and infection, genital irritation, chronic pelvic pain, and urinary tract infections) (Campbell 2002). Population‐based studies from the United States show that the likelihood that abused women will exhibit these symptoms is three times greater than average (McCauley 1995). Women with a history of partner abuse are more likely to have had an induced abortion (WHO 2013a) and there is growing recognition that partner violence also increases a woman's risk of contracting HIV, either directly through unprotected contact with an infected man and indirectly through the effects of prolonged exposure to stress in their social context (Coker 2007; WHO 2013a). Moreover, in a UK study (John 2004), significantly more abused women complained of lower abdominal pain, dysmenorrhoea, dyspareunia, smear abnormalities, cancer worries, and bowel symptoms than did a group of non‐abused women.
Other conditions include chronic pain (e.g. headaches, back pain), central nervous system symptoms (e.g. fainting and seizures) (Bonomi 2009a; Campbell 2002; Diaz‐Olavarrieta 1999), self‐reported gastrointestinal symptoms (e.g. loss of appetite, eating disorders), diagnosed functional gastrointestinal disorders (e.g. irritable bowel syndrome) (Bonomi 2009a; Coker 2000; Diaz‐Olavarrieta 1999), and self‐reported cardiovascular symptoms (e.g. hypertension, chest pain) (Coker 2002; Tollestrup 1999).
Health of abused women during pregnancy
Research evidence shows that intimate partner abuse continues when a woman becomes pregnant (Silva 2011); indeed, it may even escalate (Gazmararian 2000; Mezey 1997). Campbell 2002 shows that prevalence rates of abuse during pregnancy are very similar in industrialised and non‐industrialised countries.
The health risks for abused mothers and their unborn children are substantial. The most serious outcome is the death of the mother (El Kady 2005; Parsons 1999) or the foetus (El Kady 2005; Jejeebhoy 1998). In well‐designed studies, the outcome most associated with partner abuse is low birth weight, although there is also evidence for increased risk of miscarriage (Gazmararian 2000; Taft 2004), preterm birth (Lipsky 2003), and foetal injury (Mezey 1997). A retrospective population‐based cohort study in Australia showed that pregnant women who were hospitalised for an incident of interpersonal violence carried almost twice the risk for adverse maternal complications compared with the non‐exposed group, and the overall risk for adverse foetal complications likewise increased twofold (Meuleners 2011).
Psychosocial health of abused women
Mental health problems are common sequelae of partner abuse (Ellsberg 2008; Rees 2011), with many survivors reporting that it is the psychological abuse, rather than the physical violence, which has the most long‐lasting adverse effects on their well‐being (Campbell 2002).
The most prevalent mental health sequelae of intimate partner abuse are post‐traumatic stress disorder, anxiety, and depressive disorders (Coid 2003; Trevillion 2012). These associations are also present for perinatal mental health disorders (Howard 2013). Women living in abusive relationships are two to three times more likely to be diagnosed for depression or psychosis (Rodriguez 2008; Stark 1996), and they often have feelings of low self‐esteem and hopelessness (Kirkwood 1993). Among Australian women attending general practice who have been abused, those who have experienced combined physical, emotional, and sexual abuse are much more likely to be diagnosed with depression than women who have only experienced one kind of abuse (Hegarty 2004). Living in a violent relationship may exacerbate a predisposition to depression; however, a woman's first exposure to abuse can also be a causal factor for subsequent depression (Campbell 1999; Silva 1997). Abused women are nearly four times as likely to suffer from post‐traumatic stress disorder than non‐abused women, and this can be directly related to experiencing intimate partner abuse (Golding 1999; Silva 1997). There is also evidence that increased suicidal tendencies are associated with abuse (Golding 1999; Leone 2011). Other signs of emotional distress associated with intimate partner abuse are self harm and parasuicide (Heath 2003; Stark 1996), sleep disturbances (Pigeon 2011; Ratner 1993), chronic fatigue (Cerulli 2011), and anxiety disorders (Cerulli 2011; Ratner 1993). A Nicaraguan study reported that 70% of cases of emotional distress in women were a direct consequence of abuse (Ellsberg 1999).
In industrialised countries, a further mental health problem associated with partner violence is the abuse of alcohol and drugs (Golding 1999; Graham 2011; McCauley 1995; Schumacher 2012). Substance abuse and intimate partner abuse often occur simultaneously. Women who have experienced physical or psychological violence are 15 times more likely to abuse alcohol and 9 times more likely to abuse drugs than non‐abused women (Stark 1996). There is also evidence that alcohol and drug abuse in some women is directly attributable to intimate partner abuse (Golding 1999; Stark 1996).
The impact of intimate partner abuse on health service usage
Women experiencing intimate partner abuse present to health services very frequently and require wide‐ranging medical services (Campbell 2002; Davidson 2001; Plichta 2007). They are admitted to hospital more often than non‐abused women and are prescribed more medication (Kernic 2000; Wisner 1999), particularly analgesia (Lo Fo Wong 2007). A Canadian study set in a hospital accident and emergency department showed that abused women access medical care three times more often than non‐abused women (Ratner 1993). There is also evidence of a positive linear relationship between severity of abuse and the use of healthcare services (Koss 1991).
It is difficult to calculate the economic impact of intimate partner abuse, but the costs are high. The estimated total cost of domestic violence to the UK in monetary terms is GBP 23 billion per annum. This figure includes an estimated cost to the state of GBP 3.1 billion, a cost to employers of GBP 1.3 billion, and human suffering costs of GBP 17 billion (Walby 2004). Likewise, studies looking at healthcare plans in the United States have found average healthcare costs to be significantly higher among abused compared with non‐abused women (Bonomi 2009b; Jones 2006). An Australian study estimated that in 2002 to 2003, the costs to the community were on the order of AUD 8.1 billion, with the main contributors being pain, suffering, and premature mortality (Access Economics 2004). In an update to that study, NCRVWC 2009 estimated that abuse of women resulted in a cost to the community of AUD 13.6 billion in 2009 to 2010 — again due mainly to pain, suffering, and premature mortality. Thus, in addition to the very serious individual health consequences associated with abuse, there are also wider economic implications for society.
Description of the intervention
Interventions to improve the health consequences for women who have experienced intimate partner abuse
Interventions may be primary, secondary, or tertiary. In the context of intimate partner abuse, primary interventions are concerned with preventing the onset of abuse, secondary interventions aim to prevent further abuse, and tertiary interventions deal with the consequences of abuse once it has ceased. This review focuses on secondary and tertiary interventions.
A range of interventions to help abused women have been evaluated. These may be classified as interventions aimed directly at the women (such as the provision of advocacy or therapy) and those aimed at improving the response of the professionals with whom they come into contact (such as the introduction of screening protocols or the provision of education and training on intimate partner abuse). In order to have clear evidence about what professionals can do to safely and effectively decrease the impact of intimate partner abuse on women, all such interventions need to be evaluated. To this end, we are conducting a suite of systematic reviews evaluating the effectiveness of interventions to improve the health outcomes of women who have experienced intimate partner abuse. This review examines the effectiveness of individual advocacy interventions. Our review of programmes to screen women for intimate partner violence has already been published (O'Doherty 2015).
Advocacy
In the context of domestic violence services, advocacy is a term that varies within and between countries, depending on institutional settings and historical developments around the role of advocates (Feder 2006a). Advocates, to whom women are often referred from doctors or other service providers, engage with abused women to empower them and liaise them with community services. In some health settings, they may also have a role in bringing about system change, catalysing increased recognition by clinicians of women experiencing abuse. For the purposes of this review we define the core activities of advocacy as:
-
providing legal, housing, and financial advice;
-
facilitating access to and use of community resources such as refuges or shelters, emergency housing, and psychological interventions;
-
giving safety planning advice; and
-
providing ongoing support and informal counselling.
A variety of advocates, including trained lay mentors, community, healthcare, and judicial service employees and volunteers, may deliver advocacy services for different time periods and at different intensities. Crisis or short‐term advocacy is of brief duration and involves the advocate working with the abused woman for a limited period of time (although the woman may then be referred on to other more specialised agencies). The duration of such advocacy depends on the needs of the abused woman but generally can range from a single meeting up to about 12 hours (Metters 2009 [pers comm]). More intensive, long‐term advocacy may involve weekly sessions for up to 12 months. We will explore the heterogeneous models of advocacy more deeply in the review itself, based on the descriptions of interventions in the primary studies.
How the intervention might work
Advocacy interventions are based around the concept of empowerment: talking through potential solutions with the woman rather than being prescriptive and telling her what she ought to do, helping the woman to achieve the goals she has set rather than being directive and setting the goals for her, and helping her to understand and make sense of the situation and her responses to it (Campbell 1993).
The aims of advocacy programmes are multifaceted and may include helping abused women to access services, guiding them through the process of safety planning, and improving abused women's physical or psychological health. Advocacy may be offered as a stand‐alone service or as part of a multi‐component (and possibly multi‐agency) intervention. Trials of complex multi‐component interventions are of increasing importance because of the drive to provide the most cost‐effective healthcare (Campbell 2000). Proponents of multi‐component interventions that include advocacy theorise that offering advocacy addresses an abused woman's immediate needs, which in turn allows her to be receptive to other interventions (such as psychotherapy or child care management).
Why it is important to do this review
Women experiencing intimate partner abuse have frequent contact with clinicians (Campbell 2002; Davidson 2001; Plichta 2007) and consider it appropriate that they ask questions about such violence (Burge 2005). They also identify healthcare professionals as potential sources of non‐judgemental, non‐directive support, as long as they demonstrate an appreciation for the complexity of intimate partner abuse (Feder 2006b). Historically, however, the quality of care for women experiencing domestic violence has been poor worldwide (Colombini 2008; Stark 1996). Many clinicians agree that domestic violence is a healthcare issue, but often they are reluctant to ask about abuse or do not respond appropriately if women talk about it (Gerber 2005; Gutmanis 2007; Ramsay 2012; Taft 2004). Such ambivalence is attributed to a number of factors, but frequently cited reasons include perceived time constraints and a lack of knowledge on how to support these women (Hegarty 2001; Waalen 2000). Offering abused women the opportunity to receive the services of a domestic violence advocate is one course of action that clinicians could easily initiate and which would circumvent the barriers they perceive to helping abused women. Other options include psychological interventions, refuge or shelter care without advocacy, or a basic first line response for healthcare professionals as recommended by the WHO (Feder 2013; WHO 2013b). Before recommending that clinicians who care for women experiencing intimate partner abuse initiate advocacy, however, it is first essential to establish the effectiveness of the interventions. The current review is an update of a review published in 2009 (Ramsay 2009) and follows the same basic protocol (Ramsay 2005b); any revisions to this protocol are highlighted in the section 'Differences between protocol and review'.
Objectives
To assess the effects of advocacy interventions within or outside healthcare settings in women who have experienced intimate partner abuse.
Methods
Criteria for considering studies for this review
Types of studies
Any randomised (i.e. random sequence generation) or quasi‐randomised (i.e. alternate allocation, allocation by birth date) controlled trials (RCTs or quasi‐RCTs) that allocated participants or clusters of participants to an advocacy intervention compared with no care or usual care.
Types of participants
Women aged 15 years and over who have experienced intimate partner abuse. Eligible studies could recruit women in healthcare settings as well as any other settings (such as criminal justice facilities, refuges/shelters, domestic violence agencies) if these studies reported data on health outcomes and if the findings were potentially transferable (e.g. if referral to an external advocacy agency was a plausible action by a healthcare professional).
Types of interventions
Any brief (less than 12 hours) or intensive (12 or more hours) advocacy intervention compared to no care or usual care.
Advocacy could be delivered either on an individual basis or in a group environment. We included studies if the intervention incorporated safety planning with the woman or facilitated access to and use of community resources, such as refuges or shelters, emergency housing, and psychological care. Provision of these services, either with or without ongoing informal support or counselling for the woman, was permissible. We also included studies where advocacy was evaluated as an adjunct to another intervention, such as the teaching of child management skills. In our earlier review we specified that multi‐component intervention studies would only be included where advocacy was the sole difference between the two trial arms (e.g. both arms would receive intervention A, but only one arm would receive the second intervention of advocacy). For the present review, however, we also included trials evaluating multi‐component interventions where advocacy plus some other form of intervention was compared with no care or usual care. The review team judged that this change was necessary given the increasing number of trials evaluating advocacy within the context of multi‐component interventions.
Similarly, for this updated review we have also incorporated a more rigorous definition of 'usual care'. We have defined this as care typically offered in the study setting, with the condition that such care only includes a minimal element of advocacy (such as the provision of information cards or leaflets listing the addresses and telephone numbers of local support agencies), or, if more substantive advocacy is offered, then less than 20% of women in the control arm received such care. The review team judged that this change was necessary given the increasing use of advocacy as part of usual care.
Types of outcome measures
We used the incidence of physical, sexual, emotional, and overall abuse as primary outcomes in summary of findings Table for the main comparison and summary of findings Table 2, presenting findings for intensive advocacy interventions and brief advocacy interventions, respectively.
Primary outcomes
Incidence of any form of abuse
-
Physical
-
Sexual
-
Emotional
-
Financial
-
Other (such as risk of death, harassment, reproduction coercion)
Abuse could be assessed using self‐reported measures (such as Composite Abuse Scale (CAS; Hegarty 2005), Index of Spouse Abuse (ISA; Hudson 1981), Women's Experience with Battering (WEB; Smith 1995), Conflict Tactics Scale (CTS; Straus 1979), or a single question about continuing abuse) or from observations of abuse in medical or police records.
Psychosocial health
-
Quality of life (measures such as 36‐item Short Form Health Survey, or SF‐3; Ware 1992)
-
Depression (measures such as Center for Epidemiologic Studies Depression Scale, or CES‐D; Radloff 1977)
-
Anxiety (measures such as Spielberger's State‐Trait Anxiety Inventory, or STAI; Spielberger 1983)
Secondary outcomes
Physical health
-
Deaths, all‐cause and partner abuse‐related (documented in medical/police records or regional and national databases)
-
Physical injuries, such as fractures and bruises (self‐reported or documented in medical and dental records)
-
Any chronic health disorders, such as gynaecological problems, chronic pain, and gastrointestinal disorders (self‐reported or documented in medical and dental records)
-
Any general measures of physical health (measures such as Daily Symptoms Questionnaire, DSQ; Terluin 2006)
-
Birth outcomes (self‐reported or documented in medical records)
Psychosocial health
-
Post‐traumatic stress (measures such as Impact of Events scale, or IES; Horowitz 1979)
-
Self efficacy (measures such as General Self Efficacy Scale, or GSES; Schwarzer 1995)
-
Self esteem (measures such as Rosenberg Self Esteem Scale, or SES; Rosenberg 1989)
-
Perceived social support (measures such as Sarason's Social Support Questionnaire, or SSQ; Sarason 1983)
-
Alcohol or drug abuse (measures such as Addiction Severity Index, or ASI; McLellan 1980)
-
Attempted suicide (self reported or documented in medical records)
-
Self harm (self reported or documented in medical records)
-
Impact on relationships (self reported)
Socioeconomic outcome measures
-
Income
-
Housing
-
Participation in education
-
Participation in work
'Proxy' or intermediate outcome measures (including uptake of referrals to other agencies)
-
Use of safety behaviours (e.g. use of coded telephone messages to a friend, keeping clothes at a friend's house, hiding emergency money)
-
Use of refuges/shelters
-
Use of counselling
-
Calls to police
-
Filing of police reports
-
Solicitation of protection orders
-
Maintenance of family ties (i.e. children staying with mother)
We recognised that postintervention changes in some of these proxy measures may be associated with both positive and negative health outcomes for abused women and require careful interpretation. For instance, increased refuge/shelter usage may reflect proactive behaviour on the behalf of abused women, but it may also reflect an escalation of violence that has led to the women needing to seek safety. Where authors reported any adverse outcomes from interventions, we recorded and discussed them in the narrative summary.
Timing of outcome assessment
We documented the duration of follow‐up in all included studies. We do not know the optimal period of follow‐up. Thus, while an intervention may have some immediate positive effects on the health of an abused woman (such as a reduction in physical violence), other outcomes may not be so readily apparent. For example, even many months after leaving an abusive relationship, a woman may be traumatised, and positive mental health effects may not be evident for some time. For the purposes of this review, we defined short‐term follow‐up as up to and including 12 months, medium‐term follow‐up as more than 12 and up to 24 months, and long‐term follow‐up as more than two years.
Search methods for identification of studies
We searched the international literature for peer‐reviewed and non‐peer reviewed studies. We did not use a study methods filter because we wanted the search to be as inclusive as possible. No language limits were applied. We ran the first searches for this update in September 2011 and March 2013, except for ASSIA and the British Nursing Index, which we ran in June and August 2013. We updated the search again in March 2014, except for ASSIA and the British Nursing Index, which we searched in April 2014. A further updated search was undertaken in April 2015. The authors of the original review searched the National Research Register, but as this database was discontinued in September 2007 we replaced it with UK Clinical Research Network Study Portfolio. Similarly, the Maternity and Infant Care database (M&IC) replaced the Midwives Information & Resource Service (MIDIRS).
Electronic searches
We searched the following list of electronic databases for this updated review in October 2011. Since then, we have rerun the searches three times, most recently in April 2015 (except where noted). The exact search dates and strategies for each source are reported in Appendix 1. The search strategies for the previous version of the review (up to 2008) are reported in Appendix 2.
-
Cochrane Central Register of Controlled Trials (CENTRAL; 2015, Issue 3; part of The Cochrane Library, and which includes the Specialised Register of the Cochrane Developmental Psychosocial and Learning Problems Group).
-
Ovid MEDLINE (1948 to April Week 1 2015).
-
EMBASE (1980 to 2015 Week 9; Ovid).
-
PsycINFO (1806 to April Week 1 2015; Ovid).
-
CINAHL Plus (1937 to current; EBSCOhost).
-
ASSIA (1987 to current; Cambridge Scientific Abstracts). Last searched in April 2014, after which it was no longer available to us.
-
Social Science Citation Index (SSCI; 1970 to 13 April 2015; Web of Science).
-
International Bibliography of Social Sciences (IBSS; 1951 to current; ProQuest)
-
British Nursing Index (BNI; 1994 to current; Proquest). Last searched April 2014, after which it was no longer available to us.
-
Health Management Information Consortium (HMIC; 1979 to March 2015; Ovid).
-
Maternity and Infant Care (1971 to March 2015; Ovid).
-
Cochrane Database of Systematic Reviews (CDSR; 2015, Issue 4; part of The Cochrane Library).
-
Database of Abstracts of Reviews of Effects (DARE; 2015, Issue 1; part of The Cochrane Library).
-
MetaRegister of Controlled Trials (mRCT; isrctn.com/page/mrct; all available years to March 2014). Not searched in April 2015 as website reported the service was "under review".
-
WHO International Clinical Trials Registry Platform (ICTRP; all available years; apps.who.int/trialsearch).
-
UK Clinical Research Network Study Portfolio (all available years; public.ukcrn.org.uk/search).
Searching other resources
Websites
We searched the websites of the WHO (who.int/topics/violence/en) and Violence Against Women Online Resources (vaw.umn.edu) in 2008, 2013 and 2014. We also searched the Violence Prevention website (preventviolence.info) in 2014. We accessed other women's health and domestic violence websites through links from full‐text articles obtained during the primary search. We explored these websites for relevant material or citations in a non‐systematic manner.
Handsearching
In 2004, we handsearched the following journals from 1980 to September 2004: American Journal of Public Health, Australian and New Zealand Journal of Public Health, Journal of Family Violence, Medical Journal of Australia, Violence and Victims, and Women's Health. We did not find any additional papers and so did not update handsearches beyond September 2004.
Citation tracking
We examined the reference lists of included papers and tracked citations forwards.
Other search strategies
In order to check for possible omissions, we emailed the first or corresponding authors of all primary studies included in the review. We also emailed relevant researchers, members of intimate partner abuse groups, and related organisations around the world, and we contacted an informal network of domestic violence researchers in Europe as well as the Department of Reproductive Health and Research at the WHO headquarters in Geneva.
Data collection and analysis
Selection of studies
We ran the searches twice for the original review (Ramsay 2009); once in 2006 and again in July 2008. We ran the searches four times for this update (September/October 2011, March to August 2013, March to April 2014, and April 2015).
Two review authors (in 2006, JR and either CR or DD; in 2008, JR and GF; in 2013, JR and either LS or CR; in 2014, CR and KH; and in 2015, CR and CB) independently reviewed the abstracts of articles identified by the search. Where possible, review authors resolved disagreements by discussion. When they could not reach a consensus, a third review author (GF in all cases) decided whether the study potentially fulfilled the inclusion criteria. We sought additional information from two study investigators in order to resolve inclusion queries at the abstract stage for the original review (Trifone 1994) and this update (Grip 2011).
Two review authors retrieved the full articles for selected abstracts and independently assessed each of the articles against the inclusion criteria. For the original review, there were no disagreements between the two reviewers about the appropriateness of a study for inclusion in the review. At the update, the wider review team was called on to discuss the potential inclusion of four studies (Bair‐Merritt 2010; Jouriles 2001; Jouriles 2009; Kiely 2010).
Data extraction and management
Working in pairs (JR, CR, DD, LS), one review author extracted data from included studies and entered it onto electronic collection forms, requesting any missing information from the first or corresponding authors of papers. We explicitly noted all instances of additional statistical data being provided by the study investigators in the text (see 'Effects of interventions'). A second author independently checked all data extractions. There were no new data extractions in 2015. The two review authors resolved all disagreements by discussion, and there was no need for adjudication by a third author. All relevant extracted data were entered into Review Manager (RevMan 2014).
We recorded the following information in the 'Characteristics of included studies' tables.
-
Methods: randomisation method, intention‐to‐treat analysis, and power calculation.
-
Participants: setting, country, inclusion criteria, exclusion criteria, numbers recruited, numbers dropped out, numbers analysed, age, ethnicity, socioeconomic status indicators, and educational background.
-
Interventions: brief descriptions of intervention (including frequency and duration of intervention events) and usual care provided.
-
Outcomes: timing of follow‐up events, outcomes assessed, and scales used.
-
Notes: where necessary, further information to aid understanding of the study.
Assessment of risk of bias in included studies
Risk of bias was assessed independently by two review authors (JR and GF for the 2009 review, and JR and either LS or CR for the 2013/14/15 update) in accordance with the Cochrane Handbook for Systematic Reviews of Interventions (Higgins 2008a, Higgins 2008b). Review authors independently assessed the extent to which each study attempted to control for six potential types of bias and assigned ratings of 'low risk of bias', 'high risk of bias', or 'unclear risk of bias' accordingly. We assessed studies as being at overall high risk of bias when there were at least three criteria conferring high risk of bias, or when one or two criteria were associated with high risk of bias (red in Figure 1) and the number of criteria with an unclear risk (yellow in Figure 1) exceeded the number of criteria with a low risk (green in Figure 1). We defined low overall risk of bias as occurring when a study had no high risk indicators and a maximum of two criteria conferring uncertain risk. We classified all other studies as having a moderate or intermediate risk of bias.

Risk of bias summary: review authors' judgements about each risk of bias item for each included study. Red circles with minus signs indicate high risk, green circles with plus signs indicate low risk, and yellow circles with question marks indicate unclear risk of bias.
Sequence generation
Description: The study contained a sufficiently detailed description of the method used to generate the allocation sequence so as to enable an assessment of whether it should have produced comparable groups.
Review authors' judgement: Was the allocation sequence adequately generated?
Ratings: Low risk of bias, high risk of bias, or unclear risk of bias.
Allocation concealment
Description: The study contained a sufficiently detailed description of the method used to conceal the allocation sequence, enabling an assessment of whether participants and staff could have foreseen intervention schedules before or during recruitment.
Review authors' judgement: Was allocation adequately concealed?
Ratings: Low risk of bias, high risk of bias, or unclear risk of bias.
Blinding
Description: The studies described any measures used to blind outcome assessors in sufficient detail so as to assess possible knowledge of which intervention a given participant might have received.
Review authors' judgement: Was knowledge of the allocated intervention adequately prevented during the study?
Ratings: Low risk of bias, high risk of bias, or unclear risk of bias.
Incomplete outcome data
Description: Studies reported (or authors provided) data on attrition, including the numbers involved (compared with total randomised) and the reasons.
Review authors' judgement: Were incomplete data dealt with adequately by the authors? (See also 'Dealing with missing data').
Ratings: Low risk of bias, high risk of bias, or unclear risk of bias.
Selective outcome reporting
Description: Investigators attempted to assess the possibility of selective outcome reporting.
Review authors' judgement: Were reports of the study free of suggestion of selective outcome reporting?
Ratings: Low risk of bias, high risk of bias, or unclear risk of bias.
Other sources of bias
Was the study apparently free of other problems that could put it at a high risk of bias?
We specified a priori that the following three criteria would be assessed under the heading 'Other sources of bias'.
Baseline measurement of outcome measures
Description: Studies contained information on the comparability of the groups in terms of the primary outcome measures at baseline.
Review authors' judgements: Were the primary outcomes comparable between groups at baseline?
Ratings: Low risk of bias, high risk of bias, or unclear risk of bias.
Reliability of primary outcome measures
Description: Investigators assessed the primary outcomes using reliable measures (e.g. Cronbach's alpha 0.6 or above).
Review authors' judgements: Did investigators assess the primary outcomes using reliable measures?
Ratings: Low risk of bias, high risk of bias, or unclear risk of bias.
Protection against contamination
Description: Investigators described any measures taken to prevent or minimise the possibility that women in the control arm might receive part or all of the intervention so as to assess possible contamination between groups.
Review authors' judgements: Did the study investigators take steps to prevent or minimise contamination?
Ratings: Low risk of bias, high risk of bias, or unclear risk of bias.
Measures of treatment effect
Binary outcomes
For binary outcomes, a standardised estimation of the odds ratio (OR) with a 95% confidence interval (CI) was calculated. If studies did not report, or the authors did not provide, the data to calculate the OR, we provided the findings as stated by the study authors.
Continuous outcomes
We analysed continuous data where means (or mean changes) and standard deviations (SD) were available from the reports or the study authors. In those instances where means and SDs were not available, we provided the findings as reported by the study authors. Where mean changes and SDs were reported but the distribution was skewed (most likely because of the small sample size), we assumed a normal distribution and analysed the data accordingly. The majority of studies included in the review used a range of scales to measure similar outcomes, so we standardised the treatment effects for these outcomes by dividing the mean difference (MD) in postintervention scores or change from baseline scores for the intervention and control groups by the pooled SD of the outcome among participants, generating a standardised mean difference (SMD) with 95% CIs. For the few outcomes that were assessed using the same scale, we calculated the MD. We were slightly constrained by the way studies reported these data, given that the MD in postintervention scores and mean change from baseline scores are not identical, but we have stated the measure used in the results.
Unit of analysis issues
For cluster‐randomised controlled trials, where the clustering unit was an organisation (e.g. general practice), we used results directly from publications that accounted for clustering, or we contacted authors to provide results that accounted for clustering. Where clustering was by time period (e.g. weeks), we assumed that the intracluster correlation coefficient (ICC) would be small and did not account for clustering.
Dealing with missing data
Missing data and dropout rates were assessed for each of the included studies. The 'Characteristics of included studies' tables specify the number of participants included in the final analysis as a proportion of all participants in the study. Where available, we provided the reasons given for missing data in the narrative summary. We assessed the extent to which studies conformed to an intention‐to‐treat analysis. For dichotomous measures, we planned to run best case and worst case scenario analyses to estimate the effects of missing data on the results of all studies that were pooled. This meant that we were able to ascertain if observed effect sizes increased or decreased as a function of the extent of attrition in the two arms (intervention and control) of the trial. We tested four assumptions: that women who dropped out of the intervention would have improved outcomes while women who dropped out of the control arm would not; that women who dropped out from the intervention and control groups would both have improved outcomes; that women who dropped out of the intervention would not have improved outcomes while women who dropped out of the control arm would; and that neither women in the intervention nor in the control groups who dropped out would have improved outcomes.
Assessment of heterogeneity
There was considerable clinical heterogeneity across the studies in relation to differences in the intensity of the advocacy interventions provided, the severity of abuse experienced, the setting where advocacy was provided, the ethnicities (including whether minority or not) of participants, whether or not advocacy was part of a multi‐component intervention, and the outcomes measured. There was also considerable methodological heterogeneity with regard to randomisation, control arm design, follow‐up timing, and scales for measuring outcomes, which were often not comparable. For example, some studies reported a total score for an outcome, while others reported only the subscale totals of different measures.
For studies included in a meta‐analysis, we assessed the consistency of results visually and by examining the I² statistic, which estimates the proportion of variation in point measures due to heterogeneity rather than sampling error (Higgins 2002).
Assessment of reporting biases
The small absolute number of studies that could be pooled in this review precluded the use of funnel plots. Please see Table 1 for methods archived for future updates of this review.
| Issue | Method |
| Assessment of reporting bias | We planned to draw funnel plots to investigate possible relationships between effect size and study precision, closely related to sample size (Egger 1997). For meaningful funnel plots, a large number of trials with a spread of sample sizes are required (Glasziou 2001; Hayashino 2005). We planned to draw funnel plots if there were at least 7 trials with appropriate data. |
| Subgroup analyses and investigation of heterogeneity | We plan to perform subgroup analyses for the following.
Theoretical justification for subgroup analyses.
|
| Sensitivity analyses | To assess the robustness of conclusions to quality of data and approaches to analysis, we will perform sensitivity analyses, including the following.
|
Data synthesis
Where comparable data were available, we planned to perform meta‐analyses. The decision whether to pool data in this way was determined by the comparability of populations and interventions (clinical heterogeneity); the duration of follow‐up (methodological heterogeneity); and the outcomes being used in the primary studies (see 'Assessment of heterogeneity'). Where it was inappropriate to combine the data in a meta‐analysis, we have presented the effect sizes and 95% CIs for individual outcomes in individual studies. Fixed‐effect models were used in all analyses given that all meta‐analyses were based on subsets of studies that were deemed clinically heterogeneous.
Subgroup analysis and investigation of heterogeneity
We did not identify enough studies meeting our criteria to perform subgroup analyses as planned in the protocol for this review. Methods archived for future updates appear in Table 1.
Sensitivity analysis
We did not identify enough studies meeting our criteria to perform sensitivity analyses as planned in the protocol for this review. Methods archived for future updates appear in Table 1.
Summary of findings table
We developed the 'Summary of findings' tables using the Cochrane Collaboration's Grades of Recommendations, Assessment, Development, and Evaluation (GRADE) wizard function, GRADEprofiler (GRADEpro 2014), assessing the quality of the body of evidence for each outcome. We used our 'Risk of bias' assessments in combination with GRADE criteria, such as sample size and dropout, in order to determine quality.
Future updates
Review authors intend to update this review after a period of three years.
Results
Description of studies
Results of the search
See Figure 2 for the flow diagram.

Review flow diagram.
IPV: intimate partner violence; RCT: randomised controlled trial.
We ran initial searches in 2006 for a much wider 'scoping' review of the intervention literature around intimate partner abuse. For this broad search, we found approximately 17,700 records. One of the questions we addressed in the scoping review was whether women‐centred interventions (advocacy, support groups, and psychological approaches) were effective in helping to improve the health and well‐being of abused women and their children; we assessed 228 full papers in order to address this question. Of these, 10 RCTs (2 of which were quasi‐RCTs; McFarlane 2000; McFarlane 2006), reported in 18 articles, met inclusion criteria for this review.
We re‐ran our searches in a more focused manner in July 2008, identifying a total of 1021 records. As a result of this search, we assessed the full text of two additional papers (both of which were subsequently excluded, one because it had no intervention and one because it considered HIV/STDs, with no separate data for abused women).
For the present update, we initially re‐ran the searches in September 2011 and then again in March 2013 (with two databases being searched in June and August 2013), March 2014 (with two databases searched in April 2014), and April 2015. We found a total of 11,112 records. Sixty‐two full‐text articles were identified for further review, and of these, we selected five new RCTs for inclusion in the review. We also found three additional studies, but these are not included in this update because of unavailable subgroup data for Bair‐Merritt 2010, and unavailable data for Niolon 2009 and Prosman 2014. All three studies are currently awaiting assessment (Studies awaiting classification).
Four potentially relevant but still ongoing studies have been identified since the original review (Lako 2013; NCT01207258; NCT01661504; NCT00465556), but data are not yet available for these. We aim to include these in the next update if relevant.
Included studies
Thirteen studies, reported in 21 papers, met the criteria for inclusion in this review (Constantino 2005; Cripe 2010; Gillum 2009; Hyman 2001; Kiely 2010; McFarlane 2000; McFarlane 2006; Sullivan 1991; Sullivan 1992; Sullivan 2002; Taft 2011; Tiwari 2005; Tiwari 2010). Where studies report data in more than one paper, we only use the primary reference (or the paper deemed most relevant if published within the same year).
All but two included studies were RCTs; the quasi‐RCTs were McFarlane 2000 and McFarlane 2006. In 10 studies, the women were the unit of randomisation (Constantino 2005; Cripe 2010; Gillum 2009; Hyman 2001; Kiely 2010; Sullivan 1991; Sullivan 1992, Sullivan 2002; Tiwari 2005; Tiwari 2010). Three studies were cluster‐randomised (McFarlane 2000; McFarlane 2006; Taft 2011). McFarlane and colleagues used a method whereby the weeks or months were randomly allocated to intervention and control, and then the women were allocated according to the month (McFarlane 2000) or week (McFarlane 2006) they presented to a healthcare facility, while Taft 2011 used the site as the unit of randomisation. Four trials were pilot studies (Constantino 2005; Cripe 2010; Gillum 2009; Sullivan 1991). Nine of the studies were conducted in the USA (Constantino 2005; Gillum 2009; Hyman 2001; Kiely 2010; McFarlane 2000; McFarlane 2006; Sullivan 1991; Sullivan 1992; Sullivan 2002), two in Hong Kong (Tiwari 2005; Tiwari 2010), one in Australia (Taft 2011), and one in Peru (Cripe 2010). All trials took place in urban areas.
With the exception of one trial, published as a PhD dissertation (Hyman 2001), all remaining studies were published in peer‐reviewed journals.
Recruitment
Eight of the studies recruited women in healthcare settings (Cripe 2010; Gillum 2009; Hyman 2001; Kiely 2010; McFarlane 2000; McFarlane 2006; Taft 2011; Tiwari 2005), and three in domestic violence shelters (Constantino 2005; Sullivan 1991; Sullivan 1992). One recruited participants primarily from domestic violence shelters but also from social and family service agencies (Sullivan 2002) and one primarily from a community centre serving a large urban population (Tiwari 2010). It is possible that women recruited in healthcare settings differ from those recruited elsewhere, as they may not yet be ready to accept help (Zink 2004). One study recruited additional participants after the initial six‐month follow‐up period (Sullivan 1992), raising the number of recruited women from 146 at the outset of the study to a total of 283 at the two‐year follow‐up. However, investigators' report of the three‐year follow‐up data was based only on the original sample.
The papers did not always explicitly state the severity of the abuse experienced by participants, but for the most part, it could be inferred from the study setting or the mean baseline abuse scores. For the four trials recruiting women either exclusively or primarily from domestic violence shelters (Constantino 2005; Sullivan 1991; Sullivan 1992; Sullivan 2002), it is likely that the women had experienced relatively severe abuse; mean baseline abuse scores, available for two of the studies, support this (Sullivan 1991; Sullivan 1992). For the eight studies recruiting participants in healthcare settings, the severity of the abuse varied. In Hyman 2001, which was set in a hospital emergency department, 90% of participants reported having been physically or sexually assaulted, 93% were experiencing ongoing abuse, and 68% had received previous medical treatment for injuries. The severity of abuse experienced by participants at study entry in the remaining healthcare trials (based in antenatal, primary care/public health, mother and child clinics, and GP practices) was mostly less severe. Mean baseline scores indicated that women experienced moderately severe physical and psychological abuse at study entry in three studies (McFarlane 2000; McFarlane 2006; Taft 2011), while in Cripe 2010 and Tiwari 2005, participants reported moderate‐to‐severe psychological abuse, but less severe levels of physical and sexual abuse. In Kiely 2010, instances of minor abuse were common, but 55% of the women had also experienced severe abuse. In Gillum 2009, one‐third of the participants met the criteria for being in lethal danger. In the one study set in the community, the most prevalent form of abuse was psychological aggression (on average, 19 events per woman), although a minority of women had also been physically assaulted or sexually coerced (Tiwari 2010).
Participants
A total of 2141 abused participants took part in the trials. Most of these women (n = 1297; 61%) were recruited because they were experiencing current (within the last 12 months) physical or sexual abuse. Seven studies extended inclusion beyond this to also include women experiencing emotional or non‐physical abuse (Constantino 2005; Cripe 2010; Gillum 2009; Hyman 2001; Taft 2011; Tiwari 2005; Tiwari 2010). Many of the participants were living with or still intimately involved with the perpetrator at study entry. However, there were exceptions to this. In Sullivan 2002, 79% of the women were no longer involved with the abusive partner. In four other studies, it was not clear how many of the women were still intimately involved with the abuser at recruitment (Constantino 2005; Cripe 2010; Gillum 2009; Kiely 2010). The ages of the women recruited ranged from 15 to 65 years, although more usually the women were aged between 24 and 45 years old. The ethnicity of the samples varied across trials. Seven studies included a mix of whites, African Americans and Latinas, with two of the studies considering the possible effects of acculturation (McFarlane 2006) and race (Sullivan 1992) on outcomes at three year follow‐up. Four trials involved single ethnic groups, including a study reporting on Latina women (McFarlane 2000), one recruiting African American women (Kiely 2010), and two studies conducted in Hong Kong in which all participants were Chinese (Tiwari 2005; Tiwari 2010). A further trial predominantly (87%) recruited women identifying their ethnicity as Mestizo (Cripe 2010). One study, set in Australia, stated that 17% of those recruited to the intervention arm and 7% of those recruited to the control arm were born in Vietnam, and 17% and 32% in the intervention and control arms, respectively, were born in other countries outside Australia (Taft 2011). The socioeconomic status of participants was mixed, but most of the women were on low incomes, and few had university studies. Only in two studies did a reasonably high proportion of the women either have a university education (Hyman 2001) or an income that was above average for the country (Tiwari 2005).
Interventions
The models of advocacy employed in the trials were heterogeneous.
Content
The papers did not always explicitly state the theoretical framework underlying each intervention. However, in general, the advocacy provided to the participants was based on the concept of empowerment and included education, advice on safety and accessing resources, and empathic support. All of the interventions were pragmatic in that they provided tailored services to meet the wants and needs of the individual women. Some used the term 'counselling', 'supportive listening' or 'peer counselling' to describe facilitation of access to resources. Thus, Gillum 2009 gave resource information to participants in the control arm, while advocates actively helped to engage women in the intervention group with resources as part of an intervention, thus fitting our criteria.
Tiwari 2010 used an empowerment intervention with a complementary focus on accessing resources. Authors explicitly stated, "The aim of empowerment training is to increase women’s safety through the recognition of increased danger, paired with a safety plan developed for individual use. In addition, it provides information about the cycle of violence, facts, and options regarding partner violence, legal protection orders, filing for criminal charges, and community resources for abused women." Thus, this multi‐component, heterogeneous intervention entailed resource identification and facilitated their access to women in the intervention arm, hence fulfilling our inclusion criteria.
One of the studies evaluated a group intervention that allowed for participant‐participant interaction, as well as interaction between the intervention participants and the advocate (Constantino 2005). Authors labelled this a 'social support intervention'. However, there was no structured psychological intervention, and the intervention focused on accessing community resources, including information on resources and hours of operation for those resources when available. It therefore fits our inclusion criteria. Three trials included components in addition to advocacy that may have impacted the outcomes reported. The first of these included advocacy and education/support for all the children of mothers who had been abused (Sullivan 2002), while the second provided parenting support to all the abused mothers (Taft 2011). The third study was more complex, providing advocacy within the context of three possible further (and separate) interventions, depending on the abused woman's risk profile: cognitive behavioural therapy (CBT) if depression was a risk, and smoking cessation/reduction sessions if smoking or environmental tobacco smoke exposure were identified risks (Kiely 2010).
Advocates
Trained advocates administered all of the interventions, though there was some variability in their professional status. A professional advocate led one of the interventions (Hyman 2001), research nurses administered three others (Constantino 2005; McFarlane 2006; Tiwari 2005), social workers and psychologists provided three others (Cripe 2010; Kiely 2010; Tiwari 2010), and trained paraprofessional students an additional three (Sullivan 1991; Sullivan 1992; Sullivan 2002). One study provided a mixture of face‐to‐face advocacy with the study investigators plus telephone support from trained community health workers (Gillum 2009). Two studies were somewhat different in that they evaluated the effectiveness of advocacy provided by 'mentor mothers'. In the first of these, the services of a trained, non‐professional 'mentor mother' supplemented advocacy by a professional advocate (McFarlane 2000), while in the second, trained, non‐professional 'mentor mothers' provided the entirety of the intervention (Taft 2011). With one exception, all of the interventions assessed were new and non‐established modes of care within the study settings. The exception to this was a trial that evaluated two modes of interventions already in regular use in an emergency room (Hyman 2001).
Duration
The duration of the interventions varied considerably and, to a large extent, was related to the settings in which the women were recruited.
In general, the interventions described in studies outside of healthcare settings were longer, both in terms of the length of the sessions and the period over which the sessions were offered. Typically, these types of interventions took place over a period of two to four months, providing advocacy for respective totals of about 12 hours (Constantino 2005), 43 hours plus an additional 80 hours provided to the children (Sullivan 2002), and 60 to 80 hours (Sullivan 1991; Sullivan 1992). The one exception is the study that recruited women within a community centre setting (Tiwari 2010); an initial face‐to‐face session (lasting about 30 minutes) was followed by 12 weeks of telephone advocacy (about 10 to 20 minutes per call) for an accumulated total of 2.5 to 4.5 hours of advocacy.
Most interventions recruiting women in healthcare settings were relatively brief. Three interventions were one‐off sessions and lasted from 20 to 30 minutes (Tiwari 2005), about 30 minutes (Cripe 2010), and 90 minutes (Hyman 2001). Four other trials offered advocacy sessions over a prolonged period but were still of brief duration overall. In the first of these, women were recruited in antenatal clinics and offered advocacy (or advocacy plus the services of a 'mentor mother') until the time of their delivery (McFarlane 2000). The authors report that most sessions lasted about 30 minutes, with women averaging four to five sessions for an accumulated total of approximately 150 minutes of advocacy (McFarlane 2007 [pers comm]). In the second study, women received five separate 20‐minute interventions, each six months apart, for a total of approximately 100 minutes of advocacy (McFarlane 2006). The third trial provided one face‐to‐face session lasting about 30 minutes, followed by six telephone calls over a three‐month period, each lasting an average of 20 minutes (range 5 to 60 minutes) (Woods 2013 [pers comm] in Gillum 2009). We assessed this intervention as being approximately 2.5 hours long. In the fourth study, advocacy for abuse (and where applicable, therapy for depression and smoking/passive smoking) was provided at four to eight prenatal sessions and two postpartum booster sessions (Kiely 2010). Depending on how many of the four risks were addressed, each session lasted 50 ± 15 minutes, for a total of 3.5 to 8 hours of advocacy. The one study recruiting in healthcare clinics that was of longer duration was conducted in Australia (Taft 2011). The total duration of this intervention is not specified in the paper, but abused women were offered a minimum of one hours' advocacy each week for 12 months, for at least 52 total hours of advocacy.
Range of control conditions
Control conditions also varied. One study compared the intervention with usual shelter care and unstructured chats with the principal investigator (Constantino 2005). In five studies, women were provided with a referral card listing useful community agencies (Cripe 2010; Gillum 2009; McFarlane 2000; McFarlane 2006; Tiwari 2005); the women also received health information brochures in two studies (Gillum 2009; McFarlane 2000) and a safety plan in another (McFarlane 2006). In one study, women in the control group also received an information sheet, including community resource details (Taft 2011). In Hyman 2001, the control group received standard care from social services; in Kiely 2010, they received usual prenatal care, and in Sullivan 1991, Sullivan 1992, and Sullivan 2002, they received usual shelter care. In Sullivan 1992, usual after‐shelter care was also included within the study. In Tiwari 2010, women in the control group did not receive any specific care; however, recruitment took place at a community centre that provided various community resources, to which they naturally had easy access.
Outcomes
In terms of our primary outcomes, 11 of the 13 studies measured some form of abuse (using eight different scales), six assessed quality of life outcomes (three scales), six measured depression (three scales), and three studies measured anxiety or psychological distress (three scales). There was little consistency across the trials in relation to the scales used to measure any of these outcomes.
Physical abuse
Physical violence was the most commonly measured form of abuse. When assessing this outcome, five of the trials (Kiely 2010; Sullivan 1991; Sullivan 1992; Tiwari 2005; Tiwari 2010) used modified or revised versions of the physical violence subscale of the Conflict Tactics Scale (CTS, CTS2; Straus 1996). McFarlane 2000 and McFarlane 2006 employed the physical abuse subscale of the Severity of Violence Against Women Scale (SVAWS 1992), Gillum 2009 used the physical abuse subscale of the Partner Abuse Scale (PAS; Hudson 2006), and Hyman 2001 used the physical abuse subscale of the Index of Spouse Abuse (ISA; Hudson 1981).
Sexual abuse
Tiwari 2005 used a single question to ascertain if sexual abuse had occurred, while Gillum 2009 used individual items relating to sexual abuse from the PAS (Hudson 2006). Kiely 2010 and Tiwari 2010 opted for employing the sexual coercion subscale of the CTS2 (Straus 1996).
Emotional abuse
Investigators assessed emotional abuse using four measures. Two trials (McFarlane 2000; McFarlane 2006) employed the threats of abuse subscale of the SVAWS (Straus 1996) and two studies (Sullivan 1992; Tiwari 2005) used the Index of Psychological Abuse (IPA; Sullivan 1991). Gillum 2009 used the non‐physical abuse subscale of the PAS (Hudson 2006), and Tiwari 2010 used the psychological aggression subscale of the CTS2 (Straus 1996).
Other aspects of abuse
McFarlane 2006 and Gillum 2009 also measured other aspects of abuse; both studies gauged homicide risk using the Danger Assessment Scale (DA Scale 2004), while McFarlane 2006 evaluated harassment at work using the Employment Harassment Scale (EHS 1992).
Investigators from three studies measured overall abuse using different methods. Hyman 2001 combined the physical and non‐physical abuse subscales of the ISA (Hudson 1981), and Sullivan 2002 used a composite of a modified version of the IPA (Sullivan 2006) and the CTS physical violence subscale (Straus 1979). Taft 2011 assessed physical, sexual, and emotional abuse through the Composite Abuse Scale (CAS; Hegarty 2005).
Quality of life
In terms of quality of life, three trials (Cripe 2010; Taft 2011; Tiwari 2005) asked women to complete the 36‐item Short Form Health Survey (SF‐36; Ware 1992). Tiwari 2010 employed the (SF‐12; Ware 1996), and Sullivan 1992 and Sullivan 2002 both used an adapted version of a scale by Andrews and Withey (Andrews 1976).
Depression
Taft 2011 and Tiwari 2005 both used the Edinburgh Postnatal Depression Scale (EPDS; Cox 1987). Tiwari 2010 utilised the Beck Depression Inventory II (BDI‐II 1996), and Gillum 2009, Sullivan 1992, and Sullivan 2002 all measured depression using the Centre for Epidemiological Studies Depression Scale (CESD‐R 2004).
Anxiety/psychological distress
Three studies measured anxiety/psychological distress: Hyman 2001 asked participants to complete the Symptoms Checklist 90‐Revised (SCL‐90‐R 1994) in order to obtain the Global Severity Index score, Constantino 2005 asked participants to complete the Brief Symptom Inventory (BSI 1993), and Sullivan 1992 asked participants to complete the Rape Aftermath Symptom Test (RAST; Kilpatrick 1988).
Follow‐up
The duration of the follow‐up period varied considerably between studies. Four studies conducted no further follow‐up of the women after assessing outcomes upon completion of an intervention (Constantino 2005; Gillum 2009; Kiely 2010; Taft 2011), while four trials carried out assessments at 10 weeks (Sullivan 1991), three to four months (Hyman 2001), four months (Sullivan 2002), and six months (Tiwari 2010). Tiwari 2005 states that the investigators assessed outcomes at six weeks postdelivery, but this could represent a follow‐up period of anywhere from 16 to 34 weeks. Similarly, Cripe 2010 followed up women a week after giving birth, or anywhere from 14 to 28 weeks postintervention. McFarlane 2000 reports data at various time points up to 18 months postintervention, McFarlane 2006 carried out multiple intervention sessions and follow‐ups for up to two years, and Sullivan 1992 reports data at multiple time points for up to three years postintervention.
Some of the papers reported reasons why there was a loss to follow‐up. The primary reason stated was that some women could not be located (Cripe 2010; Hyman 2001; McFarlane 2006; Sullivan 2002; Tiwari 2005). Other reasons included refusals to carry on with the study (Hyman 2001; Sullivan 2002), women returning to their abusive partner (Sullivan 1991), moving out of the area (Gillum 2009), and having difficulties with transport, childcare, or living conditions (Constantino 2005). One study reported no loss to follow‐up (Tiwari 2010).
Excluded studies
For this update we excluded 48 reports (43 studies) after examining the full text. We excluded 16 on grounds of design (i.e. they were not RCTs or quasi‐RCTs) (Anderson 2012; Andrews 2011; Coker 2012; Davidson 2012; Dichter 2012; Ford‐Gilboe 2011; Grip 2011; Jack 2012; Kendall 2009; Kramer 2012; Krishnan 2012; Orchowski 2012; Peled 2010; Simmons 2011; Song 2010; Stover 2010); 18 because the interventions did not meet our criteria for being advocacy‐based (Bloom 2014; Carlson 2012; Eden 2015; Graham‐Bermann 2013; Hirani 2010; Houry 2011; Humphreys 2011; James 2014; Johnson 2011; Koziol‐McLain 2015; Kyegombe 2014; Lindsay 2013; Miller 2011; Miller 2014; Saftlas 2014; Valpied 2014; Wagman 2015; Zlotnick 2011); two because the control groups also received advocacy (Jouriles 2009; Tiwari 2010); one because it did not test advocacy (Feder 2011); and one because the control group did not receive usual care (DePrince 2012). We also excluded one potentially relevant study because the women were not abused (Cupples 2011), and four studies for lack of available data on the subset of women who had experienced abuse (Andersson 2013; El‐Mohandes 2011; Robinson‐Whelen 2014; Saggurti 2014).
In addition, we excluded two studies that had featured in the original review following a change in our definition of 'usual care' (i.e. studies where usual care included more substantial elements of advocacy); we excluded McFarlane 2002 on the basis of information provided in the published paper, and Jouriles 2001 after communication with one of the authors about the content of the care offered to participants in the control arm of the trial. Furthermore, we list some studies published in 2007 to 2008 as excluded in this version of the review but not in the previous version, despite having been picked up with the previous search (Bacchus 2007; Becker 2008; El‐Mohandes 2008; McLelland 2008). This is because we wanted to make the reasons for their exclusion explicit, taking into consideration recent discussions around definitions of advocacy.
It should be noted that although we excluded El‐Mohandes 2008 and El‐Mohandes 2011 from this review, the relevant data were published in a subsequent paper that is included in the review (Kiely 2010); see 'Characteristics of included studies' for further details.
For more information, please see 'Characteristics of excluded studies' tables.
Risk of bias in included studies
To assess the risk of bias in included studies, we applied the eight criteria outlined in the 'Methods' section above (Figure 1 and Figure 3). Many of our included studies (10 out of 13) satisfied at least four criteria; however, some of these did not provide enough data for us to evaluate some of their other potential biases, so overall, we judged 5 of the 13 studies to be at high risk of bias.

Risk of bias graph: review authors' judgements about each risk of bias item presented as percentages across all included studies.
We judged one trial to be at low risk of bias on all eight criteria (Tiwari 2005) and another study by the same author to be at low risk on seven criteria and unclear on one (Tiwari 2010). Kiely 2010 was at low risk of bias on six criteria and unclear on two. In addition to these three studies, which were all at low overall risk of bias, we deemed five others to carry a moderate risk.
Allocation
Sequence generation
All 13 studies described treatment allocation as random, but only 6 trials provided sufficient information on sequence generation: one study reported using random numbers tables to allocate participants (Hyman 2001), one study wrote the allocations on pieces of paper placed in envelopes that were subsequently shuffled (Gillum 2009), and four studies stated that they used a computer‐generated method (Kiely 2010; McFarlane 2006; Tiwari 2005; Tiwari 2010). Six studies either made no reference to sequence generation or provided insufficient details, so we rated their risk of bias as unclear.
In the cluster‐randomised trial by Taft 2011, a large percentage of clinics did not refer any potential participants to either arm, hence we rated this study as having selection bias.
Allocation concealment
Only five trials provided sufficient information and fulfilled the requirement of allocation concealment. Four of these reported that the allocations were placed in sealed envelopes (Gillum 2009; Sullivan 1992; Tiwari 2005; Tiwari 2010), and in the fifth study, the recruiters had to telephone a co‐ordinating centre (Kiely 2010). Three trials did not have any allocation concealment, so we rated their risk of bias as high. Two of these studies randomised women to intervention and control groups according to the week (McFarlane 2006) or month (McFarlane 2000) they attended a clinic; for the third study, the investigators maintained allocation concealment at the time of randomisation, but thereafter clinic staff were aware of their intervention status (Taft 2011). None of the five remaining studies made reference to allocation concealment, so we judged them to be at unclear risk of bias.
Blinding
Blinding participants or those delivering advocacy interventions is not feasible.
Five of the trials provided details of the measures taken to ensure blinded assessment of the primary outcomes. Four of these studies provided explicit details on blinding: Hyman 2001 and Kiely 2010 each stated that the researchers did not have any information about randomisation status, while Tiwari 2005 and Tiwari 2010 stated that the researchers did not become aware of the women's randomisation status until after collecting all follow‐up data, when the women started answering questions about their satisfaction with the care. The fifth trial did not explicitly assert the extent of blinded assessment, but we thought it was satisfactory on the basis of statements in the paper, which remarked that the postintervention interviewers were different to the interviewers who collected baseline data and provided the intervention (Cripe 2010).
There was no blinded assessment in four of the trials. Sullivan 1991 stated that the follow‐up interviews with women who received advocacy were longer and included questions about the programme, thus the researchers must have been aware of the women's randomisation status. McFarlane 2006 stated that budget limitations precluded the use of blinding, and Taft 2011 stated that the outcome assessors were not blinded, as they had also negotiated informed consent and fully briefed participants about the mentoring programme. Similarly, in Gillum 2009, the outcome assessors could not have been blinded as they also collected baseline data and provided an initial face‐to‐face counselling session for women in the intervention group. The other four studies did not provide sufficient explicit information to enable a judgement on the blinding of assessors, so we judged them to be at unclear risk of detection bias.
Incomplete outcome data
One study was successful in retaining all of the women they recruited (Tiwari 2010). All other studies reported losses over time. In 11 of the remaining 12 trials, losses to follow‐up ranged from 2.5% in Sullivan 2002 to 27% in Taft 2011. One trial reported a higher loss of 48% of its recruited sample, so these results need to be interpreted with caution (Hyman 2001). We judged six of the trials to have a low risk of attrition bias (Cripe 2010; Gillum 2009; McFarlane 2006; Sullivan 2002; Tiwari 2005; Tiwari 2010). However, five studies carried a high risk of bias (Constantino 2005; Hyman 2001; Sullivan 1991; Sullivan 1992, Taft 2011). In two cases, and although investigators provided reasons for attrition, group allocation might have had an effect on dropout (Constantino 2005; Hyman 2001). We had difficulty in assessing the significance of attrition in Sullivan 1991 and Sullivan 1992. In the former, there was a large difference in attrition between groups. This was accounted for by participants becoming 'ineligible', as they had to receive at least three weeks of services and had dropped out (three because they had returned to their abusers). This may have influenced the effect sizes of outcomes. However, we note that the poor attrition is a function of the study design, where women had to attend at least three advocacy sessions to be eligible, a condition which could not apply to women allocated to the control group. Similar arguments also apply to Sullivan 1992. Finally, two trials reported testing to see whether attrition had a potential effect on results (Kiely 2010; McFarlane 2000). Neither study reported any significant differences, but they did not report sufficient details about the reasons for attrition or if its relation to group allocation, so we judged the risk of attrition bias to be unclear.
Selective reporting
In the review authors' judgement, there was no indication of selective outcome reporting by study investigators. All primary outcome measures described in the methods were also reported in the 'Results' sections of papers. On occasion, we required the data in a different format to that provided in the paper and, where possible, the investigators made such data readily available.
Other potential sources of bias
Baseline measurement of outcomes
We assessed reporting of baseline measurement of outcomes in all the reviewed studies. In seven, the study investigators stated that there were no substantive between‐group differences in outcome measures at baseline (Cripe 2010; Gillum 2009; Kiely 2010; McFarlane 2000; Sullivan 1991; Sullivan 2002; Tiwari 2010 ), while an eighth study stated that there were no between‐group differences for their larger sample, but they did not provide information in relation to their original sample (Sullivan 1992). Five of the trials did not explicitly state that there were no baseline differences between groups, but they did report (or we were able to obtain) means and standard deviations, and these looked comparable (Constantino 2005; Hyman 2001; McFarlane 2006; Taft 2011; Tiwari 2005), so we rated them as also fulfilling this criterion.
Reliable primary outcome measures
All studies measured multiple outcomes. Although they seldom stated which were the primary outcomes, this could sometimes be inferred from the sample size calculation (Hyman 2001; Kiely 2010; Taft 2011; Tiwari 2005; Tiwari 2010) or from the research question (Gillum 2009; McFarlane 2000). Based on this information, we thought 12 trials had employed reliable measures to evaluate primary outcomes, while one carried an unclear risk of bias (Cripe 2010).
Protection against contamination
In 10 studies, the women were the unit of randomisation. One of these studies reported taking multiple steps to counter possible contamination; these included minimising opportunities for participants in the different groups to meet or share intervention materials, not recording a woman's allocation status in her medical record, and not allowing outcome assessors to be involved in the study design or provision of care (Tiwari 2005). One study reported some contamination, and approximately 19% of women in the intervention group received control group care, while about 23% of women allocated to the control arm received the intervention (Hyman 2001). Another trial was also at high risk of contamination: the study was conducted in a clinic serving a relatively small population, so contact between the women was possible. Moreover, the interventionists had at least some contact with the control group participants (Gillum 2009). In the other seven studies that randomised women on an individual basis, women in different arms of the trial may have communicated with each other, so we rated these studies at unclear risk of bias on this domain (Constantino 2005; Cripe 2010; Kiely 2010; Sullivan 1991; Sullivan 1992; Sullivan 2002; Tiwari 2010).
Three studies randomised participants on a non‐individual basis. Two studies by McFarlane and colleagues randomised women according to the week (McFarlane 2006) or month (McFarlane 2000) they presented to the healthcare facility (weeks and months were randomly allocated to the intervention or control group). McFarlane 2000 had a design that may have minimised potential contamination; women in the different trial arms were unlikely to come into personal contact with each other, and different individuals provided the treatments. However, in McFarlane 2006, the change in allocation status was much shorter, and the same healthcare professionals managed both groups, so there was more potential for the control group to receive elements of the intervention accidentally. We rated this study to be at high risk of bias. The final study employed cluster‐randomisation (Taft 2011) and thus was designed to protect against contamination.
Effects of interventions
See: Summary of findings for the main comparison Intensive advocacy interventions for women who experience intimate partner abuse versus usual care at up to 12‐month follow‐up; Summary of findings 2 Brief advocacy interventions for women who experience intimate partner abuse versus usual care at up to 12‐month follow‐up
Our synthesis of the outcome data is primarily narrative. The 13 studies tracked a wide range of 25 outcome measures, though several of the studies used some of the same outcomes. Ultimately, however, we were only able to perform a limited number of meta‐analyses because of problems with the reported data. The first problem was the clinical heterogeneity across the studies in relation to differences in the intensity of the advocacy interventions provided. For example, we felt that we could not combine studies that tested 'intensive' interventions (i.e. 12 or more hours of advocacy) with those using 'brief' interventions (e.g. less than 12 hours duration). This substantially reduced the number of studies amenable to pooling. A second problem was that a number of the outcomes were measured in different ways, so we could not compare them. For example, some studies reported a total score for an outcome, while others reported only the subscale totals of different measures. This further reduced our ability to pool studies.
Trials did not always report outcome data in a form that we could use in the review. In total, we contacted and obtained further unpublished data from eight of the study authors (Constantino 2005; Gillum 2009; Hyman 2001; Kiely 2010; Sullivan 1992; Sullivan 2002; Taft 2011; Tiwari 2005). One author (Cripe 2010) was unable to send us additional unpublished data. In order to allow for comparison across the studies, two of the review authors (JR and either CR or DD for the original review; or JR and CR for the updated review) independently recalculated all effects sizes. We have highlighted where our calculated unadjusted effect sizes are markedly different from the findings reported by the study investigators. We based all analyses on postintervention scores except for three studies, where changes from baseline data were available for some or all of the outcomes measured (these are differentiated in the forest plots by 'mean change scores') (Cripe 2010; Constantino 2005; Tiwari 2005). In Cripe 2010, we corrected for differences in the direction of mean change by multiplying the reported mean change scores by − 1. For the one cluster‐randomised trial (Taft 2011), the study authors provided us with design effect sizes for each of the individual outcomes adjusted for clustering (design effects were minimal, ranging from 0.86 to 1.12). Where investigators reported multiple follow‐ups within our three follow‐up categories, unless stated otherwise, we chose to report the results from the latest follow‐up in all comparison analyses. For example, if data were reported at 2, 6, and 12 months follow‐up, we selected the data at 12 months.
Two of the studies recruited both abused and non‐abused women. These either reported on the subset of abused women only (Kiely 2010), or we obtained separate data for the subset of abused women from the study authors (Taft 2011).
Finally, one of the studies continued to recruit participants after taking baseline measurements (Sullivan 1992). For this study, where follow‐up data were available for both the original and the expanded samples of participants, we calculated effect sizes based on the latter. In general, the effect sizes for outcomes at up to 12 months and 12 to 24 months follow‐up were calculated on the larger sample of participants. The two exceptions to this both related to dichotomous measures of physical abuse and emotional abuse as measured at up to 12 months follow‐up. All effect sizes for outcomes measured at 24 + months follow‐up were based on the original, smaller sample of participants.
Primary outcomes
Incidence of abuse
Physical abuse
Eight studies measured physical abuse; six of these evaluated brief advocacy interventions (Gillum 2009; Kiely 2010; McFarlane 2000, McFarlane 2006, Tiwari 2005; Tiwari 2010), while the other two appraised intensive interventions (Sullivan 1991; Sullivan 1992). One study measured both severe and minor physical violence separately (Tiwari 2005); this study was also different from the others in that it assessed mean change from baseline. One of the studies employed a composite measure of physical and sexual abuse, but we were able to obtain separate data for each of these (Kiely 2010). We obtained additional statistical data from four study investigators (Gillum 2009; Kiely 2010; Sullivan 1992; Tiwari 2005).
We calculated effect sizes for five of the six studies that offered brief advocacy. As indicated (see Analysis 1.1 in 'Data and analyses'), there was no evidence that advocacy leads to a reduction in physical abuse when this outcome is expressed using a continuous measure. Pooled data from three studies (n = 558)— two recruiting women in healthcare settings (Gillum 2009; McFarlane 2006) and the other from a community centre (Tiwari 2010)—showed no effect of advocacy in the short‐term, that is, at up to 12 months follow‐up (SMD 0.00, 95% CI − 0.17 to 0.16, I² = 0%; moderate quality evidence). Similarly, there was no effect in the medium term (SMD − 0.02, 95% CI − 0.24 to 0.19; n = 319) when McFarlane 2006 followed up women 24 months after the first intervention session (with sessions being provided thereafter every six months for up to two years). However, this pattern of results did not extend to Kiely 2010, the only trial that employed a dichotomous measure of physical abuse (Analysis 1.2). In this multi‐component study, recruiting within an antenatal setting, women who received advocacy (and possibly also cognitive behavioural therapy (CBT), therapy for smoking/passive smoking, or both) were less likely to be experiencing physical abuse at the end of the intervention period (OR 0.42, 95% CI 0.23 to 0.75; n = 306). This means that one in every eight women that is given advocacy is likely to benefit from it (number needed to treat (NNT) = 8). Findings were more equivocal in the study that measured severe and minor abuse in pregnant women attending for antenatal care (Tiwari 2005). In this study, which had a low risk of bias, a brief 30‐minute session of advocacy was not associated with any reduction in severe abuse as measured at 16 to 34 weeks postintervention (change‐score MD 0.08, 95% CI − 0.26 to 0.42; n = 110; not statistically significant; moderate quality evidence), but investigators did observe a reduction in minor abuse (change‐score MD − 1.00, 95% CI − 1.82 to − 0.18; n = 110; Analysis 1.3). The fifth trial that offered brief advocacy did not report any standard deviations, nor were these (or alternative relevant data) available from the authors (McFarlane 2000). However, in their paper, the study authors reported finding no evidence to suggest that advocacy (or advocacy plus the services of a 'mentor mother') reduced physical abuse in women recruited from antenatal clinics, either in the short or medium term.
Two studies, both recruiting women departing from domestic violence shelters, assessed the effectiveness of intensive advocacy. Sullivan 1992 measured physical abuse using both continuous and dichotomous measures, while Sullivan 1991 assessed this outcome using only a dichotomous measure. In the study that employed a continuous measure of physical abuse (Analysis 1.4), there was no evidence to confirm or refute the hypothesis that advocacy leads to a reduction in severe physical abuse at 12 months follow‐up (MD − 0.12, 95% CI − 0.39 to 0.15; n = 265; low quality evidence) or at three years (MD 0.18, 95% CI − 0.20 to 0.56; n = 124). However, at the two‐year follow‐up, trialists reported that women who received advocacy experienced significantly less physical abuse than women in the control arm (MD − 0.25, 95% CI − 0.50 to 0.00; n = 265). A similar pattern of results also emerged with the dichotomous data (Analysis 1.5). Two studies contributed to a meta‐analysis of the 12‐month follow‐up data (Sullivan 1991; Sullivan 1992); there was no evidence that advocacy reduced physical abuse (OR 0.61, 95% CI 0.33 to 1.14, I² = 0%; n = 182; very low quality evidence) with the NNT being eight women for one to benefit (Analysis 1.5). At later follow‐up points, when data were only available for the Sullivan 1992 study, the findings suggest that participants who received advocacy experienced significantly less physical abuse than women in the control arm (OR 0.39, 95% CI 0.20 to 0.77; n = 265) at 12 to 24 months follow‐up, again with an NNT of eight, but at three years, the study did not find any benefit of advocacy (OR 1.07, 95% CI 0.52 to 2.23) (the NNT for one woman to benefit was 63).
Best case and worst case scenario analyses estimated the effects of missing data on the results of one meta‐analysis (Analysis 1.6). For the 12‐month follow‐up data, the results did not change when imputing an improved outcome for intervention women who dropped out of the study (no control group women dropped out) (OR 0.54, 95% CI 0.29 to 1.01, I² = 0%; n = 192), or when imputing a poor outcome (OR 0.83, 95% CI 0.46 to 1.49, I² = 0%; n = 192).
For descriptive purposes only, two forest plots outline evidence for the effectiveness of any type of advocacy (brief or intensive) on physical abuse, as assessed using a continuous measure (Analysis 1.7) and a dichotomous measure (Analysis 1.8).
There is insufficient evidence at present to draw unequivocal conclusions about the benefits of advocacy, either within healthcare settings or within the community, for the reduction of severe physical abuse. One study with low risk of bias suggests that brief advocacy may benefit women suffering minor abuse, but most studies did not measure minor abuse. One further study evaluating brief advocacy within the context of a multi‐component intervention showed a positive effect immediately upon completion, but there was no long‐term follow‐up, and it is not clear if the other components (in particular, CBT for depression) also had an impact. It is possible that intensive advocacy can reduce physical abuse one to two years after the intervention but that this effect wanes over time. The primary studies are underpowered (two of the eight trials were pilot studies), and we could only pool data from three brief interventions and two intensive interventions. The meta‐analyses were still underpowered, with relatively wide CIs.
Sexual abuse
Three studies based in healthcare settings (Gillum 2009; Kiely 2010; Tiwari 2005) and one study within the community (Tiwari 2010) evaluated the effect of receiving brief advocacy on subsequent sexual abuse. (We obtained additional statistical data to those reported in the papers of Gillum 2009, Kiely 2010 and Tiwari 2010 directly from the study investigators). We conducted a meta‐analysis on data from two of the studies (Gillum 2009; Tiwari 2010) and found that there was no statistically significant reduction in sexual abuse (SMD − 0.12, 95% CI − 0.37 to 0.14, I² = 44%; n = 239; moderate quality evidence) at up to 12 months (Analysis 2.1). Tiwari 2005 showed a reduction in sexual abuse in the months following receipt of advocacy, but the CIs included zero: change‐score MD − 0.07, 95% CI − 0.30 to 0.16; n = 110; moderate quality evidence; Analysis 2.2). In the multi‐component intervention study by Kiely 2010, there was no significant benefit associated with receiving advocacy—and possibly also CBT for depression or therapy for smoking/passive smoking (OR 0.96, 95% CI 0.44 to 2.12; n = 306; Analysis 2.3).
Emotional abuse
Six studies measured emotional abuse; five studies evaluated the effectiveness of brief advocacy (Gillum 2009; McFarlane 2000; McFarlane 2006; Tiwari 2005; Tiwari 2010), and a sixth study evaluated an intensive intervention (Sullivan 1992). Tiwari 2005 again measured mean change from baseline, and we obtained the additional statistical data that we required directly from the study investigators. We also obtained additional data from Gillum 2009.
We conducted a meta‐analysis of data from three of the five studies that offered brief advocacy, two based in healthcare settings (Gillum 2009; McFarlane 2006) and one which was based within the community (Tiwari 2010). As shown in Analysis 3.1, the individual study results were inconsistent at up to 12 months follow‐up, but the pooled point estimate indicates that there was no significant reduction in emotional abuse (SMD − 0.05, 95% CI − 0.22 to 0.11, I² = 51%; n = 558; low quality evidence) following the delivery of advocacy. McFarlane 2006 also followed up on participants 24 months after the first intervention session (with subsequent sessions being provided every six months); again there was no significant benefit associated with the receipt of advocacy (SMD − 0.06, 95% CI − 0.28 to 0.16; n = 319; Analysis 3.1). In contrast, the antenatal‐based study by Tiwari 2005 reported a statistically significant reduction in emotional abuse at 16 to 34 weeks after receipt of a single, brief session of advocacy (change‐score MD − 4.24, 95% CI − 6.42 to − 2.06; n = 110; moderate quality evidence; Analysis 3.2). The fifth trial did not report any standard deviations, nor were these (or alternative relevant data) available from the authors (McFarlane 2000). In the published paper, however, the authors reported that their analyses showed no evidence that multiple, brief sessions of advocacy (or advocacy plus the services of a 'mentor mother') reduced emotional abuse for women recruited in an antenatal setting, in the short or medium term.
The one study that provided intensive advocacy to women leaving shelters, Sullivan 1992, did not show any significant reduction in emotional abuse at 12 months postintervention—either when this was assessed using a continuous measure (MD − 0.02, 95% CI − 0.16 to 0.12; n = 265; very low quality evidence; Analysis 3.3) or using a dichotomous measure (OR 0.58, 95% CI 0.30 to 1.13; n = 141; moderate quality evidence; Analysis 3.4). Similarly, there was no evidence of a reduction in emotional abuse as a result of receiving advocacy at 24 months follow‐up (MD − 0.04, 95% CI − 0.19 to 0.11; n = 265; Analysis 3.3).
A forest plot (Analysis 3.5) shows the effectiveness of any type of advocacy (brief or intensive) on emotional abuse, as expressed using a continuous measure.
With the exception of the two trials by Tiwari and colleagues, there is little evidence that advocacy reduces or leads to a cessation of emotional abuse. This conclusion holds for studies conducted both within and outside of healthcare settings and for studies offering either short or more intensive sessions of advocacy.
Financial abuse
No studies reported data for this outcome.
Other abuse measures
Risk of homicide
Two studies measured the risk of homicide (Gillum 2009; McFarlane 2006), both recruiting women in healthcare settings and providing multiple short sessions of advocacy. The authors of Gillum 2009 provided additional data. Pooled data showed that there was no significant reduction in homicide risk (MD 0.13, 95% CI − 0.54 to 0.80, I² = 0%; 2 studies; n = 358) at up to 12 months, nor did data from McFarlane 2006 (which extended follow‐up to two years) show any reduction in the medium term (MD − 0.30, 95% CI − 1.07 to 0.47; n = 319; Analysis 4.1).
Risk of work harassment
McFarlane 2006 measured harassment at work. The two trial arms did not differ significantly from each other in the degree of harassment experienced at work at 12 months follow‐up (MD 0.10, 95% CI − 0.36 to 0.56; n = 319), but there was a statistically significant effect at 24 months that favoured the women in the intervention group (MD − 0.60, 95% CI − 0.97 to − 0.23; n = 319; Analysis 5.1). The study authors did not report this effect as significant after adjusting significance levels for multiple comparisons.
Overall abuse
Three studies reported on overall abuse (physical and emotional abuse combined) at up to 12 months follow‐up; one evaluated a brief session of advocacy for abused women attending an accident and emergency department (Hyman 2001), and two provided intensive advocacy for women (each within the context of multi‐component interventions) recruited from domestic violence shelters or social/family service agencies (Sullivan 2002) or from primary care clinics (Taft 2011). The Taft trial measured overall abuse using continuous and dichotomous measures. Authors from all three studies supplied additional statistical data to enable us to calculate the effect sizes.
The studies did not show any significant benefit in women receiving brief advocacy sessions. The point estimate in Hyman 2001 (Analysis 6.1) favoured the intervention group, but the CIs included zero (MD − 7.74, 95% CI − 20.33 to 4.85; n = 53; low quality evidence).
There was no evidence to suggest that women who received advocacy reported less abuse than women in the control arm at up to 12 months (SMD − 0.23, 95% CI − 0.53 to 0.08; n = 181; very low quality evidence; Analysis 6.2) when combining continuous data from the two intensive advocacy trials (Sullivan 2002; Taft 2011). In addition, there was no evidence that advocacy reduced the proportion of women reporting a cessation of abuse (OR 0.72, 95% CI 0.29 to 1.79; n = 103; NNT = 15; very low quality evidence; Analysis 6.3), as reported by the one study that assessed overall abuse using a dichotomous measure (Taft 2011) .
The effectiveness of any type of advocacy (brief or intensive) on overall abuse is given in Analysis 6.4.
Psychosocial health
Nine of the 13 studies evaluated the effects of advocacy on the primary outcome measures assessing psychosocial health.
Quality of life
Six of the trials assessed quality of life. Three of the studies evaluated a brief advocacy intervention; one reported on the two summary component subscales (physical and mental) of the SF‐12 Health Survey (Tiwari 2010), while the other two trials described mean changes from baseline for each of the eight subscales comprising the SF‐36 measure of quality of life (Cripe 2010; Tiwari 2005). Of the three studies evaluating the effectiveness of intensive advocacy, one measured quality of life using the two summary component subscales (physical and mental) of the SF‐36 (Taft 2011), and two measured overall quality of life (Sullivan 1992; Sullivan 2002). We obtained additional statistical data directly from the investigators of four trials (Sullivan 1992; Sullivan 2002; Taft 2011; Tiwari 2005).
Tiwari 2010, which recruited women from a community centre and provided brief advocacy over a 12‐week period, observed no significant benefit at six months follow‐up either in terms of improved 'physical' quality of life (MD 0.80, 95% CI − 1.27 to 2.87; n = 200) or improved 'mental' quality of life (MD 0.37, 95% CI − 1.94 to 2.68; n = 200; Analysis 7.1). Similarly, upon pooling data from two studies (n = 314) that provided brief, one‐off advocacy sessions to pregnant, abused women (Cripe 2010; Tiwari 2005), we found no significant improvements for any of the eight quality of life subscales at three to eight months postintervention: physical functioning (change‐score MD 4.92, 95% CI − 0.32 to 10.16); role physical (change‐score MD 7.42, 95% CI − 0.97 to 15.80); bodily pain (change score MD − 4.51, 95% CI − 10.42 to 1.39); general health (change‐score MD − 0.85, 95% CI − 4.06 to 2.37); vitality (change‐score MD − 1.38, 95% CI − 5.56 to 2.80), social functioning (change‐score MD 0.92, 95% CI − 5.00 to 6.84); role emotional (change‐score MD 9.37, 95% CI − 0.31 to 19.05); and mental health (change‐score MD − 1.72, 95% CI − 5.31 to 1.87; Analysis 7.2). (N.B. We corrected for differences in the direction of the mean changes reported in the paper by Cripe 2010.)
Taft 2011 trained 'mentor mothers' to provide up to 12 months intensive advocacy to abused women recruited within primary care clinics (although the intervention was administered in the community). This study had mixed results (Analysis 7.3): women who received advocacy reported significant improvements in their 'physical' quality of life immediately postintervention (MD 4.90, 95% CI 0.98 to 8.82; n = 103), but this did not extend to their perceived 'mental' quality of life (MD 1.90, 95% CI − 2.92 to 6.72; n = 103). Two of the studies conducted by Sullivan and colleagues (Sullivan 1992; Sullivan 2002) evaluated the effectiveness of advocacy delivered over a period of 10 to 16 weeks for women leaving domestic violence shelters or referred from social and family service agencies (Analysis 7.4). Both studies reported data at 12 months, and when pooled, data indicated a higher quality of life for women in the intervention group (MD 0.23, 95% CI 0.00 to 0.46; n = 343). Only one of these two studies followed up participants beyond 12 months (Sullivan 1992); data were obtained at two years postintervention and again at three years (but only for the original smaller sample of recruited women). There was no evidence that intensive advocacy improved quality of life at two (MD 0.25, 95% CI − 0.02 to 0.52; n = 265) or three years (MD 0.30, 95% CI − 0.07 to 0.67; n = 124). It is important to note that these findings differ from the significant effects reported by the study authors. We calculated mean differences based on the reported raw means and standard deviations, while the study authors reported findings based on multivariate analyses (two‐year follow‐up) and employed a P < 0.10 significance level to avoid type II errors as a result of the smaller sample size (three‐year follow‐up).
Analysis 7.5 presents a forest plot showing the effectiveness of any type of advocacy (brief or intensive) on 'physical' and 'mental' quality of life.
Overall, these studies suggest that brief advocacy is unlikely to improve quality of life in women who have experienced partner abuse.
Depression
Six studies assessed the effect of advocacy on depression: three evaluated the effect of a brief intervention (Gillum 2009; Tiwari 2005; Tiwari 2010), and three appraised the effect on an intensive intervention (Sullivan 1992; Sullivan 2002; Taft 2011). We obtained additional statistical data from four of the study investigators (Gillum 2009; Sullivan 1992; Taft 2011; Tiwari 2005). Gillum 2009 assessed depression using both continuous and dichotomous measures.
All three trials of brief advocacy followed women for less than 12 months postintervention. We pooled continuous data from two of the studies, one of which recruited women from a community centre (Tiwari 2010) and one from a primary care clinic (Gillum 2009). As indicated in Analysis 8.1, there was no evidence that women receiving advocacy reported lower levels of depression than women in the control group (SMD − 0.17, 95% CI −0.43 to 0.08, I² = 0%; n = 239). A meta‐analysis of dichotomous data from Gillum 2009 and Tiwari 2005 (both in healthcare settings) showed that significantly fewer women developed depression (NNT = 4) if they received a brief advocacy intervention (OR 0.31, 95% CI 0.15 to 0.65, I² = 24%; n = 149; Analysis 8.2).
Of the three intensive advocacy studies, two recruited women exiting from domestic violence shelters (Sullivan 1992; Sullivan 2002) and one recruited women from primary care clinics (Taft 2011). All three trials assessed depression using a continuous measure at ≤ 12 months follow‐up, and a meta‐analysis of these data (Analysis 8.3) revealed no evidence that intensive adequacy reduces depression (SMD − 0.14, 95% CI − 0.33 to 0.05, I² = 27%; n = 446). In this meta‐analysis, it should be highlighted that our calculated mean difference for Sullivan 2002 differs from the statistically significant effect reported by the study investigators, who conducted a multivariate analysis. Only one of these three intensive advocacy studies measured depression over a longer time period (Sullivan 1992); again, at two years follow‐up, there was no evidence that receiving advocacy reduced depression among women in the intervention arm (SMD − 0.12, 95% CI − 0.36 to 0.12; n = 265; Analysis 8.3). Taft 2011 also assessed the effectiveness of intensive advocacy on depression immediately postintervention using a dichotomous measure (Analysis 8.4). The investigators reported no evidence to suggest that there were fewer cases of depression in the intervention group: OR 0.51, 95% CI 0.20 to 1.29; n = 103 (with an NNT of 8).
For descriptive purposes only, two forests plot outline the evidence for the effectiveness of any type of advocacy (brief or intensive) on depression, as measured using a continuous measure (Analysis 8.5) and a dichotomous measure (Analysis 8.6).
Overall, there is inconsistent evidence that advocacy has a beneficial impact on depression in abused women. There is limited evidence that brief advocacy delivered to abused women recruited within healthcare settings may help to reduce depression in the short‐term.
Anxiety/psychological distress
One study measured anxiety as an outcome measure (Sullivan 1992), and two other studies measured psychological distress (Constantino 2005; Hyman 2001); as these are similar concepts, we discuss them together. Hyman 2001 appraised a brief advocacy intervention, while Constantino 2005 and Sullivan 1992 evaluated the effectiveness of intensive advocacy. We analysed Constantino 2005 separately, as it reported mean change from baseline. We obtained additional statistical data from authors of Hyman 2001 and Sullivan 1992.
For the brief intervention set in an accident and emergency department (Hyman 2001), there was significant evidence that advocacy reduced psychological distress at three to four months follow‐up (MD − 0.56, 95% CI − 1.09 to − 0.03; n = 53; Analysis 9.1).
Both intensive interventions recruited women in domestic violence shelters, but we were unable to pool their findings because one reported mean change from baseline. As indicated in Analysis 9.2, Sullivan 1992 reported no statistically significant reduction of anxiety associated with the receipt of intensive advocacy at any time over the following three years: at 12 months (MD − 0.13, 95% CI − 0.35 to 0.09; n = 265), 24 months (MD − 0.01, 95% CI − 0.22 to 0.20; n = 265), or 36 months (MD − 0.11, 95% CI − 0.40 to 0.18; n = 124). In the one study that reported change‐from‐baseline data (Constantino 2005), the women were only followed up immediately postintervention. There was no evidence that advocacy decreased psychological distress (change‐score MD − 35.41, 95% CI − 75.98 to 5.16; n = 24; Analysis 9.3). (N.B. In the Constantino trial, the authors reported a statistically significant effect (P value = 0.013) after using a non‐parametric test to analyse the change from baseline data.)
Analysis 9.4 presents a forest plot showing the effectiveness of any type of advocacy (brief or intensive) on anxiety/psychological distress.
These studies suggest that brief advocacy offered within healthcare settings may reduce abused women's feelings of anxiety and psychological distress in the short‐term, but it is unknown whether such a benefit would persist over time. The benefits of offering intensive advocacy to abused women in the community are unclear at present.
Secondary outcomes
Physical health
Death
Two participants died before completion of the studies into which they were recruited. In McFarlane 2000, which recruited women seeking protection orders, one woman in the control group committed suicide three weeks into the trial. In Sullivan 1992, which recruited women in domestic violence shelters, one woman in the intervention arm was murdered by her partner two weeks into the trial.
Chronic health disorders
Gillum 2009 measured chronic pain and fatigue; over a three‐month period, it provided multiple sessions of brief advocacy to abused women recruited in a healthcare setting. The study authors supplied all data relating to these outcomes. When followed up immediately postintervention, there was no evidence that women who received advocacy reported less chronic pain (MD − 10.50, 95% CI − 26.78 to 5.78; n = 39; Analysis 10.1) or chronic fatigue (MD − 10.50, 95% CI − 26.81 to 5.81; n = 39; Analysis 11.1) than women in the control arm.
Birth outcomes
Kiely 2010 measured birth outcomes following a brief multi‐component intervention delivered to pregnant women (advocacy for abuse and, depending on risk, CBT therapy for depression and therapy for smoking or passive smoking cessation/reduction). It is important to note that for the ORs given below, our calculated percentages differ slightly from those reported in the paper. As indicated in Analysis 12.1, there was no evidence to suggest that women who received the intervention were less likely to deliver underweight babies as compared with women in the control group (babies weighing less than 2500 g, n = 306, OR 0.70, 95% CI 0.36 to 1.37; and babies weighing less than 1500 g, n = 306, OR 0.17, 95% CI 0.02 to 1.41). Similarly, there was no difference between groups in terms of actual birthweight (MD 41.00, 95% CI − 106.19 to 188.19; n = 306; Analysis 13.1), and there was no evidence to suggest that fewer women who received the intervention had premature births (babies born at 37 weeks gestation: OR 0.65, 95% CI 0.34 to 1.24; n = 306; babies born less than 33 weeks gestation: OR 0.22, 95% CI 0.05 to 1.04; n = 306; Analysis 14.1); this latter result differs from the significant effect (P value = 0.03) reported in the paper. Actual gestational age at delivery did significantly differ between women in the two arms of the study, with women who received the intervention delivering babies later (MD 1.30, 95% CI 0.23 to 2.37; n = 306; Analysis 15.1).
No studies provided data on physical injuries or general measures of physical health.
Psychosocial health
Post‐traumatic stress
Women who received advocacy in two trials (Gillum 2009; Hyman 2001) did not significantly differ from women in the control groups in relation to levels of post‐traumatic stress (SMD − 0.21, 95% CI − 0.62 to 0.21, I² = 38%; n = 92; Analysis 16.1), according to data provided by the study investigators.
Perceived stress
Data provided by the authors of Hyman 2001 suggests that women who received advocacy had significantly lower levels of perceived stress compared with women in the control condition (MD − 0.56, 95% CI − 1.09 to − 0.03; n = 53; Analysis 17.1).
Self efficacy
Sullivan 1992 measured self efficacy after intensive advocacy in women exiting domestic violence shelters. We obtained additional statistical data relating to this outcome from the study investigators. At no time point was there evidence that women who received advocacy reported higher levels of self efficacy than women in the control arm. The effect sizes were MD 0.08, 95% CI − 0.19 to 0.35; n = 265 at 12 months follow‐up; MD 0.16, 95% CI −0.10 to 0.42; n = 265 at two years follow‐up; and MD 0.14, 95% CI − 0.22 to 0.50; n = 124 at three years follow‐up (Analysis 18.1).
Self esteem
Sullivan 2002 reported an improvement in self esteem following advocacy (using a multivariate analysis), although our calculated effect size shows that this was statistically non‐significant (MD 0.26, 95% CI − 0.03 to 0.55; n = 78; Analysis 19.1). These data came from the study investigator.
Perceived social support
Five of the studies assessed social support: one of these investigated the effect of brief advocacy for abused women recruited at a community centre (Tiwari 2010); and four evaluated the effect of intensive advocacy offered over a prolonged period to women recruited in or exiting domestic violence shelters, referred from social and family service agencies (Constantino 2005; Sullivan 1992; Sullivan 2002), or attending primary care clinics (Taft 2011). All of these studies assessed social support using an overall measure, but one trial also assessed four separate components of social support (Constantino 2005). This study was also different from the others in that the authors assessed mean change from baseline. We obtained additional statistical data from authors of all four intensive advocacy studies.
There was no evidence that abused women receiving brief advocacy in Tiwari 2010 reported higher levels of social support at six months follow‐up compared with women in the control arm (MD 1.60, 95% CI − 0.37 to 3.57; n = 200; Analysis 20.1). It is important to note that this calculated effect size differs from the statistically significant finding (P value = 0.01) reported by the study authors, who adjusted for baseline differences.
Three of the intensive advocacy trials reported data from the 12‐month follow‐up that could be pooled (Sullivan 1992; Sullivan 2002; Taft 2011). As indicated in the forest plot (Analysis 20.2), there was no evidence to suggest that advocacy had a positive effect on social support in the short‐term (SMD 0.00, 95% CI − 0.19 to 0.19, I² = 16%; n = 446). Further follow‐up data were only available from one of these studies (Sullivan 1992). There was no evidence that advocacy improved social support at two years (SMD 0.12, 95% CI − 0.12 to 0.37; n = 265), but by three years (based on the smaller original sample recruited in to the study), there was a clear and significant beneficial effect on social support outcomes (SMD 0.39, 95% CI 0.03 to 0.74; n = 124). Constantino 2005 (n = 24) reported finding no effect on overall social support following advocacy (using a non‐parametric test), but our analysis (Analysis 20.3) indicates that there was a positive effect (change‐score MD 10.19, 95% CI 5.67 to 14.71) when the women were followed up immediately postintervention. Similarly, while the authors reported an improvement only on the 'belonging' subscale, our analysis showed significant effects for all four subscales: 'tangible' (change‐score MD 2.19, 95% CI 0.93 to 3.45), 'appraisal' (change‐score MD 0.67, 95% CI 0.14 to 1.20), 'self esteem' (change‐score MD 1.14, 95% CI 0.43 to 1.85), and 'belonging' (change‐score MD 4.18, 95% CI 1.18 to 7.18).
For descriptive purposes only, Analysis 20.4 presents a forest plot showing the effectiveness of any type of advocacy (brief or intensive) on social support.
There are insufficient studies to draw a conclusion about the benefits of brief advocacy. For intensive advocacy, there is inconsistent evidence that such an intervention improves social support in the short term. In the long term, intensive advocacy may produce a positive effect, but this is based on the findings of one small study in women who actively sought help.
Impact on relationships
Independence from abuser
Sullivan 1991 and Sullivan 1992 measured independence from the abuser in women recruited in domestic violence shelters who received weekly sessions of advocacy over a period of 10 weeks. Authors of Sullivan 1992 provided additional statistical data for one of the studies.
Both trials measured this outcome at up to 12 months follow‐up, and thus we were able to pool the data (Analysis 21.1). We found no statistically significant, positive, short‐term effect (OR 1.22, 95% CI 0.74 to 2.00, I² = 0%; n = 301). Similar results were evident in Sullivan 1992, the one study that measured independence from the abuser at 12 to 24 months follow‐up (OR 1.27, 95% CI 0.78 to 2.08; n = 261) and at three years (OR 0.97, 95% CI 0.47 to 1.98; n = 119).
The effects of missing data on the results of the one meta‐analysis (n = 330) at 12 months follow‐up were estimated via best case and worst case scenario analyses (Analysis 21.2). A best case scenario (imputing an improved outcome for women in the intervention group and a lack of improvement in the control arm) produced a larger effect size, but the CIs still included no effect (OR 1.58, 95% CI 0.98 to 2.55). Other scenarios also produced non‐significant results: assumption that missing women in both intervention and control groups were independent (OR 1.13, 95% CI 0.71 to 1.80), assumption that missing women in the intervention group were still dependent but those in the control arm were independent (OR 0.82, 95% CI 0.52 to 1.31), and assumption that missing women in both intervention and control groups were dependent (OR 1.13, 95% CI 0.70 to 1.82).
These results provide no clear evidence that intensive advocacy for women who seek refuge in domestic violence shelters helps them to eventually become independent of their abusers.
Emotional attachment to abuser
Sullivan 1992 considered whether intensive advocacy offered to women exiting from domestic violence shelters had a positive effect on their emotional attachment to their abuser. For our analysis, we received additional statistical data from the study investigators. As indicated in the forest plot, there was no evidence that abused women who received advocacy were any less emotionally attached than those in the control arm at up to 12 months (MD − 0.02, 95% CI − 0.08 to 0.04; n = 265), two years (MD 0.00, 95% CI − 0.05 to 0.05; n = 265), or three years (MD − 0.07, 95% CI − 0.14 to 0.00; n = 124; Analysis 22.1).
No study reported data on the following outcomes: alcohol or drug abuse, attempted suicide or self harm.
Socioeconomic measures
No study provided data on socioeconomic outcome measures of income, housing, participation in education, or participation in work.
Proxy or intermediate outcome measures
Use of safety behaviours
Four trials investigated the use of safety behaviours. All studied brief interventions, and three recruited within a healthcare setting (Cripe 2010; Gillum 2009; McFarlane 2006) while one recruited within the community (Tiwari 2010). Two of the trials reported (McFarlane 2006; Tiwari 2010) or provided on request (Gillum 2009) usable follow‐up data. As indicated in Analysis 23.1, pooled data from these three studies at ≤ 12 months follow‐up showed that abused women who received advocacy employed a significantly higher number of safety behaviours compared with women receiving usual care (MD 1.39, 95% CI 0.92 to 1.87, I² = 97%; n = 558). However, this benefit was not apparent in McFarlane 2006, the one trial with a two‐year follow‐up (MD 0.10, 95% CI − 0.42 to 0.62; n = 319). We were not able to obtain any usable data for the Cripe 2010 study. The paper reports that when women were followed up 14 to 28 weeks postintervention, there was an increase in the number of women in the intervention group who adopted 8 of the 13 safety behaviours (range 1.8% to 30.3%); this contrasts with a smaller increase of women in the control group who adopted four of the safety behaviours (range 0.5% to 11.2%). However, there were no statistically significant differences between the two trial arms for any of the 13 safety behaviours investigated.
Resources
Use of resources
The use of resources was measured by four brief advocacy studies recruiting abused women in healthcare settings: McFarlane 2000 employed a summary dichotomous measure of 10 resources, McFarlane 2006 used a summary continuous measure of a revised 8‐item version, Gillum 2009 used a 15‐item measure, and Cripe 2010 reported individual frequency data for 7 items. At protocol stage (Ramsay 2005), we had planned to collect data on participants’ use of refuges/shelters, use of counselling, calls to police, police reports filed and protection orders sought, as individual items. However these data were not available in the reported papers, which used composite checklists. This means the findings reported below are based on related but not identical measures. The resources common to all four studies were domestic violence services/battered women's groups, alcohol/drug treatments, healthcare, and legal services. Both of the studies by McFarlane and colleagues provided multiple, brief sessions of advocacy over a period of months and conducted short‐term (up to 12 months) and medium‐term (12 to 24 months) follow‐up. The trial by Gillum 2009 (additional unpublished data provided) also administered multiple sessions of advocacy (face‐to‐face and via telephone) over a three‐month period, but follow‐up was restricted to immediately postintervention. Analysis 24.1 presents the effect sizes for the trials using a continuous measure (Gillum 2009; McFarlane 2006). There was no evidence that advocacy increased resource use: SMD 0.19, 95% CI − 0.02 to 0.39, I² = 0%; n = 358 at 12 months follow‐up; and MD 0.15, 95% CI − 0.07 to 0.37; n = 319 at 24 months following the first intervention session (with sessions being provided thereafter every six months). The study employing a dichotomous measure (McFarlane 2000) reported no evidence to suggest that advocacy increased the likelihood of resource use over and above that found in the control group of women at any time point, either when advocacy was offered on its own or in combination with the services of a 'mentor mother'. In fact, the opposite occurred, and the likelihood of accessing resources dropped below baseline levels in all groups; particularly in the control (from 32% to 17%) and advocacy (from 33% to 17%) groups, but also for the group with access to a 'mentor mother' (from 23% to 21%). We were unable to calculate the effect sizes for this trial because of the baseline differences between the three groups. Cripe 2010 provided frequency data on the use of individual resources following a 30‐minute advocacy session. The authors report that there were no statistically significant differences in the type of community resource accessed by the women in the two trial arms 14 to 28 weeks postintervention, but they did not provide test values. The results from these four trials suggest that brief advocacy has minimal effect on subsequent resource use by abused women recruited in healthcare settings.
Difficulty in accessing resources
The difficulty that women experienced in accessing resources was measured using a composite 11‐item measure (housing, material goods and services, education, employment, healthcare, child care, transportation, social support, legal assistance, financial issues, and issues regarding the children). Where participants had not directly tried to access a resource, they were asked to answer how difficult they expected it would be.
Sullivan 1991 and Sullivan 1992 assessed this outcome, the latter providing additional data on top of what they reported in their papers. Both studies recruited women exiting a domestic violence shelter and provided intensive weekly advocacy sessions over a 10‐week period. However, Sullivan 1991 did not report any means or standard deviations, nor did the authors make them available. Findings from Sullivan 1992 were mixed. There was no evidence to suggest that abused women who received advocacy experienced fewer difficulties in accessing resources when compared with women in the control arm, either at 12 months follow‐up (MD − 0.01, 95% CI − 0.16 to 0.14; n = 265) or at three years (MD − 0.12, 95% CI − 0.33 to 0.09; n = 124). However, at the two‐year follow‐up, there was a benefit associated with receiving advocacy (MD − 0.18, 95% CI − 0.34 to − 0.02; n = 265; Analysis 25.1). Based on the findings of this one trial, at present there is insufficient evidence to indicate whether intensive advocacy does or does not decrease difficulties in accessing resources.
No study included in this review reported data on the use of refuges/shelters; the use of counselling; calls to police; police reports filed; protection orders sought; and maintenance of family ties (i.e. children staying with mother).
Discussion
Summary of main results
This review identified 11 randomised controlled trials (RCTs) and 2 quasi‐RCTs (reported in 21 papers) that examined the effectiveness of advocacy interventions conducted within healthcare settings (8 studies) and in the community (5 studies), for women who had experienced intimate partner abuse. The studies recruited 2141 participants. The concept of empowerment was integral to the interventions, as was the belief that the help provided should be tailored to meet the wants and needs of the individual women. However, the primary studies had considerable heterogeneity in terms of the intensity of the advocacy offered (from about 30 minutes up to 80 hours), the between‐study differences in staff delivering the advocacy (paraprofessional students, nurses, professional advocates, psychologists, social workers, community health workers, trained 'mentor mothers', and study investigators), the wide range of outcomes reported (25 different outcomes), the methods used to assess these outcomes (continuous or dichotomous measures), and their observed effects. Three of the trials differed in that they evaluated multi‐component interventions in which advocacy was one of several components. The duration of follow‐up also varied across studies and ranged from immediately postintervention to three years. This heterogeneity meant we could only perform a limited number of meta‐analyses. The remainder of the syntheses are in narrative form.
We have summarised results in two logic models, one for brief advocacy (Figure 4) and one for intensive advocacy (Figure 5).

Logic model summarising results for brief advocacy interventions.

Logic model summarising results for intense advocacy interventions.
PTSD: Post Traumatic Stress Disorder.
Overall, we found equivocal evidence that advocacy reduces or leads to a cessation of abuse. There was evidence from two studies with moderate risk of bias that brief advocacy administered in antenatal care may reduce physical abuse at up to 12 months follow‐up, but in one of these the benefit was limited to minor physical abuse. The other study had only immediate postintervention follow‐up, and nearly two‐thirds of the abused women (62%) would also have received CBT for depression in addition to advocacy. There is moderate to low quality evidence for a lack of effect of brief advocacy in reducing physical abuse (severity undifferentiated) in other settings and designs at up to 12 months follow‐up. There is low to very low quality evidence that there is a marginal reduction in physical abuse from intensive advocacy at up to 12 months follow‐up. However, the two trials of intensive advocacy in women recruited in domestic violence shelters/refuges had a high risk of bias. One of these studies had medium term follow‐up and reported that intensive advocacy increased the cessation of physical abuse in women exiting a shelter at 12 to 24 months.
There is moderate quality evidence that brief advocacy has no effect in reducing sexual abuse at up to 12 months follow‐up.
The evidence for brief or intensive advocacy reducing emotional abuse is inconsistent. There is moderate‐to‐low quality evidence that brief advocacy reduces emotional abuse at up to 12 months follow‐up in an antenatal setting but not in other settings. Aside from the one study with positive findings, four other trials of brief advocacy showed no positive effect on emotional abuse (three recruiting within healthcare and one in the community). The one study of intensive advocacy also failed to demonstrate any benefit.
There is low to very low quality evidence indicating that both brief and intensive advocacy slightly reduce overall abuse; the confidence intervals either include zero or cross the line of no effect.
In summary, there were no differences between the intervention and control arms of the primary studies for the majority of abuse outcomes, none of the evidence was of good quality, and data from most of the studies for most of the abuse outcomes could not be pooled to increase the power of the analyses.
Studies measuring other primary psychosocial outcomes showed some benefit for advocacy but, as with abuse measures, evidence was not good quality, and benefits were not consistent across studies and settings. There was evidence that brief advocacy improves depression in abused women attending healthcare facilities and that psychological distress may decrease when abused women attending a hospital emergency department receive a brief session of advocacy. However, these findings were based on only three studies, and there was no evidence that the effect persisted over time. Neither of the two intensive studies reported an effect on psychological distress. There was no reduction in depression associated with intensive advocacy, and no benefit in terms of reducing anxiety/psychological distress, though the quality of the data was weak. The three trials of brief advocacy that measured the effect on quality of life suggested that there was no benefit. In contrast, there was some low quality evidence that intensive advocacy may improve abused women's quality of life in the short term: two studies assessed overall quality of life in women recruited from domestic violence shelters/refuges and reported an improved 'physical' quality of life (but no equivalent in perceived 'mental' quality of life) when women were recruited in primary care settings.
In terms of secondary outcomes, once again the findings are mixed. There is evidence that brief advocacy leads to more safety behaviours being practiced in the short‐term, but in the long‐term (and based on results from a single study) this benefit is no longer apparent. Brief advocacy improved perceived anxiety/psychological distress in one trial set in a hospital emergency department. Similarly, abused women receiving brief advocacy within an antenatal setting delivered babies with higher gestational ages; however, no other benefits in birth outcomes were reported. The findings for social support were equivocal; in particular there was contradictory evidence about whether abused women report improved support following intensive advocacy. It remains unclear if advocacy can help women to remain independent of their abusers or to emotionally detach from their abuser. Similarly, there was no evidence to suggest that advocacy improves chronic pain and fatigue, self efficacy, self esteem, or post‐traumatic stress disorder, or that women receiving advocacy are more likely to access community resources.
Taken as a whole, we conclude that brief or intensive advocacy administered to abused women may improve a wide range of outcomes, but the magnitude and consistency of these benefits are still uncertain. The positive findings of one antenatal study with low risk of bias were striking in that the provision of a one‐off session of advocacy led to a reduction in minor physical abuse, emotional abuse, and post‐natal depression (Tiwari 2005). However, the overall findings from the remaining 12 trials were mixed, reflecting the lack of power of the primary studies. Unfortunately, the heterogeneity of interventions and outcomes measured across the studies precluded the pooling of many results and an estimate of the magnitude of the overall effect. Where meta‐analysis was possible, we were only able to pool a maximum of three studies. For these reasons, the present findings are not conclusive with regards to the benefits of advocacy.
Overall completeness and applicability of evidence
The studies included in this review were conducted on women recruited in a variety of settings, with eight studies based in healthcare organisations. However, most took place in developed, industrialised countries, and none of the trials were carried out in rural settings. Most of the women were recruited because they were experiencing current physical or sexual abuse (within the last 12 months), although seven studies also included women experiencing physical, sexual or emotional abuse. The majority of the participants were married or still in contact with the perpetrator at study entry. The age range of participants was wide (15 to 65 years). Most of the women were of lower socioeconomic status. There was ethnic diversity across many of the trials (whites, African Americans and Latinas), but five studies were ethnically exclusive (African American, Latina and Chinese) or near exclusive (Mestizo).
From the available evidence, we cannot say whether the interventions had similar effects on women experiencing different types of abuse. Many of the women recruited into the studies reported severe physical abuse, so it is possible that advocacy is acceptable to women who are at high risk of further physical and sexual abuse. However, there is also some evidence that advocacy may be more effective with less severe physical abuse. It is not known if advocacy is acceptable to women experiencing other forms of intimate partner abuse, although one of our included studies (Tiwari 2010) recruited women from a community centre who were primarily experiencing psychological abuse. In terms of differential effects related to where a woman is in the abuse trajectory, we do not know whether women actively seeking help (such as those recruited in shelters or refuges) might benefit more or less from advocacy than women who have just disclosed abuse, such as those recruited in a healthcare setting. We cannot resolve that question based on the included studies, as there was no consistent difference in benefits for different outcomes between settings. There was also little evidence available to show if advocacy interventions were any more or less effective amongst people from different ethnic groups. The urban setting common to all of the studies prevents us from drawing any conclusions about the effectiveness of advocacy interventions for abused women residing in rural locations.
It was not possible to determine what aspects of advocacy interventions were the most or the least effective, as none of the included studies considered this question, and there were not enough studies to pool for any outcome for meta‐regression analysis. Neither were we able to reach any conclusions about the potential additional impact on outcomes from the studies that were multi‐component in content (i.e. which offered components other than advocacy to abused women, their children, or both), as there were insufficient studies to conduct a subgroup analysis.
One study did not lose any participants over time (Tiwari 2010), while another lost nearly half (48%) of its sample (Hyman 2001). The other 11 trials all retained at least 73% of their recruited sample.
Quality of the evidence
Only one trial was assessed to have low risk of bias in all the criteria considered (Tiwari 2005). Four of the studies provided insufficient detail to confidently ascertain whether they complied with at least four of the eight 'Risk of bias' criteria. In six trials, there were insufficient details about the method of sequence generation, and in five of the studies it was not clear if allocation concealment was maintained (in a further three studies, this was compromised). Four studies did not give sufficient information on whether the outcomes measures were assessed blindly (and a further four were not blinded). Seven did not provide full details on the completeness of their data or else had attrition that was significantly different between groups. Eight of the studies did not discuss what steps, if any, were taken to prevent women in the control group from receiving components of the intervention (and a further three reported that this was compromised). We were unable to attribute differences in effect sizes for any given outcome to the risk of bias. Taken as a whole, we conclude that the present evidence for the effectiveness of advocacy is undermined because of difficulties in assessing the risk of bias for most trials in the review. Future reports of advocacy interventions should include full details on how the studies have been conducted, thereby allowing for the risk of bias to be determined.
When considering the data in terms of GRADE for abuse outcomes at ≤ 12 months follow‐up, the quality of evidence for most abuse outcomes from intensive advocacy was rated as very low, in all cases because of a combination of risk of bias and imprecision. All studies lost GRADE points because of imprecision, which was judged to occur with continuous measures when the sample size was less than 400, the standard deviation was greater than 0.5, or both, and with dichotomous measures when the results crossed the line of no effect, the total number of outcome events was less than 300, or both. This highlights the need for larger studies; four of the studies in this review were pilots, which may partly also explain the high risk of bias.
Using GRADE, we found that the quality of the evidence for abuse outcomes for brief advocacy was higher, though still poor; the evidence was assessed as moderate to low, with none being considered very low quality. Reasons were mixed, with five rated as moderate because of imprecision issues, one because of indirectness, and one because of risk of bias; three outcome results were graded as low quality.
Potential biases in the review process
We believe that our review process identified all RCTs and quasi‐RCTs on advocacy interventions for women experiencing partner abuse published up to the censor date. We also obtained a copy of an unpublished PhD thesis that evaluated an advocacy intervention. We obtained additional data from all but one of the study authors that we contacted. Likewise, the majority of trialists responded to our request to inform us of any other trials that we may have missed. Other experts in this field also responded to our request asking if they knew of any additional trials. Two review authors independently made decisions about inclusion of studies and assessment of risk of bias and outcome quality, and another checked data extraction.
Agreements and disagreements with other studies or reviews
This review broadly concurs with the findings of previous reviews of advocacy interventions (Abel 2000; Feder 2009; Hender 2001; Klevens 2004; Nelson 2004; Ramsay 2002; Ramsay 2005a; Wathen 2003) and the review on which the WHO guidelines (WHO 2013b) are based, although by restricting ourselves to RCTs and quasi‐RCTs, we have excluded studies that were included in some of the other reviews. Hence, we were more conservative in our judgement of the effectiveness of advocacy. However, by increasing the number of identified RCTs and quasi‐RCTs and calculating effect sizes for most of the outcomes reported in the included studies, we have extended the findings of earlier reviews. Previous reviews have reported the findings as reported by the individual study authors. By calculating the effect sizes (mean or SMD and OR) we were able to compare across studies. We have also highlighted some discrepancies between results reported as statistically significant and the effect sizes as calculated by our team. Generally we concur that, while there is some evidence that advocacy in health or community settings can reduce further abuse and improve psychosocial outcomes of women experiencing partner abuse, there are too few studies studying the same intervention and measuring the same outcomes over a reasonable period of time to draw any firm conclusions about the magnitude of the benefit or the populations most amenable to the interventions.
Risk of bias summary: review authors' judgements about each risk of bias item for each included study. Red circles with minus signs indicate high risk, green circles with plus signs indicate low risk, and yellow circles with question marks indicate unclear risk of bias.
Review flow diagram.
IPV: intimate partner violence; RCT: randomised controlled trial.
Risk of bias graph: review authors' judgements about each risk of bias item presented as percentages across all included studies.
Logic model summarising results for brief advocacy interventions.
Logic model summarising results for intense advocacy interventions.
PTSD: Post Traumatic Stress Disorder.
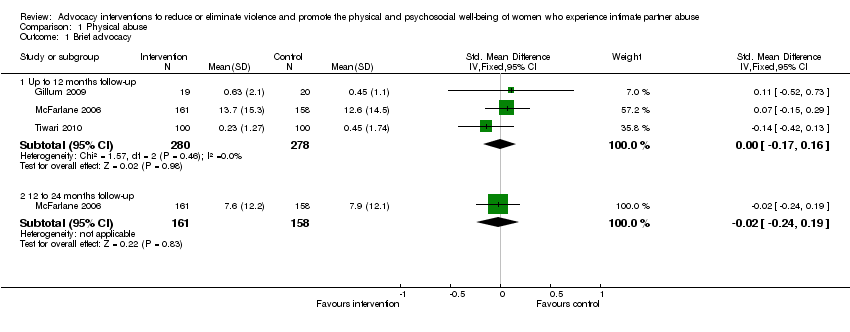
Comparison 1 Physical abuse, Outcome 1 Brief advocacy.

Comparison 1 Physical abuse, Outcome 2 Brief advocacy (dichotomous outcome) (up to 12 months follow‐up).

Comparison 1 Physical abuse, Outcome 3 Brief advocacy (mean change).

Comparison 1 Physical abuse, Outcome 4 Intensive advocacy.

Comparison 1 Physical abuse, Outcome 5 Intensive advocacy (dichotomous outcome).

Comparison 1 Physical abuse, Outcome 6 Intensive advocacy: missing reassigned (dichotomous outcome) (up to 12 months follow‐up).
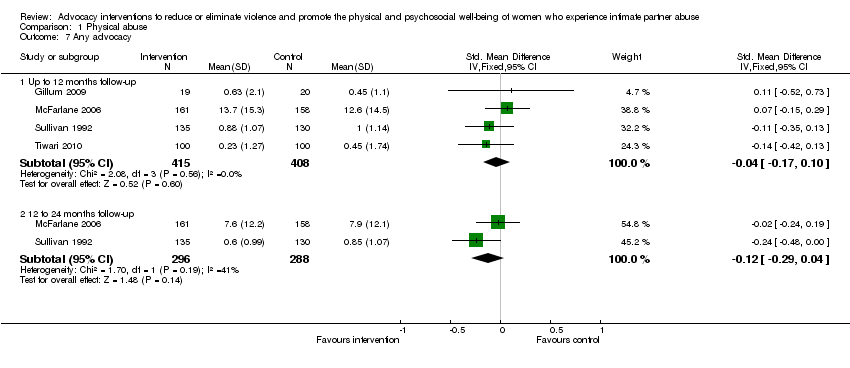
Comparison 1 Physical abuse, Outcome 7 Any advocacy.
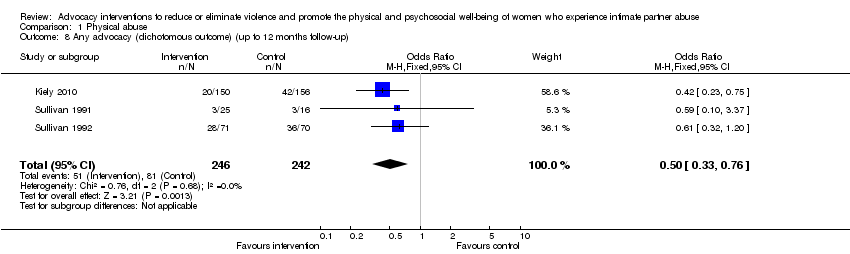
Comparison 1 Physical abuse, Outcome 8 Any advocacy (dichotomous outcome) (up to 12 months follow‐up).
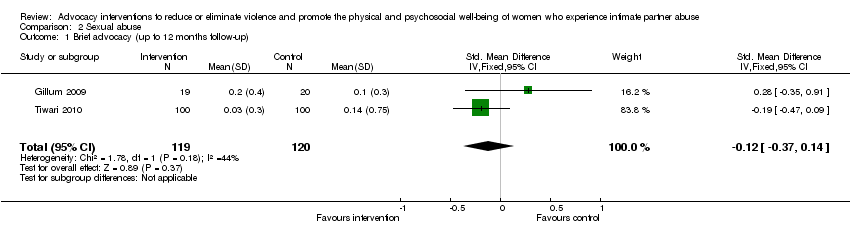
Comparison 2 Sexual abuse, Outcome 1 Brief advocacy (up to 12 months follow‐up).

Comparison 2 Sexual abuse, Outcome 2 Brief advocacy (mean change) (up to 12 months follow‐up).

Comparison 2 Sexual abuse, Outcome 3 Brief advocacy (dichotomous outcome) (up to 12 months follow‐up).

Comparison 3 Emotional abuse, Outcome 1 Brief advocacy.
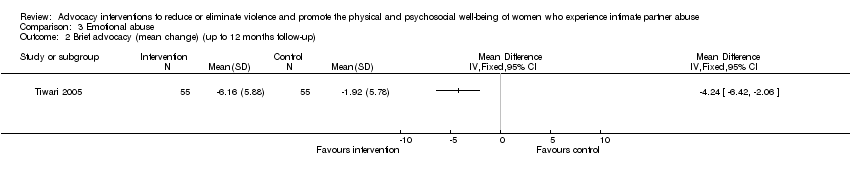
Comparison 3 Emotional abuse, Outcome 2 Brief advocacy (mean change) (up to 12 months follow‐up).
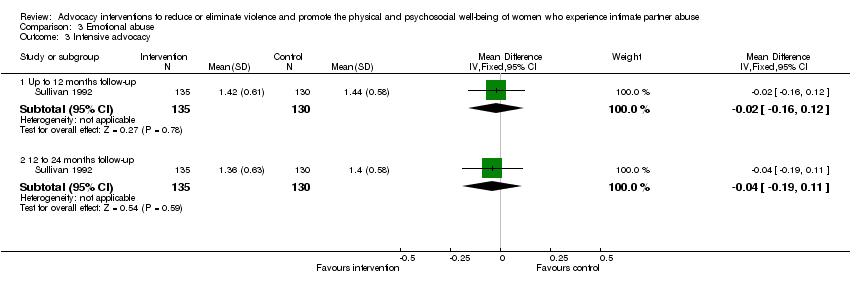
Comparison 3 Emotional abuse, Outcome 3 Intensive advocacy.

Comparison 3 Emotional abuse, Outcome 4 Intensive advocacy (dichotomous outcome) (up to 12 months follow‐up).

Comparison 3 Emotional abuse, Outcome 5 Any advocacy.

Comparison 4 Risk of homicide, Outcome 1 Brief advocacy.

Comparison 5 Risk of work harassment, Outcome 1 Brief advocacy.

Comparison 6 Overall abuse, Outcome 1 Brief advocacy (up to 12 months follow‐up).

Comparison 6 Overall abuse, Outcome 2 Intensive advocacy (up to 12 months follow‐up).
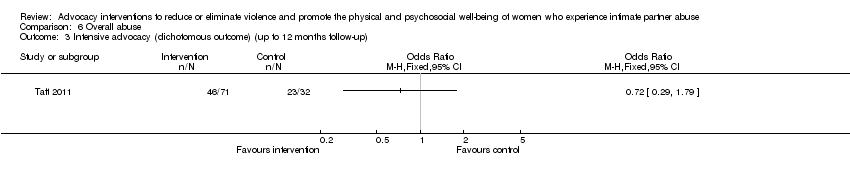
Comparison 6 Overall abuse, Outcome 3 Intensive advocacy (dichotomous outcome) (up to 12 months follow‐up).

Comparison 6 Overall abuse, Outcome 4 Any advocacy (up to 12 months follow‐up).

Comparison 7 Quality of life, Outcome 1 Brief advocacy: 2 summary component subscales.

Comparison 7 Quality of life, Outcome 2 Brief advocacy: 8 subscales (mean change).

Comparison 7 Quality of life, Outcome 3 Intensive advocacy: 2 summary component subscales.

Comparison 7 Quality of life, Outcome 4 Intensive advocacy: overall.
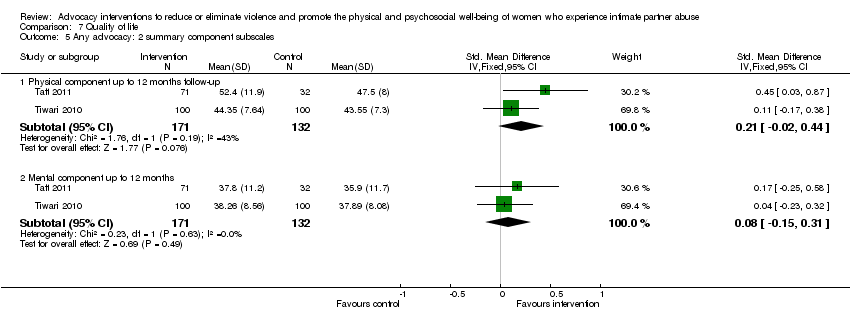
Comparison 7 Quality of life, Outcome 5 Any advocacy: 2 summary component subscales.

Comparison 8 Depression, Outcome 1 Brief advocacy (up to 12 months follow‐up).
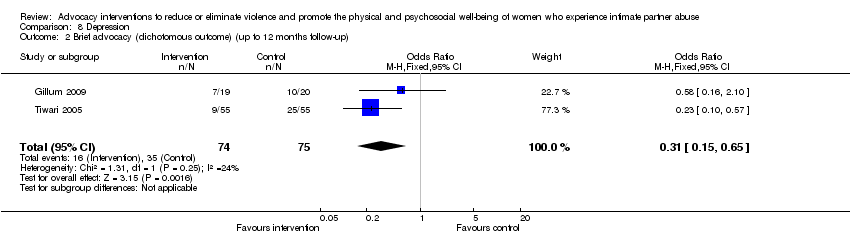
Comparison 8 Depression, Outcome 2 Brief advocacy (dichotomous outcome) (up to 12 months follow‐up).

Comparison 8 Depression, Outcome 3 Intensive advocacy.
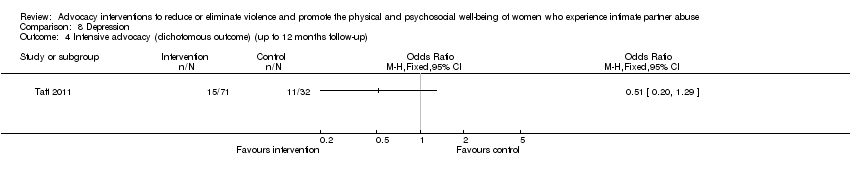
Comparison 8 Depression, Outcome 4 Intensive advocacy (dichotomous outcome) (up to 12 months follow‐up).

Comparison 8 Depression, Outcome 5 Any advocacy (up to 12 months follow‐up).

Comparison 8 Depression, Outcome 6 Any advocacy (dichotomous outcome) (up to 12 months follow‐up).

Comparison 9 Anxiety, Outcome 1 Brief advocacy (up to 12 months follow‐up).

Comparison 9 Anxiety, Outcome 2 Intensive advocacy.
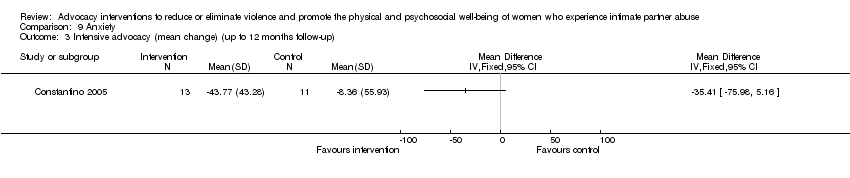
Comparison 9 Anxiety, Outcome 3 Intensive advocacy (mean change) (up to 12 months follow‐up).
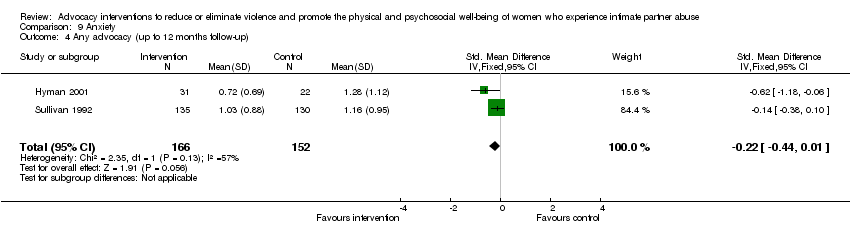
Comparison 9 Anxiety, Outcome 4 Any advocacy (up to 12 months follow‐up).

Comparison 10 Chronic pain, Outcome 1 Brief advocacy (up to 12 months follow‐up).
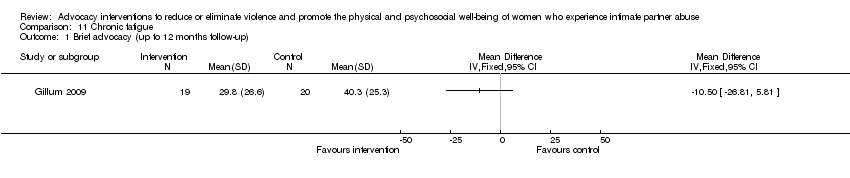
Comparison 11 Chronic fatigue, Outcome 1 Brief advocacy (up to 12 months follow‐up).

Comparison 12 Low birth weight, Outcome 1 Brief advocacy (dichotomous outcome).
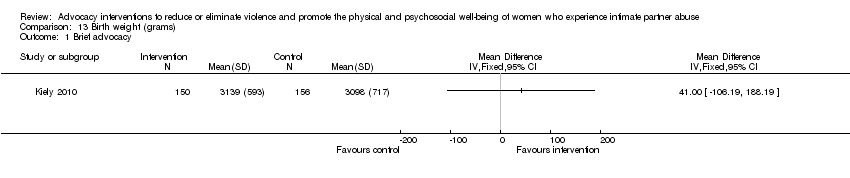
Comparison 13 Birth weight (grams), Outcome 1 Brief advocacy.
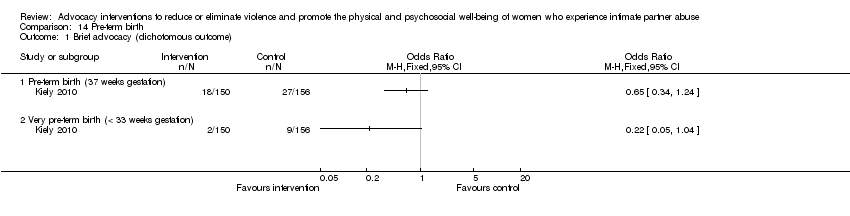
Comparison 14 Pre‐term birth, Outcome 1 Brief advocacy (dichotomous outcome).
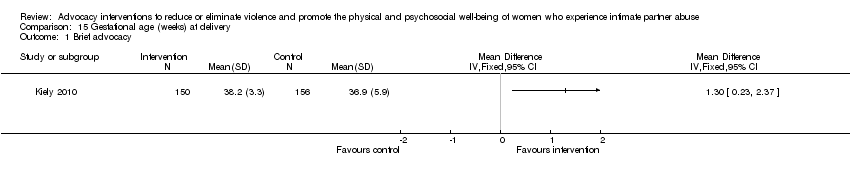
Comparison 15 Gestational age (weeks) at delivery, Outcome 1 Brief advocacy.

Comparison 16 Post‐traumatic stress, Outcome 1 Brief advocacy (up to 12 months follow‐up).

Comparison 17 Perception of stress, Outcome 1 Brief advocacy (up to 12 months follow‐up).

Comparison 18 Self efficacy, Outcome 1 Intensive advocacy.

Comparison 19 Self esteem, Outcome 1 Intensive advocacy (up to 12 months follow‐up).

Comparison 20 Perceived social support, Outcome 1 Brief advocacy (up to 12 months follow‐up).

Comparison 20 Perceived social support, Outcome 2 Intensive advocacy.

Comparison 20 Perceived social support, Outcome 3 Intensive advocacy (mean change).

Comparison 20 Perceived social support, Outcome 4 Any advocacy (up to 12 months follow‐up).
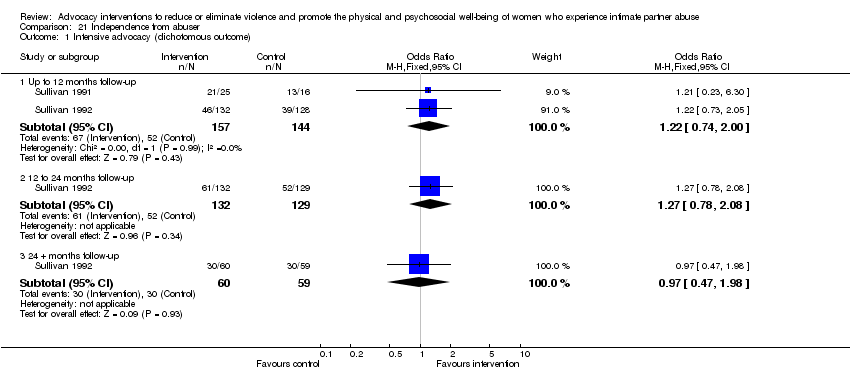
Comparison 21 Independence from abuser, Outcome 1 Intensive advocacy (dichotomous outcome).

Comparison 21 Independence from abuser, Outcome 2 Intensive advocacy: missing reassigned (up to 12 months follow‐up) (dichotomous outcome).
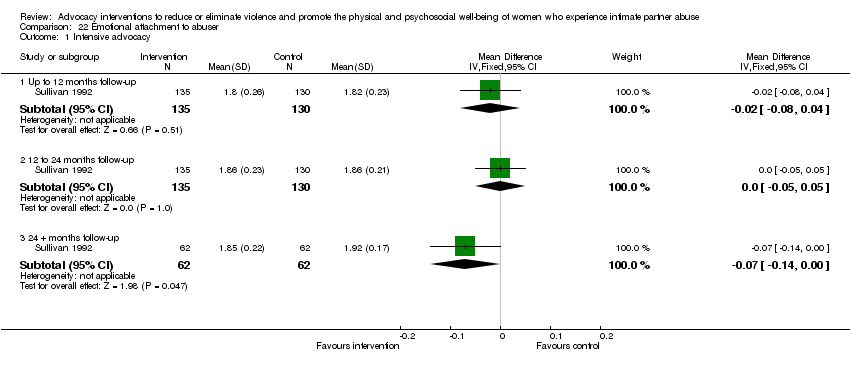
Comparison 22 Emotional attachment to abuser, Outcome 1 Intensive advocacy.

Comparison 23 Use of safety behaviours, Outcome 1 Brief advocacy.

Comparison 24 Use of resources, Outcome 1 Brief advocacy.
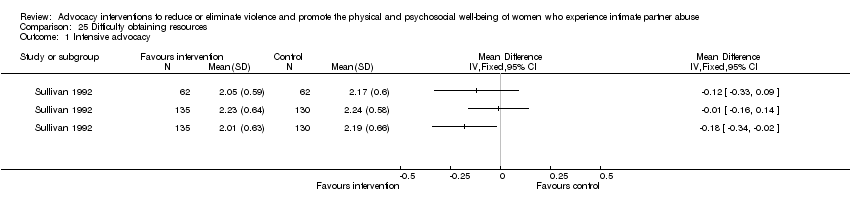
Comparison 25 Difficulty obtaining resources, Outcome 1 Intensive advocacy.
| Intensive advocacy interventions for women who experience intimate partner abuse versus usual care at up to 12‐month follow‐up | ||||||
| Patient or population: women with intimate partner abuse | ||||||
| Outcomes | Illustrative comparative risks* (95% CI) | Relative effect | No. of participants | Quality of the evidence | Comments | |
| Assumed risk | Corresponding risk | |||||
| Control | Intensive advocacy interventions | |||||
| Physical abuse | The mean physical abuse in the control groups was | The mean physical abuse in the intervention groups was 0.12 lower (0.39 lower to 0.15 higher) | — | 265 | ⊕⊕⊝⊝ | |
| Physical abuse (dichotomous outcome) | Study population | OR 0.61 | 182 | ⊕⊝⊝⊝ | ||
| 453 per 1000 | 336 per 1000 (215 to 486) | |||||
| Moderate effect | ||||||
| Emotional abuse (dichotomous outcome) | Study population | OR 0.58 | 141 | ⊕⊕⊕⊝ | ||
| 557 per 1000 | 422 per 1000 (274 to 587) | |||||
| Moderate effect | ||||||
| Emotional abuse | The mean emotional abuse in the control groups was 1.4 | The mean emotional abuse in the intervention groups was 0.02 lower (0.16 lower to 0.12 higher) | — | 265 | ⊕⊝⊝⊝ | |
| Overall abuse Other study used Composite Abuse Scale (CAS)i (30 items presented in a 6‐point format requiring respondents to answer 'never', 'only once', 'several times', 'monthly', 'weekly' or 'daily' in a 12‐month period) | The mean overall abuse ranged across control groups from 0.58 to 27.10 | The mean overall abuse in the intervention groups was 0.23 standard deviations lower (0.53 lower to 0.08 higher) | — | 181 | ⊕⊝⊝⊝ | |
| Overall abuse (dichotomous outcome) | Study population | OR 0.72 | 103 | ⊕⊝⊝⊝ | ||
| 719 per 1000 | 648 per 1000 (426 to 821) | |||||
| Moderate effect | ||||||
| *The basis for the assumed risk (e.g. the median control group risk across studies) is provided in footnotes. The corresponding risk (and its 95% CI) is based on the assumed risk in the comparison group and the relative effect of the intervention (and its 95% CI). | ||||||
| GRADE Working Group grades of evidence | ||||||
| aInsufficient information available concerning random sequence generation, blinding and protection against contamination, and attrition bias. | ||||||
| Brief advocacy interventions for women who experience intimate partner abuse versus usual care at up to 12‐month follow‐up | |||||
| Patient or population: women with intimate partner abuse | |||||
| Outcomes | Illustrative comparative risks* (95% CI) | No. of participants | Quality of the evidence | Comments | |
| Assumed risk | Corresponding risk | ||||
| Control | Brief advocacy interventions | ||||
| Physical abuse | The mean physical abuse ranged across control groups from 0.45 to 12.6 | The mean physical abuse in the intervention groups was 0 standard deviations higher | 558 | ⊕⊕⊕⊝ | |
| Physical abuse by severity ‐ severe | The mean physical abuse by severity ‐ severe in the control groups was 0.17 | The mean physical abuse by severity ‐ severe in the intervention groups was 0.08 higher | 110 | ⊕⊕⊕⊝ | |
| Sexual abuse | The mean sexual abuse ranged across control groups from 0.10 to 0.14 | The mean sexual abuse in the intervention groups was 0.12 standard deviations lower | 239 | ⊕⊕⊕⊝ | |
| Sexual abuse | The mean sexual abuse in the control groups was − 0.06 | The mean sexual abuse in the intervention groups was 0.07 lower | 110 | ⊕⊕⊕⊝ | |
| Emotional abuse | The mean emotional abuse ranged across control groups from 12.11 to 24.80 | The mean emotional abuse in the intervention groups was 0.05 standard deviations lower | 558 | ⊕⊕⊝⊝ | |
| Emotional abuse | The mean emotional abuse in the control groups was − 1.92 | The mean emotional abuse in the intervention groups was 4.24 lower (6.42 lower to 2.06 lower) | 110 | ⊕⊕⊕⊝ | |
| Overall abuse | The mean overall abuse in the control groups was 23.39 | The mean overall abuse in the intervention groups was 7.74 standard deviations lower | 53 | ⊕⊕⊝⊝ | |
| *The basis for the assumed risk (e.g. the median control group risk across studies) is provided in footnotes. The corresponding risk (and its 95% CI) is based on the assumed risk in the comparison group and the relative effect of the intervention (and its 95% CI). | |||||
| GRADE Working Group grades of evidence | |||||
| aPartner Abuse Scale (PAS), physical subscale; 46‐item Severity of Violence Against Women Scale (SVAWS), physical violence subscale; Chinese version of the 39‐item Revised Conflicts Tactics Scale (CTS), psychological aggression subscale. | |||||
| Issue | Method |
| Assessment of reporting bias | We planned to draw funnel plots to investigate possible relationships between effect size and study precision, closely related to sample size (Egger 1997). For meaningful funnel plots, a large number of trials with a spread of sample sizes are required (Glasziou 2001; Hayashino 2005). We planned to draw funnel plots if there were at least 7 trials with appropriate data. |
| Subgroup analyses and investigation of heterogeneity | We plan to perform subgroup analyses for the following.
Theoretical justification for subgroup analyses.
|
| Sensitivity analyses | To assess the robustness of conclusions to quality of data and approaches to analysis, we will perform sensitivity analyses, including the following.
|
| Outcome or subgroup title | No. of studies | No. of participants | Statistical method | Effect size |
| 1 Brief advocacy Show forest plot | 3 | Std. Mean Difference (IV, Fixed, 95% CI) | Subtotals only | |
| 1.1 Up to 12 months follow‐up | 3 | 558 | Std. Mean Difference (IV, Fixed, 95% CI) | ‐0.00 [‐0.17, 0.16] |
| 1.2 12 to 24 months follow‐up | 1 | 319 | Std. Mean Difference (IV, Fixed, 95% CI) | ‐0.02 [‐0.24, 0.19] |
| 2 Brief advocacy (dichotomous outcome) (up to 12 months follow‐up) Show forest plot | 1 | Odds Ratio (M‐H, Fixed, 95% CI) | Totals not selected | |
| 3 Brief advocacy (mean change) Show forest plot | 1 | Mean Difference (IV, Fixed, 95% CI) | Subtotals only | |
| 3.1 'Severe' up to 12 months follow‐up | 1 | 110 | Mean Difference (IV, Fixed, 95% CI) | 0.08 [‐0.26, 0.42] |
| 3.2 'Minor' up to 12 months follow‐up | 1 | 110 | Mean Difference (IV, Fixed, 95% CI) | ‐1.0 [‐1.82, ‐0.18] |
| 4 Intensive advocacy Show forest plot | 1 | Mean Difference (IV, Fixed, 95% CI) | Subtotals only | |
| 4.1 Up to 12 months follow‐up | 1 | 265 | Mean Difference (IV, Fixed, 95% CI) | ‐0.12 [‐0.39, 0.15] |
| 4.2 12 to 24 months follow‐up | 1 | 265 | Mean Difference (IV, Fixed, 95% CI) | ‐0.25 [‐0.50, ‐0.00] |
| 4.3 24 + months follow‐up | 1 | 124 | Mean Difference (IV, Fixed, 95% CI) | 0.18 [‐0.20, 0.56] |
| 5 Intensive advocacy (dichotomous outcome) Show forest plot | 2 | Odds Ratio (M‐H, Fixed, 95% CI) | Subtotals only | |
| 5.1 Up to 12 months follow‐up | 2 | 182 | Odds Ratio (M‐H, Fixed, 95% CI) | 0.61 [0.33, 1.14] |
| 5.2 12 to 24 months follow‐up | 1 | 265 | Odds Ratio (M‐H, Fixed, 95% CI) | 0.39 [0.20, 0.77] |
| 5.3 24 + months follow‐up | 1 | 124 | Odds Ratio (M‐H, Fixed, 95% CI) | 1.07 [0.52, 2.23] |
| 6 Intensive advocacy: missing reassigned (dichotomous outcome) (up to 12 months follow‐up) Show forest plot | 2 | Odds Ratio (M‐H, Fixed, 95% CI) | Subtotals only | |
| 6.1 Missing intervention group not abused, control group abused | 2 | 192 | Odds Ratio (M‐H, Fixed, 95% CI) | 0.54 [0.29, 1.01] |
| 6.2 Missing intervention group and control group all not abused | 2 | 192 | Odds Ratio (M‐H, Fixed, 95% CI) | 0.54 [0.29, 1.01] |
| 6.3 Missing intervention group abused, control group not abused | 2 | 192 | Odds Ratio (M‐H, Fixed, 95% CI) | 0.83 [0.46, 1.49] |
| 6.4 Missing intervention group and control group all abused | 2 | 192 | Odds Ratio (M‐H, Fixed, 95% CI) | 0.83 [0.46, 1.49] |
| 7 Any advocacy Show forest plot | 4 | Std. Mean Difference (IV, Fixed, 95% CI) | Subtotals only | |
| 7.1 Up to 12 months follow‐up | 4 | 823 | Std. Mean Difference (IV, Fixed, 95% CI) | ‐0.04 [‐0.17, 0.10] |
| 7.2 12 to 24 months follow‐up | 2 | 584 | Std. Mean Difference (IV, Fixed, 95% CI) | ‐0.12 [‐0.29, 0.04] |
| 8 Any advocacy (dichotomous outcome) (up to 12 months follow‐up) Show forest plot | 3 | 488 | Odds Ratio (M‐H, Fixed, 95% CI) | 0.50 [0.33, 0.76] |
| Outcome or subgroup title | No. of studies | No. of participants | Statistical method | Effect size |
| 1 Brief advocacy (up to 12 months follow‐up) Show forest plot | 2 | 239 | Std. Mean Difference (IV, Fixed, 95% CI) | ‐0.12 [‐0.37, 0.14] |
| 2 Brief advocacy (mean change) (up to 12 months follow‐up) Show forest plot | 1 | Mean Difference (IV, Fixed, 95% CI) | Totals not selected | |
| 3 Brief advocacy (dichotomous outcome) (up to 12 months follow‐up) Show forest plot | 1 | Odds Ratio (M‐H, Fixed, 95% CI) | Totals not selected | |
| Outcome or subgroup title | No. of studies | No. of participants | Statistical method | Effect size |
| 1 Brief advocacy Show forest plot | 3 | Std. Mean Difference (IV, Fixed, 95% CI) | Subtotals only | |
| 1.1 Up to 12 months follow‐up | 3 | 558 | Std. Mean Difference (IV, Fixed, 95% CI) | ‐0.05 [‐0.22, 0.11] |
| 1.2 12 to 24 months follow‐up | 1 | 319 | Std. Mean Difference (IV, Fixed, 95% CI) | ‐0.06 [‐0.28, 0.16] |
| 2 Brief advocacy (mean change) (up to 12 months follow‐up) Show forest plot | 1 | Mean Difference (IV, Fixed, 95% CI) | Totals not selected | |
| 3 Intensive advocacy Show forest plot | 1 | Mean Difference (IV, Fixed, 95% CI) | Subtotals only | |
| 3.1 Up to 12 months follow‐up | 1 | 265 | Mean Difference (IV, Fixed, 95% CI) | ‐0.02 [‐0.16, 0.12] |
| 3.2 12 to 24 months follow‐up | 1 | 265 | Mean Difference (IV, Fixed, 95% CI) | ‐0.04 [‐0.19, 0.11] |
| 4 Intensive advocacy (dichotomous outcome) (up to 12 months follow‐up) Show forest plot | 1 | Odds Ratio (M‐H, Fixed, 95% CI) | Totals not selected | |
| 5 Any advocacy Show forest plot | 4 | Std. Mean Difference (IV, Fixed, 95% CI) | Subtotals only | |
| 5.1 Up to 12 months follow‐up | 4 | 823 | Std. Mean Difference (IV, Fixed, 95% CI) | ‐0.05 [‐0.18, 0.09] |
| 5.2 12 to 24 months follow‐up | 2 | 584 | Std. Mean Difference (IV, Fixed, 95% CI) | ‐0.06 [‐0.22, 0.10] |
| Outcome or subgroup title | No. of studies | No. of participants | Statistical method | Effect size |
| 1 Brief advocacy Show forest plot | 2 | Mean Difference (IV, Fixed, 95% CI) | Subtotals only | |
| 1.1 Up to 12 months follow‐up | 2 | 358 | Mean Difference (IV, Fixed, 95% CI) | 0.13 [‐0.54, 0.80] |
| 1.2 12 to 24 months follow‐up | 1 | 319 | Mean Difference (IV, Fixed, 95% CI) | ‐0.30 [‐1.07, 0.47] |
| Outcome or subgroup title | No. of studies | No. of participants | Statistical method | Effect size |
| 1 Brief advocacy Show forest plot | 1 | Mean Difference (IV, Fixed, 95% CI) | Subtotals only | |
| 1.1 Up to 12 months follow‐up | 1 | 319 | Mean Difference (IV, Fixed, 95% CI) | 0.10 [‐0.36, 0.56] |
| 1.2 12 to 24 months follow‐up | 1 | 319 | Mean Difference (IV, Fixed, 95% CI) | ‐0.60 [‐0.97, ‐0.23] |
| Outcome or subgroup title | No. of studies | No. of participants | Statistical method | Effect size |
| 1 Brief advocacy (up to 12 months follow‐up) Show forest plot | 1 | Mean Difference (IV, Fixed, 95% CI) | Totals not selected | |
| 2 Intensive advocacy (up to 12 months follow‐up) Show forest plot | 2 | Std. Mean Difference (IV, Fixed, 95% CI) | Totals not selected | |
| 3 Intensive advocacy (dichotomous outcome) (up to 12 months follow‐up) Show forest plot | 1 | Odds Ratio (M‐H, Fixed, 95% CI) | Totals not selected | |
| 4 Any advocacy (up to 12 months follow‐up) Show forest plot | 3 | 234 | Std. Mean Difference (IV, Fixed, 95% CI) | ‐0.26 [‐0.52, 0.01] |
| Outcome or subgroup title | No. of studies | No. of participants | Statistical method | Effect size |
| 1 Brief advocacy: 2 summary component subscales Show forest plot | 1 | Mean Difference (IV, Fixed, 95% CI) | Subtotals only | |
| 1.1 Physical component up to 12 months follow‐up | 1 | 200 | Mean Difference (IV, Fixed, 95% CI) | 0.80 [‐1.27, 2.87] |
| 1.2 Mental component up to 12 months follow‐up | 1 | 200 | Mean Difference (IV, Fixed, 95% CI) | 0.37 [‐1.94, 2.68] |
| 2 Brief advocacy: 8 subscales (mean change) Show forest plot | 2 | Mean Difference (IV, Fixed, 95% CI) | Subtotals only | |
| 2.1 Physical functioning up to 12 months follow‐up | 2 | 314 | Mean Difference (IV, Fixed, 95% CI) | 4.92 [‐0.32, 10.16] |
| 2.2 Role physical up to 12 months follow‐up | 2 | 314 | Mean Difference (IV, Fixed, 95% CI) | 7.42 [‐0.97, 15.80] |
| 2.3 Bodily pain up to 12 months follow‐up | 2 | 314 | Mean Difference (IV, Fixed, 95% CI) | ‐4.51 [‐10.42, 1.39] |
| 2.4 General health up to 12 months follow‐up | 2 | 314 | Mean Difference (IV, Fixed, 95% CI) | ‐0.85 [‐4.06, 2.37] |
| 2.5 Vitality up to 12 months follow‐up | 2 | 314 | Mean Difference (IV, Fixed, 95% CI) | ‐1.38 [‐5.56, 2.80] |
| 2.6 Social functioning up to 12 months follow‐up | 2 | 314 | Mean Difference (IV, Fixed, 95% CI) | 0.92 [‐5.00, 6.84] |
| 2.7 Role emotional up to 12 months follow‐up | 2 | 314 | Mean Difference (IV, Fixed, 95% CI) | 9.37 [‐0.31, 19.05] |
| 2.8 Mental health up to 12 months follow‐up | 2 | 314 | Mean Difference (IV, Fixed, 95% CI) | ‐1.72 [‐5.31, 1.87] |
| 3 Intensive advocacy: 2 summary component subscales Show forest plot | 1 | Mean Difference (IV, Fixed, 95% CI) | Totals not selected | |
| 3.1 Physical component up to 12 months follow‐up | 1 | Mean Difference (IV, Fixed, 95% CI) | 0.0 [0.0, 0.0] | |
| 3.2 Mental component up to 12 months follow‐up | 1 | Mean Difference (IV, Fixed, 95% CI) | 0.0 [0.0, 0.0] | |
| 4 Intensive advocacy: overall Show forest plot | 2 | Mean Difference (IV, Fixed, 95% CI) | Subtotals only | |
| 4.1 Up to 12 months follow‐up | 2 | 343 | Mean Difference (IV, Fixed, 95% CI) | 0.23 [0.00, 0.46] |
| 4.2 12 to 24 months follow‐up | 1 | 265 | Mean Difference (IV, Fixed, 95% CI) | 0.25 [‐0.02, 0.52] |
| 4.3 24 + months follow‐up | 1 | 124 | Mean Difference (IV, Fixed, 95% CI) | 0.30 [‐0.07, 0.67] |
| 5 Any advocacy: 2 summary component subscales Show forest plot | 2 | Std. Mean Difference (IV, Fixed, 95% CI) | Subtotals only | |
| 5.1 Physical component up to 12 months follow‐up | 2 | 303 | Std. Mean Difference (IV, Fixed, 95% CI) | 0.21 [‐0.02, 0.44] |
| 5.2 Mental component up to 12 months | 2 | 303 | Std. Mean Difference (IV, Fixed, 95% CI) | 0.08 [‐0.15, 0.31] |
| Outcome or subgroup title | No. of studies | No. of participants | Statistical method | Effect size |
| 1 Brief advocacy (up to 12 months follow‐up) Show forest plot | 2 | 239 | Std. Mean Difference (IV, Fixed, 95% CI) | ‐0.17 [‐0.43, 0.08] |
| 2 Brief advocacy (dichotomous outcome) (up to 12 months follow‐up) Show forest plot | 2 | 149 | Odds Ratio (M‐H, Fixed, 95% CI) | 0.31 [0.15, 0.65] |
| 3 Intensive advocacy Show forest plot | 3 | Std. Mean Difference (IV, Fixed, 95% CI) | Subtotals only | |
| 3.1 Up to 12 months follow‐up | 3 | 446 | Std. Mean Difference (IV, Fixed, 95% CI) | ‐0.14 [‐0.33, 0.05] |
| 3.2 12 to 24 months follow‐up | 1 | 265 | Std. Mean Difference (IV, Fixed, 95% CI) | ‐0.12 [‐0.36, 0.12] |
| 4 Intensive advocacy (dichotomous outcome) (up to 12 months follow‐up) Show forest plot | 1 | Odds Ratio (M‐H, Fixed, 95% CI) | Totals not selected | |
| 5 Any advocacy (up to 12 months follow‐up) Show forest plot | 5 | 685 | Std. Mean Difference (IV, Fixed, 95% CI) | ‐0.15 [‐0.30, 0.00] |
| 6 Any advocacy (dichotomous outcome) (up to 12 months follow‐up) Show forest plot | 3 | 252 | Odds Ratio (M‐H, Fixed, 95% CI) | 0.37 [0.21, 0.66] |
| Outcome or subgroup title | No. of studies | No. of participants | Statistical method | Effect size |
| 1 Brief advocacy (up to 12 months follow‐up) Show forest plot | 1 | Mean Difference (IV, Fixed, 95% CI) | Totals not selected | |
| 2 Intensive advocacy Show forest plot | 1 | Mean Difference (IV, Fixed, 95% CI) | Subtotals only | |
| 2.1 Up to 12 months follow‐up | 1 | 265 | Mean Difference (IV, Fixed, 95% CI) | ‐0.13 [‐0.35, 0.09] |
| 2.2 12 to 24 months follow‐up | 1 | 265 | Mean Difference (IV, Fixed, 95% CI) | ‐0.01 [‐0.22, 0.20] |
| 2.3 24 + months follow‐up | 1 | 124 | Mean Difference (IV, Fixed, 95% CI) | ‐0.11 [‐0.40, 0.18] |
| 3 Intensive advocacy (mean change) (up to 12 months follow‐up) Show forest plot | 1 | Mean Difference (IV, Fixed, 95% CI) | Totals not selected | |
| 4 Any advocacy (up to 12 months follow‐up) Show forest plot | 2 | 318 | Std. Mean Difference (IV, Fixed, 95% CI) | ‐0.22 [‐0.44, 0.01] |
| Outcome or subgroup title | No. of studies | No. of participants | Statistical method | Effect size |
| 1 Brief advocacy (up to 12 months follow‐up) Show forest plot | 1 | Mean Difference (IV, Fixed, 95% CI) | Totals not selected | |
| Outcome or subgroup title | No. of studies | No. of participants | Statistical method | Effect size |
| 1 Brief advocacy (up to 12 months follow‐up) Show forest plot | 1 | Mean Difference (IV, Fixed, 95% CI) | Totals not selected | |
| Outcome or subgroup title | No. of studies | No. of participants | Statistical method | Effect size |
| 1 Brief advocacy (dichotomous outcome) Show forest plot | 1 | Odds Ratio (M‐H, Fixed, 95% CI) | Totals not selected | |
| 1.1 Low birth weight (< 2500 g) | 1 | Odds Ratio (M‐H, Fixed, 95% CI) | 0.0 [0.0, 0.0] | |
| 1.2 Very low birth weight (< 1500 g) | 1 | Odds Ratio (M‐H, Fixed, 95% CI) | 0.0 [0.0, 0.0] | |
| Outcome or subgroup title | No. of studies | No. of participants | Statistical method | Effect size |
| 1 Brief advocacy Show forest plot | 1 | Mean Difference (IV, Fixed, 95% CI) | Totals not selected | |
| Outcome or subgroup title | No. of studies | No. of participants | Statistical method | Effect size |
| 1 Brief advocacy (dichotomous outcome) Show forest plot | 1 | Odds Ratio (M‐H, Fixed, 95% CI) | Totals not selected | |
| 1.1 Pre‐term birth (37 weeks gestation) | 1 | Odds Ratio (M‐H, Fixed, 95% CI) | 0.0 [0.0, 0.0] | |
| 1.2 Very pre‐term birth (< 33 weeks gestation) | 1 | Odds Ratio (M‐H, Fixed, 95% CI) | 0.0 [0.0, 0.0] | |
| Outcome or subgroup title | No. of studies | No. of participants | Statistical method | Effect size |
| 1 Brief advocacy Show forest plot | 1 | Mean Difference (IV, Fixed, 95% CI) | Totals not selected | |
| Outcome or subgroup title | No. of studies | No. of participants | Statistical method | Effect size |
| 1 Brief advocacy (up to 12 months follow‐up) Show forest plot | 2 | 92 | Std. Mean Difference (IV, Fixed, 95% CI) | ‐0.21 [‐0.62, 0.21] |
| Outcome or subgroup title | No. of studies | No. of participants | Statistical method | Effect size |
| 1 Brief advocacy (up to 12 months follow‐up) Show forest plot | 1 | Mean Difference (IV, Fixed, 95% CI) | Totals not selected | |
| Outcome or subgroup title | No. of studies | No. of participants | Statistical method | Effect size |
| 1 Intensive advocacy Show forest plot | 1 | Mean Difference (IV, Fixed, 95% CI) | Totals not selected | |
| 1.1 Up to 12 months follow‐up | 1 | Mean Difference (IV, Fixed, 95% CI) | 0.0 [0.0, 0.0] | |
| 1.2 12 to 24 months follow‐up | 1 | Mean Difference (IV, Fixed, 95% CI) | 0.0 [0.0, 0.0] | |
| 1.3 24 + months follow‐up | 1 | Mean Difference (IV, Fixed, 95% CI) | 0.0 [0.0, 0.0] | |
| Outcome or subgroup title | No. of studies | No. of participants | Statistical method | Effect size |
| 1 Intensive advocacy (up to 12 months follow‐up) Show forest plot | 1 | Mean Difference (IV, Fixed, 95% CI) | Totals not selected | |
| Outcome or subgroup title | No. of studies | No. of participants | Statistical method | Effect size |
| 1 Brief advocacy (up to 12 months follow‐up) Show forest plot | 1 | Mean Difference (IV, Fixed, 95% CI) | Totals not selected | |
| 2 Intensive advocacy Show forest plot | 3 | Std. Mean Difference (IV, Fixed, 95% CI) | Subtotals only | |
| 2.1 Up to 12 months follow‐up | 3 | 446 | Std. Mean Difference (IV, Fixed, 95% CI) | 0.00 [‐0.19, 0.19] |
| 2.2 12 to 24 months follow‐up | 1 | 265 | Std. Mean Difference (IV, Fixed, 95% CI) | 0.12 [‐0.12, 0.37] |
| 2.3 24 + months follow‐up | 1 | 124 | Std. Mean Difference (IV, Fixed, 95% CI) | 0.39 [0.03, 0.74] |
| 3 Intensive advocacy (mean change) Show forest plot | 1 | Mean Difference (IV, Fixed, 95% CI) | Subtotals only | |
| 3.1 Overall support up to 12 months follow‐up | 1 | 24 | Mean Difference (IV, Fixed, 95% CI) | 10.19 [5.67, 14.71] |
| 3.2 Tangible support up to 12 months follow‐up | 1 | 24 | Mean Difference (IV, Fixed, 95% CI) | 2.19 [0.93, 3.45] |
| 3.3 Appraisal support up to 12 months follow‐up | 1 | 24 | Mean Difference (IV, Fixed, 95% CI) | 0.67 [0.14, 1.20] |
| 3.4 Self esteem support up to 12 months follow‐up | 1 | 24 | Mean Difference (IV, Fixed, 95% CI) | 1.14 [0.43, 1.85] |
| 3.5 Belonging support up to 12 months follow‐up | 1 | 24 | Mean Difference (IV, Fixed, 95% CI) | 4.18 [1.18, 7.18] |
| 4 Any advocacy (up to 12 months follow‐up) Show forest plot | 4 | 646 | Std. Mean Difference (IV, Fixed, 95% CI) | 0.07 [‐0.08, 0.23] |
| Outcome or subgroup title | No. of studies | No. of participants | Statistical method | Effect size |
| 1 Intensive advocacy (dichotomous outcome) Show forest plot | 2 | Odds Ratio (M‐H, Fixed, 95% CI) | Subtotals only | |
| 1.1 Up to 12 months follow‐up | 2 | 301 | Odds Ratio (M‐H, Fixed, 95% CI) | 1.22 [0.74, 2.00] |
| 1.2 12 to 24 months follow‐up | 1 | 261 | Odds Ratio (M‐H, Fixed, 95% CI) | 1.27 [0.78, 2.08] |
| 1.3 24 + months follow‐up | 1 | 119 | Odds Ratio (M‐H, Fixed, 95% CI) | 0.97 [0.47, 1.98] |
| 2 Intensive advocacy: missing reassigned (up to 12 months follow‐up) (dichotomous outcome) Show forest plot | 2 | Odds Ratio (M‐H, Fixed, 95% CI) | Subtotals only | |
| 2.1 Missing intervention group independent, control group not independent | 2 | 330 | Odds Ratio (M‐H, Fixed, 95% CI) | 1.58 [0.98, 2.55] |
| 2.2 Missing intervention group and control group all independent | 2 | 330 | Odds Ratio (M‐H, Fixed, 95% CI) | 1.13 [0.71, 1.80] |
| 2.3 Missing intervention group not independent, control group independent | 2 | 330 | Odds Ratio (M‐H, Fixed, 95% CI) | 0.82 [0.52, 1.31] |
| 2.4 Missing intervention group and control group all not independent | 2 | 330 | Odds Ratio (M‐H, Fixed, 95% CI) | 1.13 [0.70, 1.82] |
| Outcome or subgroup title | No. of studies | No. of participants | Statistical method | Effect size |
| 1 Intensive advocacy Show forest plot | 1 | Mean Difference (IV, Fixed, 95% CI) | Subtotals only | |
| 1.1 Up to 12 months follow‐up | 1 | 265 | Mean Difference (IV, Fixed, 95% CI) | ‐0.02 [‐0.08, 0.04] |
| 1.2 12 to 24 months follow‐up | 1 | 265 | Mean Difference (IV, Fixed, 95% CI) | 0.0 [‐0.05, 0.05] |
| 1.3 24 + months follow‐up | 1 | 124 | Mean Difference (IV, Fixed, 95% CI) | ‐0.07 [‐0.14, ‐0.00] |
| Outcome or subgroup title | No. of studies | No. of participants | Statistical method | Effect size |
| 1 Brief advocacy Show forest plot | 3 | Mean Difference (IV, Fixed, 95% CI) | Subtotals only | |
| 1.1 Up to 12 months follow‐up | 3 | 558 | Mean Difference (IV, Fixed, 95% CI) | 1.39 [0.92, 1.87] |
| 1.2 12 to 24 months follow‐up | 1 | 319 | Mean Difference (IV, Fixed, 95% CI) | 0.10 [‐0.42, 0.62] |
| Outcome or subgroup title | No. of studies | No. of participants | Statistical method | Effect size |
| 1 Brief advocacy Show forest plot | 2 | Std. Mean Difference (IV, Fixed, 95% CI) | Subtotals only | |
| 1.1 Up to 12 months follow‐up | 2 | 358 | Std. Mean Difference (IV, Fixed, 95% CI) | 0.19 [‐0.02, 0.39] |
| 1.2 12 to 24 months follow‐up | 1 | 319 | Std. Mean Difference (IV, Fixed, 95% CI) | 0.15 [‐0.07, 0.37] |
| Outcome or subgroup title | No. of studies | No. of participants | Statistical method | Effect size |
| 1 Intensive advocacy Show forest plot | 1 | Mean Difference (IV, Fixed, 95% CI) | Totals not selected | |