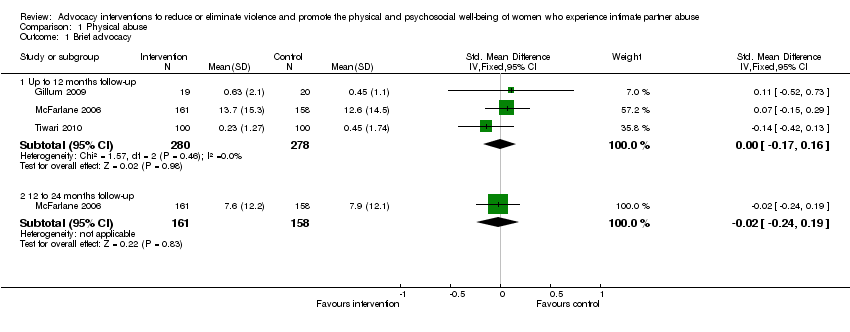
| 1 Brief advocacy Show forest plot | 3 | | Std. Mean Difference (IV, Fixed, 95% CI) | Subtotals only |
|
| 1.1 Up to 12 months follow‐up | 3 | 558 | Std. Mean Difference (IV, Fixed, 95% CI) | ‐0.00 [‐0.17, 0.16] |
| 1.2 12 to 24 months follow‐up | 1 | 319 | Std. Mean Difference (IV, Fixed, 95% CI) | ‐0.02 [‐0.24, 0.19] |
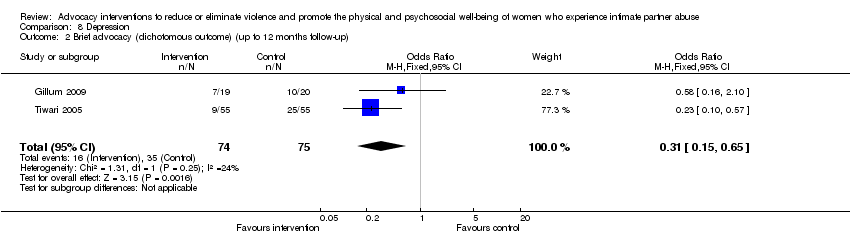
| 2 Brief advocacy (dichotomous outcome) (up to 12 months follow‐up) Show forest plot | 1 | | Odds Ratio (M‐H, Fixed, 95% CI) | Totals not selected |
|
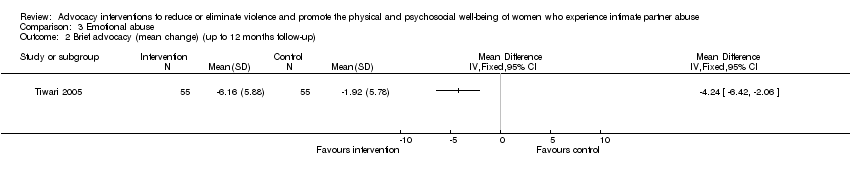
| 3 Brief advocacy (mean change) Show forest plot | 1 | | Mean Difference (IV, Fixed, 95% CI) | Subtotals only |
|
| 3.1 'Severe' up to 12 months follow‐up | 1 | 110 | Mean Difference (IV, Fixed, 95% CI) | 0.08 [‐0.26, 0.42] |
| 3.2 'Minor' up to 12 months follow‐up | 1 | 110 | Mean Difference (IV, Fixed, 95% CI) | ‐1.0 [‐1.82, ‐0.18] |
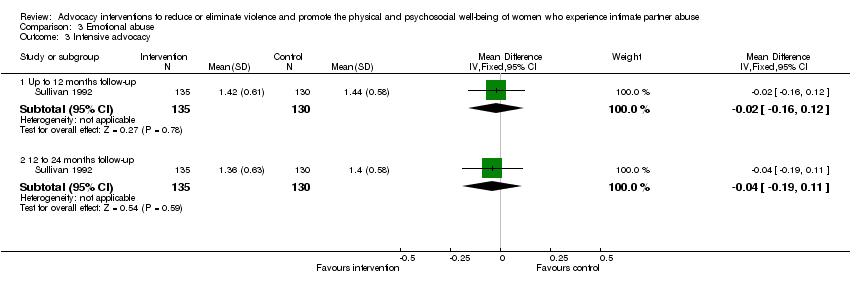
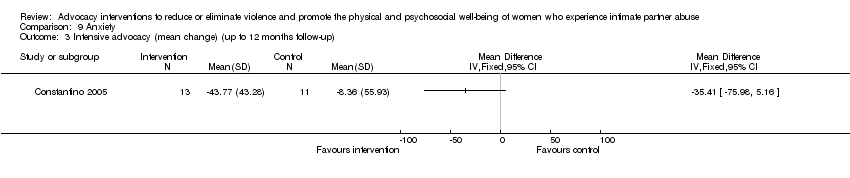
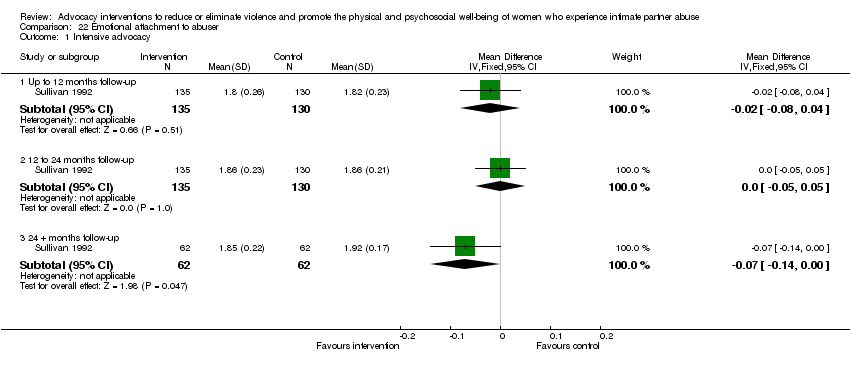
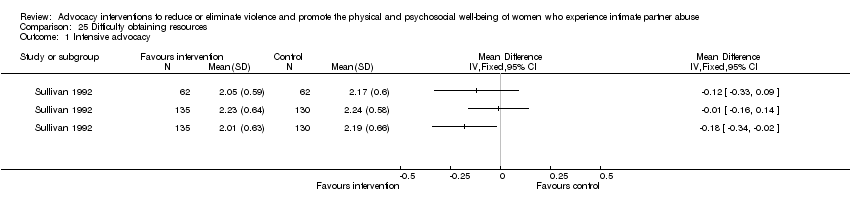
| 4 Intensive advocacy Show forest plot | 1 | | Mean Difference (IV, Fixed, 95% CI) | Subtotals only |
|
| 4.1 Up to 12 months follow‐up | 1 | 265 | Mean Difference (IV, Fixed, 95% CI) | ‐0.12 [‐0.39, 0.15] |
| 4.2 12 to 24 months follow‐up | 1 | 265 | Mean Difference (IV, Fixed, 95% CI) | ‐0.25 [‐0.50, ‐0.00] |
| 4.3 24 + months follow‐up | 1 | 124 | Mean Difference (IV, Fixed, 95% CI) | 0.18 [‐0.20, 0.56] |
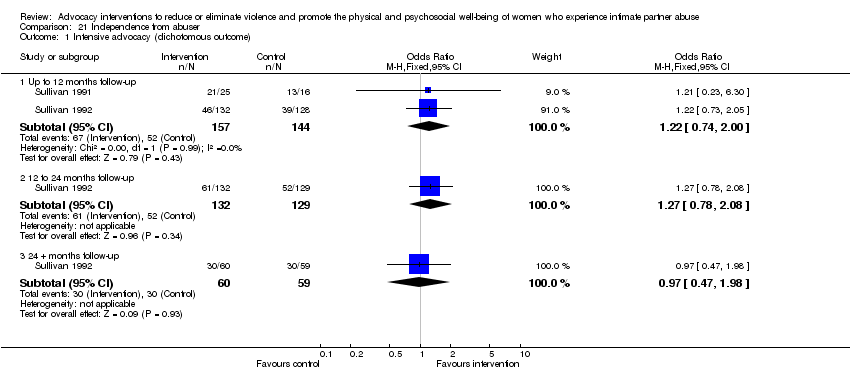
| 5 Intensive advocacy (dichotomous outcome) Show forest plot | 2 | | Odds Ratio (M‐H, Fixed, 95% CI) | Subtotals only |
|
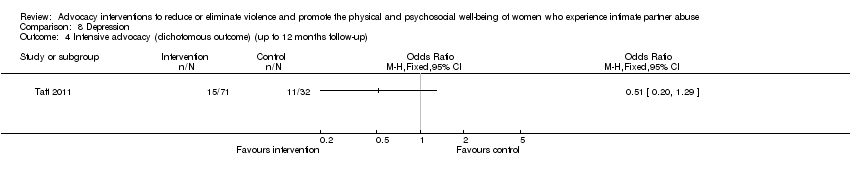
| 5.1 Up to 12 months follow‐up | 2 | 182 | Odds Ratio (M‐H, Fixed, 95% CI) | 0.61 [0.33, 1.14] |
| 5.2 12 to 24 months follow‐up | 1 | 265 | Odds Ratio (M‐H, Fixed, 95% CI) | 0.39 [0.20, 0.77] |
| 5.3 24 + months follow‐up | 1 | 124 | Odds Ratio (M‐H, Fixed, 95% CI) | 1.07 [0.52, 2.23] |
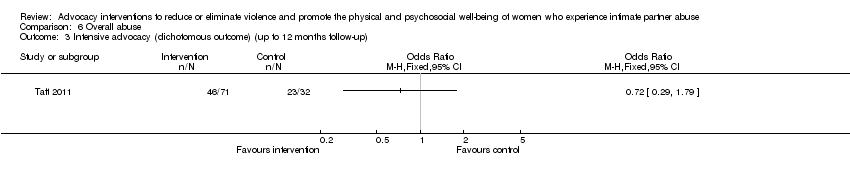
| 6 Intensive advocacy: missing reassigned (dichotomous outcome) (up to 12 months follow‐up) Show forest plot | 2 | | Odds Ratio (M‐H, Fixed, 95% CI) | Subtotals only |
|
| 6.1 Missing intervention group not abused, control group abused | 2 | 192 | Odds Ratio (M‐H, Fixed, 95% CI) | 0.54 [0.29, 1.01] |
| 6.2 Missing intervention group and control group all not abused | 2 | 192 | Odds Ratio (M‐H, Fixed, 95% CI) | 0.54 [0.29, 1.01] |
| 6.3 Missing intervention group abused, control group not abused | 2 | 192 | Odds Ratio (M‐H, Fixed, 95% CI) | 0.83 [0.46, 1.49] |
| 6.4 Missing intervention group and control group all abused | 2 | 192 | Odds Ratio (M‐H, Fixed, 95% CI) | 0.83 [0.46, 1.49] |
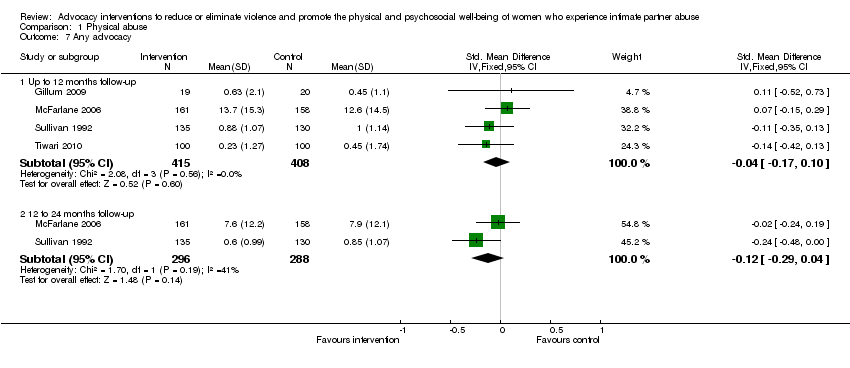
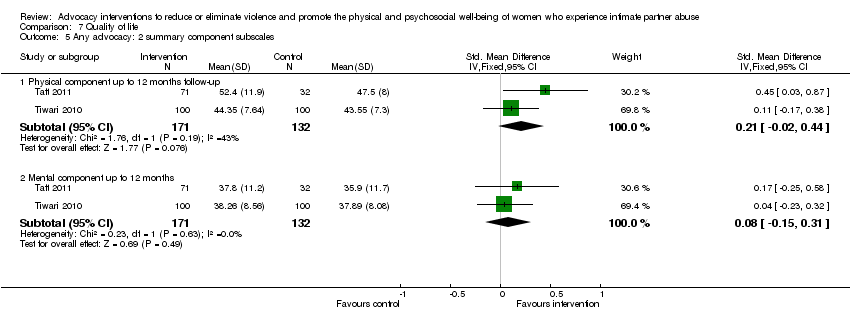
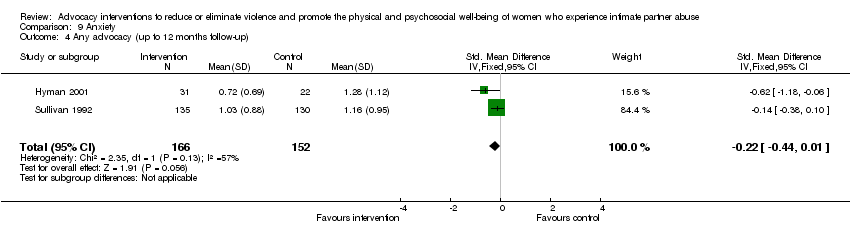
| 7 Any advocacy Show forest plot | 4 | | Std. Mean Difference (IV, Fixed, 95% CI) | Subtotals only |
|
| 7.1 Up to 12 months follow‐up | 4 | 823 | Std. Mean Difference (IV, Fixed, 95% CI) | ‐0.04 [‐0.17, 0.10] |
| 7.2 12 to 24 months follow‐up | 2 | 584 | Std. Mean Difference (IV, Fixed, 95% CI) | ‐0.12 [‐0.29, 0.04] |
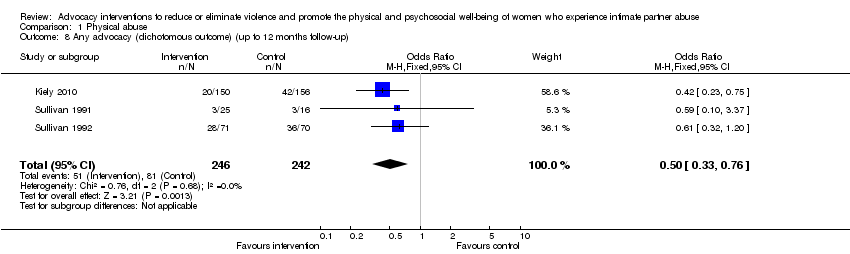
| 8 Any advocacy (dichotomous outcome) (up to 12 months follow‐up) Show forest plot | 3 | 488 | Odds Ratio (M‐H, Fixed, 95% CI) | 0.50 [0.33, 0.76] |
|