Intervenciones de apoyo para reducir o eliminar la violencia y promover el bienestar físico y psicosocial de las mujeres que sufren abusos por parte de su pareja
Information
- DOI:
- https://doi.org/10.1002/14651858.CD005043.pub3Copy DOI

- Database:
-
- Cochrane Database of Systematic Reviews
- Version published:
-
- 03 December 2015see what's new
- Type:
-
- Intervention
- Stage:
-
- Review
- Cochrane Editorial Group:
-
Cochrane Developmental, Psychosocial and Learning Problems Group
- Copyright:
-
- Copyright © 2015 The Cochrane Collaboration. Published by John Wiley & Sons, Ltd.
Article metrics
Altmetric:
Cited by:
Authors
Contributions of authors
For the original review, Jean Ramsay wrote the protocol, searched databases, selected papers, extracted data from papers, entered and analysed data, wrote the first draft of the review, and edited the text. Gene Feder edited the protocol, selected papers, extracted data from papers, analysed data and edited the text of the review. Carol Rivas and Danielle Dunne searched databases, selected papers, extracted data from papers, considered the results, and edited the text of the review. Sandra Eldridge provided statistical guidance and edited the text of the review. Yvonne Carter, Leslie Davidson, Kelsey Hegarty, Angela Taft, and Alison Warburton edited the protocol, considered the results, and edited the text of the review.
For the updated review, Carol Rivas selected papers, extracted data from papers, entered and analysed data, produced the first draft of the 'Summary of findings' table and associated text, and edited the text of the review. Jean Ramsay reviewed the protocol, searched databases, selected papers, extracted data from papers, entered and analysed data, wrote the first draft of the review, and edited the text. Laura Sadowski selected papers, extracted data from papers, analysed data, and edited the text of the review. Sandra Eldridge advised on inclusion queries, provided statistical guidance and edited the text of the review. Gene Feder reviewed the protocol, adjudicated on inclusion disagreements, and edited the text of the review. Leslie Davidson, Danielle Dunne, Kelsey Hegarty, and Angela Taft advised on inclusion queries, considered the results, and edited the text of the review. Angela and Kelsey were not involved with inclusion queries or results of the Taft 2011 and 2009 studies that they were involved in. Leslie Davidson contacted included authors to check our list of studies.
Sources of support
Internal sources
-
No sources of support supplied
External sources
-
Socialforsksnings Institut (SFI) Nordic Campbell Centre, Denmark.
(Original review only, not the 2013 update) ‐ funding support to enable co‐registration of the review within the Campbell Collaboration (DOI:10.4073/csr.2009.5)
-
National Institute of Health Research, UK.
Carol Rivas's contribution was partly funded by the NIHR applied research programme funding stream. The views and opinions do not not necessarily reflect those of the NIHR, NHS or the Department of Health (England).
-
Queen Mary University of London, UK.
Danielle Dunne worked on the update of this review whilst employed full‐time at Queen Mary University of London
Declarations of interest
Carol Rivas was partly funded by the National Institute for Health Research (NIHR) applied research programme funding stream. The views and opinions do not not necessarily reflect those of the NIHR, NHS, or the Department of Health (England).
Gene Feder and Jean Ramsay's institution received payment from Socialforsksnings Institut (SFI) Nordic Campbell Centre Denmark, for submitting an edited version of the 2009 review to the Campbell Collaboration.
Laura Sadowski has received funds for her participation in reviewing the evidence of interventions to reduce intimate partner violence for the British Medical Journal (BMJ) and the World Health Organization (WHO).
Leslie Davidson ‐ none known.
Danielle Dunne ‐ none known.
Kelsey Hegarty's institution received funds from the National Health and Medical Research Council (NHMRC) for her work on Hegarty 2013. Kelsey received funds from a General Practice in Victoria for a training programme on intimate partner violence for general practitioners. Kelsey has also received funds for expenses from WHO, for her work in a guideline group on intimate partner violence.
Angela Taft and Kelsey Hegarty declare they are authors on Taft 2011 and had no part in the assessment of eligibility, assessment of risk of bias or data extraction of this study. Angela received funds from National Health and Medical Research Council to conduct the MOSAIC trial and funds from the Australian Research Council and VicHealth to conduct the MOVE trial (bit.ly/1fpQPFw).
Gene Feder, Sandra Eldridge and Jean Ramsay are authors of the Feder 2011 trial, which was not eligible for inclusion in this review. Cathy Bennett and Carol Rivas assessed the eligibility of studies for inclusion. Gene was not required to resolve any disagreements with regards to this trial. Gene is part of the steering group for Identification and Referral to Improve Safety (IRIS), a programme that can be commissioned in the United Kingdom to train general practices and provide a referral pathway to advocacy for women experiencing domestic violence. His employer, the University of Bristol, receives an annual consultancy fee for his involvement with IRIS. The study was not included in this review update. Gene is a Principal Investigator on domestic violence research studies, funded by grants to his University from the National Institute of Health Research, the UK Department of Health Policy Research Programme and the National School for Primary Care Research. Gene and his organisation receives funds for his consultancy work with the National Institute for Health and Care Excellence (NICE) and for chairing the Domestic Violence Programme Development Group there. He has received royalties for an academic book on domestic violence and health. Gene's university has received fees from the Health Foundation for domestic violence educational programmes that he has developed.
Acknowledgements
The original review was peer‐reviewed by three Editors of the Cochrane Developmental, Psychosocial and Learning Problems Group (including the Statistics Editor) and four external peer reviewers, one of whom had consumer expertise. We are grateful to the Review Group Editors and staff, particularly to our Co‐ordinating Editor (Professor Geraldine Macdonald), Managing Editor (Jane Dennis), and Trials Search Coordinator (Jo Abbott) for their input. We thank the included study authors who responded to our queries (Deborah Bybee, Kelly Hyman; Renee McDonald, Judith McFarlane), supplied additional data (Deborah Bybee, Rose Constantino, Kelly Hyman, Agnes Tiwari), and checked our list of included studies for omissions (Deborah Bybee, Rose Constantino, Kelly Hyman, Renee McDonald, Judith McFarlane, Agnes Tiwari). We thank Jeanne Trifone who responded to our query about whether one of her studies fulfilled our inclusion criteria. We would also like to thank members of Domus Medica, the Medical Research Council (MRC) Gender and Health Unit, and other experts and colleagues for checking our list of included studies for omissions. In particular, our thanks go to Carmen Fernandez Alonso, Rachel Jewkes, Sylvie Lo Fo Wong, Davorina Petek, Susana Sanchez, Lynne Stevens, and Steffi Winter. Finally, we wish to acknowledge the contribution made to the original review by two of its past co‐authors: Yvonne Carter (now sadly deceased) and Alison Warburton.
The updated review was peer‐reviewed by three Editors of the Cochrane Developmental, Psychosocial and Learning Problems Group (including the Statistics Editor) and two external peer reviewers, one of whom had consumer expertise. We are grateful to the Review Group Editors and staff, particularly to our Co‐ordinating Editor (Geraldine Macdonald), Managing Editor (Joanne Wilson), Former Managing Editor (Laura MacDonald), Assistant Managing Editor (Gemma O'Loughlin), and Trials Search Co‐ordinator (Margaret Anderson). We would like to thank all the authors who responded to our queries (Swee May Cripe, Michele Kiely, Angela Taft, and Nancy Woods), those who supplied additional data (Michele Kiely, Angela Taft, and Nancy Woods), and those who checked our list of included studies for omissions (Dawn Bybee, Swee May Cripe, Michele Kiely, Chris Sullivan, Angela Taft, Agnes Tiwari). We would also like to thank authors who responded to queries about whether their studies fulfilled our inclusion criteria or who provided us with additional information (Megan Bair‐Merritt, Ann Coker, Marilyn Ford‐Gilboe, Karin Grip, Kelsey Hegarty, Renee McDonald, Elizabeth Miller, Andrew Parcy, Agnes Tiwari). Lastly, we thank members of an informal network of European primary care domestic violence researchers and other experts and colleagues for checking our list of included studies for omissions. In particular, our thanks go to: Loraine Bacchus, Claudia Garcia Moreno Esteva, and Charlotte Watts.
Version history
| Published | Title | Stage | Authors | Version |
| 2015 Dec 03 | Advocacy interventions to reduce or eliminate violence and promote the physical and psychosocial well‐being of women who experience intimate partner abuse | Review | Carol Rivas, Jean Ramsay, Laura Sadowski, Leslie L Davidson, Danielle Dunne, Sandra Eldridge, Kelsey Hegarty, Angela Taft, Gene Feder | |
| 2009 Jul 08 | Advocacy interventions to reduce or eliminate violence and promote the physical and psychosocial well‐being of women who experience intimate partner abuse | Review | Jean Ramsay, Yvonne Carter, Leslie Davidson, Danielle Dunne, Sandra Eldridge, Kelsey Hegarty, Carol Rivas, Angela Taft, Alison Warburton, Gene Feder | |
| 2005 Jan 24 | Advocacy interventions to reduce or eliminate violence and promote the physical and psychosocial well‐being of women who experience intimate partner abuse | Protocol | Jean Ramsay, Gene Feder, Carol Rivas, Yvonne Carter, Leslie Davidson, Kelsey Hegarty, Angela Taft, Alison Warburton | |
Differences between protocol and review
2009 review
In our protocol we stated that we would search the criminal justice electronic databases but ultimately this was not possible. The process of searching these databases proved unhelpful due to the use of terms with vastly different meanings in the justice disciplines (such as trial or control).
A further difference relates to some of the outcome measures that we analysed. In the review, we included four outcomes that were not mentioned in the protocol but which we subsequently decided were of interest: risk of homicide, work harassment, independence from abuser, and emotional attachment to the abuser. Additionally, we had not anticipated that the use of resources by participants would be measured using a composite scale, rather than individual measures of the various resources available.
2015 update to review
In our protocol, we stated that we would include studies where advocacy was evaluated as an adjunct to another intervention, but on the proviso that advocacy was the only difference between the two trial arms. In the updated review, however, we have also included trials where women in the intervention arm may have received advocacy plus some other form of intervention compared with no care or usual care. The review team judged that this change was necessary given the increasing number of trials evaluating advocacy within the context of multi‐component interventions. Similar considerations would be given to studies with multiple eligible arms or multiple control conditions in a single trial, so long as the inclusion criteria are met and results for advocacy are available separately.
A further change from the original 2009 review relates to our definition of 'usual care'. Originally we specified that we would include all studies where advocacy was compared with no care or usual care. However, increasingly usual care can sometimes incorporate elements of advocacy. For the purposes of evaluating the effectiveness of advocacy interventions more rigorously, in the updated review we excluded any studies where usual care included a substantial element of advocacy and was received by more than 20% of women in the control arm. Again, the review team judged that this change was necessary given the increasing use of advocacy as a usual care treatment.
Moreover, this update includes trials in which the unit of analysis is not the woman. We have updated our methods section accordingly.
A further difference relates to some of the outcome measures that we analysed. We had not anticipated that the use of resources by participants would be measured using a composite scale, rather than individual measures of the various resources available, and we have included this aspect in both the 2009 and 2015 updates. In the 2009 review we included four outcomes that were not mentioned in the protocol but which we subsequently decided were of interest: risk of homicide, work harassment, independence from abuser, emotional attachment to the abuser. In the 2015 update we also added perceived stress to this list. Additionally, for the current 2015 update, we had not predicted that abuse might be assessed using a composite scale (overall abuse) rather than discrete measures of the different forms of intimate partner abuse, and so we included this outcome also.
In our protocol, assessment of risk of bias of included studies did not include the item ‘contamination’, which is now included.
We originally stated that a fixed‐effect model would only be used if there was no significant statistical heterogeneity. However the following analyses, performed with a fixed‐effect model, have moderate/high statistical heterogeneity: Analysis 3.1 (I² = 51%), Analysis 4.1 (I² = 58%), Analysis 7.2 (I² = 72%), Analysis 7.2.2 (I² = 56%), Analysis Analysis 7.2.3 (I² = 72%), Analysis 7.2.7 (I² = 81%), and Analysis 23.1 (I² = 97%). This heterogeneity is due to the confidence intervals crossing 0 or 1 (depending on the analysis), so using a random‐effects model would not change the conclusions.
Notes
This review is co‐registered within the Campbell Collaboration.
Keywords
MeSH
Medical Subject Headings (MeSH) Keywords
Medical Subject Headings Check Words
Female; Humans; Pregnancy;
PICOs

Risk of bias summary: review authors' judgements about each risk of bias item for each included study. Red circles with minus signs indicate high risk, green circles with plus signs indicate low risk, and yellow circles with question marks indicate unclear risk of bias.

Review flow diagram.
IPV: intimate partner violence; RCT: randomised controlled trial.

Risk of bias graph: review authors' judgements about each risk of bias item presented as percentages across all included studies.

Logic model summarising results for brief advocacy interventions.

Logic model summarising results for intense advocacy interventions.
PTSD: Post Traumatic Stress Disorder.
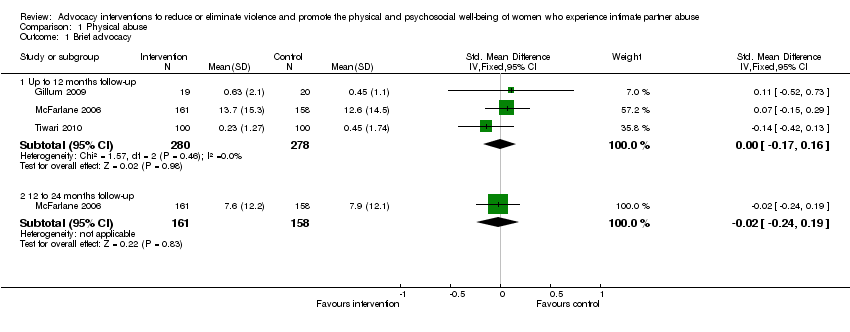
Comparison 1 Physical abuse, Outcome 1 Brief advocacy.

Comparison 1 Physical abuse, Outcome 2 Brief advocacy (dichotomous outcome) (up to 12 months follow‐up).

Comparison 1 Physical abuse, Outcome 3 Brief advocacy (mean change).

Comparison 1 Physical abuse, Outcome 4 Intensive advocacy.

Comparison 1 Physical abuse, Outcome 5 Intensive advocacy (dichotomous outcome).

Comparison 1 Physical abuse, Outcome 6 Intensive advocacy: missing reassigned (dichotomous outcome) (up to 12 months follow‐up).
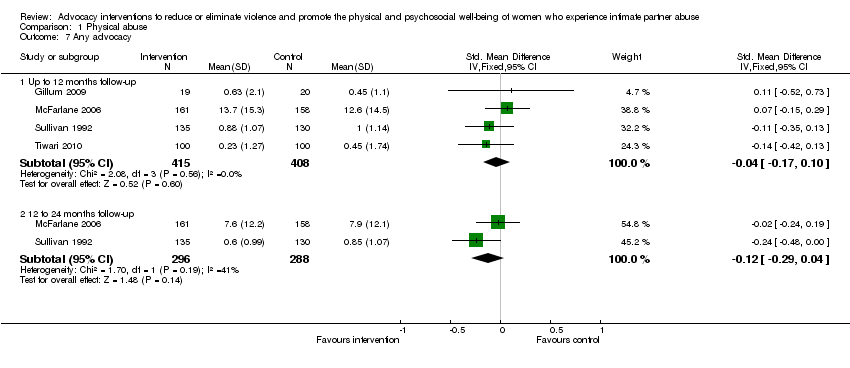
Comparison 1 Physical abuse, Outcome 7 Any advocacy.
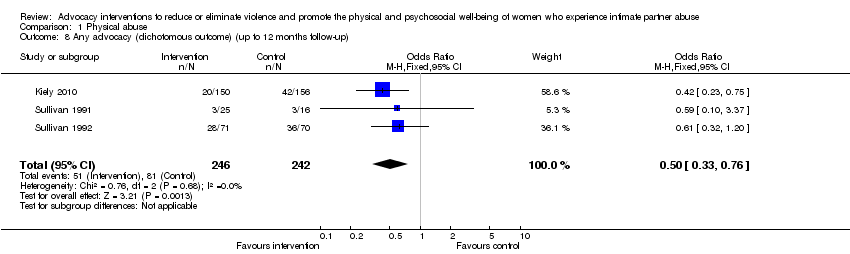
Comparison 1 Physical abuse, Outcome 8 Any advocacy (dichotomous outcome) (up to 12 months follow‐up).
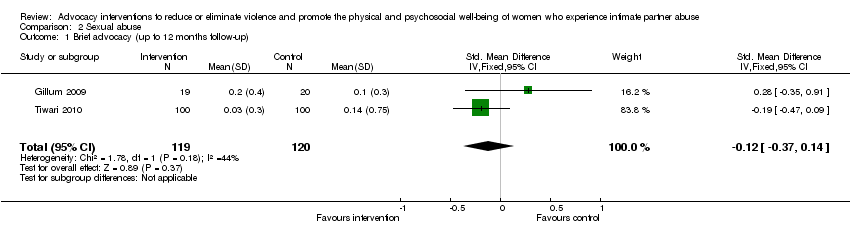
Comparison 2 Sexual abuse, Outcome 1 Brief advocacy (up to 12 months follow‐up).

Comparison 2 Sexual abuse, Outcome 2 Brief advocacy (mean change) (up to 12 months follow‐up).

Comparison 2 Sexual abuse, Outcome 3 Brief advocacy (dichotomous outcome) (up to 12 months follow‐up).

Comparison 3 Emotional abuse, Outcome 1 Brief advocacy.
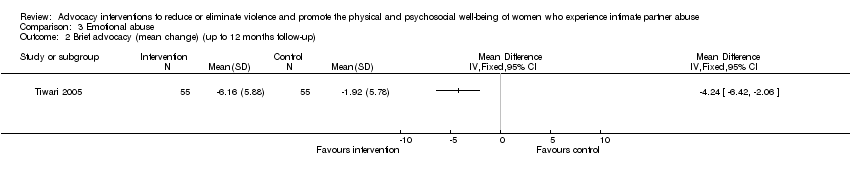
Comparison 3 Emotional abuse, Outcome 2 Brief advocacy (mean change) (up to 12 months follow‐up).
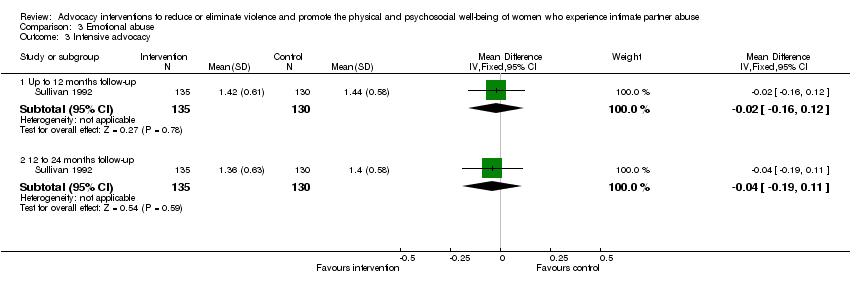
Comparison 3 Emotional abuse, Outcome 3 Intensive advocacy.

Comparison 3 Emotional abuse, Outcome 4 Intensive advocacy (dichotomous outcome) (up to 12 months follow‐up).

Comparison 3 Emotional abuse, Outcome 5 Any advocacy.

Comparison 4 Risk of homicide, Outcome 1 Brief advocacy.

Comparison 5 Risk of work harassment, Outcome 1 Brief advocacy.

Comparison 6 Overall abuse, Outcome 1 Brief advocacy (up to 12 months follow‐up).

Comparison 6 Overall abuse, Outcome 2 Intensive advocacy (up to 12 months follow‐up).
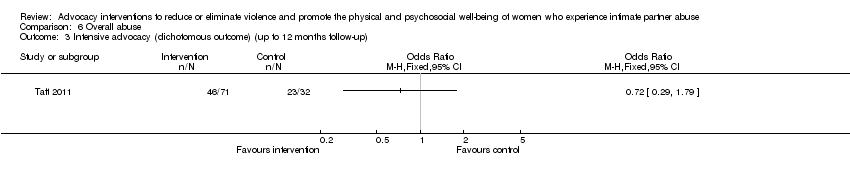
Comparison 6 Overall abuse, Outcome 3 Intensive advocacy (dichotomous outcome) (up to 12 months follow‐up).

Comparison 6 Overall abuse, Outcome 4 Any advocacy (up to 12 months follow‐up).

Comparison 7 Quality of life, Outcome 1 Brief advocacy: 2 summary component subscales.

Comparison 7 Quality of life, Outcome 2 Brief advocacy: 8 subscales (mean change).

Comparison 7 Quality of life, Outcome 3 Intensive advocacy: 2 summary component subscales.

Comparison 7 Quality of life, Outcome 4 Intensive advocacy: overall.
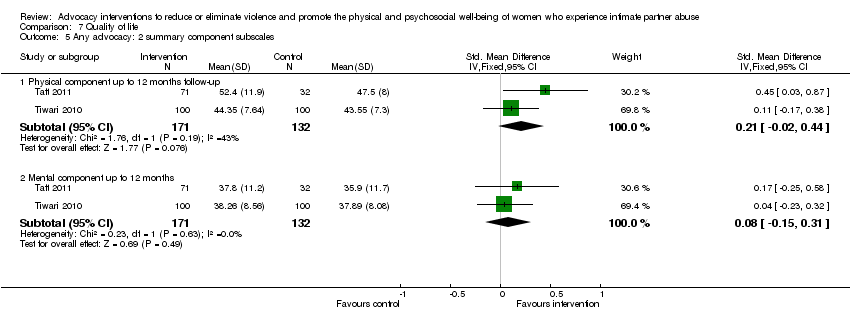
Comparison 7 Quality of life, Outcome 5 Any advocacy: 2 summary component subscales.

Comparison 8 Depression, Outcome 1 Brief advocacy (up to 12 months follow‐up).
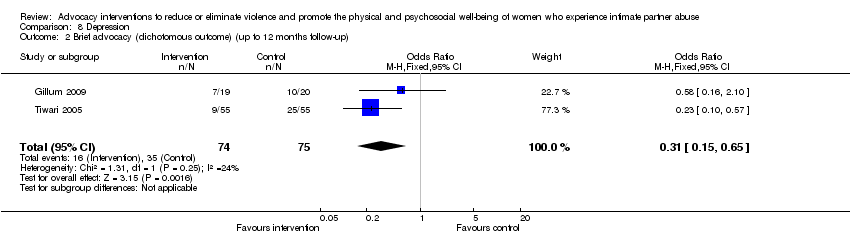
Comparison 8 Depression, Outcome 2 Brief advocacy (dichotomous outcome) (up to 12 months follow‐up).

Comparison 8 Depression, Outcome 3 Intensive advocacy.
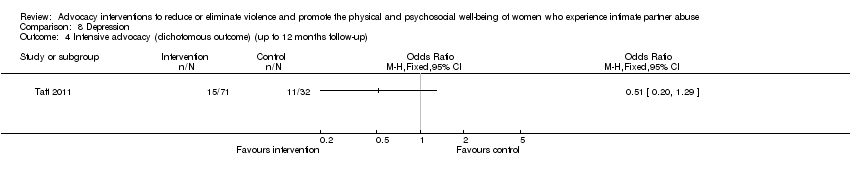
Comparison 8 Depression, Outcome 4 Intensive advocacy (dichotomous outcome) (up to 12 months follow‐up).

Comparison 8 Depression, Outcome 5 Any advocacy (up to 12 months follow‐up).

Comparison 8 Depression, Outcome 6 Any advocacy (dichotomous outcome) (up to 12 months follow‐up).

Comparison 9 Anxiety, Outcome 1 Brief advocacy (up to 12 months follow‐up).

Comparison 9 Anxiety, Outcome 2 Intensive advocacy.
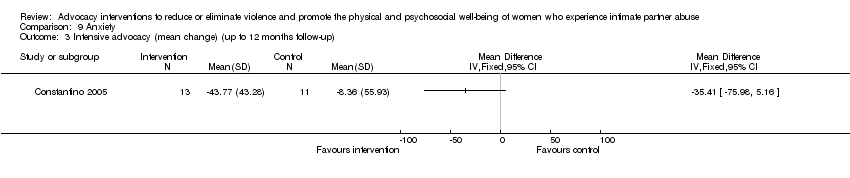
Comparison 9 Anxiety, Outcome 3 Intensive advocacy (mean change) (up to 12 months follow‐up).
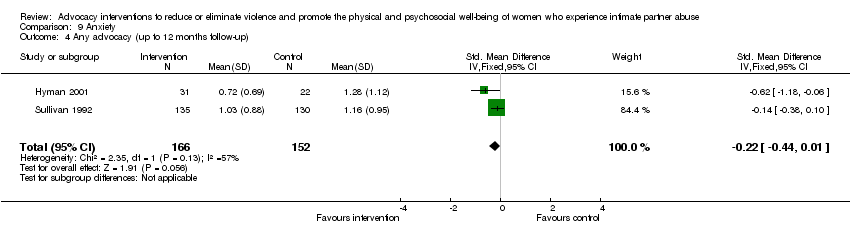
Comparison 9 Anxiety, Outcome 4 Any advocacy (up to 12 months follow‐up).

Comparison 10 Chronic pain, Outcome 1 Brief advocacy (up to 12 months follow‐up).
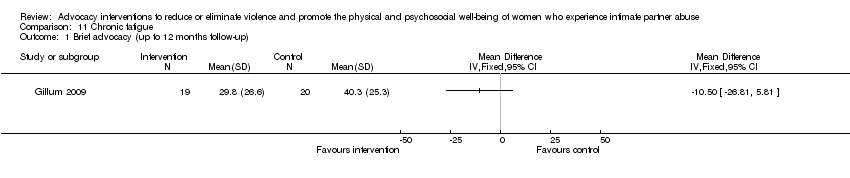
Comparison 11 Chronic fatigue, Outcome 1 Brief advocacy (up to 12 months follow‐up).

Comparison 12 Low birth weight, Outcome 1 Brief advocacy (dichotomous outcome).
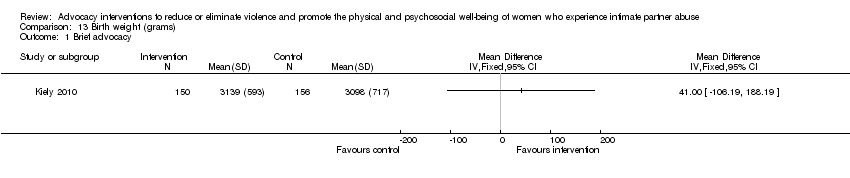
Comparison 13 Birth weight (grams), Outcome 1 Brief advocacy.
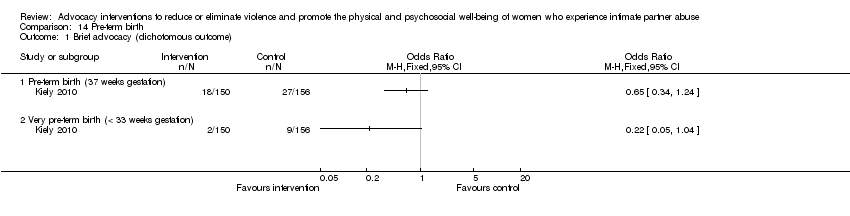
Comparison 14 Pre‐term birth, Outcome 1 Brief advocacy (dichotomous outcome).
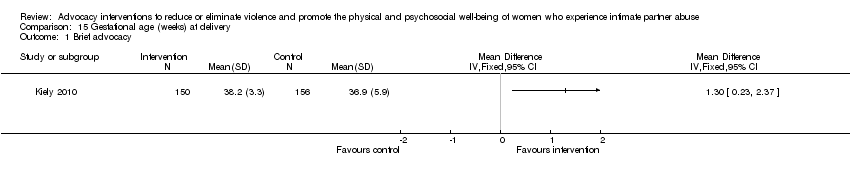
Comparison 15 Gestational age (weeks) at delivery, Outcome 1 Brief advocacy.

Comparison 16 Post‐traumatic stress, Outcome 1 Brief advocacy (up to 12 months follow‐up).

Comparison 17 Perception of stress, Outcome 1 Brief advocacy (up to 12 months follow‐up).

Comparison 18 Self efficacy, Outcome 1 Intensive advocacy.

Comparison 19 Self esteem, Outcome 1 Intensive advocacy (up to 12 months follow‐up).

Comparison 20 Perceived social support, Outcome 1 Brief advocacy (up to 12 months follow‐up).

Comparison 20 Perceived social support, Outcome 2 Intensive advocacy.

Comparison 20 Perceived social support, Outcome 3 Intensive advocacy (mean change).

Comparison 20 Perceived social support, Outcome 4 Any advocacy (up to 12 months follow‐up).
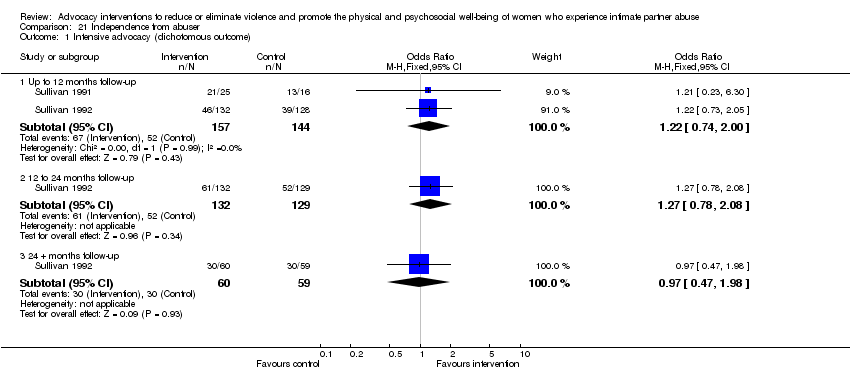
Comparison 21 Independence from abuser, Outcome 1 Intensive advocacy (dichotomous outcome).

Comparison 21 Independence from abuser, Outcome 2 Intensive advocacy: missing reassigned (up to 12 months follow‐up) (dichotomous outcome).
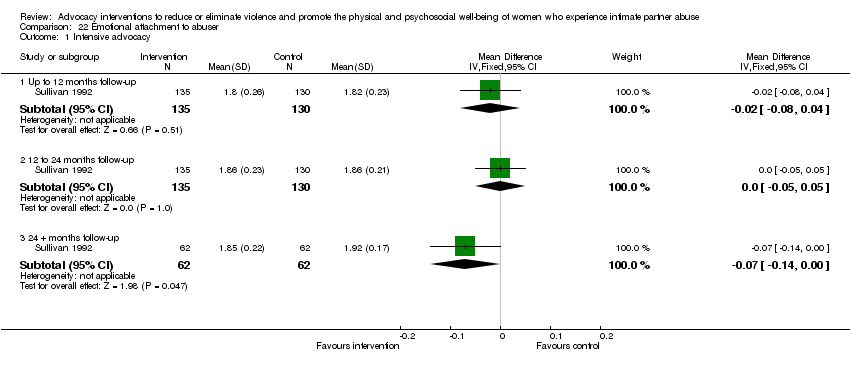
Comparison 22 Emotional attachment to abuser, Outcome 1 Intensive advocacy.

Comparison 23 Use of safety behaviours, Outcome 1 Brief advocacy.

Comparison 24 Use of resources, Outcome 1 Brief advocacy.
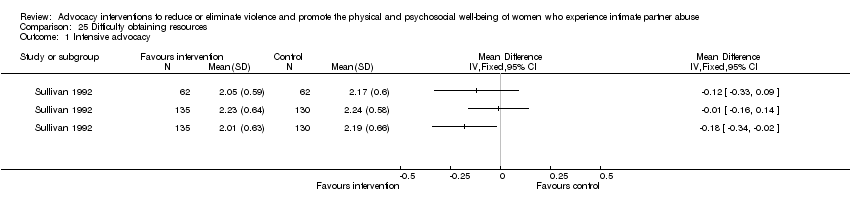
Comparison 25 Difficulty obtaining resources, Outcome 1 Intensive advocacy.
| Intensive advocacy interventions for women who experience intimate partner abuse versus usual care at up to 12‐month follow‐up | ||||||
| Patient or population: women with intimate partner abuse | ||||||
| Outcomes | Illustrative comparative risks* (95% CI) | Relative effect | No. of participants | Quality of the evidence | Comments | |
| Assumed risk | Corresponding risk | |||||
| Control | Intensive advocacy interventions | |||||
| Physical abuse | The mean physical abuse in the control groups was | The mean physical abuse in the intervention groups was 0.12 lower (0.39 lower to 0.15 higher) | — | 265 | ⊕⊕⊝⊝ | |
| Physical abuse (dichotomous outcome) | Study population | OR 0.61 | 182 | ⊕⊝⊝⊝ | ||
| 453 per 1000 | 336 per 1000 (215 to 486) | |||||
| Moderate effect | ||||||
| Emotional abuse (dichotomous outcome) | Study population | OR 0.58 | 141 | ⊕⊕⊕⊝ | ||
| 557 per 1000 | 422 per 1000 (274 to 587) | |||||
| Moderate effect | ||||||
| Emotional abuse | The mean emotional abuse in the control groups was 1.4 | The mean emotional abuse in the intervention groups was 0.02 lower (0.16 lower to 0.12 higher) | — | 265 | ⊕⊝⊝⊝ | |
| Overall abuse Other study used Composite Abuse Scale (CAS)i (30 items presented in a 6‐point format requiring respondents to answer 'never', 'only once', 'several times', 'monthly', 'weekly' or 'daily' in a 12‐month period) | The mean overall abuse ranged across control groups from 0.58 to 27.10 | The mean overall abuse in the intervention groups was 0.23 standard deviations lower (0.53 lower to 0.08 higher) | — | 181 | ⊕⊝⊝⊝ | |
| Overall abuse (dichotomous outcome) | Study population | OR 0.72 | 103 | ⊕⊝⊝⊝ | ||
| 719 per 1000 | 648 per 1000 (426 to 821) | |||||
| Moderate effect | ||||||
| *The basis for the assumed risk (e.g. the median control group risk across studies) is provided in footnotes. The corresponding risk (and its 95% CI) is based on the assumed risk in the comparison group and the relative effect of the intervention (and its 95% CI). | ||||||
| GRADE Working Group grades of evidence | ||||||
| aInsufficient information available concerning random sequence generation, blinding and protection against contamination, and attrition bias. | ||||||
| Brief advocacy interventions for women who experience intimate partner abuse versus usual care at up to 12‐month follow‐up | |||||
| Patient or population: women with intimate partner abuse | |||||
| Outcomes | Illustrative comparative risks* (95% CI) | No. of participants | Quality of the evidence | Comments | |
| Assumed risk | Corresponding risk | ||||
| Control | Brief advocacy interventions | ||||
| Physical abuse | The mean physical abuse ranged across control groups from 0.45 to 12.6 | The mean physical abuse in the intervention groups was 0 standard deviations higher | 558 | ⊕⊕⊕⊝ | |
| Physical abuse by severity ‐ severe | The mean physical abuse by severity ‐ severe in the control groups was 0.17 | The mean physical abuse by severity ‐ severe in the intervention groups was 0.08 higher | 110 | ⊕⊕⊕⊝ | |
| Sexual abuse | The mean sexual abuse ranged across control groups from 0.10 to 0.14 | The mean sexual abuse in the intervention groups was 0.12 standard deviations lower | 239 | ⊕⊕⊕⊝ | |
| Sexual abuse | The mean sexual abuse in the control groups was − 0.06 | The mean sexual abuse in the intervention groups was 0.07 lower | 110 | ⊕⊕⊕⊝ | |
| Emotional abuse | The mean emotional abuse ranged across control groups from 12.11 to 24.80 | The mean emotional abuse in the intervention groups was 0.05 standard deviations lower | 558 | ⊕⊕⊝⊝ | |
| Emotional abuse | The mean emotional abuse in the control groups was − 1.92 | The mean emotional abuse in the intervention groups was 4.24 lower (6.42 lower to 2.06 lower) | 110 | ⊕⊕⊕⊝ | |
| Overall abuse | The mean overall abuse in the control groups was 23.39 | The mean overall abuse in the intervention groups was 7.74 standard deviations lower | 53 | ⊕⊕⊝⊝ | |
| *The basis for the assumed risk (e.g. the median control group risk across studies) is provided in footnotes. The corresponding risk (and its 95% CI) is based on the assumed risk in the comparison group and the relative effect of the intervention (and its 95% CI). | |||||
| GRADE Working Group grades of evidence | |||||
| aPartner Abuse Scale (PAS), physical subscale; 46‐item Severity of Violence Against Women Scale (SVAWS), physical violence subscale; Chinese version of the 39‐item Revised Conflicts Tactics Scale (CTS), psychological aggression subscale. | |||||
| Issue | Method |
| Assessment of reporting bias | We planned to draw funnel plots to investigate possible relationships between effect size and study precision, closely related to sample size (Egger 1997). For meaningful funnel plots, a large number of trials with a spread of sample sizes are required (Glasziou 2001; Hayashino 2005). We planned to draw funnel plots if there were at least 7 trials with appropriate data. |
| Subgroup analyses and investigation of heterogeneity | We plan to perform subgroup analyses for the following.
Theoretical justification for subgroup analyses.
|
| Sensitivity analyses | To assess the robustness of conclusions to quality of data and approaches to analysis, we will perform sensitivity analyses, including the following.
|
| Outcome or subgroup title | No. of studies | No. of participants | Statistical method | Effect size |
| 1 Brief advocacy Show forest plot | 3 | Std. Mean Difference (IV, Fixed, 95% CI) | Subtotals only | |
| 1.1 Up to 12 months follow‐up | 3 | 558 | Std. Mean Difference (IV, Fixed, 95% CI) | ‐0.00 [‐0.17, 0.16] |
| 1.2 12 to 24 months follow‐up | 1 | 319 | Std. Mean Difference (IV, Fixed, 95% CI) | ‐0.02 [‐0.24, 0.19] |
| 2 Brief advocacy (dichotomous outcome) (up to 12 months follow‐up) Show forest plot | 1 | Odds Ratio (M‐H, Fixed, 95% CI) | Totals not selected | |
| 3 Brief advocacy (mean change) Show forest plot | 1 | Mean Difference (IV, Fixed, 95% CI) | Subtotals only | |
| 3.1 'Severe' up to 12 months follow‐up | 1 | 110 | Mean Difference (IV, Fixed, 95% CI) | 0.08 [‐0.26, 0.42] |
| 3.2 'Minor' up to 12 months follow‐up | 1 | 110 | Mean Difference (IV, Fixed, 95% CI) | ‐1.0 [‐1.82, ‐0.18] |
| 4 Intensive advocacy Show forest plot | 1 | Mean Difference (IV, Fixed, 95% CI) | Subtotals only | |
| 4.1 Up to 12 months follow‐up | 1 | 265 | Mean Difference (IV, Fixed, 95% CI) | ‐0.12 [‐0.39, 0.15] |
| 4.2 12 to 24 months follow‐up | 1 | 265 | Mean Difference (IV, Fixed, 95% CI) | ‐0.25 [‐0.50, ‐0.00] |
| 4.3 24 + months follow‐up | 1 | 124 | Mean Difference (IV, Fixed, 95% CI) | 0.18 [‐0.20, 0.56] |
| 5 Intensive advocacy (dichotomous outcome) Show forest plot | 2 | Odds Ratio (M‐H, Fixed, 95% CI) | Subtotals only | |
| 5.1 Up to 12 months follow‐up | 2 | 182 | Odds Ratio (M‐H, Fixed, 95% CI) | 0.61 [0.33, 1.14] |
| 5.2 12 to 24 months follow‐up | 1 | 265 | Odds Ratio (M‐H, Fixed, 95% CI) | 0.39 [0.20, 0.77] |
| 5.3 24 + months follow‐up | 1 | 124 | Odds Ratio (M‐H, Fixed, 95% CI) | 1.07 [0.52, 2.23] |
| 6 Intensive advocacy: missing reassigned (dichotomous outcome) (up to 12 months follow‐up) Show forest plot | 2 | Odds Ratio (M‐H, Fixed, 95% CI) | Subtotals only | |
| 6.1 Missing intervention group not abused, control group abused | 2 | 192 | Odds Ratio (M‐H, Fixed, 95% CI) | 0.54 [0.29, 1.01] |
| 6.2 Missing intervention group and control group all not abused | 2 | 192 | Odds Ratio (M‐H, Fixed, 95% CI) | 0.54 [0.29, 1.01] |
| 6.3 Missing intervention group abused, control group not abused | 2 | 192 | Odds Ratio (M‐H, Fixed, 95% CI) | 0.83 [0.46, 1.49] |
| 6.4 Missing intervention group and control group all abused | 2 | 192 | Odds Ratio (M‐H, Fixed, 95% CI) | 0.83 [0.46, 1.49] |
| 7 Any advocacy Show forest plot | 4 | Std. Mean Difference (IV, Fixed, 95% CI) | Subtotals only | |
| 7.1 Up to 12 months follow‐up | 4 | 823 | Std. Mean Difference (IV, Fixed, 95% CI) | ‐0.04 [‐0.17, 0.10] |
| 7.2 12 to 24 months follow‐up | 2 | 584 | Std. Mean Difference (IV, Fixed, 95% CI) | ‐0.12 [‐0.29, 0.04] |
| 8 Any advocacy (dichotomous outcome) (up to 12 months follow‐up) Show forest plot | 3 | 488 | Odds Ratio (M‐H, Fixed, 95% CI) | 0.50 [0.33, 0.76] |
| Outcome or subgroup title | No. of studies | No. of participants | Statistical method | Effect size |
| 1 Brief advocacy (up to 12 months follow‐up) Show forest plot | 2 | 239 | Std. Mean Difference (IV, Fixed, 95% CI) | ‐0.12 [‐0.37, 0.14] |
| 2 Brief advocacy (mean change) (up to 12 months follow‐up) Show forest plot | 1 | Mean Difference (IV, Fixed, 95% CI) | Totals not selected | |
| 3 Brief advocacy (dichotomous outcome) (up to 12 months follow‐up) Show forest plot | 1 | Odds Ratio (M‐H, Fixed, 95% CI) | Totals not selected | |
| Outcome or subgroup title | No. of studies | No. of participants | Statistical method | Effect size |
| 1 Brief advocacy Show forest plot | 3 | Std. Mean Difference (IV, Fixed, 95% CI) | Subtotals only | |
| 1.1 Up to 12 months follow‐up | 3 | 558 | Std. Mean Difference (IV, Fixed, 95% CI) | ‐0.05 [‐0.22, 0.11] |
| 1.2 12 to 24 months follow‐up | 1 | 319 | Std. Mean Difference (IV, Fixed, 95% CI) | ‐0.06 [‐0.28, 0.16] |
| 2 Brief advocacy (mean change) (up to 12 months follow‐up) Show forest plot | 1 | Mean Difference (IV, Fixed, 95% CI) | Totals not selected | |
| 3 Intensive advocacy Show forest plot | 1 | Mean Difference (IV, Fixed, 95% CI) | Subtotals only | |
| 3.1 Up to 12 months follow‐up | 1 | 265 | Mean Difference (IV, Fixed, 95% CI) | ‐0.02 [‐0.16, 0.12] |
| 3.2 12 to 24 months follow‐up | 1 | 265 | Mean Difference (IV, Fixed, 95% CI) | ‐0.04 [‐0.19, 0.11] |
| 4 Intensive advocacy (dichotomous outcome) (up to 12 months follow‐up) Show forest plot | 1 | Odds Ratio (M‐H, Fixed, 95% CI) | Totals not selected | |
| 5 Any advocacy Show forest plot | 4 | Std. Mean Difference (IV, Fixed, 95% CI) | Subtotals only | |
| 5.1 Up to 12 months follow‐up | 4 | 823 | Std. Mean Difference (IV, Fixed, 95% CI) | ‐0.05 [‐0.18, 0.09] |
| 5.2 12 to 24 months follow‐up | 2 | 584 | Std. Mean Difference (IV, Fixed, 95% CI) | ‐0.06 [‐0.22, 0.10] |
| Outcome or subgroup title | No. of studies | No. of participants | Statistical method | Effect size |
| 1 Brief advocacy Show forest plot | 2 | Mean Difference (IV, Fixed, 95% CI) | Subtotals only | |
| 1.1 Up to 12 months follow‐up | 2 | 358 | Mean Difference (IV, Fixed, 95% CI) | 0.13 [‐0.54, 0.80] |
| 1.2 12 to 24 months follow‐up | 1 | 319 | Mean Difference (IV, Fixed, 95% CI) | ‐0.30 [‐1.07, 0.47] |
| Outcome or subgroup title | No. of studies | No. of participants | Statistical method | Effect size |
| 1 Brief advocacy Show forest plot | 1 | Mean Difference (IV, Fixed, 95% CI) | Subtotals only | |
| 1.1 Up to 12 months follow‐up | 1 | 319 | Mean Difference (IV, Fixed, 95% CI) | 0.10 [‐0.36, 0.56] |
| 1.2 12 to 24 months follow‐up | 1 | 319 | Mean Difference (IV, Fixed, 95% CI) | ‐0.60 [‐0.97, ‐0.23] |
| Outcome or subgroup title | No. of studies | No. of participants | Statistical method | Effect size |
| 1 Brief advocacy (up to 12 months follow‐up) Show forest plot | 1 | Mean Difference (IV, Fixed, 95% CI) | Totals not selected | |
| 2 Intensive advocacy (up to 12 months follow‐up) Show forest plot | 2 | Std. Mean Difference (IV, Fixed, 95% CI) | Totals not selected | |
| 3 Intensive advocacy (dichotomous outcome) (up to 12 months follow‐up) Show forest plot | 1 | Odds Ratio (M‐H, Fixed, 95% CI) | Totals not selected | |
| 4 Any advocacy (up to 12 months follow‐up) Show forest plot | 3 | 234 | Std. Mean Difference (IV, Fixed, 95% CI) | ‐0.26 [‐0.52, 0.01] |
| Outcome or subgroup title | No. of studies | No. of participants | Statistical method | Effect size |
| 1 Brief advocacy: 2 summary component subscales Show forest plot | 1 | Mean Difference (IV, Fixed, 95% CI) | Subtotals only | |
| 1.1 Physical component up to 12 months follow‐up | 1 | 200 | Mean Difference (IV, Fixed, 95% CI) | 0.80 [‐1.27, 2.87] |
| 1.2 Mental component up to 12 months follow‐up | 1 | 200 | Mean Difference (IV, Fixed, 95% CI) | 0.37 [‐1.94, 2.68] |
| 2 Brief advocacy: 8 subscales (mean change) Show forest plot | 2 | Mean Difference (IV, Fixed, 95% CI) | Subtotals only | |
| 2.1 Physical functioning up to 12 months follow‐up | 2 | 314 | Mean Difference (IV, Fixed, 95% CI) | 4.92 [‐0.32, 10.16] |
| 2.2 Role physical up to 12 months follow‐up | 2 | 314 | Mean Difference (IV, Fixed, 95% CI) | 7.42 [‐0.97, 15.80] |
| 2.3 Bodily pain up to 12 months follow‐up | 2 | 314 | Mean Difference (IV, Fixed, 95% CI) | ‐4.51 [‐10.42, 1.39] |
| 2.4 General health up to 12 months follow‐up | 2 | 314 | Mean Difference (IV, Fixed, 95% CI) | ‐0.85 [‐4.06, 2.37] |
| 2.5 Vitality up to 12 months follow‐up | 2 | 314 | Mean Difference (IV, Fixed, 95% CI) | ‐1.38 [‐5.56, 2.80] |
| 2.6 Social functioning up to 12 months follow‐up | 2 | 314 | Mean Difference (IV, Fixed, 95% CI) | 0.92 [‐5.00, 6.84] |
| 2.7 Role emotional up to 12 months follow‐up | 2 | 314 | Mean Difference (IV, Fixed, 95% CI) | 9.37 [‐0.31, 19.05] |
| 2.8 Mental health up to 12 months follow‐up | 2 | 314 | Mean Difference (IV, Fixed, 95% CI) | ‐1.72 [‐5.31, 1.87] |
| 3 Intensive advocacy: 2 summary component subscales Show forest plot | 1 | Mean Difference (IV, Fixed, 95% CI) | Totals not selected | |
| 3.1 Physical component up to 12 months follow‐up | 1 | Mean Difference (IV, Fixed, 95% CI) | 0.0 [0.0, 0.0] | |
| 3.2 Mental component up to 12 months follow‐up | 1 | Mean Difference (IV, Fixed, 95% CI) | 0.0 [0.0, 0.0] | |
| 4 Intensive advocacy: overall Show forest plot | 2 | Mean Difference (IV, Fixed, 95% CI) | Subtotals only | |
| 4.1 Up to 12 months follow‐up | 2 | 343 | Mean Difference (IV, Fixed, 95% CI) | 0.23 [0.00, 0.46] |
| 4.2 12 to 24 months follow‐up | 1 | 265 | Mean Difference (IV, Fixed, 95% CI) | 0.25 [‐0.02, 0.52] |
| 4.3 24 + months follow‐up | 1 | 124 | Mean Difference (IV, Fixed, 95% CI) | 0.30 [‐0.07, 0.67] |
| 5 Any advocacy: 2 summary component subscales Show forest plot | 2 | Std. Mean Difference (IV, Fixed, 95% CI) | Subtotals only | |
| 5.1 Physical component up to 12 months follow‐up | 2 | 303 | Std. Mean Difference (IV, Fixed, 95% CI) | 0.21 [‐0.02, 0.44] |
| 5.2 Mental component up to 12 months | 2 | 303 | Std. Mean Difference (IV, Fixed, 95% CI) | 0.08 [‐0.15, 0.31] |
| Outcome or subgroup title | No. of studies | No. of participants | Statistical method | Effect size |
| 1 Brief advocacy (up to 12 months follow‐up) Show forest plot | 2 | 239 | Std. Mean Difference (IV, Fixed, 95% CI) | ‐0.17 [‐0.43, 0.08] |
| 2 Brief advocacy (dichotomous outcome) (up to 12 months follow‐up) Show forest plot | 2 | 149 | Odds Ratio (M‐H, Fixed, 95% CI) | 0.31 [0.15, 0.65] |
| 3 Intensive advocacy Show forest plot | 3 | Std. Mean Difference (IV, Fixed, 95% CI) | Subtotals only | |
| 3.1 Up to 12 months follow‐up | 3 | 446 | Std. Mean Difference (IV, Fixed, 95% CI) | ‐0.14 [‐0.33, 0.05] |
| 3.2 12 to 24 months follow‐up | 1 | 265 | Std. Mean Difference (IV, Fixed, 95% CI) | ‐0.12 [‐0.36, 0.12] |
| 4 Intensive advocacy (dichotomous outcome) (up to 12 months follow‐up) Show forest plot | 1 | Odds Ratio (M‐H, Fixed, 95% CI) | Totals not selected | |
| 5 Any advocacy (up to 12 months follow‐up) Show forest plot | 5 | 685 | Std. Mean Difference (IV, Fixed, 95% CI) | ‐0.15 [‐0.30, 0.00] |
| 6 Any advocacy (dichotomous outcome) (up to 12 months follow‐up) Show forest plot | 3 | 252 | Odds Ratio (M‐H, Fixed, 95% CI) | 0.37 [0.21, 0.66] |
| Outcome or subgroup title | No. of studies | No. of participants | Statistical method | Effect size |
| 1 Brief advocacy (up to 12 months follow‐up) Show forest plot | 1 | Mean Difference (IV, Fixed, 95% CI) | Totals not selected | |
| 2 Intensive advocacy Show forest plot | 1 | Mean Difference (IV, Fixed, 95% CI) | Subtotals only | |
| 2.1 Up to 12 months follow‐up | 1 | 265 | Mean Difference (IV, Fixed, 95% CI) | ‐0.13 [‐0.35, 0.09] |
| 2.2 12 to 24 months follow‐up | 1 | 265 | Mean Difference (IV, Fixed, 95% CI) | ‐0.01 [‐0.22, 0.20] |
| 2.3 24 + months follow‐up | 1 | 124 | Mean Difference (IV, Fixed, 95% CI) | ‐0.11 [‐0.40, 0.18] |
| 3 Intensive advocacy (mean change) (up to 12 months follow‐up) Show forest plot | 1 | Mean Difference (IV, Fixed, 95% CI) | Totals not selected | |
| 4 Any advocacy (up to 12 months follow‐up) Show forest plot | 2 | 318 | Std. Mean Difference (IV, Fixed, 95% CI) | ‐0.22 [‐0.44, 0.01] |
| Outcome or subgroup title | No. of studies | No. of participants | Statistical method | Effect size |
| 1 Brief advocacy (up to 12 months follow‐up) Show forest plot | 1 | Mean Difference (IV, Fixed, 95% CI) | Totals not selected | |
| Outcome or subgroup title | No. of studies | No. of participants | Statistical method | Effect size |
| 1 Brief advocacy (up to 12 months follow‐up) Show forest plot | 1 | Mean Difference (IV, Fixed, 95% CI) | Totals not selected | |
| Outcome or subgroup title | No. of studies | No. of participants | Statistical method | Effect size |
| 1 Brief advocacy (dichotomous outcome) Show forest plot | 1 | Odds Ratio (M‐H, Fixed, 95% CI) | Totals not selected | |
| 1.1 Low birth weight (< 2500 g) | 1 | Odds Ratio (M‐H, Fixed, 95% CI) | 0.0 [0.0, 0.0] | |
| 1.2 Very low birth weight (< 1500 g) | 1 | Odds Ratio (M‐H, Fixed, 95% CI) | 0.0 [0.0, 0.0] | |
| Outcome or subgroup title | No. of studies | No. of participants | Statistical method | Effect size |
| 1 Brief advocacy Show forest plot | 1 | Mean Difference (IV, Fixed, 95% CI) | Totals not selected | |
| Outcome or subgroup title | No. of studies | No. of participants | Statistical method | Effect size |
| 1 Brief advocacy (dichotomous outcome) Show forest plot | 1 | Odds Ratio (M‐H, Fixed, 95% CI) | Totals not selected | |
| 1.1 Pre‐term birth (37 weeks gestation) | 1 | Odds Ratio (M‐H, Fixed, 95% CI) | 0.0 [0.0, 0.0] | |
| 1.2 Very pre‐term birth (< 33 weeks gestation) | 1 | Odds Ratio (M‐H, Fixed, 95% CI) | 0.0 [0.0, 0.0] | |
| Outcome or subgroup title | No. of studies | No. of participants | Statistical method | Effect size |
| 1 Brief advocacy Show forest plot | 1 | Mean Difference (IV, Fixed, 95% CI) | Totals not selected | |
| Outcome or subgroup title | No. of studies | No. of participants | Statistical method | Effect size |
| 1 Brief advocacy (up to 12 months follow‐up) Show forest plot | 2 | 92 | Std. Mean Difference (IV, Fixed, 95% CI) | ‐0.21 [‐0.62, 0.21] |
| Outcome or subgroup title | No. of studies | No. of participants | Statistical method | Effect size |
| 1 Brief advocacy (up to 12 months follow‐up) Show forest plot | 1 | Mean Difference (IV, Fixed, 95% CI) | Totals not selected | |
| Outcome or subgroup title | No. of studies | No. of participants | Statistical method | Effect size |
| 1 Intensive advocacy Show forest plot | 1 | Mean Difference (IV, Fixed, 95% CI) | Totals not selected | |
| 1.1 Up to 12 months follow‐up | 1 | Mean Difference (IV, Fixed, 95% CI) | 0.0 [0.0, 0.0] | |
| 1.2 12 to 24 months follow‐up | 1 | Mean Difference (IV, Fixed, 95% CI) | 0.0 [0.0, 0.0] | |
| 1.3 24 + months follow‐up | 1 | Mean Difference (IV, Fixed, 95% CI) | 0.0 [0.0, 0.0] | |
| Outcome or subgroup title | No. of studies | No. of participants | Statistical method | Effect size |
| 1 Intensive advocacy (up to 12 months follow‐up) Show forest plot | 1 | Mean Difference (IV, Fixed, 95% CI) | Totals not selected | |
| Outcome or subgroup title | No. of studies | No. of participants | Statistical method | Effect size |
| 1 Brief advocacy (up to 12 months follow‐up) Show forest plot | 1 | Mean Difference (IV, Fixed, 95% CI) | Totals not selected | |
| 2 Intensive advocacy Show forest plot | 3 | Std. Mean Difference (IV, Fixed, 95% CI) | Subtotals only | |
| 2.1 Up to 12 months follow‐up | 3 | 446 | Std. Mean Difference (IV, Fixed, 95% CI) | 0.00 [‐0.19, 0.19] |
| 2.2 12 to 24 months follow‐up | 1 | 265 | Std. Mean Difference (IV, Fixed, 95% CI) | 0.12 [‐0.12, 0.37] |
| 2.3 24 + months follow‐up | 1 | 124 | Std. Mean Difference (IV, Fixed, 95% CI) | 0.39 [0.03, 0.74] |
| 3 Intensive advocacy (mean change) Show forest plot | 1 | Mean Difference (IV, Fixed, 95% CI) | Subtotals only | |
| 3.1 Overall support up to 12 months follow‐up | 1 | 24 | Mean Difference (IV, Fixed, 95% CI) | 10.19 [5.67, 14.71] |
| 3.2 Tangible support up to 12 months follow‐up | 1 | 24 | Mean Difference (IV, Fixed, 95% CI) | 2.19 [0.93, 3.45] |
| 3.3 Appraisal support up to 12 months follow‐up | 1 | 24 | Mean Difference (IV, Fixed, 95% CI) | 0.67 [0.14, 1.20] |
| 3.4 Self esteem support up to 12 months follow‐up | 1 | 24 | Mean Difference (IV, Fixed, 95% CI) | 1.14 [0.43, 1.85] |
| 3.5 Belonging support up to 12 months follow‐up | 1 | 24 | Mean Difference (IV, Fixed, 95% CI) | 4.18 [1.18, 7.18] |
| 4 Any advocacy (up to 12 months follow‐up) Show forest plot | 4 | 646 | Std. Mean Difference (IV, Fixed, 95% CI) | 0.07 [‐0.08, 0.23] |
| Outcome or subgroup title | No. of studies | No. of participants | Statistical method | Effect size |
| 1 Intensive advocacy (dichotomous outcome) Show forest plot | 2 | Odds Ratio (M‐H, Fixed, 95% CI) | Subtotals only | |
| 1.1 Up to 12 months follow‐up | 2 | 301 | Odds Ratio (M‐H, Fixed, 95% CI) | 1.22 [0.74, 2.00] |
| 1.2 12 to 24 months follow‐up | 1 | 261 | Odds Ratio (M‐H, Fixed, 95% CI) | 1.27 [0.78, 2.08] |
| 1.3 24 + months follow‐up | 1 | 119 | Odds Ratio (M‐H, Fixed, 95% CI) | 0.97 [0.47, 1.98] |
| 2 Intensive advocacy: missing reassigned (up to 12 months follow‐up) (dichotomous outcome) Show forest plot | 2 | Odds Ratio (M‐H, Fixed, 95% CI) | Subtotals only | |
| 2.1 Missing intervention group independent, control group not independent | 2 | 330 | Odds Ratio (M‐H, Fixed, 95% CI) | 1.58 [0.98, 2.55] |
| 2.2 Missing intervention group and control group all independent | 2 | 330 | Odds Ratio (M‐H, Fixed, 95% CI) | 1.13 [0.71, 1.80] |
| 2.3 Missing intervention group not independent, control group independent | 2 | 330 | Odds Ratio (M‐H, Fixed, 95% CI) | 0.82 [0.52, 1.31] |
| 2.4 Missing intervention group and control group all not independent | 2 | 330 | Odds Ratio (M‐H, Fixed, 95% CI) | 1.13 [0.70, 1.82] |
| Outcome or subgroup title | No. of studies | No. of participants | Statistical method | Effect size |
| 1 Intensive advocacy Show forest plot | 1 | Mean Difference (IV, Fixed, 95% CI) | Subtotals only | |
| 1.1 Up to 12 months follow‐up | 1 | 265 | Mean Difference (IV, Fixed, 95% CI) | ‐0.02 [‐0.08, 0.04] |
| 1.2 12 to 24 months follow‐up | 1 | 265 | Mean Difference (IV, Fixed, 95% CI) | 0.0 [‐0.05, 0.05] |
| 1.3 24 + months follow‐up | 1 | 124 | Mean Difference (IV, Fixed, 95% CI) | ‐0.07 [‐0.14, ‐0.00] |
| Outcome or subgroup title | No. of studies | No. of participants | Statistical method | Effect size |
| 1 Brief advocacy Show forest plot | 3 | Mean Difference (IV, Fixed, 95% CI) | Subtotals only | |
| 1.1 Up to 12 months follow‐up | 3 | 558 | Mean Difference (IV, Fixed, 95% CI) | 1.39 [0.92, 1.87] |
| 1.2 12 to 24 months follow‐up | 1 | 319 | Mean Difference (IV, Fixed, 95% CI) | 0.10 [‐0.42, 0.62] |
| Outcome or subgroup title | No. of studies | No. of participants | Statistical method | Effect size |
| 1 Brief advocacy Show forest plot | 2 | Std. Mean Difference (IV, Fixed, 95% CI) | Subtotals only | |
| 1.1 Up to 12 months follow‐up | 2 | 358 | Std. Mean Difference (IV, Fixed, 95% CI) | 0.19 [‐0.02, 0.39] |
| 1.2 12 to 24 months follow‐up | 1 | 319 | Std. Mean Difference (IV, Fixed, 95% CI) | 0.15 [‐0.07, 0.37] |
| Outcome or subgroup title | No. of studies | No. of participants | Statistical method | Effect size |
| 1 Intensive advocacy Show forest plot | 1 | Mean Difference (IV, Fixed, 95% CI) | Totals not selected | |