Thrombolysis for acute deep vein thrombosis
Abstract
Background
Standard treatment for deep vein thrombosis aims to reduce immediate complications. Use of thrombolysis or clot dissolving drugs could reduce the long‐term complications of post‐thrombotic syndrome (PTS) including pain, swelling, skin discolouration, or venous ulceration in the affected leg. This is the third update of a review first published in 2004.
Objectives
To assess the effects of thrombolytic therapy and anticoagulation compared to anticoagulation alone for the management of people with acute deep vein thrombosis (DVT) of the lower limb as determined by the effects on pulmonary embolism, recurrent venous thromboembolism, major bleeding, post‐thrombotic complications, venous patency and venous function.
Search methods
For this update the Cochrane Vascular Information Specialist (CIS) searched the Specialised Register (February 2016). In addition the CIS searched the Cochrane Register of Studies (CENTRAL (2016, Issue 1)). Trial registries were searched for details of ongoing or unpublished studies.
Selection criteria
Randomised controlled trials (RCTs) examining thrombolysis and anticoagulation versus anticoagulation for acute DVT were considered.
Data collection and analysis
For this update (2016), LW and CB selected trials, extracted data independently, and sought advice from MPA where necessary. We assessed study quality with the Cochrane risk of bias tool. For dichotomous outcomes, we calculated the risk ratio (RR) and corresponding 95% confidence interval (CI). Data were pooled using a fixed‐effect model unless significant heterogeneity was identified in which case a random‐effects model was used. GRADE was used to assess the overall quality of the evidence supporting the outcomes assessed in this review.
Main results
Seventeen RCTs with 1103 participants were included. These studies differed in the both thrombolytic agent used and in the technique used to deliver it. Systemic, loco‐regional and catheter‐directed thrombolysis (CDT) were all included. Fourteen studies were rated as low risk of bias and three studies were rated as high risk of bias. We combined the results as any (all) thrombolysis compared to standard anticoagulation. Complete clot lysis occurred significantly more often in the treatment group at early follow‐up (RR 4.91; 95% CI 1.66 to 14.53, P = 0.004) and at intermediate follow‐up (RR 2.44; 95% CI 1.40 to 4.27, P = 0.002; moderate quality evidence). A similar effect was seen for any degree of improvement in venous patency. Up to five years after treatment significantly less PTS occurred in those receiving thrombolysis (RR 0.66, 95% CI 0.53 to 0.81; P < 0.0001; moderate quality evidence). This reduction in PTS was still observed at late follow‐up (beyond five years), in two studies (RR 0.58, 95% CI 0.45 to 0.77; P < 0.0001; moderate quality evidence). Leg ulceration was reduced although the data were limited by small numbers (RR 0.87; 95% CI 0.16 to 4.73, P = 0.87). Those receiving thrombolysis had increased bleeding complications (RR 2.23; 95% CI 1.41 to 3.52, P = 0.0006; moderate quality evidence). Three strokes occurred in the treatment group, all in trials conducted pre‐1990, and none in the control group. There was no significant effect on mortality detected at either early or intermediate follow‐up. Data on the occurrence of pulmonary embolism (PE) and recurrent DVT were inconclusive. Systemic thrombolysis and CDT had similar levels of effectiveness. Studies of CDT included two trials in femoral and iliofemoral DVT, and results from these are consistent with those from trials of systemic thrombolysis in DVT at other levels of occlusion.
Authors' conclusions
Thrombolysis increases the patency of veins and reduces the incidence of PTS following proximal DVT by a third. Evidence suggests that systemic administration and CDT have similar effectiveness. Strict eligibility criteria appears to improve safety in recent studies and may be necessary to reduce the risk of bleeding complications. This may limit the applicability of this treatment. In those who are treated there is a small increased risk of bleeding. Using GRADE assessment, the evidence was judged to be of moderate quality due to many trials having low numbers of participants. However, the results across studies were consistent and we have reasonable confidence in these results.
PICOs
Plain language summary
Thrombolysis for treatment of acute deep vein thrombosis
Background
Deep vein thrombosis (DVT) occurs when a blood clot forms in a leg vein. The clot can break up and move to the lungs, leading to a potentially serious blockage in blood flow (pulmonary embolism or PE). Because of the damage to the leg vein, post‐thrombotic syndrome (PTS) may develop any time over the next couple of years. Symptoms include leg pain, swelling, skin pigmentation and leg ulcers, leading to loss of mobility. Anticoagulants are the standard treatment for DVT or a clot in a calf vein. These thin the blood to reduce further clots from forming and prevent PE; yet PTS can still develop. Thrombolysis breaks down the blood clot. For DVT, drugs such as streptokinase, urokinase and tissue plasminogen activator are infused into a vein in the arm or foot or, in some cases, directly at the site of the clot using a catheter and X‐ray control. Bleeding complications, stroke or intracerebral haemorrhage are potential harmful events for both treatments.
Study characteristics and key results
The review results are based on 17 controlled trials that randomised a total of 1103 people with acute DVT (within 21 days of onset of symptoms) to receive thrombolysis or anticoagulant treatment. Trials were carried out principally in the USA, Scandinavia, Germany and the UK. All trials included men and women ranging in age from 18 to 75 years with a preponderance of older adults.
The present review (current until February 2016) showed that thrombolysis may have advantages over standard anticoagulation treatment. Thrombolysis effectively dissolved the clot so that complete clot breakdown occurred more often with thrombolysis than with standard anticoagulant therapy. Blood flow in the affected vein (venous patency) was also better maintained. Three trials (306 participants) continued for over six months and found that fewer people developed PTS when treated with thrombolysis, 45% compared with 66% in the standard anticoagulation treatment group. Two trials (211 participants) which continued for over five years also showed that fewer people developed PTS when treated with thrombolysis.
Those receiving thrombolysis had more bleeding complications than with standard anticoagulation (10% versus 8%). Most bleeding episodes and deaths occurred in the older studies. Use of strict eligibility criteria appears to have improved the safety of this treatment, which is effective delivered directly to the clot by catheter or via bloodstream from another vein.
Qualitity of the evidence
Using GRADE assessment, the evidence was judged to be of moderate quality due to many trials having low numbers of participants. However, the results across studies were consistent and we have reasonable confidence in these results.
Authors' conclusions
Summary of findings
| Treatment with any thrombolysis for acute DVT | ||||||
| Patient or population: patients diagnosed with acute DVT | ||||||
| Outcomes | Anticipated absolute effects* (95% CI) | Relative effect | № of participants | Quality of the evidence | Comments | |
| Risk with control | Risk with any thrombolysis | |||||
| Complete clot lysis (intermediate, 6 months to under 5 years after treatment) | Study population | RR 2.44 (1.4 to 4.27) | 630 | ⊕⊕⊕⊝ | 78 (of 240) patients treated with standard anticoagulation had complete clot lysis compared to 198 (of 390) in the thrombolysis group | |
| 325 per 1000 | 793 per 1000 (455 to 1000) | |||||
| Bleeding (early, up to 1 month after treatment) | Study population | RR 2.23 | 1103 | ⊕⊕⊕⊝ | Although 17 studies reported on bleeding, these were small studies | |
| 43 per 1000 | 96 per 1000 (61 to 152) | |||||
| Post‐thrombotic syndrome (intermediate, 6 months to under 5 years after treatment) | Study population | RR 0.66 | 306 | ⊕⊕⊕⊝ | 96 (of 146) patients treated with standard anticoagulation developed PTS compared to 72 (of 160) treated with thrombolysis | |
| 658 per 1000 | 434 per 1000 (348 to 533) | |||||
| Post‐thrombotic syndrome (late, 5 year follow‐up after treatment) | Study population | RR 0.58 | 211 | ⊕⊕⊕⊝ | 72 (of 107) patients treated with standard anticoagulation developed PTS compared to 41 (of 104) treated with thrombolysis | |
| 673 per 1000 | 390 per 1000 (303 to 518) | |||||
| *The risk in the intervention group (and its 95% confidence interval) is based on the assumed risk in the comparison group and the relative effect of the intervention (and its 95% CI). | ||||||
| GRADE Working Group grades of evidence | ||||||
| 1 Downgraded by one level as the number of participants in each study is small | ||||||
| Treatment with catheter directed thrombolysis for acute DVT | ||||||
| Patient or population: patients diagnosed with acute deep vein thrombosis | ||||||
| Outcomes | Anticipated absolute effects* (95% CI) | Relative effect | № of participants | Quality of the evidence | Comments | |
| Risk with control | Risk with catheter directed thrombolysis | |||||
| Complete clot lysis (intermediate, 6 months to under 5 years after treatment) | Study population | RR 2.52 | 224 | ⊕⊕⊕⊝ | ||
| 58 (of 116) patients treated with standard anticoagulation had complete clot lysis compared to 81 (of 108) in the CDT group | ||||||
| Bleeding (early, up to 1 month after treatment) | Study population | RR 7.69 | 224 | ⊕⊕⊕⊝ | None (of 116) patients in the standard anticoagulation group had bleeding complications compared to 3 (of 108) in the CDT group. | |
| Cannot define risk as no events reported in the standard anticoagulation group | ||||||
| Post‐thrombotic syndrome (intermediate, 6 months to under 5 years after treatment) | Study population | RR 0.74 | 189 | ⊕⊕⊕⊝ | 55 (of 99) patients in the standard anticoagulation group developed PTS compared to 37 (of 90) in the CDT group. | |
| 556 per 1000 | 411 per 1000 (306 to 556) | |||||
| Post‐thrombotic syndrome (late, 5 year follow‐up after treatment) | Study population | RR 0.60 | 176 | ⊕⊕⊕⊝ | 63 (of 89) patients in the standard anticoagulation group developed PTS compared to 37 (of 87) in the CDT group. | |
| 708 per 1000 | 425 per 1000 (319 to 559) | |||||
| *The risk in the intervention group (and its 95% confidence interval) is based on the assumed risk in the comparison group and the relative effect of the intervention (and its 95% CI). | ||||||
| GRADE Working Group grades of evidence | ||||||
| 1 Downgraded by one level as confidence intervals are wide around the estimate of the effect | ||||||
Background
Description of the condition
Deep vein thrombosis (DVT) is a major health problem with between 2.5% to 5% of the population affected at some time in their lives (Browse 1999; White 2006). Its main complications are pulmonary embolism (PE) in the short term and post‐thrombotic syndrome (PTS) in the long term. Standard treatment is with anticoagulation (thinning the blood to reduce formation of further clots) and is aimed mainly at the prevention of PE and recurrent DVT (Kearon 2016; NICE 2012). Despite treatment, over 50% of patients may suffer post‐thrombotic symptoms in the long term, manifested by some degree of pain, swelling, skin pigmentation or venous ulceration of the affected leg (Kahn 2006; Schulman 2006). This usually becomes apparent in the first two years after the thrombotic event (Brandjes 1997; Kahn 2004; Kahn 2008). Most studies report eventual venous ulceration in at least 6% of DVT patients despite treatment with compression bandaging (Johnson 1995; Schulman 2006). The prevalence of venous ulcers in the general population is around 1 in 1000, and between 40% to 50% of patients with venous ulcers have evidence of post‐thrombotic damage (Browse 1999; Kahn 2004). Complications including venous ulcers may result in significant disability and may be difficult to manage in both the community and secondary care. Because complications develop after hospital admission, there is a low level of awareness of these complications amongst the clinicians who dealt with the acute admission.
Description of the intervention
Thrombolytic drugs act to dissolve blood clots by activating plasminogen. This forms an enzyme called plasmin that breaks links between the fibrin molecules, which make up blood clots. The drugs can be administered systemically through a peripheral vein, loco‐regionally via a vein close to the clot or directly via a catheter to the occluding thrombus. The latter method more directly targets plasminogen within the clot and is less affected by potential inhibitors in the circulation.
How the intervention might work
Dissolving the thrombus in the acute phase may reduce the risk of more permanent damage to the structure and function of the vein, in particular venous valvular function, thus lowering the risk of post‐thrombotic complications in the long term.
Why it is important to do this review
This systematic review draws together previous comparative trials of thrombolysis and anticoagulation to reassess the advantages and disadvantages of thrombolytic therapy in the context of acute lower limb DVT and to identify areas for future research. This systematic review is an update of a previously published Cochrane review (Armon 2000; Watson 2004 ; Watson 2010; Watson 2014).
Objectives
To assess the effects of thrombolytic therapy and anticoagulation compared to anticoagulation alone for the management of people with acute DVT of the lower limb as determined by the effects on clot lysis, bleeding and post thrombotic syndrome and other relevant outcomes.
Methods
Criteria for considering studies for this review
Types of studies
All randomised trials of thrombolysis and anticoagulation versus anticoagulation for acute lower limb DVT were considered. Any method of randomisation was eligible, and differences in quality were taken into account in the analysis. Trials that were not analysed on an intention‐to‐treat basis were included provided all randomised participants were accounted for.
Types of participants
Trials of participants with acute DVT, defined as onset of symptoms within seven days and confirmed by objective testing with, for example, venography or duplex ultrasonography, were considered. Trials including participants with chronic or recurrent venous thrombosis were excluded, as were those with participants commencing treatment after a maximum of 21 days from the onset of symptoms. Trials including participants with arm vein thrombosis were included in the update when the majority of cases affected the lower limb.
Types of interventions
Trials with the use of any thrombolytic agent were included, the principal ones being streptokinase, urokinase and tissue plasminogen activator (tPA); other agents were included if used for the treatment of acute DVT. All routes of drug lysis administration were considered as were different dosing regimens of lytic agents. This included systemic and catheter‐directed thrombolysis (CDT) methods.
Types of outcome measures
Outcomes were classified into early (up to one month); intermediate (after six months to five years) or late (more than five years) from time of intervention (see Included studies). When data were reported between one and six months, we planned to discuss and reassess the definition of our time points as required.
Primary outcomes
The following primary outcomes were included:
-
Any improvement in venous patency (assessed by objective measures such as venography, where pre‐ and post‐comparative data on the degree of restoration of the lumen were available);
-
Complete clot lysis (defined as achievement of full patency of the affected vein, or complete dissolution of the clot, by objective measures);
-
Bleeding complications excluding stroke or intracerebral haemorrhage (defined as bleeding causing treatment to be stopped, requiring transfusion or surgery, or causing chronic or fatal sequelae);
-
Stroke and in particular haemorrhagic stroke (preferably documented by objective means such as a computerised tomography scan or autopsy);
-
PTS;
-
Venous ulceration rates; and
-
Mortality.
Secondary outcomes
Secondary outcomes included:
-
Recurrent DVT;
-
PE;
-
Venous function (assessed by duplex ultrasound or other objective means such as foot volumetry or ambulatory venous pressure measurements);
-
Quality of life (QoL); and
-
Cost comparisons.
Search methods for identification of studies
Electronic searches
For this update the Cochrane Vascular Information Specialist (CIS) searched the following databases for relevant trials (February 2016):
-
The Cochrane Vascular Specialised Register; and
-
The Cochrane Central Register of Controlled Trials (CENTRAL (2016, Issue 1)) via The Cochrane Register of Studies Online.
There were no restrictions on language. See Appendix 1 for details of the search strategy used to search CENTRAL.
The Specialised Register is maintained by the CIS and is constructed from weekly electronic searches of MEDLINE, EMBASE, CINAHL, AMED, and through handsearching relevant journals. The full list of the databases, journals and conference proceedings which have been searched, as well as the search strategies used are described in the Specialised Register section of the Cochrane Vascular module in the Cochrane Library (www.cochranelibrary.com).
The CIS searched the following trial registries for details of ongoing and unpublished studies using the terms 'thrombosis AND thrombolysis' (February 2016):
-
ClinicalTrials.gov (www.clinicaltrials.gov);
-
World Health Organization International Clinical Trials Registry Platform (www.who.int/trialsearch); and
-
ISRCTN Register (www.isrctn.com/).
Searching other resources
The reference lists of articles retrieved by electronic searches were searched for additional citations.
Data collection and analysis
Data were collected from the original papers and authors were contacted for clarification where necessary.
Selection of studies
LW and CB identified possible trials.
Data extraction and management
Data were collected using pro formas designed by Cochrane Vascular. For this 2016 update, LW and CB independently completed data extraction. Authors of ongoing trials were contacted to check for available data but no response was received.
Assessment of risk of bias in included studies
Study quality was independently assessed by two review authors (LW and CB, or MPA and CB) using forms designed according to Cochrane and Cochrane Vascular guidelines and the Cochrane risk of bias tool (Higgins 2011). Any disagreements were resolved by discussion.
Measures of treatment effect
Statistical analyses were performed according to the statistical guidelines for review authors provided by Cochrane Vascular. If appropriate, for each dichotomous outcome we calculated a summary statistic using the risk ratio (RR) and corresponding 95% confidence interval (CI).
Unit of analysis issues
Individual participants were the unit of analysis. If appropriate, the control groups in the multiple arm trials were divided up to avoid double counting in the meta‐analysis.
Dealing with missing data
Intention‐to‐treat analysis was conducted where possible. Any missing statistics were recalculated from original data where available. Authors were contacted to request data where it was not possible to identify specific event numbers from the data reported.
Assessment of heterogeneity
Heterogeneity was assessed clinically from descriptions of studies, visually from forest plots and statistically using the Chi2 test. If P < 0.05 a random‐effects model was used, otherwise a fixed‐effect model was reported. We also considered heterogeneity by clinical judgements of differences in participant populations, interventions and outcome assessments.
Assessment of reporting biases
Reporting bias was assessed through a review of the studies identified and funnel plots were considered if relevant.
Data synthesis
We pooled studies for meta‐analysis when the interventions, patient groups, outcome measures and timing of outcome assessment were sufficiently similar (determined by consensus). The pooled RR and corresponding 95% CI were calculated for dichotomous outcomes. A fixed‐effect model was used unless statistical heterogeneity was identified (as described above), in which case a random‐effects model was used.
Subgroup analysis and investigation of heterogeneity
Trials were analysed together and in subgroups according to route of administration. Other sources of heterogeneity such as participant selection, type of DVT, drug or dose were commented on where relevant.
Sensitivity analysis
Sensitivity analysis included the exclusion of studies deemed to be at high risk of bias from pooled analyses to see whether this would influence the results.
Summary of findings
We created 'Summary of findings' tables using the GRADEpro software. This summarised the evidence comparing thrombolysis to standard anticoagulation for study populations consisting of patients with acute DVT (summary of findings Table for the main comparison); and comparing CDT versus standard anticoagulation for DVT (summary of findings Table 2). The most important and clinically relevant outcomes (both desirable and undesirable) that were thought to be essential for decision‐making were the outcomes complete clot lysis, bleeding and post‐thrombotic syndrome. Assumed control intervention risks were calculated by the mean number of events in the control groups of the selected studies for each outcome. The system developed by the Grades of Recommendation, Assessment, Development and Evaluation Working Group (GRADE working group) was used for grading the quality of evidence as high, moderate, low and very low, based on within‐study risk of bias, inconsistency, directness of evidence, imprecision, and publication bias (Atkins 2004).
Results
Description of studies
Results of the search
No new included studies were identified for this 2016 update (See Figure 1). Nine additional publications from the Cavent study (Enden 2011) were identified, one of which reported five year follow‐up data (Haig 2016). Seven new studies were excluded (Bashir 2014; Cakir 2014; Engelberger 2015; Patra 2014; Santiago 2014; Sui 2013; Zhang 2014), and two new ongoing studies were identified (IRCT201108035625N3; NCT00970619).

Study flow diagram.
Included studies
In total 17 trials were included, with 1103 participants (Arneson 1978; Common 1976; Elliot 1979; Elsharawy 2002; Enden 2011; Goldhaber 1990; Goldhaber 1996; Kakkar 1969; Kiil 1981; Marder 1977; Schulman 1986; Schweizer 1998; Schweizer 2000; Tsapogas 1973; Turpie 1990; Ugurlu 2002; Verhaeghe 1989). Studies were carried out from 1969 to 2009. A cut‐off of 21 days from onset of symptoms was used, therefore a small number of studies excluded on this basis from the original review were included.
Participants
Trials were carried out principally in the USA, Scandinavia, Germany and the UK. All trials included men and women and the age range was 18 to 75 years with a preponderance of older adults. The participants had diverse underlying causes for developing DVT, and varying degrees of level and extent of occlusion. The trial by Elsharawy 2002 was conducted in DVT affecting femoral and iliofemoral veins and Enden 2011 included pelvic, femoral and iliofemoral veins, whereas other trials included thrombosis affecting different combinations of levels, including popliteal. The only study to include calf vein thrombosis only was Schulman 1986. See Table 1, 'Level of affected leg veins in included studies'.
| Study | Potential levels of leg vein included |
| proximal to calf | |
| not specified | |
| proximal | |
| femoral and iliofemoral | |
| pelvic, iliofemoral, femoral | |
| popliteal or more proximal | |
| proximal | |
| not specified | |
| not specified | |
| calf up to iliac vein | |
| calf vein thrombosis only | |
| not specified | |
| popliteal or more proximal | |
| not specified | |
| proximal | |
| popliteal up to inferior vena cava | |
| popliteal or more proximal |
Inclusion criteria
Inclusion criteria have become more restrictive over time. In the earliest study by Kakkar 1969, there were only four contra‐indications: surgery within three days, an unhealed wound, peptic ulcer and hypertension. By the time of Schweizer 2000, a more comprehensive list of contra‐indications had been developed including: surgery or head trauma within the previous three months, malignancy, renal and hepatic dysfunction, and bleeding dysfunction, which in later studies reduces the proportion of eligible participants.
Interventions
Interventions included systemic, loco‐regional and CDT. Systemic and loco‐regional techniques differ only in the veins used to deliver an infusion: the arm or foot respectively. CDT is a more invasive procedure in which a catheter is inserted into the popliteal vein behind the knee using X‐ray control. The thrombolytic agent is infused through the catheter into the blood clot itself and the position of the catheter is altered according to the progress made in lysing the blood clot. The majority of trials assessed systemic thrombolysis, with streptokinase the most common agent used. The dose used varied: Schulman 1986 used a low‐dose regime of systemic streptokinase, Tsapogas 1973 used loco‐regional streptokinase and Elsharawy 2002 used catheter‐directed streptokinase with frequent radiological assessment, a technique used again in Enden 2011.
Goldhaber 1990, Turpie 1990 and Verhaeghe 1989 used systemic tPA. While doses of tPA varied, there was no obvious cut‐off for high or low doses. Goldhaber 1996 randomised two regimes of tPA, with and without heparin, compared to heparin alone. The two treatment arms were combined for the purposes of this review. Schweizer 1998 had two treatment arms, loco‐regional tPA and urokinase; and Schweizer 2000 had four treatment arms: systemic streptokinase, systemic urokinase, loco‐regional urokinase and loco‐regional tPA. Kiil 1981 used low‐dose systemic urokinase.
Co‐treatments
Monitoring regimes for heparinisation varied, and length of anticoagulation after the initial phase may be limited to a few months or continued for over a year. In some trials, especially the more recent ones, the use of compression bandages and elevation were reported; and for longer follow‐up, some participants were required to use compression stockings with rigorous ascertainment of compliance with the continued treatment.
Size
Nine studies had less than 50 participants (Arneson 1978; Elsharawy 2002; Goldhaber 1996; Kakkar 1969; Kiil 1981; Marder 1977; Schulman 1986; Tsapogas 1973; Verhaeghe 1989), and two studies had more than 100 participants (Enden 2011; Schweizer 2000). Most studies therefore lacked power to detect statistically significant effects. A power calculation was described in three studies (Elsharawy 2002; Enden 2011; Schweizer 2000). Schweizer 2000 was the largest trial with 250 participants.
Outcomes
One trial (Verhaeghe 1989), reported results for randomised participants together with non‐randomised participants. Some studies reported outcomes using scales which could not be combined (Marder 1977). Removal of the clot was reported using various categorisations. Both complete clot dissolution or lysis, indicating that the venous patency was 100% restored, and any degree of venographic improvement in patency were reported in this review in order to capture as much information as possible. Tsapogas 1973 reported partial or complete clearance (75% to 100%), a measure not used in any other study, and others reported partial clearance (50% to 100%). One study reported on Qol and cost comparisons (Enden 2011).
Length of follow‐up
All trials assessed outcomes in the period immediately after treatment. This was usually at one week, although the range was 36 hours to one month. We collectively grouped these as early outcomes. Intermediate outcomes have been classified as those determined after six months and under 5 years. No data were reported between this early and intermediate phase (i.e. after one month and before six months). Late outcomes were those reported 5 years or more after the intervention. PTS was assessed between one and six years. The longest follow‐up (six years) was in the Arneson 1978 study. For this update (2016), late data (five year follow‐up) from Enden 2011 has been included.
Excluded studies
Seven additional trials were excluded for this 2016 update (Bashir 2014; Cakir 2014; Engelberger 2015; Patra 2014; Santiago 2014; Sui 2013; Zhang 2014). Reasons for exclusion included not randomised (Bashir 2014; Santiago 2014), did not compare thrombolysis with anticoagulant (Cakir 2014; Engelberger 2015; Sui 2013; Zhang 2014), and onset of symptoms beyond 21 days (Patra 2014). Sixteen trials were previously excluded because they did not meet the inclusion criteria. Four trials (Browse 1968; Johansson 1979; Robertson 1967; Schweizer 1996) did not satisfy the criteria for randomisation. In other cases, studies did not include a comparison of thrombolysis versus anticoagulation, or DVT was not confirmed objectively (Bieger 1976; Marini 1991; Markevicius 2004; Pinto 1997; Silistreli 2004; Tibbutt 1974; Tibbutt 1977; Zimmermann 1986). In three cases insufficient information was obtained despite attempts to contact the authors (Ansell 1990; Persson 1977; Sas 1985). TORPEDO 2012 was excluded as only 33 out 90 participants received thrombolysis. See the Characteristics of excluded studies table for further information.
Ongoing Studies
Two new ongoing studies were identified (IRCT201108035625N3; NCT00970619). See Characteristics of ongoing studies for further details. We contacted the study investigators of these to ask if any data were available but we did not receive a response.
Risk of bias in included studies
The quality of reporting of the majority of trials was high, see Figure 2 and Figure 3. See the Characteristics of included studies table for detailed information. Minor protocol violations were reported in several studies, and losses to follow‐up were more common in the later phases.

Risk of bias graph: review authors' judgements about each risk of bias item presented as percentages across all included studies.
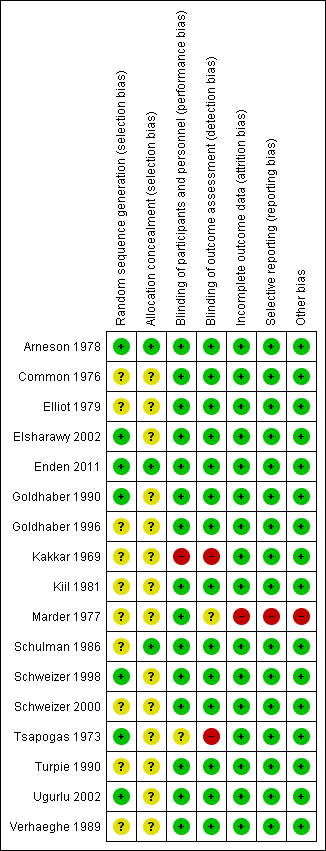
Risk of bias summary: review authors' judgements about each risk of bias item for each included study.
Allocation
Many studies reported random allocation from a random numbers table or computer generated sequence (Arneson 1978; Elsharawy 2002; Enden 2011; Goldhaber 1990; Schulman 1986; Schweizer 1998; Tsapogas 1973; Ugurlu 2002; Verhaeghe 1989), although sometimes this detail was lacking (Common 1976; Elliot 1979; Goldhaber 1996; Kiil 1981; Marder 1977; Schweizer 2000; Turpie 1990; Verhaeghe 1989). Many older studies did not give details on allocation concealment, and this remained a possible risk of bias (Common 1976; Elliot 1979; Elsharawy 2002; Kiil 1981; Marder 1977; Schweizer 1998; Schweizer 2000; Turpie 1990; Ugurlu 2002; Verhaeghe 1989). Studies with good allocation concealment also found significant effects. In some cases insufficient detail was reported on whether envelopes were sequentially numbered, sealed or opaque (Common 1976; Elliot 1979; Goldhaber 1996; Schulman 1986; Tsapogas 1973).
Blinding
With the exception of Tsapogas (Tsapogas 1973), all studies used blinding for the assessment of venograms. Turpie 1990 and Verhaeghe 1989 used identical placebo infusions and therefore were double blind. Where participants were not blinded to the treatment group (Arneson 1978; Common 1976; Elliot 1979; Elsharawy 2002; Enden 2011; Goldhaber 1990; Goldhaber 1996; Kakkar 1969; Marder 1977; Schweizer 1998; Schweizer 2000; Tsapogas 1973; Ugurlu 2002), an assessment was made that this introduced a low risk of bias where the assessor was blinded and using objective measures, which was the case in most studies (Arneson 1978; Common 1976; Elliot 1979; Elsharawy 2002; Enden 2011; Goldhaber 1990; Goldhaber 1996; Schulman 1986; Schweizer 1998; Schweizer 2000; Turpie 1990; Ugurlu 2002; Verhaeghe 1989). Blinding participants would be more difficult with more interventional approaches. However, this lack of blinding of participants may have introduced bias in the longer term as participants in receipt of thrombolysis may be more likely to have impressed upon them, or to heed advice given on, the importance of complying with co‐treatments such as compression stockings. For example, compliance was higher in the treatment group in Enden 2011. In Kakkar 1969 neither the participants nor outcome assessors were blinded, and this study was therefore judged to have a high risk of bias.
Incomplete outcome data
Most studies did not demonstrate any major differences in follow‐up between the treatment and control groups for the main outcomes, in the early or intermediate follow‐up periods. Marder 1977 was assessed as having high risk of bias for this category as it was not possible to separate the data from the three patients who were added non‐randomly after randomisation took place.
Selective reporting
In some cases subgroups were reported that did not include all trial participants, for example PTS in those with complete clot lysis, but these were not included in the review. As results including non‐randomised participants were reported in Marder 1977, this was judged as at high risk of bias. Duplicate reports of studies were identified in the selection process and multiple sources were searched, with no language restriction. A funnel plot was not used as there were less than 10 studies reporting on the most relevant outcomes measuring effect.
Other potential sources of bias
There were no other specific concerns about bias except for Marder 1977 who added three non‐randomised participants to the study post‐randomisation.
Effects of interventions
See: Summary of findings for the main comparison Treatment with any thrombolysis for acute deep vein thrombosis; Summary of findings 2 Treatment with catheter directed thrombolysis for acute deep venous thrombosis
Comparison 1. Any thrombolysis versus control
Seventeen studies were included for this comparison (Arneson 1978; Common 1976; Elliot 1979; Elsharawy 2002; Enden 2011; Goldhaber 1990; Goldhaber 1996; Kakkar 1969; Kiil 1981; Marder 1977; Schulman 1986; Schweizer 1998; Schweizer 2000; Tsapogas 1973; Turpie 1990; Ugurlu 2002; Verhaeghe 1989).
Outcome 1: any improvement in venous patency (early)
Nine trials reported on improvements in venous patency defined by a change in occlusion of the affected segment after treatment (Arneson 1978; Common 1976; Elsharawy 2002; Goldhaber 1990; Goldhaber 1996; Kakkar 1969; Kiil 1981; Turpie 1990; Ugurlu 2002). With all studies except Kiil 1981, improvement was more marked in the treatment group. Out of a total of 610 participants, improvement was significantly more likely in those receiving thrombolysis (RR 2.48; 95% CI 1.35 to 4.57, P = 0.004; Analysis 1.1). Statistical heterogeneity was noted in the results and a random‐effects model was used. The study by Marder 1977, which showed a difference in mean change from venograms, could not be included due to the reporting format used. A greater improvement was noted but for randomised participants this was not reported to be significantly different. Similarly the Verhaeghe 1989 data could not be included in the meta‐analysis.
Outcome 2: complete clot lysis (early)
Eight trials with 592 participants reported on the occurrence of complete clot lysis (Common 1976; Elliot 1979; Elsharawy 2002; Goldhaber 1990; Kakkar 1969; Schulman 1986; Schweizer 2000; Ugurlu 2002). In all trials this was more likely in the treatment group, although the extent of the effect varied and the results were statistically heterogeneous. A random‐effects model demonstrated a significant improvement (RR 4.91; 95% CI 1.66 to 14.53, P = 0.004; Analysis 1.2).
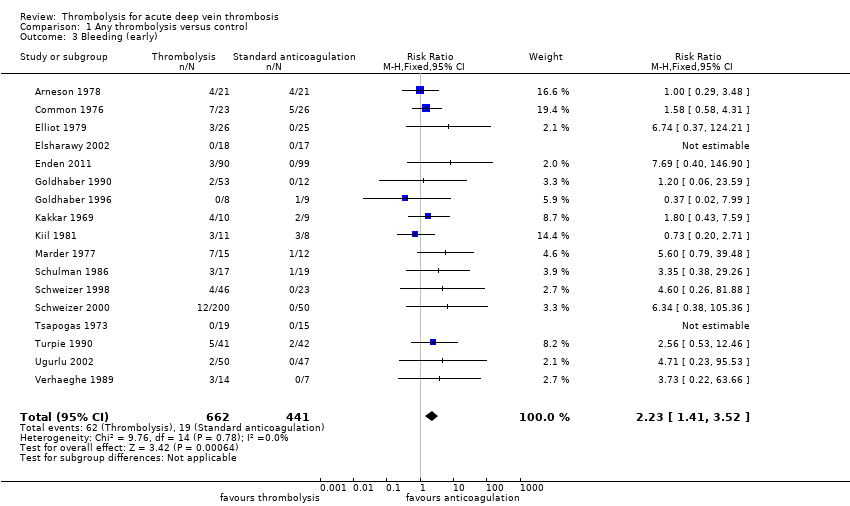
Outcome 3: bleeding (early)
This category excluded cerebral bleeding and minor bleeds, for example oozing from venepuncture sites and superficial haematomas. All 17 trials reported on the occurrence of bleeding episodes (Arneson 1978; Common 1976; Elliot 1979; Elsharawy 2002; Enden 2011; Goldhaber 1990; Goldhaber 1996; Kakkar 1969; Kiil 1981; Marder 1977; Schulman 1986; Schweizer 1998; Schweizer 2000; Tsapogas 1973; Turpie 1990; Ugurlu 2002; Verhaeghe 1989). While none of the studies individually showed a statistically significant increase in bleeding, participants receiving thrombolysis were significantly more likely than control participants to experience a bleeding complication. Nine per cent (62/662) of patients in the thrombolysis group experienced a bleeding complication compared to 4% (19/441) of patients in the standard anticoagulation group (RR 2.23; 95% CI 1.41 to 3.52, P = 0.0006; moderate quality evidence; Analysis 1.3), with a number needed to treat for an additional harmful outcome (NNTH) of 17.
Outcome 4: stroke or intracerebral haemorrhage (early)
Three trials reported the occurrence of stroke or intracerebral haemorrhage (Common 1976; Goldhaber 1990; Marder 1977). All trials described bleeding complications, therefore the absence of mention of any serious neurological complications or cerebral bleeds was taken to indicate that none were detected. Out of a total of 1103 participants three events occurred in the treatment group (a rate of 0.3%) and none in the control group. The pooled RR was 1.92 (95% CI 0.34 to 10.86) with wide uncertainty regarding the true effect (Analysis 1.4).
Outcome 5: mortality (early)
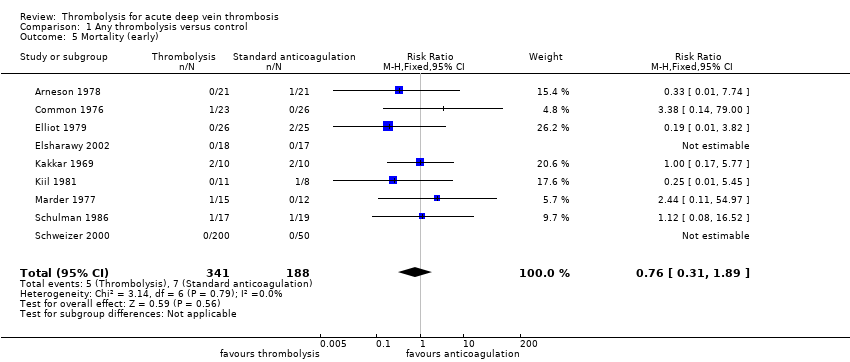
Nine trials reported deaths occurring up to one month after treatment (Arneson 1978; Common 1976; Elliot 1979; Elsharawy 2002; Kakkar 1969; Kiil 1981; Marder 1977; Schulman 1986; Schweizer 2000); two trials reported that no deaths occurred in this period (Elsharawy 2002; Schweizer 2000). A total of five events occurred in the treatment group and seven in the control group out of a total 529 participants. The pooled RR was 0.76 (95% CI 0.31 to 1.89; Analysis 1.5); however the wide CI indicated a large degree of uncertainty around the true effect and there were relatively few events.
Outcome 6: pulmonary embolus (PE) (early)
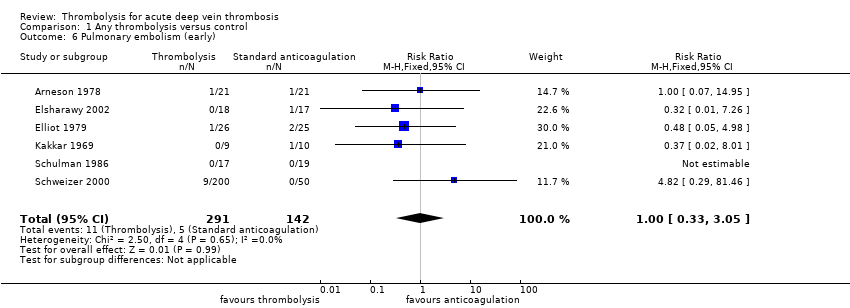
Six trials reported the occurrence of a PE in the early phase (Arneson 1978; Elliot 1979; Elsharawy 2002; Kakkar 1969; Schulman 1986; Schweizer 2000). One study noted the absence of any PE (Schulman 1986). The diagnostic criteria used were variable. With the exception of participants who died from PE (one in the treatment group, two in the control group), transient clinical symptoms often occurred but with no objective diagnostic confirmation described. Where deaths were attributed to PE, postmortem examinations were not mentioned. For this reason, the results should be interpreted with caution. The RR was 1.00 (95% CI 0.33 to 3.05; Analysis 1.6).
Outcome 7: post‐thrombotic syndrome (PTS) (intermediate and late)
Three studies reported clinically assessed PTS at six months to 5 years (intermediate) (Elliot 1979; Enden 2011; Schweizer 1998), excluding ulceration, in a format that could be combined, with a total of 306 participants. Significantly less PTS occurred in those participants receiving thrombolysis (45% incidence with RR 0.66, 95% CI 0.53 to 0.81; P < 0.0001; moderate quality evidence; Analysis 1.7), with a number needed to treat for an additional beneficial outcome (NNTB) of five. In the control group the incidence was 96/146 (66%, ranging from 35% to 96% in different trials, which may reflect definitions and adjunctive treatments).
Two studies with 211 participants (Arneson 1978; Enden 2011), reported clinically assessed PTS at over five years (late); (RR 0.58, 95% CI 0.45 to 0.77; P < 0.0001; moderate quality evidence; Analysis 1.8). In the control group the incidence was 72/107 and in the thrombolysis group 41/104. The NNTB at late follow‐up was four.
Outcome 8: leg ulceration (intermediate and late)
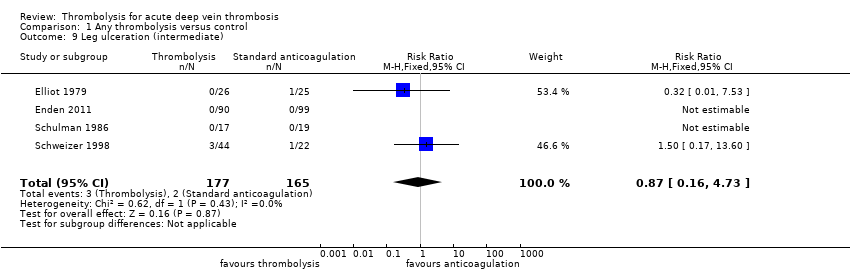
Four studies described ulceration of the leg occurring more than six months from trial entry (Elliot 1979; Enden 2011; Schulman 1986; Schweizer 1998). Three events occurred in the treatment group and two in the control group out of 342 participants, giving a RR 0.87 (95% CI 0.16 to 4.73; Analysis 1.9).This was not statistically significant (P = 0.87).
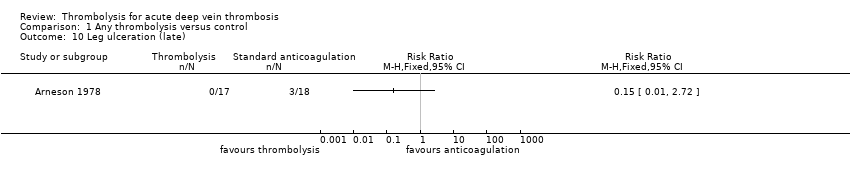
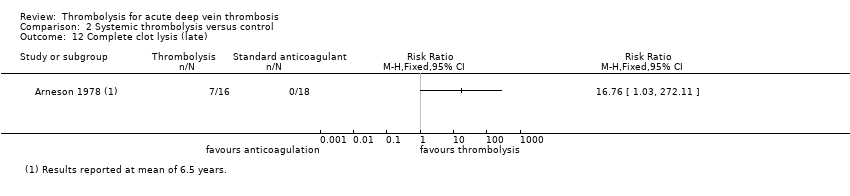
Arneson 1978 reported at a mean of 6.5 years and so fell within the definition of late ulceration. Events were more likely with late follow‐up, with 3/18 control participants experiencing ulceration after six years compared to 0/17 in the thrombolysis participants (RR 0.15, 95% CI 0.01 to 2.72; P = 0.20; Analysis 1.10).
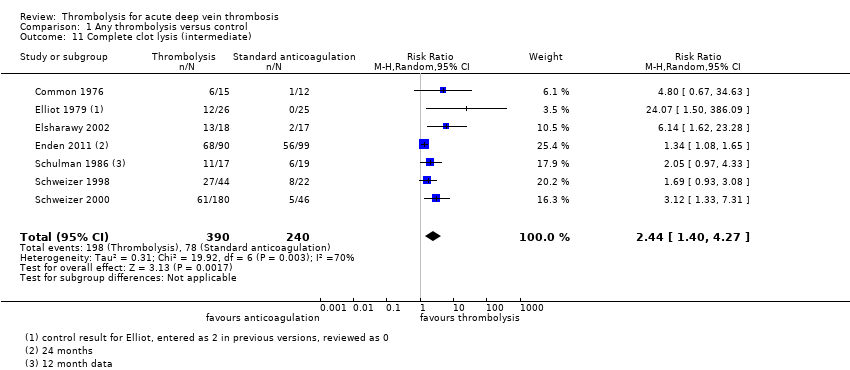
Outcome 9: complete clot lysis (intermediate and late)
Seven trials with a total of 630 participants reported clot lysis after six months and in all cases this was more likely in the groups treated with thrombolysis (Common 1976; Elliot 1979; Elsharawy 2002; Enden 2011; Schulman 1986; Schweizer 1998; Schweizer 2000). This was statistically significant with a RR of 2.44; 95% CI 1.40 to 4.27; P = 0.002 using a random‐effects model (moderate quality evidence; Analysis 1.11).
Two trials with a total of 206 participants reported clot lysis at five years and over (Arneson 1978; Enden 2011). Clot lysis was not significantly more likely with thrombolysis at this time point (RR 3.25, 95% CI 0.17 to 62.63; Analysis 1.12).
Outcome 10: mortality (intermediate and late)
Two trials with a total of 289 participants reported mortality occurring up to five years after treatment (Elliot 1979; Schweizer 2000). Elliot 1979 reported 4 deaths in each group. Most deaths were unrelated to the clot or treatment but rather to underlying conditions. The RR was 0.96 (95% CI 0.27 to 3.43; Analysis 1.13), however there was wide uncertainty around the true effect.
Two trials with a total of 230 participants reported mortality after five years follow‐up (Arneson 1978; Enden 2011). Seven deaths occurred in the thrombolysis group and 12 in the control group with a RR of 0.61 (95% CI 0.25 to 1.50; Analysis 1.14); again with no significant difference detected.
Outcome 11: normal venous function (intermediate)
Three trials reported on presence of normal venous function (Elsharawy 2002; Enden 2011; Schulman 1986). The RR was 2.18 (95% CI 0.86 to 5.54; Analysis 1.15) using a random‐effects model.
Outcome 12: recurrent venous thromboembolism (DVT/VTE, intermediate and late)
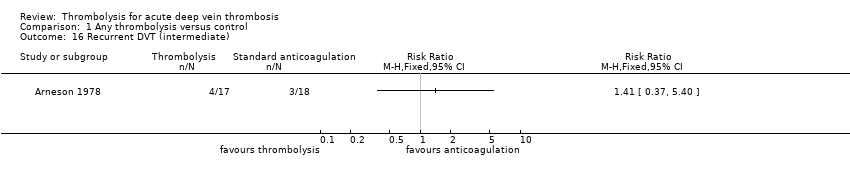
One trial reported on recurrent DVT (Arneson 1978). Four events occurred in the treatment group compared to three in the control group. The RR was 1.41 (95% CI 0.37 to 5.40); the numbers were too small to draw any firm conclusion. At five year follow‐up Enden 2011 showed a non‐significant reduction in recurrent VTE (RR 0.63, 95% CI 0.34 to 1.18; Analysis 4.14).
Outcome 13: quality of life
Only Enden 2011 has reported on this outcome (Enden 2013a; Haig 2016). As this was a study using CDT, we have reported the details within comparison four.
Outcome 14: cost comparisons
Only Enden 2011 has reported on this outcome (Enden 2013b). As this was a study using CDT, we have reported the details within comparison four.
We carried out sensitivity analyses for all outcomes where the meta‐analysis included trials judged to have any domain at high risk of bias (Kakkar 1969; Marder 1977; Tsapogas 1973). To determine if results were robust, analyses were repeated excluding these studies. Forest plots and summary figures were visually assessed and for all outcomes the results remained consistent.
Comparison 2. Systemic thrombolysis versus control
Fifteen trials compared systemic thrombolysis to control (Arneson 1978; Common 1976; Elliot 1979; Goldhaber 1990; Goldhaber 1996; Kakkar 1969; Kiil 1981; Marder 1977; Schulman 1986; Schweizer 1998; Schweizer 2000; Tsapogas 1973; Turpie 1990; Ugurlu 2002; Verhaeghe 1989).
Outcome 1: any improvement in venous patency (early)
Eight trials reported on this outcome and a significant improvement in patency was demonstrated (Arneson 1978; Common 1976; Goldhaber 1990; Goldhaber 1996; Kakkar 1969; Kiil 1981; Turpie 1990; Ugurlu 2002). The RR was 2.18 (95% CI 1.28 to 3.70, P = 0.004; Analysis 2.1) using a random‐effects model.
Outcome 2: complete clot lysis (early)
Seven trials reported a significant improvement in clot lysis (Common 1976; Elliot 1979; Goldhaber 1990; Kakkar 1969; Schulman 1986; Schweizer 2000; Ugurlu 2002), with a RR of 4.37 (95% CI 1.4 to 13.61, P = 0.01; Analysis 2.2) using a random‐effects model.
Outcome 3: bleeding (early)
Fifteen trials reported on the occurrence of bleeding episodes (Arneson 1978; Common 1976; Elliot 1979; Goldhaber 1990; Goldhaber 1996; Kakkar 1969; Kiil 1981; Marder 1977; Schulman 1986; Schweizer 1998; Schweizer 2000; Tsapogas 1973; Turpie 1990; Ugurlu 2002; Verhaeghe 1989). Bleeding complications were twice as likely in the thrombolysis group with a RR of 2.18 (95% CI 1.37 to 3.47, P = 0.001; Analysis 2.3).
Outcome 4: stroke or intracerebral haemorrhage (early)
Three trials reported the occurrence of stroke or intracerebral haemorrhage (Common 1976; Goldhaber 1990; Marder 1977). There were three events in the treatment group but this was not statistically significant (RR 1.92, 95% CI 0.34 to 10.86, P = 0.46; Analysis 2.4). All trials described bleeding complications, therefore the absence of mention of any serious neurological complications or cerebral bleeds was taken to indicate that none were detected.
Outcome 5: mortality (early)
Eight trials reported deaths occurring up to one month after treatment (Arneson 1978; Common 1976; Elliot 1979; Kakkar 1969; Kiil 1981; Marder 1977; Schulman 1986; Schweizer 2000); one trial reported that no deaths occurred in this period (Schweizer 2000). A total of five events occurred in the treatment group and seven in the control group, out of a total of 394 participants. There were relatively few events and this result was not statistically significant (RR 0.76; 95% CI 0.31 to 1.89, P = 0.56; Analysis 2.5).
Outcome 6: pulmonary embolus (PE) (early)
Five trials reported occurrence of a PE in the early phase (Arneson 1978; Elliot 1979; Kakkar 1969; Schulman 1986; Schweizer 2000). There was an increase, affected by nine events in the Schweizer 2000 trial, but this was not statistically significant (RR 1.73; 95% CI 0.55 to 5.40, P = 0.35; Analysis 2.6).
Outcome 7: post‐thrombotic syndrome (PTS, intermediate and late)
Two studies with 117 participants reported this outcome from six months to under five years from treatment (Elliot 1979; Schweizer 1998) with a reduction of almost 50% in the treatment group (RR 0.56, 95% CI 0.30 to 1.03; Analysis 2.7).
Arneson 1978 reported at a late time point also with a reduction of about 50% in the treatment group (RR 0.47, 95% CI 0.18 to 1.25; Analysis 2.8), but with a wide uncertainty around the true effect. Only 35 participants were included in this study.
Outcome 8: leg ulceration (intermediate and late)
Three studies with a total of 153 participants described ulceration of the leg occurring more than six months from trial entry (Elliot 1979; Schulman 1986; Schweizer 1998).There were similar events between the two groups but the number of events was small (RR 0.87, 95% CI 0.16 to 4.73; P = 0.87; Analysis 2.9). Arneson 1978 described ulceration after five years with the three events all in the control group (RR 0.15, 95% CI 0.01 to 2.72; P = 0.2; Analysis 2.10). Numbers are too small to draw conclusions.
Outcome 9: complete clot lysis (intermediate and late)
Five trials with a total of 300 participants reported effects on clot lysis six months from treatment (Common 1976; Elliot 1979; Schulman 1986; Schweizer 1998; Schweizer 2000). Complete lysis was nearly two and a half times as likely in the treatment group (RR 2.59, 95% CI 1.27 to 5.28; using a random‐effects model P = 0.009; Analysis 2.11).
Only Arneson 1978 reported late data and all patients with complete clot lysis were within the treatment group (RR 3.25, 95% CI 0.17 to 62.63; P = 0.05; Analysis 2.12). At this time point numbers are too small to draw conclusions.
Outcome 10: mortality (intermediate and late)
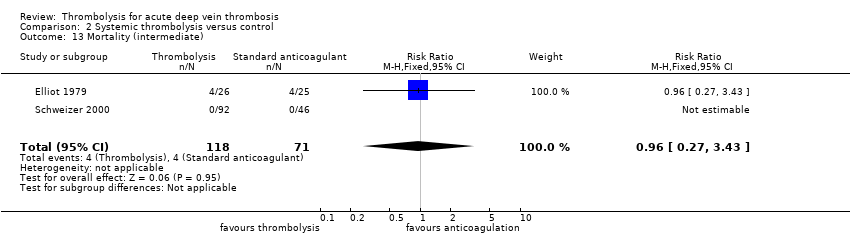
Two studies with a total of 189 participants reported on this outcome at six months follow‐up (Elliot 1979; Schweizer 2000). Only Arneson 1978 (n = 42) reported mortality after five years. There was no significant difference between the two groups (RR 0.96, 95% CI 0.27 to 3.43; Analysis 2.13) at intermediate or late follow‐up (RR 1.33, 95% CI 0.34 to 5.24; Analysis 2.14).
Outcome 11: normal venous function (intermediate)
This was only reported by Schulman 1986 (RR 1.04; 95% CI 0.59 to 1.83; Analysis 2.15).
Outcome 12: recurrent DVT (intermediate and late)
This was only reported by Arneson 1978 at late follow‐up (RR 1.41; 95% CI 0.37 to 4.40; Analysis 2.16).
As for Comparison 1, we carried out sensitivity analyses for all outcomes where the meta‐analysis included trials judged to have any domain at high risk of bias (Kakkar 1969; Marder 1977; Tsapogas 1973). To determine if the results were robust, analyses were repeated excluding these studies. Forest plots and summary figures were visually assessed and for all outcomes the results remained consistent.
Comparison 3. Loco‐regional thrombolysis versus control
Two trials compared loco‐regional thrombolysis to control (Schweizer 1998; Schweizer 2000).
Outcome 1: complete clot lysis (early)
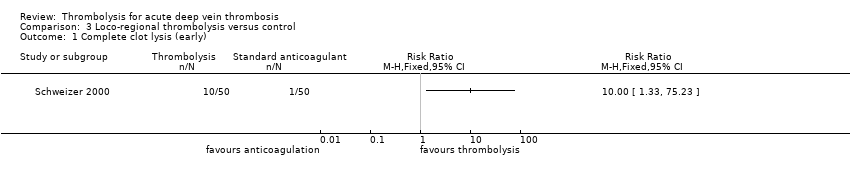
This was reported by Schweizer 2000, who reported a marked effect (RR 10; 95% CI 1.33 to 75.23).
Outcome 2: bleeding (early)
Both Schweizer 1998 and Schweizer 2000 reported on this outcome. Based on three events, bleeding was more likely in the treatment group (RR 4.0; 95% CI 0.46 to 34.75, P = 0.21).
Outcome 3: stroke or intracerebral haemorrhage (early)
No events occurred in either the Schweizer 1998 or Schweizer 2000 trials.
Outcome 4: mortality (early)
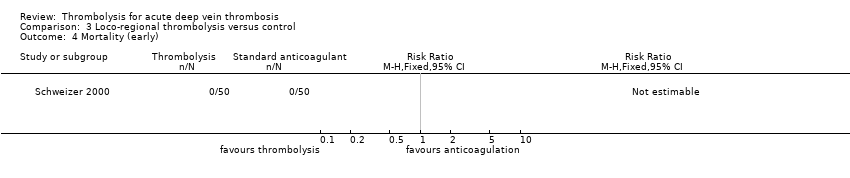
No events occurred in the Schweizer 2000 trial and Schweizer 1998 did not report on this outcome.
Outcome 5: pulmonary embolus (PE) (early)
No events occurred in the Schweizer 2000 trial and Schweizer 1998 did not report on this outcome.
Outcome 6: post‐thrombotic syndrome (PTS) (intermediate)
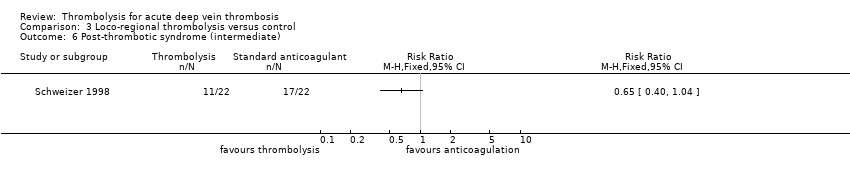
This was reported by Schweizer 1998 only. A total of 11 participants in the treatment group and 17 in the control group, out of a total of 44 participants, were reported to have PTS (RR 0.65; 95% CI 0.40 to 1.04).
Outcome 7: leg ulceration (intermediate)
This was reported by Schweizer 1998 only. One participant in each group developed leg ulcers (RR 1.00; 95% CI 0.07 to 15.00).
Outcome 8: complete clot lysis (intermediate)
Both trials (Schweizer 1998; Schweizer 2000) demonstrated significant improvement (RR 2.25; 95% CI 1.33 to 3.80, P = 0.002).
Outcome 9: mortality (intermediate)
Only Schweizer 2000 reported on this outcome. No events occurred.
Comparison 4. Catheter‐directed thrombolysis versus control
Two trials compared CDT to control (Elsharawy 2002; Enden 2011).
Outcome 1: any improvement in venous patency (early)
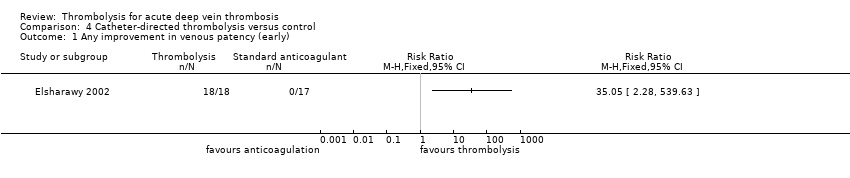
This was reported only by Elsharawy 2002, with significant improvement in venous patency (RR 35.05; 95% CI 2.28 to 539.63; P = 0.01; Analysis 4.1).
Outcome 2: complete clot lysis (early)
This was reported only by Elsharawy 2002, with significant improvement (RR 21.79; 95% CI 1.38 to 343; P = 0.03; Analysis 4.2).
Outcome 3: bleeding (early)
Both Enden 2011 and Elsharawy 2002 reported on this with a total of 224 participants. Based on three events in the treatment group (3%) and none in the control group, the RR was 7.69 (95% CI 0.4 to 146.9; Analysis 4.3).
Outcome 4: stroke or intracerebral haemorrhage (early)
There were no events recorded by Elsharawy 2002 or Enden 2011. Both trials described bleeding complications, therefore the absence of mention of any serious neurological complications or cerebral bleeds was taken to indicate that none were detected.
Outcome 5: mortality (early)
There were no events recorded by Elsharawy 2002 and Enden 2011 did not report events at this time point.
Outcome 6: pulmonary embolus (PE) (early)
There was one event in the control group (RR 0.32; 95% CI 0.01 to 7.26) from a total of 35 participants (Elsharawy 2002). Enden 2011 did not measure this outcome at this time point.
Outcome 7: post‐thrombotic syndrome (PTS) (intermediate and late)
Elsharawy 2002 did not report on this outcome. The RR of PTS at six months was reported by Enden 2011 to be 0.93 (95% CI 0.61 to 1.42). At 24 months the number of events in both the treatment and control groups had risen from 27 to 37 and 32 to 55 respectively; the RR was 0.74 (95% CI 0.55 to 1.00; P = 0.05; Analysis 4.7), close to being statistically significant. At five year late follow‐up Enden 2011 reported that the number of events in the treatment group remained at 37 and those in the control group had risen to 63. The RR was 0.6 (95% CI 0.45 to 0.79; P = 0.0003; Analysis 4.8).
Outcome 8: leg ulceration (intermediate)
There were no events reported by Enden 2011 and Elsharawy 2002 did not report on this outcome.
Outcome 9: complete clot lysis (intermediate and late)
Both Enden 2011 and Elsharawy 2002 reported on complete clot lysis at the intermediate time point, with a total of 224 participants. Complete clot lysis was more likely in the treatment group although the difference was not statistically significant using a random‐effects model (RR 2.52, 95% CI 0.52 to 12.17, P = 0.25; moderate quality evidence; Analysis 4.10). By late follow‐up Enden 2011 reported similar numbers of complete lysis (68/86 and 61/86 in treatment and control respectively; RR 1.11, 95% CI 0.94 to 1.33; Analysis 4.11).
Outcome 10: mortality (intermediate and late)
Elsharawy 2002 did not report on mortality and Enden 2011 reported mortality after five years follow‐up. Three deaths occurred in the CDT group (3/90), compared to nine in the control group (9/98; RR 0.36, 95% CI 0.10 to 1.30; Analysis 4.15).
Outcome 11: normal venous function (intermediate)
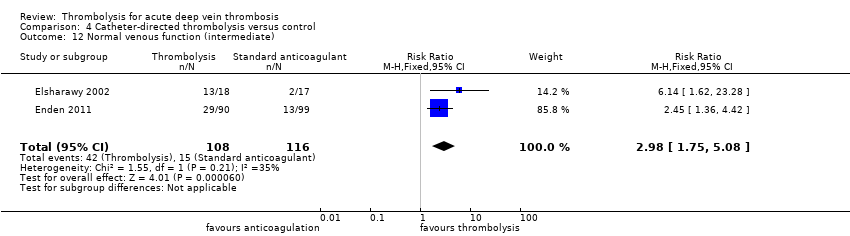
This was reported by Elsharawy 2002 and Enden 2011 and pooling of results showed a significant improvement with treatment (RR 2.98, 95% CI 1.75 to 5.08) (Analysis 4.12).
Outcome 12: recurrent venous thromboembolism (VTE) (intermediate and late)
While DVT was not reported separately, intermediate recurrent VTE was reported by Enden 2011 (RR 0.61; 95% CI 0.30 to 1.25; Analysis 4.13). At five year follow‐up Enden 2011 reported that 34 patients had recurrent thrombosis. Thirteen events were in the ipsilateral leg, 10 in the contralateral leg, nine were PE and two were unknown (RR 0.63, 95% CI 0.34 to 1.18; Analysis 4.14). Six patients with chronic iliac vein occlusions (one in the CDT group and five in the control group), were referred and had endovascular recanalsation with stenting. Although randomised to the treatment group, the CDT patient had not received CDT as planned due to technical failure (Haig 2016).
Outcome 13: quality of life
Enden 2011 was the only study to report on this outcome, using generic QoL measures (VEINES‐QOL) and symptom specific (VEINES‐Sym) scales. After 24 months there were no differences in QoL between the additional CDT and standard treatment arms; mean difference for the EQ‐5D index was 0.04 (95% CI −0.10 to 0.17), for the VEINES‐QOL score 0.2 (95% CI −2.8 to 3.0) and for the VEINES‐Sym score 0.5 (95% CI −2.4 to 3.4; P value > 0.37). After 5 years Enden 2011 reported no difference in mean generic QoL scores, disease specific QoL scores, or symptom severity score between the groups (see Enden 2012; Enden 2013a).
Independent of treatment arms, after 24 months patients with PTS had poorer outcomes than patients without PTS; mean difference for EQ‐5D was 0.09 (95% CI 0.03 to 0.15), for VEINES‐QOL score 8.6 (95% CI 5.9 to 11.2) and for VEINES‐Sym score 9.8 (95% CI 7.3 to 12.3; P value < 0.001). After five years the EQ‐5D, VEINES‐QOL and VEINES‐Sym scores for patients with PTS were lower than for those without PTS (Enden 2012; Enden 2013a).
Outcome 14: cost comparisons
Cost comparisons were only reported by Enden 2011. Additional CDT accumulated 32.31 quality‐adjusted life years (QALYs) compared with 31.68 QALYs after standard treatment. The lifetime cost of CDT was USD 64,709 compared to USD 51,866 with standard treatment. The incremental cost effectiveness ratio was USD 20,429/QALY gained, and the study authors concluded that the probability that CDT was cost effective was 82% at a willingness to pay threshold of USD 50,000/QALY gained (Enden 2013b). CDT may have additional costs compared to systemic administration.
Discussion
Summary of main results
The rationale for the use of thrombolysis for DVT is to prevent long‐term complications related to poor venus function including PTS and ulceration. For this update it is encouraging that further data on intermediate to longer‐term outcomes are available to assess these complications. Sixty‐six per cent of control participants at intermediate time points and sixty‐seven per cent at late follow‐up experienced PTS, which is in line with other estimates. Pooling all types of thrombolysis, the results showed a reduction in the risk of PTS with use of thrombolysis by 34% at the intermediate time point (RR 0.66; NNTB 5) and a reduction in the risk of PTS of 42% at late follow‐up (RR 0.58; NNTB 4). There was no difference in ulceration beyond six months; data were limited by small numbers and the short length of follow‐up, as ulcers are more likely to occur later than a year or two after the DVT.
CDT has been studied at the femoral and iliofemoral levels only, where the risk of post‐thrombotic complications is highest. Comparison four shows the results for the two recent trials which studied this method, which are comparable to the results for all routes of thrombolysis combined.
There were not enough data in this review to make any definitive comparison between the different agents or routes of administration for thrombolysis. Streptokinase appears to have been most widely studied. Significant results were obtained by combining studies including participants with DVT at a variety of levels of the leg veins affected, while it is accepted that the likelihood of later complications is less with clots at lower levels (Table 1).
The most marked effects with thrombolysis were seen in improvement in vein patency and complete clot lysis measured by venography, where both early and intermediate results showed important differences between the control and treatment groups. The use of objective classification of the degree of lysis would assist, in the future, with quantifying this outcome and the patency of the veins. There were not enough data to comment further on venous function or recurrent DVT per se. Results relating to PE were inconclusive due to uncertainty surrounding diagnosis.
The risk of inducing unwanted bleeding with thrombolytics has been the most important factor limiting its use for patients with DVT. Most bleeding episodes and deaths occurred in the earlier studies. Bleeding episodes (excluding stroke) causing interruption of therapy, interventions such as transfusion, or chronic sequelae (a condition following as a consequence of a disease) occurred more often with thrombolysis than with standard anticoagulation (RR 2.23; NNTH 17). There is no strong evidence that one particular route of administration or agent was excessively hazardous in this respect, although it is notable that no bleeding occurred in the Elsharawy 2002 study. This may have been due to strict exclusion criteria and the close radiological monitoring and dose titration depending upon clot lysis. A high proportion of patients with DVT are, however, unsuitable for thrombolytic treatment because of extensive contra‐indications.
Three intracerebral bleeds occurred in these trials (Common 1976; Goldhaber 1990; Marder 1977). Adoption of current contra‐indications may have prevented these events in more recent trials. A stroke occurred in a participant with polycythaemia rubra vera who received streptokinase (Common 1976), an intracranial bleed in a participant with controlled hypertension treated with tPA(Goldhaber 1990), and a fatal intracranial haemorrhage in a patient with a remote history of cerebrovascular accident (Marder 1977). Two of the early deaths in the treatment groups may also have been prevented with the use of current contra‐indications to thrombolysis: a participant with metastatic carcinoma (Common 1976), and a participant with recent surgery (Kakkar 1969). Other deaths were incidental to the treatment or related to underlying conditions.
The data on intermediate mortality were inconclusive. One trial (Schweizer 2000) reported the absence of further PE episodes at one year, however no other trials reported on this outcome. Other adverse effects, for example allergic or anaphylactic reactions, were not examined in this review.
No comparisons between thrombolysis and subcutaneous low molecular weight heparin, administered at home, for DVT were identified.
One study Enden 2011 examined both QoL and cost effectiveness. For QoL there was no significant difference between CDT and standard treatment although PTS was associated with a lower QoL. The incremental cost effectiveness ratio was USD 20,429 per QALY gained (Enden 2013b). This incremental cost effectiveness ratio for CDT is within the range for approval by bodies making recommendation for implementation (Dakin 2014; NICE PMG9).
Overall completeness and applicability of evidence
The evidence presented is highly relevant to determining the effect of thrombolysis for DVT. The effectiveness of newer catheter‐directed methods appears to be similar to systemic administration. Evidence suggests effectiveness at levels not limited to iliofemoral. As there is a degree of consistency in the results of trials over time, and in different settings, it is likely that the findings have external validity. Further evidence is desirable to confirm the effect of newer methods, and the factors predicting more successful outcomes. In future a combination of invasive procedures to remove the clot, with or without thrombolysis, may increase the proportion of patients who have effective clot removal; but that was out of the scope of this review. With respect to standard treatment with anticoagulation, selected patients may benefit from additional thrombolysis directed by catheter, or systemic if this were considered safe. This is in keeping with the current 'Recommendations and link to evidence' from NICE guidelines (NICE guidelines CG144). There are implications for inpatient treatment, where anticoagulation for DVT is now delivered in outpatient settings, and for the resourcing of more invasive procedures.
Quality of the evidence
This evidence is based on 17 trials involving 1103 participants from a range of countries and settings. The key limitation of the studies is the paucity of long‐term follow‐up data greater than one year. The methodological quality of the studies was mostly high, and the results were consistent across a range of settings and patient groups. Using GRADE assessment, the body of evidence relating to complete clot lysis (intermediate), bleeding (early) and PTS (intermediate and late) was judged to be of moderate quality due to many trials having low numbers of participants (See summary of findings Table for the main comparison; summary of findings Table 2). There were obvious differences between the inclusion criteria and the conduct of studies completed over 40 years ago compared to more recent studies. However, the results across studies were consistent and we have reasonable confidence in the results.
Potential biases in the review process
It is likely that all relevant studies were identified and included. Relevant data were requested or obtained from study authors, although for older studies this was less likely to be successful. Efforts were made to reduce bias in the review process by ensuring double independent data extraction and quality assessment of studies.
Agreements and disagreements with other studies or reviews
The evidence presented here is consistent with findings of other reviews, which have included a broader range of evidence than RCTs. A review of the literature by Patterson 2010 concluded that in carefully selected patients CDT offered benefits in treatment, although further trial evidence was needed. Vedantham 2010 indicated benefits in CDT for people with extensive acute iliofemoral DVT, low expected bleeding risk and good functional status, although Comerota 2008 also emphasised a need for further research. A meta‐analysis by Du 2015 included both randomised and non‐randomised studies and had similar findings. Systemic thrombolysis is not current practice although this review suggests that it has similar effectiveness to CDT.
Risk of bias graph: review authors' judgements about each risk of bias item presented as percentages across all included studies.
Risk of bias summary: review authors' judgements about each risk of bias item for each included study.

Comparison 1 Any thrombolysis versus control, Outcome 1 Any improvement in venous patency (early).

Comparison 1 Any thrombolysis versus control, Outcome 2 Complete clot lysis (early).
Comparison 1 Any thrombolysis versus control, Outcome 3 Bleeding (early).

Comparison 1 Any thrombolysis versus control, Outcome 4 Stroke/intracerebral haemorrhage (early).
Comparison 1 Any thrombolysis versus control, Outcome 5 Mortality (early).
Comparison 1 Any thrombolysis versus control, Outcome 6 Pulmonary embolism (early).

Comparison 1 Any thrombolysis versus control, Outcome 7 Post‐thrombotic syndrome (intermediate).

Comparison 1 Any thrombolysis versus control, Outcome 8 Post‐thrombotic syndrome (late).
Comparison 1 Any thrombolysis versus control, Outcome 9 Leg ulceration (intermediate).
Comparison 1 Any thrombolysis versus control, Outcome 10 Leg ulceration (late).
Comparison 1 Any thrombolysis versus control, Outcome 11 Complete clot lysis (intermediate).

Comparison 1 Any thrombolysis versus control, Outcome 12 Complete clot lysis (late).

Comparison 1 Any thrombolysis versus control, Outcome 13 Mortality (intermediate).

Comparison 1 Any thrombolysis versus control, Outcome 14 Mortality (late).

Comparison 1 Any thrombolysis versus control, Outcome 15 Normal venous function (intermediate).
Comparison 1 Any thrombolysis versus control, Outcome 16 Recurrent DVT (intermediate).
Comparison 2 Systemic thrombolysis versus control, Outcome 1 Any improvement in venous patency (early).

Comparison 2 Systemic thrombolysis versus control, Outcome 2 Complete clot lysis (early).

Comparison 2 Systemic thrombolysis versus control, Outcome 3 Bleeding (early).

Comparison 2 Systemic thrombolysis versus control, Outcome 4 Stroke/intracerebral haemorrhage (early).
Comparison 2 Systemic thrombolysis versus control, Outcome 5 Mortality (early).

Comparison 2 Systemic thrombolysis versus control, Outcome 6 Pulmonary embolism (early).

Comparison 2 Systemic thrombolysis versus control, Outcome 7 Post‐thrombotic syndrome (intermediate).

Comparison 2 Systemic thrombolysis versus control, Outcome 8 Post‐thrombotic syndrome (late).

Comparison 2 Systemic thrombolysis versus control, Outcome 9 Leg ulceration (intermediate).
Comparison 2 Systemic thrombolysis versus control, Outcome 10 Leg ulceration (late).
Comparison 2 Systemic thrombolysis versus control, Outcome 11 Complete clot lysis (intermediate).
Comparison 2 Systemic thrombolysis versus control, Outcome 12 Complete clot lysis (late).
Comparison 2 Systemic thrombolysis versus control, Outcome 13 Mortality (intermediate).

Comparison 2 Systemic thrombolysis versus control, Outcome 14 Mortality (late).

Comparison 2 Systemic thrombolysis versus control, Outcome 15 Normal venous function (intermediate).

Comparison 2 Systemic thrombolysis versus control, Outcome 16 Recurrent DVT (late).
Comparison 3 Loco‐regional thrombolysis versus control, Outcome 1 Complete clot lysis (early).

Comparison 3 Loco‐regional thrombolysis versus control, Outcome 2 Bleeding (early).

Comparison 3 Loco‐regional thrombolysis versus control, Outcome 3 Stroke/intracerebral haemorrhage (early).
Comparison 3 Loco‐regional thrombolysis versus control, Outcome 4 Mortality (early).

Comparison 3 Loco‐regional thrombolysis versus control, Outcome 5 Pulmonary embolism (early).
Comparison 3 Loco‐regional thrombolysis versus control, Outcome 6 Post‐thrombotic syndrome (intermediate).

Comparison 3 Loco‐regional thrombolysis versus control, Outcome 7 Leg ulceration (intermediate).

Comparison 3 Loco‐regional thrombolysis versus control, Outcome 8 Complete clot lysis (intermediate).

Comparison 3 Loco‐regional thrombolysis versus control, Outcome 9 Mortality (intermediate).
Comparison 4 Catheter‐directed thrombolysis versus control, Outcome 1 Any improvement in venous patency (early).

Comparison 4 Catheter‐directed thrombolysis versus control, Outcome 2 Complete clot lysis (early).

Comparison 4 Catheter‐directed thrombolysis versus control, Outcome 3 Bleeding (early).

Comparison 4 Catheter‐directed thrombolysis versus control, Outcome 4 Stroke/intracerebral haemorrhage (early).

Comparison 4 Catheter‐directed thrombolysis versus control, Outcome 5 Mortality (early).

Comparison 4 Catheter‐directed thrombolysis versus control, Outcome 6 Pulmonary embolism (early).

Comparison 4 Catheter‐directed thrombolysis versus control, Outcome 7 Post‐thrombotic syndrome (intermediate).

Comparison 4 Catheter‐directed thrombolysis versus control, Outcome 8 Post‐thrombotic syndrome (late).

Comparison 4 Catheter‐directed thrombolysis versus control, Outcome 9 Leg ulceration (intermediate).

Comparison 4 Catheter‐directed thrombolysis versus control, Outcome 10 Complete clot lysis (intermediate).

Comparison 4 Catheter‐directed thrombolysis versus control, Outcome 11 Complete clot lysis (late).
Comparison 4 Catheter‐directed thrombolysis versus control, Outcome 12 Normal venous function (intermediate).

Comparison 4 Catheter‐directed thrombolysis versus control, Outcome 13 Recurrent VTE (intermediate).

Comparison 4 Catheter‐directed thrombolysis versus control, Outcome 14 Recurrent VTE (late).

Comparison 4 Catheter‐directed thrombolysis versus control, Outcome 15 Mortality (late).
| Treatment with any thrombolysis for acute DVT | ||||||
| Patient or population: patients diagnosed with acute DVT | ||||||
| Outcomes | Anticipated absolute effects* (95% CI) | Relative effect | № of participants | Quality of the evidence | Comments | |
| Risk with control | Risk with any thrombolysis | |||||
| Complete clot lysis (intermediate, 6 months to under 5 years after treatment) | Study population | RR 2.44 (1.4 to 4.27) | 630 | ⊕⊕⊕⊝ | 78 (of 240) patients treated with standard anticoagulation had complete clot lysis compared to 198 (of 390) in the thrombolysis group | |
| 325 per 1000 | 793 per 1000 (455 to 1000) | |||||
| Bleeding (early, up to 1 month after treatment) | Study population | RR 2.23 | 1103 | ⊕⊕⊕⊝ | Although 17 studies reported on bleeding, these were small studies | |
| 43 per 1000 | 96 per 1000 (61 to 152) | |||||
| Post‐thrombotic syndrome (intermediate, 6 months to under 5 years after treatment) | Study population | RR 0.66 | 306 | ⊕⊕⊕⊝ | 96 (of 146) patients treated with standard anticoagulation developed PTS compared to 72 (of 160) treated with thrombolysis | |
| 658 per 1000 | 434 per 1000 (348 to 533) | |||||
| Post‐thrombotic syndrome (late, 5 year follow‐up after treatment) | Study population | RR 0.58 | 211 | ⊕⊕⊕⊝ | 72 (of 107) patients treated with standard anticoagulation developed PTS compared to 41 (of 104) treated with thrombolysis | |
| 673 per 1000 | 390 per 1000 (303 to 518) | |||||
| *The risk in the intervention group (and its 95% confidence interval) is based on the assumed risk in the comparison group and the relative effect of the intervention (and its 95% CI). | ||||||
| GRADE Working Group grades of evidence | ||||||
| 1 Downgraded by one level as the number of participants in each study is small | ||||||
| Treatment with catheter directed thrombolysis for acute DVT | ||||||
| Patient or population: patients diagnosed with acute deep vein thrombosis | ||||||
| Outcomes | Anticipated absolute effects* (95% CI) | Relative effect | № of participants | Quality of the evidence | Comments | |
| Risk with control | Risk with catheter directed thrombolysis | |||||
| Complete clot lysis (intermediate, 6 months to under 5 years after treatment) | Study population | RR 2.52 | 224 | ⊕⊕⊕⊝ | ||
| 58 (of 116) patients treated with standard anticoagulation had complete clot lysis compared to 81 (of 108) in the CDT group | ||||||
| Bleeding (early, up to 1 month after treatment) | Study population | RR 7.69 | 224 | ⊕⊕⊕⊝ | None (of 116) patients in the standard anticoagulation group had bleeding complications compared to 3 (of 108) in the CDT group. | |
| Cannot define risk as no events reported in the standard anticoagulation group | ||||||
| Post‐thrombotic syndrome (intermediate, 6 months to under 5 years after treatment) | Study population | RR 0.74 | 189 | ⊕⊕⊕⊝ | 55 (of 99) patients in the standard anticoagulation group developed PTS compared to 37 (of 90) in the CDT group. | |
| 556 per 1000 | 411 per 1000 (306 to 556) | |||||
| Post‐thrombotic syndrome (late, 5 year follow‐up after treatment) | Study population | RR 0.60 | 176 | ⊕⊕⊕⊝ | 63 (of 89) patients in the standard anticoagulation group developed PTS compared to 37 (of 87) in the CDT group. | |
| 708 per 1000 | 425 per 1000 (319 to 559) | |||||
| *The risk in the intervention group (and its 95% confidence interval) is based on the assumed risk in the comparison group and the relative effect of the intervention (and its 95% CI). | ||||||
| GRADE Working Group grades of evidence | ||||||
| 1 Downgraded by one level as confidence intervals are wide around the estimate of the effect | ||||||
| Study | Potential levels of leg vein included |
| proximal to calf | |
| not specified | |
| proximal | |
| femoral and iliofemoral | |
| pelvic, iliofemoral, femoral | |
| popliteal or more proximal | |
| proximal | |
| not specified | |
| not specified | |
| calf up to iliac vein | |
| calf vein thrombosis only | |
| not specified | |
| popliteal or more proximal | |
| not specified | |
| proximal | |
| popliteal up to inferior vena cava | |
| popliteal or more proximal |
| Outcome or subgroup title | No. of studies | No. of participants | Statistical method | Effect size |
| 1 Any improvement in venous patency (early) Show forest plot | 9 | 421 | Risk Ratio (M‐H, Random, 95% CI) | 2.48 [1.35, 4.57] |
| 2 Complete clot lysis (early) Show forest plot | 8 | 592 | Risk Ratio (M‐H, Random, 95% CI) | 4.91 [1.66, 14.53] |
| 3 Bleeding (early) Show forest plot | 17 | 1103 | Risk Ratio (M‐H, Fixed, 95% CI) | 2.23 [1.41, 3.52] |
| 4 Stroke/intracerebral haemorrhage (early) Show forest plot | 17 | 1103 | Risk Ratio (M‐H, Fixed, 95% CI) | 1.92 [0.34, 10.86] |
| 5 Mortality (early) Show forest plot | 9 | 529 | Risk Ratio (M‐H, Fixed, 95% CI) | 0.76 [0.31, 1.89] |
| 6 Pulmonary embolism (early) Show forest plot | 6 | 433 | Risk Ratio (M‐H, Fixed, 95% CI) | 1.00 [0.33, 3.05] |
| 7 Post‐thrombotic syndrome (intermediate) Show forest plot | 3 | 306 | Risk Ratio (M‐H, Fixed, 95% CI) | 0.66 [0.53, 0.81] |
| 8 Post‐thrombotic syndrome (late) Show forest plot | 2 | 211 | Risk Ratio (M‐H, Fixed, 95% CI) | 0.58 [0.45, 0.77] |
| 9 Leg ulceration (intermediate) Show forest plot | 4 | 342 | Risk Ratio (M‐H, Fixed, 95% CI) | 0.87 [0.16, 4.73] |
| 10 Leg ulceration (late) Show forest plot | 1 | Risk Ratio (M‐H, Fixed, 95% CI) | Totals not selected | |
| 11 Complete clot lysis (intermediate) Show forest plot | 7 | 630 | Risk Ratio (M‐H, Random, 95% CI) | 2.44 [1.40, 4.27] |
| 12 Complete clot lysis (late) Show forest plot | 2 | 206 | Risk Ratio (M‐H, Random, 95% CI) | 3.25 [0.17, 62.63] |
| 13 Mortality (intermediate) Show forest plot | 2 | 289 | Risk Ratio (M‐H, Fixed, 95% CI) | 0.96 [0.27, 3.43] |
| 14 Mortality (late) Show forest plot | 2 | 230 | Risk Ratio (M‐H, Fixed, 95% CI) | 0.61 [0.25, 1.50] |
| 15 Normal venous function (intermediate) Show forest plot | 3 | 255 | Risk Ratio (M‐H, Random, 95% CI) | 2.18 [0.86, 5.54] |
| 16 Recurrent DVT (intermediate) Show forest plot | 1 | Risk Ratio (M‐H, Fixed, 95% CI) | Totals not selected | |
| Outcome or subgroup title | No. of studies | No. of participants | Statistical method | Effect size |
| 1 Any improvement in venous patency (early) Show forest plot | 8 | 386 | Risk Ratio (M‐H, Random, 95% CI) | 2.18 [1.28, 3.70] |
| 2 Complete clot lysis (early) Show forest plot | 7 | 457 | Risk Ratio (M‐H, Random, 95% CI) | 4.37 [1.40, 13.61] |
| 3 Bleeding (early) Show forest plot | 15 | 779 | Risk Ratio (M‐H, Fixed, 95% CI) | 2.18 [1.37, 3.47] |
| 4 Stroke/intracerebral haemorrhage (early) Show forest plot | 15 | 779 | Risk Ratio (M‐H, Fixed, 95% CI) | 1.92 [0.34, 10.86] |
| 5 Mortality (early) Show forest plot | 8 | 394 | Risk Ratio (M‐H, Fixed, 95% CI) | 0.76 [0.31, 1.89] |
| 6 Pulmonary embolism (early) Show forest plot | 5 | 298 | Risk Ratio (M‐H, Fixed, 95% CI) | 1.73 [0.55, 5.40] |
| 7 Post‐thrombotic syndrome (intermediate) Show forest plot | 2 | 117 | Risk Ratio (M‐H, Random, 95% CI) | 0.56 [0.30, 1.03] |
| 8 Post‐thrombotic syndrome (late) Show forest plot | 1 | Risk Ratio (M‐H, Fixed, 95% CI) | Totals not selected | |
| 9 Leg ulceration (intermediate) Show forest plot | 3 | 153 | Risk Ratio (M‐H, Fixed, 95% CI) | 0.87 [0.16, 4.73] |
| 10 Leg ulceration (late) Show forest plot | 1 | Risk Ratio (M‐H, Fixed, 95% CI) | Totals not selected | |
| 11 Complete clot lysis (intermediate) Show forest plot | 5 | 300 | Risk Ratio (M‐H, Random, 95% CI) | 2.59 [1.27, 5.28] |
| 12 Complete clot lysis (late) Show forest plot | 1 | Risk Ratio (M‐H, Fixed, 95% CI) | Totals not selected | |
| 13 Mortality (intermediate) Show forest plot | 2 | 189 | Risk Ratio (M‐H, Fixed, 95% CI) | 0.96 [0.27, 3.43] |
| 14 Mortality (late) Show forest plot | 1 | Risk Ratio (M‐H, Fixed, 95% CI) | Totals not selected | |
| 15 Normal venous function (intermediate) Show forest plot | 1 | Risk Ratio (M‐H, Fixed, 95% CI) | Totals not selected | |
| 16 Recurrent DVT (late) Show forest plot | 1 | Risk Ratio (M‐H, Fixed, 95% CI) | Totals not selected | |
| Outcome or subgroup title | No. of studies | No. of participants | Statistical method | Effect size |
| 1 Complete clot lysis (early) Show forest plot | 1 | Risk Ratio (M‐H, Fixed, 95% CI) | Totals not selected | |
| 2 Bleeding (early) Show forest plot | 2 | 146 | Risk Ratio (M‐H, Fixed, 95% CI) | 4.0 [0.46, 34.75] |
| 3 Stroke/intracerebral haemorrhage (early) Show forest plot | 2 | 146 | Risk Ratio (M‐H, Fixed, 95% CI) | 0.0 [0.0, 0.0] |
| 4 Mortality (early) Show forest plot | 1 | Risk Ratio (M‐H, Fixed, 95% CI) | Totals not selected | |
| 5 Pulmonary embolism (early) Show forest plot | 1 | Risk Ratio (M‐H, Fixed, 95% CI) | Totals not selected | |
| 6 Post‐thrombotic syndrome (intermediate) Show forest plot | 1 | Risk Ratio (M‐H, Fixed, 95% CI) | Totals not selected | |
| 7 Leg ulceration (intermediate) Show forest plot | 1 | Risk Ratio (M‐H, Fixed, 95% CI) | Totals not selected | |
| 8 Complete clot lysis (intermediate) Show forest plot | 2 | 139 | Risk Ratio (M‐H, Fixed, 95% CI) | 2.25 [1.33, 3.80] |
| 9 Mortality (intermediate) Show forest plot | 1 | Risk Ratio (M‐H, Fixed, 95% CI) | Totals not selected | |
| Outcome or subgroup title | No. of studies | No. of participants | Statistical method | Effect size |
| 1 Any improvement in venous patency (early) Show forest plot | 1 | Risk Ratio (M‐H, Fixed, 95% CI) | Totals not selected | |
| 2 Complete clot lysis (early) Show forest plot | 1 | Risk Ratio (M‐H, Fixed, 95% CI) | Totals not selected | |
| 3 Bleeding (early) Show forest plot | 2 | 224 | Risk Ratio (M‐H, Fixed, 95% CI) | 7.69 [0.40, 146.90] |
| 4 Stroke/intracerebral haemorrhage (early) Show forest plot | 1 | Risk Ratio (M‐H, Fixed, 95% CI) | Totals not selected | |
| 5 Mortality (early) Show forest plot | 1 | Risk Ratio (M‐H, Fixed, 95% CI) | Totals not selected | |
| 6 Pulmonary embolism (early) Show forest plot | 1 | Risk Ratio (M‐H, Fixed, 95% CI) | Totals not selected | |
| 7 Post‐thrombotic syndrome (intermediate) Show forest plot | 1 | Risk Ratio (M‐H, Fixed, 95% CI) | Totals not selected | |
| 8 Post‐thrombotic syndrome (late) Show forest plot | 1 | Risk Ratio (M‐H, Fixed, 95% CI) | Totals not selected | |
| 9 Leg ulceration (intermediate) Show forest plot | 1 | Risk Ratio (M‐H, Fixed, 95% CI) | Totals not selected | |
| 10 Complete clot lysis (intermediate) Show forest plot | 2 | 224 | Risk Ratio (M‐H, Random, 95% CI) | 2.52 [0.52, 12.17] |
| 11 Complete clot lysis (late) Show forest plot | 1 | Risk Ratio (M‐H, Fixed, 95% CI) | Totals not selected | |
| 12 Normal venous function (intermediate) Show forest plot | 2 | 224 | Risk Ratio (M‐H, Fixed, 95% CI) | 2.98 [1.75, 5.08] |
| 13 Recurrent VTE (intermediate) Show forest plot | 1 | Risk Ratio (M‐H, Fixed, 95% CI) | Totals not selected | |
| 14 Recurrent VTE (late) Show forest plot | 1 | Risk Ratio (M‐H, Fixed, 95% CI) | Totals not selected | |
| 15 Mortality (late) Show forest plot | 1 | Risk Ratio (M‐H, Fixed, 95% CI) | Totals not selected | |