Thrombolysis for acute deep vein thrombosis
Information
- DOI:
- https://doi.org/10.1002/14651858.CD002783.pub4Copy DOI

- Database:
-
- Cochrane Database of Systematic Reviews
- Version published:
-
- 10 November 2016see what's new
- Type:
-
- Intervention
- Stage:
-
- Review
- Cochrane Editorial Group:
-
Cochrane Vascular Group
- Copyright:
-
- Copyright © 2016 The Cochrane Collaboration. Published by John Wiley & Sons, Ltd.
Article metrics
Altmetric:
Cited by:
Authors
Contributions of authors
LW: assessed reference list, extracted data, updated review text
CB: assessed reference list, extracted data, updated review text
MPA: updated review text, resolved differences where required
Sources of support
Internal sources
-
No sources of support supplied
External sources
-
Chief Scientist Office, Scottish Government Health Directorates, The Scottish Government, UK.
The Cochrane Vascular editorial base is supported by the Chief Scientist Office.
-
National Institute for Health Research (NIHR), UK.
This project was supported by the NIHR, via a Cochrane Programme Grant funding (13/89/23) to Cochrane Vascular. The views and opinions expressed therein are those of the authors and do not necessarily reflect those of the Systematic Reviews Programme, NIHR, NHS or the Department of Health.
Declarations of interest
LW: has declared that she received travel and accomodation fees from the European Society of Angiology for speaking at the 2012 meeting on this topic
CB: CB is a member of Cochrane Vascular's editorial base staff. Where appropriate, editorial tasks were carried out by other group members
MPA: none known
Acknowledgements
We would like to thank Dr Jonathon Michaels who was involved with formulating the original protocol.
Version history
| Published | Title | Stage | Authors | Version |
| 2021 Jan 19 | Thrombolytic strategies versus standard anticoagulation for acute deep vein thrombosis of the lower limb | Review | Cathryn Broderick, Lorna Watson, Matthew P Armon | |
| 2016 Nov 10 | Thrombolysis for acute deep vein thrombosis | Review | Lorna Watson, Cathryn Broderick, Matthew P Armon | |
| 2014 Jan 23 | Thrombolysis for acute deep vein thrombosis | Review | Lorna Watson, Cathryn Broderick, Matthew P Armon | |
| 2004 Jul 19 | Thrombolysis for acute deep vein thrombosis | Review | Lorna Watson, Matthew P Armon | |
| 2000 Apr 24 | Thrombolysis for acute deep vein thrombosis | Protocol | Matthew P Armon, J A Michaels | |
Differences between protocol and review
After consideration, the review authors decided to increase the inclusion period of acute symptoms of DVT from 14 to 21 days as this is more commonly used in recent studies. Trials previously excluded due to this were reassessed and included.
In the initial published version, the quality of the trials was investigated using the methods of Jadad (Jadad 1996) and Schulz (Schultz 1995). In keeping with updated Cochrane Collaboration requirements, quality has now been assessed using the Cochrane risk of bias tool (Higgins 2011).
For the 2016 update we changed the time point definitions to differentiate late outcomes after five years as two studies (Arneson 1978; Enden 2011) now reported results within this period. Due to this Arneson 1978 data was re‐categorised from intermediate to late.
Keywords
MeSH
Medical Subject Headings (MeSH) Keywords
Medical Subject Headings Check Words
Humans;
PICOs


Risk of bias graph: review authors' judgements about each risk of bias item presented as percentages across all included studies.
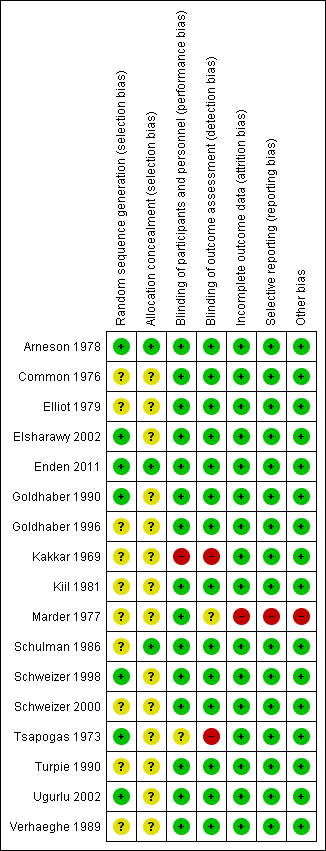
Risk of bias summary: review authors' judgements about each risk of bias item for each included study.

Comparison 1 Any thrombolysis versus control, Outcome 1 Any improvement in venous patency (early).

Comparison 1 Any thrombolysis versus control, Outcome 2 Complete clot lysis (early).
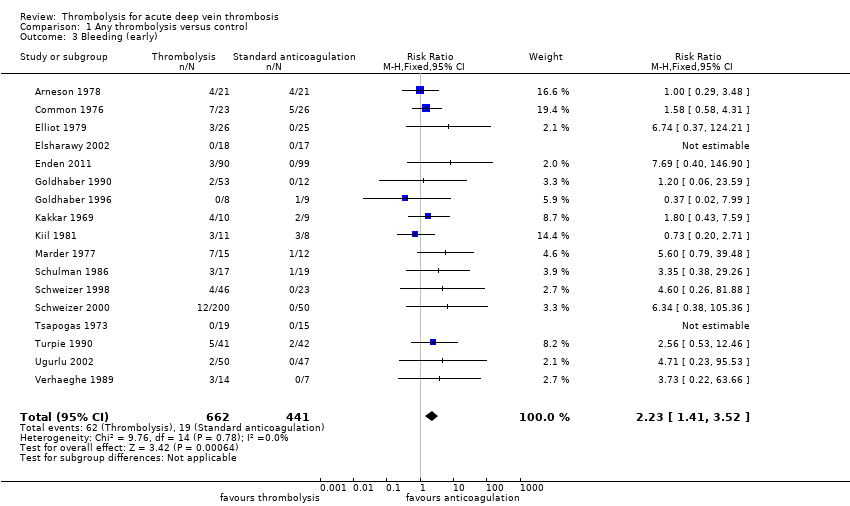
Comparison 1 Any thrombolysis versus control, Outcome 3 Bleeding (early).

Comparison 1 Any thrombolysis versus control, Outcome 4 Stroke/intracerebral haemorrhage (early).
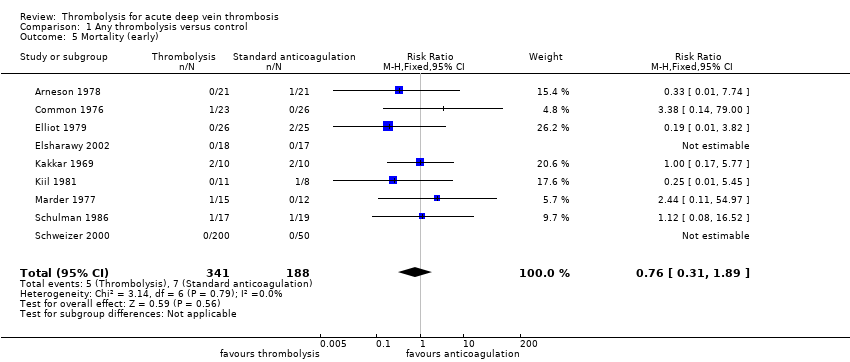
Comparison 1 Any thrombolysis versus control, Outcome 5 Mortality (early).
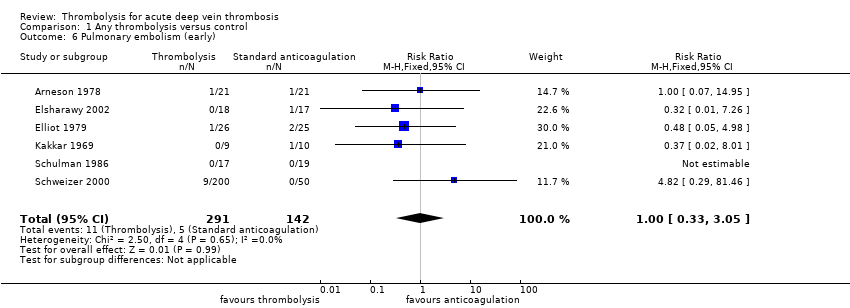
Comparison 1 Any thrombolysis versus control, Outcome 6 Pulmonary embolism (early).

Comparison 1 Any thrombolysis versus control, Outcome 7 Post‐thrombotic syndrome (intermediate).

Comparison 1 Any thrombolysis versus control, Outcome 8 Post‐thrombotic syndrome (late).
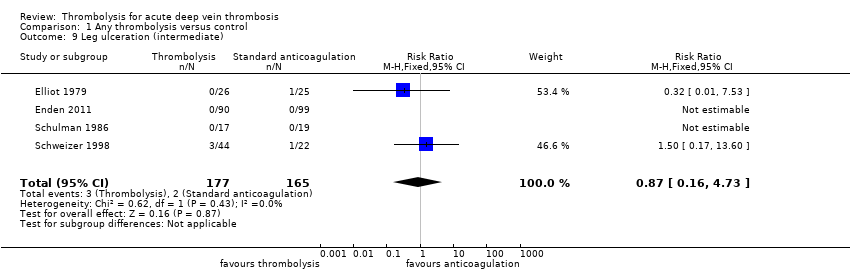
Comparison 1 Any thrombolysis versus control, Outcome 9 Leg ulceration (intermediate).
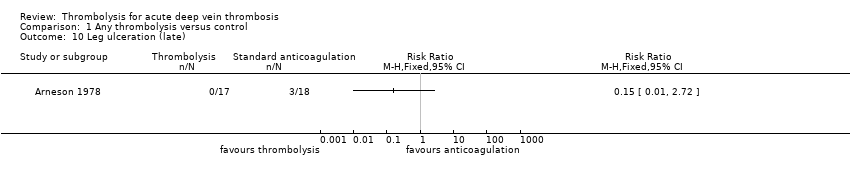
Comparison 1 Any thrombolysis versus control, Outcome 10 Leg ulceration (late).
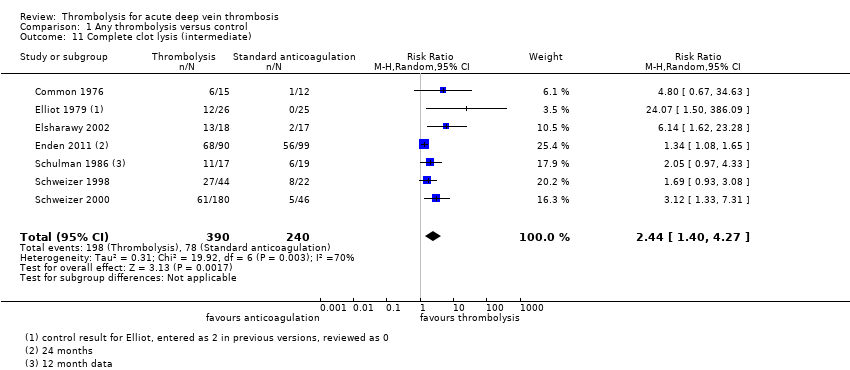
Comparison 1 Any thrombolysis versus control, Outcome 11 Complete clot lysis (intermediate).

Comparison 1 Any thrombolysis versus control, Outcome 12 Complete clot lysis (late).

Comparison 1 Any thrombolysis versus control, Outcome 13 Mortality (intermediate).

Comparison 1 Any thrombolysis versus control, Outcome 14 Mortality (late).

Comparison 1 Any thrombolysis versus control, Outcome 15 Normal venous function (intermediate).
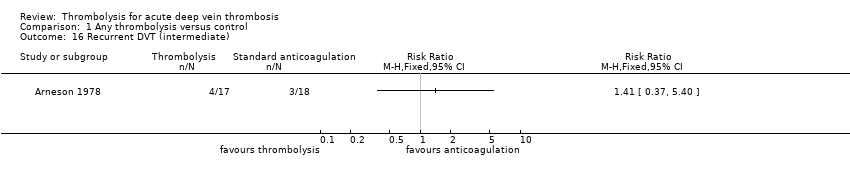
Comparison 1 Any thrombolysis versus control, Outcome 16 Recurrent DVT (intermediate).
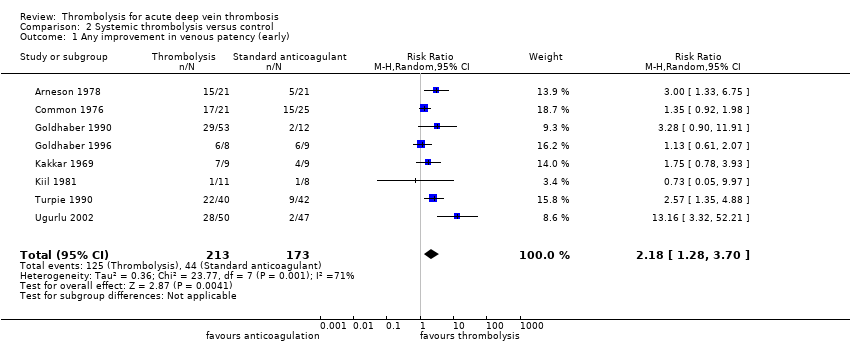
Comparison 2 Systemic thrombolysis versus control, Outcome 1 Any improvement in venous patency (early).

Comparison 2 Systemic thrombolysis versus control, Outcome 2 Complete clot lysis (early).

Comparison 2 Systemic thrombolysis versus control, Outcome 3 Bleeding (early).

Comparison 2 Systemic thrombolysis versus control, Outcome 4 Stroke/intracerebral haemorrhage (early).
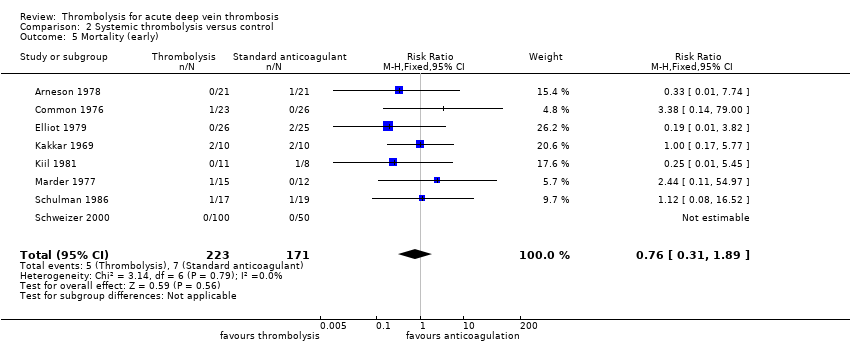
Comparison 2 Systemic thrombolysis versus control, Outcome 5 Mortality (early).

Comparison 2 Systemic thrombolysis versus control, Outcome 6 Pulmonary embolism (early).

Comparison 2 Systemic thrombolysis versus control, Outcome 7 Post‐thrombotic syndrome (intermediate).

Comparison 2 Systemic thrombolysis versus control, Outcome 8 Post‐thrombotic syndrome (late).

Comparison 2 Systemic thrombolysis versus control, Outcome 9 Leg ulceration (intermediate).
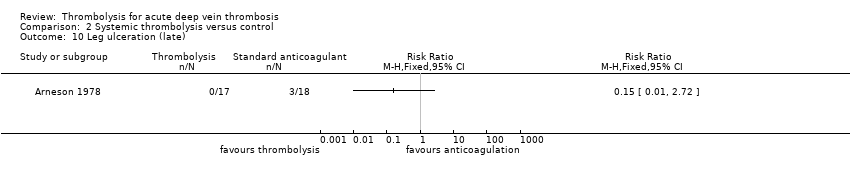
Comparison 2 Systemic thrombolysis versus control, Outcome 10 Leg ulceration (late).
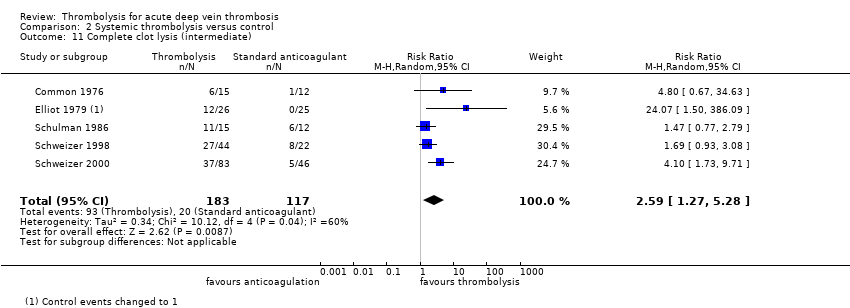
Comparison 2 Systemic thrombolysis versus control, Outcome 11 Complete clot lysis (intermediate).
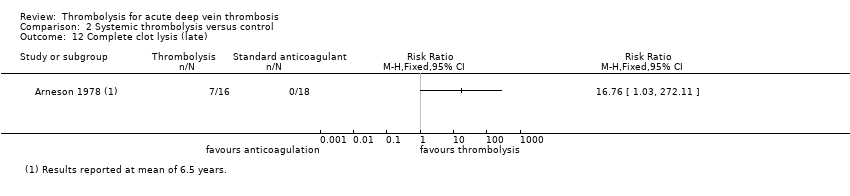
Comparison 2 Systemic thrombolysis versus control, Outcome 12 Complete clot lysis (late).
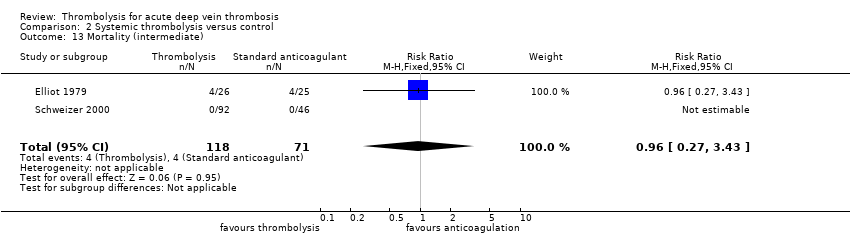
Comparison 2 Systemic thrombolysis versus control, Outcome 13 Mortality (intermediate).

Comparison 2 Systemic thrombolysis versus control, Outcome 14 Mortality (late).

Comparison 2 Systemic thrombolysis versus control, Outcome 15 Normal venous function (intermediate).

Comparison 2 Systemic thrombolysis versus control, Outcome 16 Recurrent DVT (late).
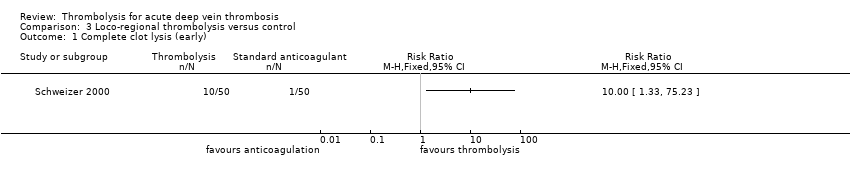
Comparison 3 Loco‐regional thrombolysis versus control, Outcome 1 Complete clot lysis (early).

Comparison 3 Loco‐regional thrombolysis versus control, Outcome 2 Bleeding (early).

Comparison 3 Loco‐regional thrombolysis versus control, Outcome 3 Stroke/intracerebral haemorrhage (early).
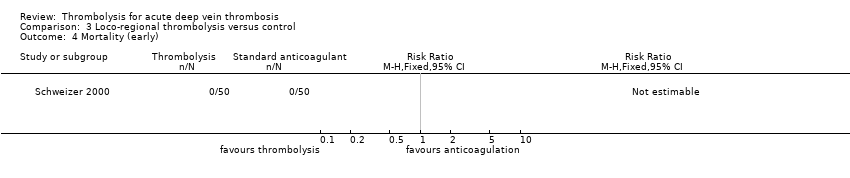
Comparison 3 Loco‐regional thrombolysis versus control, Outcome 4 Mortality (early).

Comparison 3 Loco‐regional thrombolysis versus control, Outcome 5 Pulmonary embolism (early).
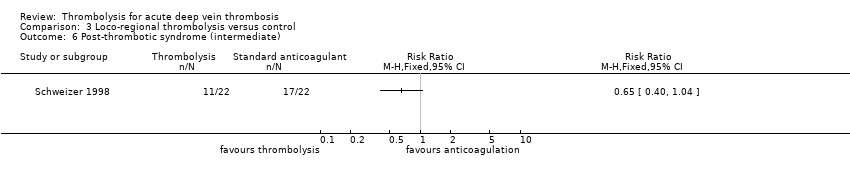
Comparison 3 Loco‐regional thrombolysis versus control, Outcome 6 Post‐thrombotic syndrome (intermediate).

Comparison 3 Loco‐regional thrombolysis versus control, Outcome 7 Leg ulceration (intermediate).

Comparison 3 Loco‐regional thrombolysis versus control, Outcome 8 Complete clot lysis (intermediate).

Comparison 3 Loco‐regional thrombolysis versus control, Outcome 9 Mortality (intermediate).
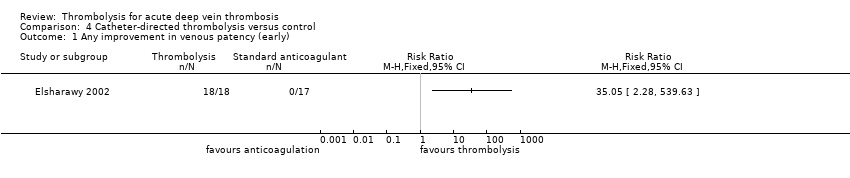
Comparison 4 Catheter‐directed thrombolysis versus control, Outcome 1 Any improvement in venous patency (early).

Comparison 4 Catheter‐directed thrombolysis versus control, Outcome 2 Complete clot lysis (early).

Comparison 4 Catheter‐directed thrombolysis versus control, Outcome 3 Bleeding (early).

Comparison 4 Catheter‐directed thrombolysis versus control, Outcome 4 Stroke/intracerebral haemorrhage (early).

Comparison 4 Catheter‐directed thrombolysis versus control, Outcome 5 Mortality (early).

Comparison 4 Catheter‐directed thrombolysis versus control, Outcome 6 Pulmonary embolism (early).

Comparison 4 Catheter‐directed thrombolysis versus control, Outcome 7 Post‐thrombotic syndrome (intermediate).

Comparison 4 Catheter‐directed thrombolysis versus control, Outcome 8 Post‐thrombotic syndrome (late).

Comparison 4 Catheter‐directed thrombolysis versus control, Outcome 9 Leg ulceration (intermediate).

Comparison 4 Catheter‐directed thrombolysis versus control, Outcome 10 Complete clot lysis (intermediate).

Comparison 4 Catheter‐directed thrombolysis versus control, Outcome 11 Complete clot lysis (late).
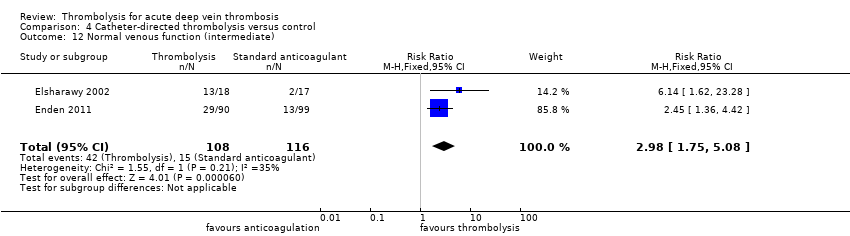
Comparison 4 Catheter‐directed thrombolysis versus control, Outcome 12 Normal venous function (intermediate).

Comparison 4 Catheter‐directed thrombolysis versus control, Outcome 13 Recurrent VTE (intermediate).

Comparison 4 Catheter‐directed thrombolysis versus control, Outcome 14 Recurrent VTE (late).

Comparison 4 Catheter‐directed thrombolysis versus control, Outcome 15 Mortality (late).
| Treatment with any thrombolysis for acute DVT | ||||||
| Patient or population: patients diagnosed with acute DVT | ||||||
| Outcomes | Anticipated absolute effects* (95% CI) | Relative effect | № of participants | Quality of the evidence | Comments | |
| Risk with control | Risk with any thrombolysis | |||||
| Complete clot lysis (intermediate, 6 months to under 5 years after treatment) | Study population | RR 2.44 (1.4 to 4.27) | 630 | ⊕⊕⊕⊝ | 78 (of 240) patients treated with standard anticoagulation had complete clot lysis compared to 198 (of 390) in the thrombolysis group | |
| 325 per 1000 | 793 per 1000 (455 to 1000) | |||||
| Bleeding (early, up to 1 month after treatment) | Study population | RR 2.23 | 1103 | ⊕⊕⊕⊝ | Although 17 studies reported on bleeding, these were small studies | |
| 43 per 1000 | 96 per 1000 (61 to 152) | |||||
| Post‐thrombotic syndrome (intermediate, 6 months to under 5 years after treatment) | Study population | RR 0.66 | 306 | ⊕⊕⊕⊝ | 96 (of 146) patients treated with standard anticoagulation developed PTS compared to 72 (of 160) treated with thrombolysis | |
| 658 per 1000 | 434 per 1000 (348 to 533) | |||||
| Post‐thrombotic syndrome (late, 5 year follow‐up after treatment) | Study population | RR 0.58 | 211 | ⊕⊕⊕⊝ | 72 (of 107) patients treated with standard anticoagulation developed PTS compared to 41 (of 104) treated with thrombolysis | |
| 673 per 1000 | 390 per 1000 (303 to 518) | |||||
| *The risk in the intervention group (and its 95% confidence interval) is based on the assumed risk in the comparison group and the relative effect of the intervention (and its 95% CI). | ||||||
| GRADE Working Group grades of evidence | ||||||
| 1 Downgraded by one level as the number of participants in each study is small | ||||||
| Treatment with catheter directed thrombolysis for acute DVT | ||||||
| Patient or population: patients diagnosed with acute deep vein thrombosis | ||||||
| Outcomes | Anticipated absolute effects* (95% CI) | Relative effect | № of participants | Quality of the evidence | Comments | |
| Risk with control | Risk with catheter directed thrombolysis | |||||
| Complete clot lysis (intermediate, 6 months to under 5 years after treatment) | Study population | RR 2.52 | 224 | ⊕⊕⊕⊝ | ||
| 58 (of 116) patients treated with standard anticoagulation had complete clot lysis compared to 81 (of 108) in the CDT group | ||||||
| Bleeding (early, up to 1 month after treatment) | Study population | RR 7.69 | 224 | ⊕⊕⊕⊝ | None (of 116) patients in the standard anticoagulation group had bleeding complications compared to 3 (of 108) in the CDT group. | |
| Cannot define risk as no events reported in the standard anticoagulation group | ||||||
| Post‐thrombotic syndrome (intermediate, 6 months to under 5 years after treatment) | Study population | RR 0.74 | 189 | ⊕⊕⊕⊝ | 55 (of 99) patients in the standard anticoagulation group developed PTS compared to 37 (of 90) in the CDT group. | |
| 556 per 1000 | 411 per 1000 (306 to 556) | |||||
| Post‐thrombotic syndrome (late, 5 year follow‐up after treatment) | Study population | RR 0.60 | 176 | ⊕⊕⊕⊝ | 63 (of 89) patients in the standard anticoagulation group developed PTS compared to 37 (of 87) in the CDT group. | |
| 708 per 1000 | 425 per 1000 (319 to 559) | |||||
| *The risk in the intervention group (and its 95% confidence interval) is based on the assumed risk in the comparison group and the relative effect of the intervention (and its 95% CI). | ||||||
| GRADE Working Group grades of evidence | ||||||
| 1 Downgraded by one level as confidence intervals are wide around the estimate of the effect | ||||||
| Study | Potential levels of leg vein included |
| proximal to calf | |
| not specified | |
| proximal | |
| femoral and iliofemoral | |
| pelvic, iliofemoral, femoral | |
| popliteal or more proximal | |
| proximal | |
| not specified | |
| not specified | |
| calf up to iliac vein | |
| calf vein thrombosis only | |
| not specified | |
| popliteal or more proximal | |
| not specified | |
| proximal | |
| popliteal up to inferior vena cava | |
| popliteal or more proximal |
| Outcome or subgroup title | No. of studies | No. of participants | Statistical method | Effect size |
| 1 Any improvement in venous patency (early) Show forest plot | 9 | 421 | Risk Ratio (M‐H, Random, 95% CI) | 2.48 [1.35, 4.57] |
| 2 Complete clot lysis (early) Show forest plot | 8 | 592 | Risk Ratio (M‐H, Random, 95% CI) | 4.91 [1.66, 14.53] |
| 3 Bleeding (early) Show forest plot | 17 | 1103 | Risk Ratio (M‐H, Fixed, 95% CI) | 2.23 [1.41, 3.52] |
| 4 Stroke/intracerebral haemorrhage (early) Show forest plot | 17 | 1103 | Risk Ratio (M‐H, Fixed, 95% CI) | 1.92 [0.34, 10.86] |
| 5 Mortality (early) Show forest plot | 9 | 529 | Risk Ratio (M‐H, Fixed, 95% CI) | 0.76 [0.31, 1.89] |
| 6 Pulmonary embolism (early) Show forest plot | 6 | 433 | Risk Ratio (M‐H, Fixed, 95% CI) | 1.00 [0.33, 3.05] |
| 7 Post‐thrombotic syndrome (intermediate) Show forest plot | 3 | 306 | Risk Ratio (M‐H, Fixed, 95% CI) | 0.66 [0.53, 0.81] |
| 8 Post‐thrombotic syndrome (late) Show forest plot | 2 | 211 | Risk Ratio (M‐H, Fixed, 95% CI) | 0.58 [0.45, 0.77] |
| 9 Leg ulceration (intermediate) Show forest plot | 4 | 342 | Risk Ratio (M‐H, Fixed, 95% CI) | 0.87 [0.16, 4.73] |
| 10 Leg ulceration (late) Show forest plot | 1 | Risk Ratio (M‐H, Fixed, 95% CI) | Totals not selected | |
| 11 Complete clot lysis (intermediate) Show forest plot | 7 | 630 | Risk Ratio (M‐H, Random, 95% CI) | 2.44 [1.40, 4.27] |
| 12 Complete clot lysis (late) Show forest plot | 2 | 206 | Risk Ratio (M‐H, Random, 95% CI) | 3.25 [0.17, 62.63] |
| 13 Mortality (intermediate) Show forest plot | 2 | 289 | Risk Ratio (M‐H, Fixed, 95% CI) | 0.96 [0.27, 3.43] |
| 14 Mortality (late) Show forest plot | 2 | 230 | Risk Ratio (M‐H, Fixed, 95% CI) | 0.61 [0.25, 1.50] |
| 15 Normal venous function (intermediate) Show forest plot | 3 | 255 | Risk Ratio (M‐H, Random, 95% CI) | 2.18 [0.86, 5.54] |
| 16 Recurrent DVT (intermediate) Show forest plot | 1 | Risk Ratio (M‐H, Fixed, 95% CI) | Totals not selected | |
| Outcome or subgroup title | No. of studies | No. of participants | Statistical method | Effect size |
| 1 Any improvement in venous patency (early) Show forest plot | 8 | 386 | Risk Ratio (M‐H, Random, 95% CI) | 2.18 [1.28, 3.70] |
| 2 Complete clot lysis (early) Show forest plot | 7 | 457 | Risk Ratio (M‐H, Random, 95% CI) | 4.37 [1.40, 13.61] |
| 3 Bleeding (early) Show forest plot | 15 | 779 | Risk Ratio (M‐H, Fixed, 95% CI) | 2.18 [1.37, 3.47] |
| 4 Stroke/intracerebral haemorrhage (early) Show forest plot | 15 | 779 | Risk Ratio (M‐H, Fixed, 95% CI) | 1.92 [0.34, 10.86] |
| 5 Mortality (early) Show forest plot | 8 | 394 | Risk Ratio (M‐H, Fixed, 95% CI) | 0.76 [0.31, 1.89] |
| 6 Pulmonary embolism (early) Show forest plot | 5 | 298 | Risk Ratio (M‐H, Fixed, 95% CI) | 1.73 [0.55, 5.40] |
| 7 Post‐thrombotic syndrome (intermediate) Show forest plot | 2 | 117 | Risk Ratio (M‐H, Random, 95% CI) | 0.56 [0.30, 1.03] |
| 8 Post‐thrombotic syndrome (late) Show forest plot | 1 | Risk Ratio (M‐H, Fixed, 95% CI) | Totals not selected | |
| 9 Leg ulceration (intermediate) Show forest plot | 3 | 153 | Risk Ratio (M‐H, Fixed, 95% CI) | 0.87 [0.16, 4.73] |
| 10 Leg ulceration (late) Show forest plot | 1 | Risk Ratio (M‐H, Fixed, 95% CI) | Totals not selected | |
| 11 Complete clot lysis (intermediate) Show forest plot | 5 | 300 | Risk Ratio (M‐H, Random, 95% CI) | 2.59 [1.27, 5.28] |
| 12 Complete clot lysis (late) Show forest plot | 1 | Risk Ratio (M‐H, Fixed, 95% CI) | Totals not selected | |
| 13 Mortality (intermediate) Show forest plot | 2 | 189 | Risk Ratio (M‐H, Fixed, 95% CI) | 0.96 [0.27, 3.43] |
| 14 Mortality (late) Show forest plot | 1 | Risk Ratio (M‐H, Fixed, 95% CI) | Totals not selected | |
| 15 Normal venous function (intermediate) Show forest plot | 1 | Risk Ratio (M‐H, Fixed, 95% CI) | Totals not selected | |
| 16 Recurrent DVT (late) Show forest plot | 1 | Risk Ratio (M‐H, Fixed, 95% CI) | Totals not selected | |
| Outcome or subgroup title | No. of studies | No. of participants | Statistical method | Effect size |
| 1 Complete clot lysis (early) Show forest plot | 1 | Risk Ratio (M‐H, Fixed, 95% CI) | Totals not selected | |
| 2 Bleeding (early) Show forest plot | 2 | 146 | Risk Ratio (M‐H, Fixed, 95% CI) | 4.0 [0.46, 34.75] |
| 3 Stroke/intracerebral haemorrhage (early) Show forest plot | 2 | 146 | Risk Ratio (M‐H, Fixed, 95% CI) | 0.0 [0.0, 0.0] |
| 4 Mortality (early) Show forest plot | 1 | Risk Ratio (M‐H, Fixed, 95% CI) | Totals not selected | |
| 5 Pulmonary embolism (early) Show forest plot | 1 | Risk Ratio (M‐H, Fixed, 95% CI) | Totals not selected | |
| 6 Post‐thrombotic syndrome (intermediate) Show forest plot | 1 | Risk Ratio (M‐H, Fixed, 95% CI) | Totals not selected | |
| 7 Leg ulceration (intermediate) Show forest plot | 1 | Risk Ratio (M‐H, Fixed, 95% CI) | Totals not selected | |
| 8 Complete clot lysis (intermediate) Show forest plot | 2 | 139 | Risk Ratio (M‐H, Fixed, 95% CI) | 2.25 [1.33, 3.80] |
| 9 Mortality (intermediate) Show forest plot | 1 | Risk Ratio (M‐H, Fixed, 95% CI) | Totals not selected | |
| Outcome or subgroup title | No. of studies | No. of participants | Statistical method | Effect size |
| 1 Any improvement in venous patency (early) Show forest plot | 1 | Risk Ratio (M‐H, Fixed, 95% CI) | Totals not selected | |
| 2 Complete clot lysis (early) Show forest plot | 1 | Risk Ratio (M‐H, Fixed, 95% CI) | Totals not selected | |
| 3 Bleeding (early) Show forest plot | 2 | 224 | Risk Ratio (M‐H, Fixed, 95% CI) | 7.69 [0.40, 146.90] |
| 4 Stroke/intracerebral haemorrhage (early) Show forest plot | 1 | Risk Ratio (M‐H, Fixed, 95% CI) | Totals not selected | |
| 5 Mortality (early) Show forest plot | 1 | Risk Ratio (M‐H, Fixed, 95% CI) | Totals not selected | |
| 6 Pulmonary embolism (early) Show forest plot | 1 | Risk Ratio (M‐H, Fixed, 95% CI) | Totals not selected | |
| 7 Post‐thrombotic syndrome (intermediate) Show forest plot | 1 | Risk Ratio (M‐H, Fixed, 95% CI) | Totals not selected | |
| 8 Post‐thrombotic syndrome (late) Show forest plot | 1 | Risk Ratio (M‐H, Fixed, 95% CI) | Totals not selected | |
| 9 Leg ulceration (intermediate) Show forest plot | 1 | Risk Ratio (M‐H, Fixed, 95% CI) | Totals not selected | |
| 10 Complete clot lysis (intermediate) Show forest plot | 2 | 224 | Risk Ratio (M‐H, Random, 95% CI) | 2.52 [0.52, 12.17] |
| 11 Complete clot lysis (late) Show forest plot | 1 | Risk Ratio (M‐H, Fixed, 95% CI) | Totals not selected | |
| 12 Normal venous function (intermediate) Show forest plot | 2 | 224 | Risk Ratio (M‐H, Fixed, 95% CI) | 2.98 [1.75, 5.08] |
| 13 Recurrent VTE (intermediate) Show forest plot | 1 | Risk Ratio (M‐H, Fixed, 95% CI) | Totals not selected | |
| 14 Recurrent VTE (late) Show forest plot | 1 | Risk Ratio (M‐H, Fixed, 95% CI) | Totals not selected | |
| 15 Mortality (late) Show forest plot | 1 | Risk Ratio (M‐H, Fixed, 95% CI) | Totals not selected | |