Exercise interventions for cerebral palsy
Abstract
Background
Cerebral palsy (CP) is a neurodevelopmental disorder resulting from an injury to the developing brain. It is the most common form of childhood disability with prevalence rates of between 1.5 and 3.8 per 1000 births reported worldwide. The primary impairments associated with CP include reduced muscle strength and reduced cardiorespiratory fitness, resulting in difficulties performing activities such as dressing, walking and negotiating stairs.
Exercise is defined as a planned, structured and repetitive activity that aims to improve fitness, and it is a commonly used intervention for people with CP. Aerobic and resistance training may improve activity (i.e. the ability to execute a task) and participation (i.e. involvement in a life situation) through their impact on the primary impairments of CP. However, to date, there has been no comprehensive review of exercise interventions for people with CP.
Objectives
To assess the effects of exercise interventions in people with CP, primarily in terms of activity, participation and quality of life. Secondary outcomes assessed body functions and body structures. Comparators of interest were no treatment, usual care or an alternative type of exercise intervention.
Search methods
In June 2016 we searched CENTRAL, MEDLINE, Embase, nine other databases and four trials registers.
Selection criteria
We included randomised controlled trials (RCTs) and quasi‐RCTs of children, adolescents and adults with CP. We included studies of aerobic exercise, resistance training, and 'mixed training' (a combination of at least two of aerobic exercise, resistance training and anaerobic training).
Data collection and analysis
Two review authors independently screened titles, abstracts and potentially relevant full‐text reports for eligibility; extracted all relevant data and conducted 'Risk of bias' and GRADE assessments.
Main results
We included 29 trials (926 participants); 27 included children and adolescents up to the age of 19 years, three included adolescents and young adults (10 to 22 years), and one included adults over 20 years. Males constituted 53% of the sample. Five trials were conducted in the USA; four in Australia; two in Egypt, Korea, Saudi Arabia, Taiwan, the Netherlands, and the UK; three in Greece; and one apiece in India, Italy, Norway, and South Africa.
Twenty‐six trials included people with spastic CP only; three trials included children and adolescents with spastic and other types of CP. Twenty‐one trials included people who were able to walk with or without assistive devices, four trials also included people who used wheeled mobility devices in most settings, and one trial included people who used wheeled mobility devices only. Three trials did not report the functional ability of participants. Only two trials reported participants' manual ability. Eight studies compared aerobic exercise to usual care, while 15 compared resistance training and 4 compared mixed training to usual care or no treatment. Two trials compared aerobic exercise to resistance training. We judged all trials to be at high risk of bias overall.
We found low‐quality evidence that aerobic exercise improves gross motor function in the short term (standardised mean difference (SMD) 0.53, 95% confidence interval (CI) 0.02 to 1.04, N = 65, 3 studies) and intermediate term (mean difference (MD) 12.96%, 95% CI 0.52% to 25.40%, N = 12, 1 study). Aerobic exercise does not improve gait speed in the short term (MD 0.09 m/s, 95% CI −0.11 m/s to 0.28 m/s, N = 82, 4 studies, very low‐quality evidence) or intermediate term (MD −0.17 m/s, 95% CI −0.59 m/s to 0.24 m/s, N = 12, 1 study, low‐quality evidence). No trial assessed participation or quality of life following aerobic exercise.
We found low‐quality evidence that resistance training does not improve gross motor function (SMD 0.12, 95% CI −0.19 to 0.43, N = 164, 7 studies), gait speed (MD 0.03 m/s, 95% CI −0.02 m/s to 0.07 m/s, N = 185, 8 studies), participation (SMD 0.34, 95% CI −0.01 to 0.70, N = 127, 2 studies) or parent‐reported quality of life (MD 12.70, 95% CI −5.63 to 31.03, n = 12, 1 study) in the short term. There is also low‐quality evidence that resistance training does not improve gait speed (MD −0.03 m/s, 95% CI −0.17 m/s to 0.11 m/s, N = 84, 3 studies), gross motor function (SMD 0.13, 95% CI −0.30 to 0.55, N = 85, 3 studies) or participation (MD 0.37, 95% CI −6.61 to 7.35, N = 36, 1 study) in the intermediate term.
We found low‐quality evidence that mixed training does not improve gross motor function (SMD 0.02, 95% CI −0.29 to 0.33, N = 163, 4 studies) or gait speed (MD 0.10 m/s, −0.07 m/s to 0.27 m/s, N = 58, 1 study) but does improve participation (MD 0.40, 95% CI 0.13 to 0.67, N = 65, 1 study) in the short‐term.
There is no difference between resistance training and aerobic exercise in terms of the effect on gross motor function in the short term (SMD 0.02, 95% CI −0.50 to 0.55, N = 56, 2 studies, low‐quality evidence).
Thirteen trials did not report adverse events, seven reported no adverse events, and nine reported non‐serious adverse events.
Authors' conclusions
The quality of evidence for all conclusions is low to very low. As included trials have small sample sizes, heterogeneity may be underestimated, resulting in considerable uncertainty relating to effect estimates. For children with CP, there is evidence that aerobic exercise may result in a small improvement in gross motor function, though it does not improve gait speed. There is evidence that resistance training does not improve gait speed, gross motor function, participation or quality of life among children with CP.
Based on the evidence available, exercise appears to be safe for people with CP; only 55% of trials, however, reported adverse events or stated that they monitored adverse events. There is a need for large, high‐quality, well‐reported RCTs that assess the effectiveness of exercise in terms of activity and participation, before drawing any firm conclusions on the effectiveness of exercise for people with CP. Research is also required to determine if current exercise guidelines for the general population are effective and feasible for people with CP.
PICOs
Plain language summary
Exercise interventions for improving activity, participation and quality of life in people with cerebral palsy
Review question
Does exercise improve activity, participation in life situations and quality of life in people with cerebral palsy (CP)?
Background
Cerebral palsy (CP) is caused by an injury to an infant's brain that interrupts normal development. People with CP have reduced muscle strength and aerobic fitness, which may impact their ability to perform activities such as standing, walking, running and to participate in everyday life. Exercise is defined as a planned, structured and repetitive activity that aims to improve fitness. Aerobic exercise aims to improve aerobic fitness, while strength training aims to improve muscle strength. Health professionals often prescribe exercise to people with CP, primarily to improve function, but there has been no comprehensive evaluation of the evidence for the effectiveness of these interventions in people with CP.
Study characteristics
In June 2016 we searched for all studies that investigated the effectiveness of exercise for people with CP. We included 29 trials with a total of 926 participants with CP, 53% of whom were male. Five trials were conducted in the USA; four in Australia; two in Egypt, Korea, Saudi Arabia, Taiwan, the Netherlands, and the UK; three in Greece; and one apiece in India, Italy, Norway, South Africa.
One trial included only adults with CP and three trials included adolescents and young adults. Most trials included children with CP who could walk independently, with or without a walking aid. Four trials also included people who used wheeled mobility devices (e.g. wheelchairs) in most settings and one trial included people who used wheeled mobility devices only. Three trials did not clearly report participants' functional ability and only two trials reported participants' manual ability (use of hands when handling objects). Eight trials compared aerobic exercise to usual care (i.e. the care a patient usually receives in practice), 15 trials compared resistance training (a type of exercise to improve muscular strength) to either usual care or no treatment, 4 trials compared mixed training (aerobic exercise and resistance training) to usual care or no treatment, and 2 trials compared aerobic exercise to resistance training.
Key results
Aerobic exercise may improve activity as indicated by motor function but does not appear to improve gait speed, walking endurance, participation or aerobic fitness among children with CP in the short or intermediate term. There is no research regarding the effect of aerobic exercise on participation or quality of life.
Resistance training does not appear to improve motor function, gait speed or participation in the short or intermediate term, or quality of life in the short term, in children and adolescents with CP but may improve muscle strength.
Mixed training does not improve motor function or gait speed but does improve participation in children and adolescents with CP in the short term.
We found no difference between aerobic and resistance training on motor function but a difference in muscle strength in the short term.
Although the evidence suggests that exercise might be safe for people with CP, only 16 trials (55%) included information on adverse events; these trials reported no serious adverse events. All of the studies we found had small numbers of participants, meaning that we cannot be sure the results are accurate.
Quality of the evidence
We judged the quality of evidence for all comparisons to be low or very low. All of the studies had small sample sizes. There were very few trials involving adults with CP or people with CP who could not walk, so our results may not apply to these groups of people. Few trials provided clear detail about the frequency, intensity and duration of exercise prescribed. Further research assessing the effectiveness of exercise for activity and participation is needed. Such research should determine if the amount and intensity of exercise prescribed to people with CP has an impact on its effectiveness, and whether current guidelines on exercise for the general population apply to people with CP.
Authors' conclusions
Summary of findings
| Aerobic exercise versus usual care | ||||||
| Patient or population: children and adolescents with cerebral palsy Setting: mixed (community, outpatients, home) | ||||||
| Outcomes | Anticipated absolute effects* (95% CI) | Relative effect | Number of participants | Quality of the evidence | Comments | |
| Risk with usual care | Risk with aerobic exercise | |||||
| Activity Gross motor function assessed with the Gross Motor Function Measure (follow‐up 0 to 1 month) | The mean gross motor function ranged across control groups from 0.20% to 65.13% | The standardised mean gross motor function in the intervention group was 0.53 higher (0.02 higher to 1.04 higher) | — | 65 | ⊕⊕⊝⊝ | Higher score indicates improved activity A rule of thumb for interpreting SMD is that 0.2 represents a small effect, 0.5 a moderate effect, and 0.8 a large effect (Cohen 1988) |
| Activity Gait speed assessed with a timed walk test (follow‐up 0 to 1 month) | The mean gait speed ranged across control groups from 0.63 m/s to 2.40 m/s | The mean gait speed in the intervention groups was0.09 m/s faster (0.11 m/s slower to 0.28 m/s faster) | — | 82 | ⊕⊝⊝⊝ | Higher speed indicates improved activity |
| *The risk in the intervention group (and its 95% CI) is based on the assumed risk in the comparison group and the relative effect of the intervention (and its 95% CI). | ||||||
| GRADE Working Group grades of evidence | ||||||
| aAll studies are at high risk of bias because it is not possible to blind personnel or participants to group allocation. | ||||||
| Resistance training versus usual care | ||||||
| Patient or population: children and adolescents with cerebral palsy | ||||||
| Outcomes | Anticipated absolute effects* (95% CI) | Relative effect | Number of participants | Quality of the evidence | Comments | |
| Risk with usual care | Risk with resistance training | |||||
| Activity Gross motor function assessed with the Gross Motor Function Measure (follow‐up 0 to 1 month) | The mean gross motor function ranged across control groups from 60.80% to 81.30% | The standardised mean gross motor function in the intervention groups was 0.12 higher (0.19 lower to 0.43 higher) | — | 164 | ⊕⊕⊝⊝ | A rule of thumb for interpreting the SMD is that 0.2 represents a small effect, 0.5 a moderate effect, and 0.8 a large effect (Cohen 1988) Higher score indicates improved activity |
| Activity Gross motor function assessed with the Gross Motor Function Measure (follow‐up > 1 month to 6 months) | The mean gross motor function ranged across control groups from 61.80% to 74.30% | The standardised mean gross motor function in the intervention groups was 0.13 higher (‐0.30 lower to 0.55 higher) | — | 85 | ⊕⊕⊝⊝ | A rule of thumb for interpreting SMD is that 0.2 represents a small effect, 0.5 a moderate effect, and 0.8 a large effect (Cohen 1988) Higher score indicates improved activity |
| Activity Gait speed assessed with a timed walk test (follow‐up 0 to 1 month) | The mean gait speed ranged across control groups from0.30 m/s to 1.17 m/s | The mean gait speed in the intervention groups was 0.03 m/s faster (0.02 m/s slower to 0.07 m/s faster) | — | 185 | ⊕⊕⊝⊝ | Higher speed indicates improved activity |
| Activity Gait speed assessed with a timed walk test (follow‐up > 1 month to 6 months) | The mean gait speed ranged across control groups from 0.68 m/s to 1.06 m/s | The mean gait speed in the intervention groups was 0.03 m/s slower (0.17 m/s slower to 0.11 m/s faster) | — | 84 | ⊕⊕⊝⊝ | Higher speed indicates improved activity |
| Participation Assessed with various measures (follow‐up 0 to 1 month) | The mean participation in the control group ranged from 7.40 to 31.14 | The standardised mean participation in the intervention groups was 0.34 higher (0.01 lower to 0.70 higher) | — | 127 (2) | ⊕⊕⊝⊝ Lowa,b,c | A rule of thumb for interpreting SMD is that 0.2 represents a small effect, 0.5 a moderate effect, and 0.8 a large effect (Cohen 1988) Higher score indicates improved participation |
| *The risk in the intervention group (and its 95% CI) is based on the assumed risk in the comparison group and the relative effect of the intervention (and its 95% CI). | ||||||
| GRADE Working Group grades of evidence | ||||||
| aAll trials are at high risk of bias because it is not possible to blind personnel or participants to group allocation. | ||||||
| Mixed training versus usual care | ||||||
| Patient or population: children and adolescents with cerebral palsy | ||||||
| Outcomes | Anticipated absolute effects* (95% CI) | Relative effect | Number of participants | Quality of the evidence | Comments | |
| Risk with usual care | Risk with mixed training | |||||
| Activity Gross motor function assessed with the Gross Motor Function Measure (follow‐up 0 to 1 month) | The mean gross motor function in the control groups ranged from 30.76% to 90.11% | The standardised mean gross motor function in the intervention groups was 0.02 higher (0.29 lower to 0.33 higher) | — | 163 | ⊕⊕⊝⊝ | A rule of thumb for interpreting SMD is that 0.2 represents a small effect, 0.5 a moderate effect, and 0.8 a large effect (Cohen 1988) Higher score indicates improved activity |
| *The risk in the intervention group (and its 95% CI) is based on the assumed risk in the comparison group and the relative effect of the intervention (and its 95% CI). | ||||||
| GRADE Working Group grades of evidence | ||||||
| aAll trials are at high risk of bias because it is not possible to blind personnel or participants to group allocation. | ||||||
| Resistance training versus aerobic exercise | ||||||
| Patient or population: children with cerebral palsy | ||||||
| Outcomes | Anticipated absolute effects* (95% CI) | Relative effect | Number of participants | Quality of the evidence | Comments | |
| Risk with aerobic exercise | Risk with resistance training | |||||
| Activity Gross motor function assessed with various measures (follow‐up 0 to 1 month) | The mean gross motor function in the aerobic exercise groups ranged from 44.09% to 63.30% | The standardised mean gross motor function in the intervention groups was 0.02 higher (0.50 lower to 0.55 higher) | — | 56 | ⊕⊕⊝⊝ | Higher score indicates improved activity |
| *The risk in the intervention group (and its 95% CI) is based on the assumed risk in the comparison group and the relative effect of the intervention (and its 95% CI). | ||||||
| GRADE Working Group grades of evidence | ||||||
| aAll trials are at high risk of bias because it is not possible to blind participants or personnel to group allocation. | ||||||
Background
Description of the condition
Cerebral palsy (CP) is defined as "a group of permanent disorders of the development of movement and posture, causing activity limitation, that are attributed to non‐progressive disturbances that occurred in the developing fetal or infant brain" (Rosenbaum 2007, p 11). Children with CP may also present with cognitive impairments, hearing and visual impairments, communication difficulties and epilepsy (Rosenbaum 2007). Most children with CP are diagnosed at around one to two years of age (Ashwal 2004; Herskind 2015), following a medical history and physical examination that identify a non‐progressive motor deficit (Ashwal 2004; Rosenbaum 2007). Neuroimaging techniques, preferably magnetic resonance imaging (MRI), may be used in conjunction with the history and physical examination to establish aetiology and prognosis (Ashwal 2004).
CP is the most common form of childhood disability, with reported prevalence rates of between 1.5 and 3.8 per 1000 live births in different areas of Europe and the USA (SCOPE 2002; Kirby 2011). The prevalence of CP varies not only by geographical location but also by birth weights and gestational age, with higher prevalence rates reported in children born preterm or at low birth weight (Platt 2007; Sellier 2010; Andersen 2011). Other factors associated with CP include multiple births, maternal infection during pregnancy, having a relative with CP, breech position and placental abruption (O'Callaghan 2011; Tollånes 2014; Trønnes 2014). The prevalence of severe CP in Europe, defined by an inability to walk and a severe intellectual disability, is approximately 0.43 per 1000 live births (SCOPE 2002). Children without severe impairments are expected to live well into adulthood (Strauss 1998a; Blair 2001; Brooks 2014). Although less is known about the life expectancy of adults with CP, evidence suggests that adults with CP who maintain a high level of function have a slightly lower life expectancy than the general population (Strauss 1998b; Brooks 2014).
The primary impairments associated with CP include reduced muscle strength (Riad 2012; Nooijen 2014), reduced cardiorespiratory fitness (Verschuren 2010; Nieuwenhuijsen 2011; Nooijen 2014), and poor selective motor control (Østensjø 2004). As a result of these impairments, people with CP may have difficulty performing everyday activities such as eating, dressing, walking, running, jumping and negotiating stairs (Østensjø 2004; Ross 2007; Opheim 2009; Klingels 2012). Intensive rehabilitation is often provided in childhood to improve gross motor function. Indeed, many children who are non‐ambulatory at age two to three years will be ambulatory by the time they reach adolescence (Wu 2004). About 54% of five‐year‐old children in Europe and 56% of eight‐year‐old children in the USA are independently ambulatory despite having CP (Beckung 2008; Kirby 2011). However, a subsequent decline in gross motor function often occurs in adolescence and young adulthood (Bottos 2001; Sandström 2004; Hanna 2009; Kerr 2011). Up to 50% of adults with CP report experiencing deterioration in walking function from young adulthood (Bottos 2001; Opheim 2009). Adults with CP attribute deterioration in walking function to reduced muscle strength, reduced cardiorespiratory fitness, fatigue and pain (Jahnsen 2004; Opheim 2009). Conversely, adults who experience improvements or no change in walking function over time credit this to improvements in balance, muscle strength and cardiorespiratory fitness (Opheim 2009). Poor gross motor function may also contribute to reduced quality of life and unemployment, which is high among young adults with CP (Soyupek 2010; Verhoef 2014).
Although CP is defined by the presence of motor disorders, the clinical presentation of CP can vary considerably, making it difficult to compare individuals at one point in time or to evaluate changes in an individual's condition over time. Traditionally, CP has been classified according to the type of motor abnormality (for example, spasticity, dystonia, choreoathetosis, ataxia) and anatomical distribution of CP (for example, bilateral, unilateral) (Rosenbaum 2007). More recently, classification systems that allow categorisation of people with CP according to their level of functional impairment have been developed; the Gross Motor Function Classification System (GMFCS) and Manual Ability Classification System (MACS) are two such systems. The GMFCS is a five‐point scale that distinguishes between levels of motor function based on functional mobility and the need for assistive technology, particularly mobility aids (Palisano 1997; Palisano 2008). A full description of the GMFCS is presented in Appendix 1. To summarise, from six years of age children in level I of the GMFCS are able to walk indoors and outdoors without assistance and can perform gross motor skills such as running and jumping; children in level II can also walk indoors and outdoors without assistance but have only minimal ability to perform gross motor skills like running and jumping; children in level III require a mobility device to walk indoors and outdoors and may require wheeled mobility for travelling long distances; children in level IV use wheeled mobility in most settings; children in level V are limited in their ability to maintain antigravity head and trunk postures and to control arm and leg movements, and they are transported in a manual wheelchair in all settings. Although developed for children with CP, the GMFCS has been used successfully to classify motor function in adults with CP (Sandström 2004). For its part, the MACS is a five‐point scale that classifies how children aged four years or older with CP use their hands when handling objects in daily activities (Eliasson 2006). A full description of the MACS is in Appendix 2. Children in level I of the MACS handle objects easily and successfully. They may have limitations in the ease of performing tasks that require speed and accuracy. Children in level II handle most objects but with reduced quality, speed or both. Children in level III have difficulty handling objects and need help to prepare or modify activities. Children in level IV can only handle a limited selection of easily managed objects in adapted situations and require continuous support and assistance.
Description of the intervention
Exercise is defined as "physical activity that is planned, structured, repetitive, and purposive in the sense that improvement or maintenance of one or more components of physical fitness is an objective" (Caspersen 1985, p 128). The components of physical fitness that exercise may improve include muscle strength, muscle endurance and cardiorespiratory fitness. The focus of this review will be on exercise interventions categorised as resistance training or aerobic training. Resistance training involves the body's muscles working or holding against an applied force. Body weight, free weights, machine weights, and elastic bands are often used to apply force (USDHHS 2008). Current guidelines for resistance training to improve muscle strength for youth suggest that one to three sets of 6 to 15 repetitions of a muscle strengthening exercise should be performed at an intensity of 50% to 85% of one repetition maximum (RM) (i.e. the maximum weight a person can lift with one repetition) (Faigenbaum 2009). Alternatively, if people do not perform one RM tests, therapists can establish the intensity by prescribing a repetition range and determining the maximum load that people can lift for the prescribed range. Current guidelines for adults suggest that in order to improve muscle strength, inexperienced people should perform one to three sets of 8 to 12 repetitions of a muscle strengthening exercise at loads corresponding to 60% to 70% of one RM (American College of Sports Medicine 2009). People should engage in resistance training on two to three days per week (American College of Sports Medicine 2009; Faigenbaum 2009), and at least eight weeks of training are required to observe an increase in muscle strength (Faigenbaum 2009). Aerobic training involves moving the body's large muscles in a rhythmic manner for a sustained period of time (USDHHS 2008). Walking, running, cycling and arm ergometry are examples of aerobic exercise. Current guidelines for aerobic exercise to improve cardiorespiratory fitness suggest that people with CP should engage in aerobic exercise two to three times per week at an intensity of 60% to 95% of peak heart rate, between 40% to 80% of heart‐rate reserve (HRR) or between 50% and 65% of VO2 peak (i.e. maximum oxygen consumption), for at least 20 minutes per session (Verschuren 2016). Further, a training programme should continue for at least 8 consecutive weeks when training three times a week or for 16 consecutive weeks when training twice a week (Verschuren 2016). Many exercise programmes target muscle strength, anaerobic fitness, cardiorespiratory fitness or a combination of these components. We will refer to such programmes as 'mixed training'.
How the intervention might work
The goal of treatment for people with CP has shifted from targeting impairments of the motor system to targeting activity limitations and participation restriction, where activity is defined as a person's ability to execute a task, and participation is defined as a person's involvement in a life situation (WHO 2001). Indeed, people with CP have identified improving restricted mobility and poor upper limb function as primary therapeutic goals (Vargus‐Adams 2011). However, many experts believe there is an association between motor impairments, activity limitation and participation restriction, so targeting one may well affect another. There is evidence that impairments, particularly muscle strength, are associated with activity in children with CP (Østensjø 2004; Ross 2007; Voorman 2007; Verschuren 2009; Klingels 2012; Park 2013). Although less information is available about the association between cardiorespiratory fitness and activity, aerobic training, resistance training and mixed training have proven efficacy on activity in older adults (Liu 2009; Giné‐Garriga 2014), a population who experience similar declines in physical functioning as young adults with CP (Nusselder 2005; Day 2007). Improvements in activity provided by exercise may translate to improved participation in mobility‐based behaviours for people with CP (Park 2013; Bjornson 2014).
Exercise may also have benefits in terms of pain relief and quality of life for people with CP. Some adults report using exercise as a treatment for pain and find it moderately effective (Engel 2002; Hirsh 2011), which may positively impact on quality of life. Further, a positive association between physical activity and physical, behavioural, emotional and social quality of life has been reported in children with CP (Bjornson 2008; Maher 2016). As exercise is structured physical activity, the implementation of an exercise programme may result in improvements in quality of life for people with CP.
The aim of this review, to assess the effects of exercise interventions on activity, participation and quality of life in people with CP, reflects the goals of people with CP and their clinicians and therefore is of most interest to users of this review. While the association between physical fitness and activity suggests that improving physical fitness may improve activity, the physiological, biomechanical, and neuromuscular adaptations that may occur as a result of exercise training in people with CP are not understood. It is also possible that the effect of exercise on activity performance may vary according to the person's baseline level of functional ability. For example, improving muscle strength in children in GMFCS level III, who have reduced muscle strength compared to children in GMFCS level I (Eek 2008), may result in greater improvements in activity because of their greater potential for improvement. Conversely, improvements in muscle strength may be small in people with a greater degree of functional impairment because of their inability to exercise at an adequate intensity.
Why it is important to do this review
Although CP begins in childhood, it impacts the individual's whole life course as well as the healthcare system. Identifying appropriate interventions to alleviate disability throughout the life of a person with CP is urgent. Health professionals often recommend exercise for people with CP, partly because of its known importance for improving physical functioning in other populations. This is reflected in the growing number of publications on the topic of exercise in CP.
Ten reviews have investigated the effectiveness of exercise interventions in children with CP (Dodd 2002; Taylor 2005; Anttila 2008; Mockford 2008; Rogers 2008; Verschuren 2008; Scianni 2009; Butler 2010; Novak 2013; Rameckers 2014). Eight of these included articles published up to July 2008 (Dodd 2002; Taylor 2005; Anttila 2008; Mockford 2008; Rogers 2008; Verschuren 2008; Scianni 2009; Butler 2010); one included articles up to December 2012 (Novak 2013), and one included articles published up to August 2014 (Rameckers 2014). Four reviews focused solely on randomised controlled trials (RCTs) (Anttila 2008; Scianni 2009; Butler 2010; Rameckers 2014); the remaining six included experimental or quasi‐experimental studies. Nine reviews provided a narrative summary of the evidence (Dodd 2002; Taylor 2005; Anttila 2008; Mockford 2008; Rogers 2008; Verschuren 2008; Butler 2010; Novak 2013; Rameckers 2014). Only one review conducted a meta‐analysis of RCTs (Scianni 2009). However, this review specifically examined the effectiveness of muscle strengthening, rather than all exercise interventions, in children with CP.
Two reviews have investigated the effectiveness of exercise interventions in adults with CP (Dodd 2002; Jeglinsky 2010). These reviews included observational studies published up to March 2002 and 2009, respectively. Both reviews conducted descriptive analyses. One meta‐analysis specifically investigated the effect of strength training in children and adults with CP (Park 2014b).
An up‐to‐date and comprehensive assessment of the evidence surrounding exercise interventions in adults and children with CP is required to guide consumers, health professionals and policymakers.
Objectives
To assess the effects of exercise interventions in people with CP, primarily in terms of activity, participation and quality of life. Secondary outcomes assessed body functions and body structures. Comparators of interest were no treatment, usual care or an alternative type of exercise intervention.
Methods
Criteria for considering studies for this review
Types of studies
Randomised controlled trials (RCTs) and quasi‐RCTs (where sequence generation is systematically determined but not truly random, for example, based on order of entry or date of birth).
Types of participants
Children, adolescents and adults of any age with a diagnosis of CP, irrespective of level of functional ability (i.e. Gross Motor Function Classification System (GMFCS) levels I to V and the Manual Ability Classification System (MACS) levels I to IV).
Types of interventions
We included studies of exercise that met the definition in Caspersen 1985 (see Description of the intervention). We included studies of aerobic and resistance training and studies that used a combination of exercises, where at least one exercise was categorised as resistance training, aerobic training or anaerobic training (that is, 'mixed training'). We included interventions that targeted both the upper and lower limbs. We did not include studies of stretching interventions. We did not include studies of interventions, such as constraint‐induced movement therapy or bimanual therapy, where the intervention did not specifically target one or more components of physical fitness (i.e. muscle strength, muscle endurance and cardiorespiratory fitness).
Comparisons of interest were exercise versus no treatment, usual care or an alternative exercise intervention (e.g. a comparison of resistance training and aerobic exercise).
Types of outcome measures
Primary outcomes
-
Activity, defined as a person's ability to execute a task (WHO 2001). Examples of outcome measures for activity include the Gross Motor Function Measure 66‐ or 88‐item (GMFM‐66 or GMFM‐88; Russell 1989), Assisted Hand Assessment (AHA) (Krumlinde‐Sundholm 2003), timed walk tests, Melbourne Assessment of Unilateral Upper Limb Function (MAUULF; Randall 1999), ABILHAND‐Kids questionnaire (Arnould 2004), Activities Scale for Kids (ASK; Young 2000), International Physical Activity Questionnaire (IPAQ; Craig 2003), accelerometers, and pedometers. Subdomains of activity are:
-
activity capacity (i.e. a person's ability to execute a task in a standardised environment);
-
activity capability (i.e. a person's ability to execute a task in his or her daily environment); and
-
activity performance (i.e. what a person actually does in his or her environment) (Holsbeeke 2009).
-
-
Participation, defined as a person's involvement in a life situation. This may include participation in domestic life (e.g. acquiring a place to live or managing a household); employment or education; and community, social, and civic life (WHO 2001). Examples of outcome measures for participation include the Paediatric Evaluation of Disability Inventory (PEDI; Haley 1992), the Waisman Activities of Daily Living Scale (W‐ADL; Maenner 2013), and Assessment of Life Habits questionnaire (LIFE‐H; Fougeyrollas 1998).
-
Quality of life, defined as the impact of disease and treatment on physical, psychological and social functioning (Schipper 1996; Solans 2008), as measured by, for example, the Short Form‐36 (SF‐36) health survey (Ware 1993) and the Child Health Questionnaire (CHQ; Landgraf 1998).
-
Incidence and nature of adverse events such as injury, cardiac events, stiffness and delayed onset muscle soreness, where reported.
Secondary outcomes
-
Body functions and body structures, defined as changes in physiological systems or in anatomical structures (WHO 2001). These include:
-
muscle strength and endurance, as measured by, for example, dynamometry;
-
cardiorespiratory fitness, as measured by, for example, the Shuttle Run Test (SRT; Verschuren 2006);
-
pain, as measured by, for example, a visual analogue scale (VAS) (McCormack 1988);
-
fatigue, as measured by, for example, the Fatigue Severity Scale (Krupp 1989); and
-
depression, as measured by, for example, the Center for Epidemiological Studies ‐ Depression Scale (CES‐D; Radloff 1977).
-
As studies assessed change in a wide range of body structures and functions following exercise, we limited the included outcomes to those targeted by a specific exercise intervention. For example, for studies of resistance training, we reported the effect on muscle strength; for studies of aerobic exercise we reported the effect on aerobic fitness; for studies of mixed training, we reported the effect on muscle strength and aerobic and anaerobic fitness.
We planned to include studies that used any validated scale that measures these primary and secondary outcomes. However, as trials used a range of outcome measures to assess these outcomes, we included any measure that purported to assess them, regardless of whether or not it was validated specifically in people with CP. See Differences between protocol and review. We collected outcomes for the following time points: short term (zero to one month postintervention), intermediate term (more than one month and up to six months' postintervention), and long term (more than six months' postintervention). We presented all available results for the primary outcomes in 'Summary of findings' tables.
Search methods for identification of studies
Electronic searches
We searched all available years of the following databases in June 2016.
-
Cochrane Central Register of Controlled Trials (CENTRAL; 2016, Issue 5), in the Cochrane Library, which contains the Cochrane Developmental, Psychosocial and Learning Problem Specialised Register (searched 14 June 2016).
-
Ovid MEDLINE (1946 to June Week 1 2016).
-
Embase Ovid (1980 to 2016 Week 24).
-
CINAHL Plus EBSCOhost (Cumulative Index to Nursing and Allied Health Literature; 1937 to 14 June 2016).
-
Cochrane Database of Systematic Reviews (CDSR; 2016, Issue 6), part of the Cochrane Library.
-
Database of Abstracts of Reviews of Effects (DARE; 2015, Issue 2 ), part of the Cochrane Library (searched 15 May 2015; DARE was not updated after this date).
-
Science Citation Index Web of Science (1970 to 9 June 2016).
-
Conference Proceedings Citation Index ‐ Science Web of Science (CPCI‐S; 1990 to 9 June 2016).
-
LILACS (Latin American and Caribbean Health Science Information database; lilacs.bvsalud.org/en; searched 14 June 2016).
-
Health Services Research Projects in Progress (HSRPRoj; wwwcf.nlm.nih.gov/hsr_project/home_proj.cfm; searched 23 June 2016).
-
OpenGrey (www.opengrey.eu; searched 16 June 2016).
-
National Rehabilitation Information Center (www.naric.com; searched 23 June 2016).
-
PEDro ( Physiotherapy Evidence Database; www.pedro.org.au; searched 23 June 2016).
-
UKCRN Study Portfolio (public.ukcrn.org.uk/search; searched 16 June 2016).
-
ClinicalTrials.gov (clinicaltrials.gov; searched 16 June 2016).
-
World Health Organization International Clinical Trials Registry Platform (WHO ICTRP; www.who.int/ictrp/en; searched 20 June 2016).
We used the search strategy for MEDLINE Ovid, which incorporates the Cochrane highly sensitive search strategy for identifying randomised trials (Lefebvre 2011), and we adapted this strategy, as appropriate, for other sources. We did not limit searches by language, date or publication status. The strategy for each source is reported in Appendix 3. For a detailed record of the searches (including search dates and the number of records found in each source), see Appendix 4.
Searching other resources
We handsearched the reference lists of eligible trials and relevant systematic reviews identified from the search to identify additional studies.
Data collection and analysis
Selection of studies
Two review authors (JMR and EEC) independently checked the titles and abstracts of the search results and excluded studies that did not meet the inclusion criteria outlined above (Criteria for considering studies for this review). In cases that appeared to meet the inclusion criteria, or where there was any doubt as to whether we should have excluded the report, we retrieved the full text of the report. Two review authors (JMR and EEC) independently reviewed these papers against the inclusion criteria (Criteria for considering studies for this review), resolving any disagreements regarding the exclusion of a report at any stage through discussion, and where necessary, through consultation with a third review author (SN). We recorded our decisions in a PRISMA diagram (Moher 2009).
Data extraction and management
Two review authors (JMR and EEC) independently extracted data using a standardised form developed for the purpose. We resolved disagreements regarding the extraction of data by discussion. If we could not reach a resolution, we consulted a third review author (NEO'C). The form included the following information, where available.
-
Country of origin.
-
Study design.
-
Sample size: treatment and control groups.
-
Study population (treatment and control groups): sex, age, ethnicity, distribution of CP, type of motor abnormality and gross motor function. Where sufficient information was provided, we classified children and adults according to GMFCS level and MACS level, as these scales provide a comprehensive indication of functional ability above that provided by classifying individuals according to type of motor abnormality and anatomical distribution of CP. Although we proposed to classify general gross motor function as unaided walking, walking with aids or unable to walk (Beckung 2008), most studies reported the GMFCS level of participants. Therefore, we reported the GMFCS level where available and use of mobility aids when the GMFCS level was not available.
-
Intervention: aim of the intervention, type of exercise programme (e.g. aerobic exercise), mode of delivery (e.g. home programme), type(s) of location(s) where the intervention occurred (including any necessary infrastructure or relevant features), supervised or unsupervised programme, exercise mode (e.g. cycle ergometry, treadmill), exercise dose (i.e. duration, intensity, and frequency of exercise), tailoring of intervention to individual, modification of intervention (what, why, when, how), duration of programme. Following data extraction, we combined information on modification of the intervention with information on tailoring of the intervention to individual to create one category.
-
Intervention provider: profession, expertise, background, specific training received.
-
Fidelity or adherence to programme: how or by whom this was assessed.
-
Outcome measures (Types of outcome measures).
-
Results: short‐term (zero to one month postintervention), intermediate‐term (greater than one month to six months' postintervention), and long‐term (more than six months' postintervention) follow‐up.
-
Measures of adherence to the exercise programme.
-
Adverse effects.
-
Conflicts of interest.
-
Declarations of conflicts of interest.
-
Sources of funding.
Assessment of risk of bias in included studies
Two review authors (JMR and EEC) independently assessed risk of bias using Cochrane's tool for assessing risk of bias (Higgins 2011a). A third review author (SN) resolved any persistent disagreements between them. We assessed the following domains: random sequence generation, allocation concealment, blinding of participants and personnel, blinding of outcome assessment, incomplete outcome data, selective reporting and other sources of bias. We scored all domains as being at low, high or unclear risk of bias. We present operational definitions for making judgements on each domain in Appendix 5.
We assigned included studies an overall rating of high, low or unclear risk of bias. Where we rated one or more domains at high risk of bias, we rated the study at high risk of bias overall. Where we did not rate a study at high risk of bias for any domain but rated it at unclear risk of bias for one or more domains, we rated that study at unclear risk of bias overall. We rated a study at low risk of bias overall if we rated it as low risk of bias for all domains.
Measures of treatment effect
Dichotomous data
No study used dichotomous outcomes. Table 1 outlines our plans for dealing with such data and other methodological decisions that were not possible or appropriate to deploy, should it be necessary to use these methods in future updates of this review. Please also see our protocol (Ryan 2015).
| Binary data | We planned to present the relative risk (or risk ratio) with a 95% confidence interval, and calculate the number needed to treat for an additional beneficial outcome as an absolute measure of treatment effect. We will report the odds ratio (OR) with a 95% confidence interval in future updates of this review, as most studies with a dichotomous outcome report the OR. |
| Cluster trials | We planned to seek direct estimates of the effect from an analysis that accounted for cluster design. Where the analysis in a cluster trial did not account for the cluster design, we planned to use the approximately correct analysis approach, presented in the Cochrane Handbook for Systematic Reviews of Interventions (Higgins 2011c). |
| Crossover trials | Where studies presented repeated measurements over time, we planned to only include data from 1 time point from an individual study in any single meta‐analysis. If inadequate data were available to conduct this analysis, we planned to only include data from the first phase of the cross‐over trial, as if it were from a parallel trial design. We planned to combine the results of cross‐over studies with those of parallel studies by imputing the post‐treatment, between‐condition correlation coefficient from an included study that presents individual participant data, and use this to calculate the standard error of the SMD, using the generic inverse‐variance method. |
| Assessment of reporting biases | Where we identified evidence of publication bias, we planned to consider its likely influence on the observed effect sizes in our interpretation of the results. However, as common tests of publication bias lack sensitivity, we planned to consider the possible influence that a dominance of small trials might have on pooled effect sizes in our interpretation. |
| Subgroup analysis and identification of heterogeneity | We planned to further explore possible clinical heterogeneity through preplanned subgroup analysis based on important clinical features. We predicted that some trials would include ambulatory participants only (i.e. people who could walk with or without a mobility aid; GMFCS level I, II, and III), and some studies would include participants who could walk without a mobility aid only (i.e. GMFCS level I and II). Where adequate data allowed, we planned to undertake 2 subgroup analyses for studies that included ambulatory people only (i.e. GMFCS level I, II, and III), and for studies that included ambulatory people who walk without a mobility aid only (i.e. GMFCS level I and II). |
| Sensitivity analysis | We planned to explore the impact of studies at high risk of bias by reanalysis after excluding studies rated at overall high risk of bias. We also planned to explore the impact of excluding studies at high risk of bias for missing data through reanalysis. We planned to explore the influence of using imputed correlation coefficients in our approach to including cross‐over and cluster trials by reanalysing these data with adjusted (higher and lower) coefficient values. |
GMFCS: Gross Motor Function Classification System; SMD: standardised mean difference.
Continuous data
Where pooled studies used the same scale on a continuous outcome measure, we presented the effect size as a mean difference (MD) with 95% confidence intervals (CI). Where studies used different scales to measure the same construct or used different versions of an outcome measure that scored the outcome differently, we presented the standardised mean difference (SMD) with 95% CI. We used a rule of thumb to interpret the magnitude of effect for the SMD: 0.2 represents a small effect, 0.5 a moderate effect, and 0.8 a large effect (Cohen 1988).
Clinically important differences
Clinically important differences have been developed for a number of outcome measures (for example, GMFM, weeFIM, one‐minute walk test) for ambulatory children and adolescents (GMFCS levels I to III) aged 4 to 19 years old (Oeffinger 2008; Hassani 2014). However, there are no well‐established and accepted thresholds for clinically important differences across the range of possible outcome measures and possible participants. Where possible, our discussion of the results considered the size of effects for our primary outcomes in light of contemporary research literature on clinically important differences.
Unit of analysis issues
Cluster‐randomised trials
We did not include any cluster‐randomised trials in this review. See our protocol, Ryan 2015, and Table 1 for details of methods archived for use in future updates of this review.
Cross‐over trials
We identified only one cross‐over trial from which we were unable to include any data. See Ryan 2015 and Table 1 for details of methods archived for use in future updates of this review.
Studies with multiple treatment groups
Where studies included multiple treatment groups, we combined results across all eligible intervention groups and compared them with the combined results across all eligible control groups, making single pairwise comparisons.
Dealing with missing data
Where the report of an included study presented insufficient data to enter into the meta‐analysis, we requested access to missing data from the authors with two reminder requests sent at monthly intervals in the event of non‐response. We specifically requested data relating to the effect of the intervention (e.g. means and standard deviations (SDs)) on any of the outcomes of interest (e.g. adverse events) and details of dropouts. We did not routinely request other methodological details or information relating to the 'Risk of bias' assessments. See Ryan 2015 and Table 1 for details of methods archived for use in future updates of this review. We conducted analyses using only the available data; we did not impute missing data.
Assessment of heterogeneity
We assessed clinical variation across studies by comparing the distribution of important factors among trials (for example, participant age, sex, and functional ability (GMFCS level), characteristics of the interventions). We assessed statistical heterogeneity and its impact using the Chi2 test and the I2 statistic (Deeks 2011). We used the Chi2 test to determine whether differences in effects across studies are compatible with chance alone and the I2 statistic to describe the percentage of the variability in effect estimates that was due to heterogeneity rather than sampling error (chance).
Assessment of reporting biases
We considered the possible influence of publication and small‐study biases on review findings. Where we identified sufficient data (equal to or greater than 10 studies in a meta‐analysis), we examined funnel plots and used the test proposed by Egger 1997 to test for funnel plot asymmetry.
Data synthesis
We pooled the results from included studies using Review Manager 5 (RevMan 5) software (Review Manager 2014). Comparisons of interest were exercise versus no treatment or usual care, and comparisons of one type of exercise intervention versus another. We did not pool data from these two comparisons together in a single meta‐analysis. We believe that the effect sizes for each of these comparisons are likely to vary considerably and that it is not theoretically justifiable to include exercise and usual care in one comparison group. Where studies compared two types of exercise interventions, we interpreted and discussed the results in the context of the evidence, or lack of evidence, of the effectiveness of each exercise intervention compared to usual care or no treatment.
We attempted to deal with clinical heterogeneity by performing separate meta‐analyses for each category of exercise intervention (i.e. resistance training, aerobic training and mixed training). We believe that the type of exercise performed could impact the effect size and that combining these interventions could mask the true effect of each individual intervention. We performed separate meta‐analyses for studies in children and adolescents versus adults. We defined children as aged 19 years and below, adolescents as individuals aged 10 to 19 years inclusive, and adults as aged 20 years and older (WHO 2013). We report the results for adults and for children and adolescents as a group as the majority of studies included children and adolescents, as opposed to children or adolescents only.
We used a random‐effects model to combine studies since we expected studies to vary somewhat in terms of the interventions, comparisons and populations. We considered separate meta‐analyses for different types of exercise intervention and for short‐term (zero to one month postintervention), intermediate‐term (more than one month to six months' postintervention), and long‐term (more than six months' postintervention) outcomes. Where meta‐analyses were not possible, we conducted a narrative synthesis of the data. We also considered contextual data in our interpretation of the evidence.
There was large variation between studies in terms of the muscle groups targeted by interventions and the muscle groups whose strength investigators assessed as an outcome measure. We therefore applied the following rules for extracting outcome data to be included in the pooled analysis. Where resistance training targeted one muscle group in the lower limbs, we extracted data on a continuous scale for the targeted muscle group. Where resistance training interventions targeted multiple muscle groups in the lower limbs and assessed the strength of multiple muscle groups, we extracted data on a continuous scale for the knee extensors. We chose to extract data on the knee extensors because the knee extensors were the most commonly trained and assessed muscle group. Where exercises targeted right and left limbs and presented data on each limb individually, we took the data from the right limb. Where concentric and eccentric muscle strength was trained and assessed, we took data on concentric muscle strength, as this was more common. Where data on muscle strength at multiple speeds was presented, we took data for muscle strength assessed at 60°/second as this was the most consistently assessed speed across trials. Where trials of lower limb resistance training, aerobic training or mixed training (that included lower limb resistance training) assessed activity using the GMFM‐88 or GMFM‐66, we extracted the combined score (%) for dimensions D and E (i.e. standing, walking, running and jumping), as studies often only assessed activities in dimensions D and E. If this was not available, we extracted the individual score (%) for dimension E (i.e. walking, running and jumping), and if this was not available, we extracted the total score (%) for the GMFM‐88 or GMFM‐66.
Subgroup analysis and investigation of heterogeneity
Due to the small number of trials that could be included in each meta‐analysis, we did not conduct subgroup analysis. See Ryan 2015 and Table 1 for our published strategy for subgroup analysis and investigation of heterogeneity.
Sensitivity analysis
We assessed the influence of our analysis model by reanalysing data using a fixed‐effect model instead of a random‐effects model. Other planned sensitivity analyses were not possible. Please see Ryan 2015 and Table 1 for our published strategy for exploring the impact of studies at high risk of bias due to missing data, and the influence of using imputed correlation coefficients in meta‐analyses including cross‐over and cluster trials.
Summary of findings table
Two authors (JMR, EEC) used the GRADE approach to assess the quality of the body of evidence (Guyatt 2008). To ensure consistency of GRADE judgements, we applied the criteria below to each domain equally for all key comparisons.
-
Limitations of studies: downgrade once if less than 75% of included studies are at low risk of bias across all 'Risk of bias' domains.
-
Inconsistency: downgrade once if heterogeneity is statistically significant (P < 0.10) and I2 > 40%.
-
Indirectness: downgrade once if more than 50% of the participants are outside the target group.
-
Imprecision: downgrade once if fewer than 400 participants for continuous data and fewer than 300 events for dichotomous data (Guyatt 2011).
-
Publication bias: downgrade where there is direct evidence of publication bias.
We presented the GRADE judgements for all outcomes for comparisons of aerobic exercise versus usual care, resistance training versus usual care, mixed training versus usual care, and aerobic exercise versus resistance training, in the Effects of interventions section. We also presented GRADE ratings for outcomes where there were sufficient data to conduct meta‐analyses for comparisons of aerobic exercise versus usual care, resistance training versus usual care, mixed training versus usual care, and aerobic exercise versus resistance training in 'Summary of findings' tables, which we constructed using GRADEpro GDT 2014.
See summary of findings Table for the main comparison; summary of findings Table 2; summary of findings Table 3; summary of findings Table 4.
Results
Description of studies
Results of the search
We ran our searches in May 2015 and updated them in June 2016. Our searches yielded 11,100 original research studies, reviews and abstracts from databases and a further three reports from additional sources (Seniorou 2007; Nsenga Leunkeu 2013; Mitchell 2016). After removing duplicates, we screened the titles and abstracts of the remaining 8071 records against our inclusion criteria (Criteria for considering studies for this review) and retrieved 145 full‐text reports for further assessment. We used translators to evaluate two reports published in languages other than English. We excluded 99 studies (102 reports) that did not meet the inclusion criteria (see Excluded studies; Characteristics of excluded studies tables) and included 29 studies (from 37 reports) in the review (see Included studies; Characteristics of included studies tables). One additional trial, Carlon 2014, was only available as a conference abstract and is described in the Characteristics of studies awaiting classification tables. We also identified five ongoing trials (Gillett 2015; ISRCTN90378161; NCT02754128; NCT02766491; RBR‐5rh6cg), which we describe in Characteristics of ongoing studies tables. Figure 1 presents a summary flow diagram.

8071‐7926‐Study flow diagram.
Included studies
This review includes 29 studies from 37 reports (McCubbin 1985; Van den Berg‐Emons 1998; Dodd 2003; Engsberg 2006; Unger 2006; Liao 2007; Seniorou 2007; Unnithan 2007; Verschuren 2007; Lee 2008; Chrysagis 2009; Maeland 2009; Fowler 2010; Reid 2010; Scholtes 2010; Gharib 2011; Johnston 2011; Olama 2011; Pandey 2011; Smania 2011; Bryant 2013; Chen 2012; Chrysagis 2012; Mattern‐Baxter 2013; Taylor 2013; Tedla 2014; Emara 2015; Lee 2015; Mitchell 2016). We provided a detailed description of each included study in the Characteristics of included studies tables.
Design
All included trials were RCTs. One trial used a randomised cross‐over design (Reid 2010). One trial allowed participants to continue or cross‐over into the exercise training programme after nine months of training (Van den Berg‐Emons 1998); we analysed this trial up to the point at which the participants were allowed to cross over. Two trials were quasi‐randomised (Unnithan 2007; Mattern‐Baxter 2013). Twenty‐six trials contained two arms (Van den Berg‐Emons 1998; Dodd 2003; Unger 2006; Liao 2007; Seniorou 2007; Unnithan 2007; Verschuren 2007; Lee 2008; Chrysagis 2009; Maeland 2009; Fowler 2010; Reid 2010; Scholtes 2010; Gharib 2011; Johnston 2011; Olama 2011; Pandey 2011; Smania 2011; Chen 2012; Chrysagis 2012; Mattern‐Baxter 2013; Taylor 2013; Tedla 2014; Emara 2015; Lee 2015; Mitchell 2016), two trials contained three arms (McCubbin 1985; Bryant 2013), and one trial contained four arms (Engsberg 2006).
Participants
The 29 trials involved a total of 926 participants. The number of participants per trial ranged from 12 in Chrysagis 2009 to 102 in Mitchell 2016. We judged 24 trials to be small (N < 50) (McCubbin 1985; Van den Berg‐Emons 1998; Dodd 2003; Engsberg 2006; Unger 2006; Liao 2007; Seniorou 2007; Unnithan 2007; Lee 2008; Chrysagis 2009; Maeland 2009; Reid 2010; Gharib 2011; Johnston 2011; Olama 2011; Pandey 2011; Smania 2011; Chen 2012; Chrysagis 2012; Bryant 2013; Mattern‐Baxter 2013; Taylor 2013; Emara 2015; Lee 2015), four trials to be medium sized (between 50 and 100 participants) (Verschuren 2007; Fowler 2010; Scholtes 2010; Tedla 2014), and one trial to be large (≥ 100 participants) (Mitchell 2016). The exact number of participants in Olama 2011 was unclear, as authors provided contradictory information. All participants had a diagnosis of CP. Two trials included children only (aged less than 10 years) (Mattern‐Baxter 2013; Emara 2015), six trials included adolescents only (aged 10 to 19 years) (Unger 2006; Unnithan 2007; Gharib 2011; Olama 2011; Smania 2011; Chrysagis 2012), 17 trials included children and adolescents up to the age of 20 years (Van den Berg‐Emons 1998; Dodd 2003; Engsberg 2006; Liao 2007; Seniorou 2007; Lee 2008; Fowler 2010; Reid 2010; Scholtes 2010; Johnston 2011; Pandey 2011; Chen 2012; Bryant 2013; Tedla 2014; Lee 2015; Mitchell 2016; Verschuren 2007), three trials included adolescents and young adults from the age of 14 to 22 years (McCubbin 1985; Chrysagis 2009; Taylor 2013), and one trial included adults over the age of 20 years (Maeland 2009). All trials included males and females. The mean percentage of males and females in the included studies was 53% (SD 10%; range 31% to 67%) and 47% (SD 10%; range 33% to 69%), respectively.
Twenty‐six trials included people with spastic CP (Van den Berg‐Emons 1998; Dodd 2003; Engsberg 2006; Unger 2006; Liao 2007; Seniorou 2007; Unnithan 2007; Verschuren 2007; Lee 2008; Chrysagis 2009; Maeland 2009; Fowler 2010; Reid 2010; Scholtes 2010; Gharib 2011; Johnston 2011; Olama 2011; Pandey 2011; Smania 2011; Chen 2012; Chrysagis 2012; Taylor 2013; Tedla 2014; Emara 2015; Lee 2015; Mitchell 2016). Of these, 10 specifically included people with spastic diplegia (Dodd 2003; Engsberg 2006; Liao 2007; Seniorou 2007; Unnithan 2007; Maeland 2009; Fowler 2010; Taylor 2013; Tedla 2014; Emara 2015), one included children with unilateral CP only (Mitchell 2016), two did not state if participants had unilateral or bilateral CP (Pandey 2011; Lee 2015), and the remainder included participants with unilateral and bilateral spastic CP (Van den Berg‐Emons 1998; Unger 2006; Verschuren 2007; Lee 2008; Chrysagis 2009; Reid 2010; Scholtes 2010; Gharib 2011; Johnston 2011; Olama 2011; Smania 2011; Chen 2012; Chrysagis 2012). One trial included children with dyskinetic and spastic (unilateral and bilateral) CP (Bryant 2013), one trial included children with spastic and hypotonic CP (Mattern‐Baxter 2013), and one trial included children with spastic, athetoid, ataxic and mixed CP (McCubbin 1985).
Eight trials included people classified in GMFCS levels I, II and III (Dodd 2003; Engsberg 2006; Seniorou 2007; Chrysagis 2009; Fowler 2010; Scholtes 2010; Chrysagis 2012; Lee 2015). Six trials included people classified in GMFCS levels I and II (Liao 2007; Verschuren 2007; Lee 2008; Chen 2012; Mattern‐Baxter 2013; Mitchell 2016). Two trials included people in GMFCS levels I, II, III and IV (Smania 2011; Tedla 2014). One trial included people in GMFCS level II only (Gharib 2011), two included people in GMFCS levels II and III (Maeland 2009; Taylor 2013), one included people in GMFCS levels II, III and IV (Johnston 2011), and one included people in GMFCS levels IV and V (Bryant 2013). Eight trials did not state participants' GMFCS level (McCubbin 1985; Van den Berg‐Emons 1998; Unger 2006; Unnithan 2007; Olama 2011; Pandey 2011; Emara 2015; Reid 2010). Of these, three trials stated that participants were able to walk with or without aids or that they occasionally used a wheelchair (Unger 2006; Unnithan 2007; Pandey 2011), one trial stated that participants were able to walk independently (Olama 2011), and one trial reported including people who were both ambulant and wheelchair bound (Van den Berg‐Emons 1998). Two trials reported the number of participants classified in each MACS level; participants were in MACS levels I, II and III (Reid 2010; Mitchell 2016).
Only one trial reported the ethnicity of participants, which included African Americans, whites, Asians and others (Fowler 2010).
Settings
Trials took place in a number of geographical locations: Australia (Dodd 2003; Reid 2010; Taylor 2013; Mitchell 2016), Egypt (Gharib 2011; Olama 2011), Greece (Unnithan 2007; Chrysagis 2009; Chrysagis 2012), India (Pandey 2011), Italy (Smania 2011), Korea (Lee 2008; Lee 2015), Norway (Maeland 2009), Saudi Arabia (Tedla 2014; Emara 2015), South Africa (Unger 2006), Taiwan (Liao 2007; Chen 2012), the Netherlands (Van den Berg‐Emons 1998; Verschuren 2007; Scholtes 2010), the UK (Seniorou 2007; Bryant 2013), and the USA (McCubbin 1985; Engsberg 2006; Fowler 2010; Johnston 2011; Mattern‐Baxter 2013).
Interventions
Aerobic exercise
Six trials compared aerobic exercise to usual care (Van den Berg‐Emons 1998; Chrysagis 2009; Gharib 2011; Smania 2011; Chrysagis 2012; Emara 2015). One trial compared aerobic exercise to a physical therapy session, the content of which was not clear (Mattern‐Baxter 2013). One trial with three arms compared aerobic exercise on a static bike, aerobic exercise on a treadmill and usual care (Bryant 2013). Modes of aerobic exercise included swimming; cycling on a stationary bike; wheelchair driving; negotiating stairs; and walking or running on a gait trainer, treadmill or overground.
Resistance training
Ten trials compared lower limb resistance training to usual care, active movements without resistance or no physiotherapy (Dodd 2003; Liao 2007; Seniorou 2007; Lee 2008; Maeland 2009; Scholtes 2010; Pandey 2011; Taylor 2013; Lee 2015; Mitchell 2016). Two trials compared upper limb, lower limb, and trunk resistance training to usual care (Unger 2006; Tedla 2014).
One trial with four arms compared resistance training of the dorsiflexors, plantarflexors, plantar and dorsiflexors verus no resistance training (Engsberg 2006). Two trials compared upper limb strength training to normal activity or active movements without resistance (McCubbin 1985; Reid 2010).
Mixed training
Four trials compared mixed training to usual care (Unnithan 2007; Verschuren 2007; Fowler 2010; Chen 2012). Mixed training consisted of aerobic and lower limb resistance training (Fowler 2010; Chen 2012); upper and lower limb and trunk resistance training and aerobic exercise (Unnithan 2007); and aerobic, anaerobic and general strength training (Verschuren 2007).
Two trials compared aerobic exercise to resistance training, either of the trunk, upper and lower limbs (Johnston 2011), or of the lower limbs only (Olama 2011).
Duration, frequency and intensity of interventions
The duration of aerobic exercise programmes ranged from two weeks (Smania 2011) to nine months (Van den Berg‐Emons 1998). The duration of resistance training programmes ranged from 4 weeks (Pandey 2011) to 20 weeks (Mitchell 2016). The duration of mixed training programmes ranged from 12 weeks (Unnithan 2007; Fowler 2010; Chen 2012) to 8 months (Verschuren 2007). The duration of interventions in one trial comparing aerobic exercise to lower limb resistance training was 12 weeks (Johnston 2011). It was not clear how long the intervention was in a second trial comparing aerobic exercise to resistance training, as authors provided contradictory information (Olama 2011).
Aerobic exercise
For aerobic interventions, participants were prescribed the intervention for two days per week (Verschuren 2007; Chrysagis 2009), three days per week (Unnithan 2007; Fowler 2010; Gharib 2011; Chen 2012; Chrysagis 2012; Bryant 2013; Emara 2015), four days per week (Van den Berg‐Emons 1998), five days per week (Johnston 2011; Smania 2011), six days per week (Mattern‐Baxter 2013), or seven days per week (Olama 2011). The prescribed duration of exercise per session ranged from 12 min to 60 min. One trial did not report duration of exercise (Olama 2011). The intensity of aerobic exercise was unclear or not reported in eight trials (Verschuren 2007; Chrysagis 2009; Gharib 2011; Johnston 2011; Olama 2011; Chen 2012; Bryant 2013; Mattern‐Baxter 2013). One trial reported that participants were prescribed walking "at a comfortable speed" (Chrysagis 2012), and one trial reported that participants were prescribed walking at 75% of their comfortable walking speed (Emara 2015). Two trials did not report the intensity prescribed but reported that walking speed gradually increased throughout the programme (Smania 2011), and that the mean time spent at > 70% of heart rate reserve was 49% (SD 17%) when heart rate was randomly measured in participants during the intervention (Van den Berg‐Emons 1998). Two trials prescribed an intensity of 65% to 75% of heart rate maximum and 70% to 80% of heart rate reserve, respectively (Unnithan 2007; Fowler 2010).
Seven trials did not report fidelity to the intervention (Unnithan 2007; Chrysagis 2009; Gharib 2011; Olama 2011; Smania 2011; Chen 2012; Emara 2015), although one reported excluding participants from the analysis if they missed more than three of the prescribed sessions (Gharib 2011). Six trials reported attendance at sessions (Van den Berg‐Emons 1998; Verschuren 2007; Fowler 2010; Chrysagis 2012; Bryant 2013; Mattern‐Baxter 2013); the average adherence to the prescribed number of sessions across trials ranged from 77.0% to 93.0%. One trial also reported the average time walked per session (Mattern‐Baxter 2013), which was 28.2 min a day (range 9.6 min a day to 39.3 min a day) out of a prescribed 20.0 to 40.0 min a day. Only one trial reported fidelity to the intensity of the intervention, reporting that the mean percentage of heart‐rate maximum attained during sessions was 52.2% (SD 12.2%; range 8% to 77%) (Fowler 2010).
Resistance training
For resistance training interventions, participants were prescribed the intervention for one to three days a week (Unger 2006), two days per week (Verschuren 2007; Pandey 2011; Taylor 2013), three days a week (McCubbin 1985; Dodd 2003; Liao 2007; Seniorou 2007; Unnithan 2007; Maeland 2009; Fowler 2010; Reid 2010; Scholtes 2010; Olama 2011; Chen 2012; Tedla 2014; Lee 2015), five days a week (Johnston 2011), or six days a week (Mitchell 2016). Therapists prescribed the following sets, repetitions and intensity: two sets of 10 repetitions to fatigue (although only 0.25 kg, 0.45 kg or 0.90 kg weights were used) (Lee 2008); two sets of 10 repetitions at 75% of one RM (Chen 2012); three sets of eight repetitions at 0% to 100% of eight RM (Scholtes 2010); three sets of 10 repetitions at an intensity that was not reported, 50% to 70% of maximum torque, or 10 RM, respectively (McCubbin 1985; Seniorou 2007; Reid 2010); three sets of 8 to 10 repetitions at 8 to 12 RM (Dodd 2003); three sets of 10 to 12 repetitions at 60% to 80% of one RM (Taylor 2013); three sets of 6 to 10 repetitions at 80% of one RM (Tedla 2014); four sets of 12 to 15 repetitions at 60% to 75% of one RM and four to six repetitions at 85% of one RM (Maeland 2009); one to three sets of 6 to 12 repetitions to fatigue (Unger 2006); six sets of five repetitions at 80% or more of one RM (Engsberg 2006); 7 to 11 activities with 5 to 10 repetitions or 20 repetitions, depending on the exercise, at 75% of one RM (Mitchell 2016); two sets of 10 repetitions at 20% of one RM and one set of as many repetitions as possible at 50% of one RM (Liao 2007); one set of 10 repetitions at 50% of 10 RM gradually increased to 10 repetitions at 100% of 10 RM (Olama 2011); three to five sets of 8 to 15 repetitions depending on the exercise (intensity not reported) (Unnithan 2007). Three trials did not report the number of sets, repetitions or intensity prescribed (Verschuren 2007; Johnston 2011; Pandey 2011). Two trials did not report the sets or repetitions prescribed but reported that exercises were performed at eight RM and 10 RM in Lee 2015 and Fowler 2010, respectively.
Eleven studies did not provide information on fidelity to the intervention (McCubbin 1985; Engsberg 2006; Unger 2006; Seniorou 2007; Unnithan 2007; Lee 2008; Olama 2011; Pandey 2011; Chen 2012; Tedla 2014; Lee 2015). Of the studies that reported adherence to the prescribed number of sessions (Dodd 2003; Verschuren 2007; Maeland 2009; Fowler 2010; Reid 2010; Scholtes 2010; Taylor 2013), the average adherence ranged from 88.9% (Reid 2010) to 93.3% (Dodd 2003). One study reported that participants completed, on average, 32.4 hours of potential 60 hours of training (Mitchell 2016). One trial reported that the mean sets performed were 147.7 (SD 23.4) out of a possible 162 (Dodd 2003). Only two trials provided information on fidelity to the intensity of the intervention. One trial reported that the mean rating of exertion at the end of each session was 6.9 (SD 1.1) out of 10, and that participants increased their training load from session 3 to 24 by a mean of 183% (SD 23%) (Taylor 2013). The second trial reported that participants increased their training load by a mean of 17.5 kg (SD 11.7 kg; range 0 kg to 40.8 kg) (Fowler 2010).
Comparator
Nineteen trials reported that the control group received usual physiotherapy. Eleven trials reported the general content of usual physiotherapy (Liao 2007; Unnithan 2007; Lee 2008; Maeland 2009; Gharib 2011; Smania 2011; Chrysagis 2012; Bryant 2013; Tedla 2014; Emara 2015; Lee 2015), although this varied across individuals, and it was difficult to determine what usual care each participant received. Ten trials stated the dose of usual physiotherapy that was prescribed (Van den Berg‐Emons 1998; Liao 2007; Unnithan 2007; Scholtes 2010; Gharib 2011; Smania 2011; Chrysagis 2012; Tedla 2014; Emara 2015; Lee 2015). Four trials indicated that participants in the control group continued with usual activities, but not specifically usual physiotherapy (Chrysagis 2009; Fowler 2010; Reid 2010; Chen 2012). For two trials, it was unclear what the control group did during the intervention period; one trial reported that the control group received no strengthening (Engsberg 2006) and the authors of the second trial provided no information about the comparator (Unger 2006). Two trials investigating the effect of resistance training prescribed active movements without resistance to the control group (McCubbin 1985; Seniorou 2007). Pandey 2011 was the only trial to specifically state that all participants were not allowed to receive usual physiotherapy for the duration of the trial. Two trials tracked physiotherapy received by all participants and reported that physiotherapy did not differ between the control and intervention group (Verschuren 2007; Mitchell 2016), although neither trial reported the content of physiotherapy, and one trial did not report the dose (Verschuren 2007).
Ongoing studies
All ongoing studies were RCTs conducted in Australia (Gillett 2015), Canada (NCT02754128), the UK (ISRCTN90378161; NCT02766491), and Brazil (RBR‐5rh6cg). The number of participants that studies recruited ranged from 22 in NCT02754128 to 60 in ISRCTN90378161. Participants were aged 15 to 30 years (Gillett 2015), 7 to 17 years (NCT02754128), 7 to 14 years (NCT02766491), 4 to 11 years (RBR‐5rh6cg), and 10 to 19 years (ISRCTN90378161). Three studies specified that they included children with spastic CP (RBR‐5rh6cg; Gillett 2015; NCT02766491). Two studies specified that participants had hemiplegia and diplegia (Gillett 2015; NCT02754128), one specified that participants had diplegia (RBR‐5rh6cg), and two did not specify the anatomical distribution of CP participants (ISRCTN90378161; NCT02766491). Two studies included participants in GMFCS level I and II (Gillett 2015; NCT02754128), two studies included participants in GMFCS levels I, II and III (ISRCTN90378161; NCT02766491), and one study included participants in GMFCS level IV (RBR‐5rh6cg). Three studies were investigating the effect of resistance training compared to usual care (ISRCTN90378161), no training (Gillett 2015), or conventional stretching and upper limb exercises (NCT02766491). One study was comparing resistance training to aerobic exercise (NCT02754128), and one study was comparing trunk control exercises to conventional aquatic therapy (RBR‐5rh6cg).
Studies awaiting classification
The single study awaiting classification was a RCT comparing aerobic training delivered three times a week for nine weeks, to an arts programme of the same duration, delivered in a school in Australia (Carlon 2014). Participants were 19 children with a mean age of three years classified in GMFCS levels I, II and III. We contacted the authors when we identified the study to determine if the results had been published as a full report and were informed that a full report had not been published at the time. We were unable to determine from the abstract if the intervention met our definition of aerobic exercise.
Excluded studies
We excluded 99 studies (102 reports) following full‐text screening and provide details in the Characteristics of excluded studies table. The main reasons for exclusion were as follows: in 43 studies the intervention did not meet the definition of aerobic or resistance training, as defined in the Description of the intervention section; 23 studies were not RCTs; 10 studies compared two different modes of the same type of exercise (Stackhouse 2007; Willoughby 2010; Kim 2012; Olama 2012; Grecco 2013a; Grecco 2013b; Moreau 2013; Su 2013; Hussein 2014; Swe 2015); nine studies did not involve participants with a diagnosis of CP alone (Katz‐Leurer 2009; Speyer 2010; Salem 2012; Angulo‐Barroso 2013; Ayhan 2014; Hammond 2014; Williams 2014; Lowe 2015; Hsieh 2016); in seven studies exercise was provided as intervention in conjunction with another treatment, and it was not possible to determine the independent effect of exercise on the outcome (Patikas 2006; Bandholm 2012; Williams 2013; Slaman 2014; Van Wely 2014; Preston 2015; Sherief AEAA 2015); five studies were not original research (Hornyak 2008; Taylor 2009; Boyd 2010; Roberti 2011; Verschuren 2014); one study did not use exercise or usual care as the comparator (Ahlborg 2006); and in one study it was not possible to determine the content of the intervention (Kumar 2013).
Risk of bias in included studies
Figure 2 and Figure 3 summarise the 'Risk of bias' assessments for all included trials. We judged all trials as being at high risk of bias overall because we rated at least one domain as being at high risk of bias.
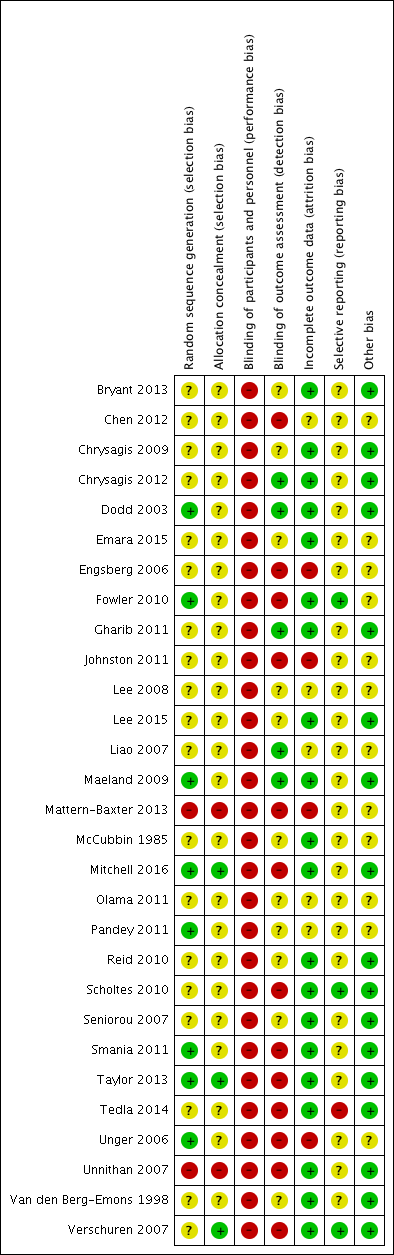
Risk of bias summary: review authors' judgements about each risk of bias item for each included study.

Risk of bias graph: review authors' judgements about each risk of bias item presented as percentages across all included studies.
Allocation
Random sequence generation
We judged eight trials to be at low risk of selection bias, as two used adequate methods of sequence generation (Taylor 2013; Mitchell 2016), and six provided sufficient information to determine the sequence generation was random (Dodd 2003; Unger 2006; Maeland 2009; Fowler 2010; Pandey 2011; Smania 2011).
We judged 19 trials to be at unclear risk of selection bias: 18 because they failed to adequately report the methods used to generate a random sequence (McCubbin 1985; Van den Berg‐Emons 1998; Engsberg 2006; Liao 2007; Seniorou 2007; Lee 2008; Chrysagis 2009; Reid 2010; Scholtes 2010; Gharib 2011; Johnston 2011; Olama 2011; Chen 2012; Chrysagis 2012; Bryant 2013; Tedla 2014; Emara 2015; Lee 2015), and one because, although the authors stated that participants were randomly assigned to two groups using a four‐block randomisation process, they did not describe the randomisation process (Verschuren 2007).
We rated two trials at high risk of selection bias as they used a quasi‐randomisation method (Unnithan 2007; Mattern‐Baxter 2013).
Allocation concealment
We judged three trials to be at low risk of selection bias as they used adequate methods of allocation concealment (Verschuren 2007; Taylor 2013; Mitchell 2016).
We judged 24 trials that failed to adequately report the methods used to conceal allocation at unclear risk of selection bias (McCubbin 1985; Van den Berg‐Emons 1998; Dodd 2003; Engsberg 2006; Unger 2006; Liao 2007; Seniorou 2007; Lee 2008; Chrysagis 2009; Maeland 2009; Fowler 2010; Reid 2010; Scholtes 2010; Gharib 2011; Johnston 2011; Olama 2011; Pandey 2011; Smania 2011; Chen 2012; Chrysagis 2012; Bryant 2013; Tedla 2014; Emara 2015; Lee 2015).
We judged two trials at high risk of selection bias as they used a quasi‐randomisation method (Unnithan 2007; Mattern‐Baxter 2013).
Blinding
Blinding of participants and personnel (performance bias)
We judged all 29 trials to be at high risk of performance bias as participants or personnel were not blinded to group allocation (McCubbin 1985; Van den Berg‐Emons 1998; Dodd 2003; Engsberg 2006; Unger 2006; Liao 2007; Seniorou 2007; Unnithan 2007; Verschuren 2007; Lee 2008; Chrysagis 2009; Maeland 2009; Fowler 2010; Reid 2010; Scholtes 2010; Gharib 2011; Johnston 2011; Olama 2011; Pandey 2011; Smania 2011; Chen 2012; Chrysagis 2012; Bryant 2013; Mattern‐Baxter 2013; Taylor 2013; Tedla 2014; Emara 2015; Lee 2015; Mitchell 2016).
Blinding of outcome assessment (detection bias)
We rated 13 trials at high risk of detection bias (Engsberg 2006; Unger 2006; Unnithan 2007; Verschuren 2007; Fowler 2010; Scholtes 2010; Johnston 2011; Smania 2011; Chen 2012; Mattern‐Baxter 2013; Taylor 2013; Tedla 2014; Mitchell 2016). Objective outcomes were assessed by assessors blinded to group allocation in six of these trials, but participants or their parents were responsible for self‐report measures, and they were not blinded to group allocation, suggesting that a lack of blinding was likely to have affected a number of trial outcomes (Unger 2006; Verschuren 2007; Fowler 2010; Scholtes 2010; Smania 2011; Taylor 2013). The remaining studies stated that at least some of the assessments were conducted by a person who was not blind to group allocation (Engsberg 2006; Unnithan 2007; Johnston 2011; Chen 2012; Mattern‐Baxter 2013; Tedla 2014; Mitchell 2016).
Eleven trials did not report adequate information to determine if outcome assessors were blinded to group allocation, so we judged these trials to be at unclear risk of detection bias (McCubbin 1985; Van den Berg‐Emons 1998; Seniorou 2007; Lee 2008; Chrysagis 2009; Reid 2010; Olama 2011; Pandey 2011; Bryant 2013; Emara 2015; Lee 2015).
We rated five trials at low risk of detection bias because assessors were blinded to group allocation (Dodd 2003; Liao 2007; Maeland 2009; Gharib 2011; Chrysagis 2012).
Incomplete outcome data
We considered 20 trials to be at low risk of attrition bias, as they had no missing data, low rates of missing data (10% or less) that were evenly distributed across groups, or the authors performed an intention‐to‐treat analysis (McCubbin 1985; Van den Berg‐Emons 1998; Dodd 2003; Seniorou 2007; Unnithan 2007; Verschuren 2007; Chrysagis 2009; Maeland 2009; Fowler 2010; Reid 2010; Scholtes 2010; Gharib 2011; Smania 2011; Chrysagis 2012; Bryant 2013; Taylor 2013; Tedla 2014; Emara 2015; Lee 2015; Mitchell 2016).
We judged five trials, which did not provide sufficient information on the number of participants who withdrew from the study or the reasons for withdrawal, at unclear risk of bias (Liao 2007; Lee 2008; Olama 2011; Pandey 2011; Chen 2012).
Four trials had high rates of missing data (three had 20% or more, and one had more than 30%), missing data were not evenly distributed across groups, or reasons for missing data were likely to be related to the trial outcome and were therefore judged as being at high risk of bias (Engsberg 2006; Unger 2006; Johnston 2011; Mattern‐Baxter 2013).
Selective reporting
We considered three trials to be at low risk of reporting bias, as they adequately reported outcome data described in the trial protocol (Verschuren 2007; Fowler 2010; Scholtes 2010).
We judged 25 trials to be at unclear risk of bias: one because a trial protocol was available and outcomes were reported across two reports, but some outcomes were not reported to date (Mitchell 2016), and 24 because a trial protocol was not available and therefore it was not possible to determine if all expected outcomes were reported (McCubbin 1985; Van den Berg‐Emons 1998; Dodd 2003; Engsberg 2006; Unger 2006; Liao 2007; Seniorou 2007; Unnithan 2007; Lee 2008; Chrysagis 2009; Maeland 2009; Reid 2010; Gharib 2011; Johnston 2011; Olama 2011; Pandey 2011; Smania 2011; Chen 2012; Chrysagis 2012; Bryant 2013; Mattern‐Baxter 2013; Taylor 2013; Emara 2015; Lee 2015).
We rated one trial at high risk of bias because data on strength and gross motor function were reported incompletely and could not be entered into a meta‐analysis (Tedla 2014).
Other potential sources of bias
We considered 12 trials to be at unclear risk of other potential bias: 2 for not providing any demographic data (McCubbin 1985; Olama 2011), 3 for providing demographic and baseline outcome data for those who completed the study only (Liao 2007; Chen 2012; Mattern‐Baxter 2013), 3 for being unclear about whether all demographic or baseline data were reported (Lee 2008; Pandey 2011; Emara 2015); 1 for providing outcome data only for those who completed the study (Unger 2006), 1 for providing demographic and baseline data only for those who completed and for not reporting all outcome data for those who completed the study (Johnston 2011), 1 for reporting demographic data only for those who completed the study and outcome data only for those participants who improved (Engsberg 2006), and 1 for unaccounted missing data (Fowler 2010).
We considered 17 trials to be at low risk of bias for other potential bias (Van den Berg‐Emons 1998; Dodd 2003; Seniorou 2007; Unnithan 2007; Verschuren 2007; Chrysagis 2009; Maeland 2009; Reid 2010; Scholtes 2010; Gharib 2011; Smania 2011; Chrysagis 2012; Bryant 2013; Taylor 2013; Tedla 2014; Lee 2015; Mitchell 2016).
Effects of interventions
See: Summary of findings for the main comparison Aerobic exercise versus usual care; Summary of findings 2 Resistance training versus usual care; Summary of findings 3 Mixed training versus usual care; Summary of findings 4 Resistance training versus aerobic exercise
All 29 trials reported outcomes at short‐term time points (i.e. zero to one month postintervention). Nine trials reported outcomes at intermediate time points (i.e. more than one month to six months' postintervention) (Dodd 2003; Seniorou 2007; Verschuren 2007; Lee 2008; Scholtes 2010; Johnston 2011; Bryant 2013; Mattern‐Baxter 2013; Taylor 2013). One trial reported that assessments were made preintervention, postintervention and at 'follow‐up' but did not state when the follow‐up assessment occurred (Pandey 2011). We therefore did not report this follow‐up time point. No trials reported outcomes at time points beyond six months' postintervention.
As described under Data synthesis, we performed separate meta‐analyses for studies in adults versus children and adolescents. We reported the results for three trials involing adolescents and adults (aged 10 to 22 years) (McCubbin 1985; Chrysagis 2009; Taylor 2013). We identified sufficient data (at least 10 studies in a meta‐analysis) to examine funnel plots for two meta‐analyses and found no indication of publication bias (see Figure 4; Figure 5).

Funnel plot of comparison: 6 Resistance training and mixed training versus usual care, outcome: 6.1 Activity: gross motor function; short term.

Funnel plot of comparison: 6 Resistance training and mixed training versus usual care, outcome: 6.6 Muscle strength; short term.
Comparison 1: aerobic exercise versus usual care
Seven trials comparing aerobic exercise to usual care reported at least one primary or secondary outcome of interest (Van den Berg‐Emons 1998; Chrysagis 2009; Gharib 2011; Smania 2011; Chrysagis 2012; Bryant 2013; Mattern‐Baxter 2013). One trial did not report any outcomes of interest (Emara 2015), so we do not report its results.
Activity
Pooled results
Three trials assessed gross motor function in children and adolescents following aerobic exercise (Chrysagis 2012; Bryant 2013; Mattern‐Baxter 2013). For one three‐armed trial, we combined data from two aerobic exercise groups (bike and treadmill exercise) to compare all modes of aerobic exercise to usual care (Bryant 2013).
The pooled analysis of three trials in 65 children and adolescents indicated that aerobic training improved gross motor function compared to usual care in the short term (SMD 0.53, 95% CI 0.02 to 1.04, P = 0.04, I2 = 0%, Analysis 1.1; Chrysagis 2012; Bryant 2013; Mattern‐Baxter 2013).
Pooled analysis of four trials with high heterogeneity involving 82 children and adolescents (GMFCS levels I to IV), demonstrated that aerobic exercise did not result in an improvement in gait speed in the short term (MD 0.09 m/s, 95% CI −0.11 m/s to 0.28 m/s, P = 0.38, I2 = 78%, Analysis 1.2; Gharib 2011; Smania 2011; Chrysagis 2012; Mattern‐Baxter 2013).
Single study results
One trial of 12 adolescents and young adults (GMFCS levels I to III; Chrysagis 2009) reported that there was no between‐group difference in gross motor function over time (P = 0.11). Although the authors reported that the mean score on dimension E of the GMFM increased following aerobic exercise from 59.02% to 65.04% in the short‐term, and that there was little short‐term change in the comparison group (mean increased from 59.02% to 59.95%), they did not provide information to allow us to calculate the mean difference between groups.
One trial, Smania 2011 (18 children and adolescents, GMFCS levels I to IV), reported a greater short‐term improvement in walking endurance, measured as the distance walked (meters) at self‐selected walking speed for six minutes, following aerobic exercise (Cohen's d = 0.44, P = 0.02). Using the postintervention means and SDs provided for each group, we calculated an MD of 41.00 m per 6 minutes walked (95% CI −46.98 m to 128.98 m, Analysis 1.3).
Only one trial, Mattern‐Baxter 2013 (12 children), compared aerobic exercise versus usual care for gait speed in the intermediate term, reporting no between‐group difference in gait speed (MD −0.17 m/s, 95% CI −0.59 m/s to 0.24 m/s, Analysis 1.4).
Although gross motor function was measured in children and adolescents with CP at an intermediate time point in two trials, the authors of one trial did not provide a P value to support this or data to allow us to calculate it (Bryant 2013). The second trial, Mattern‐Baxter 2013, found that gross motor function improved in the intermediate term (MD 12.96%, 95% CI 0.52% to 25.40%, 12 children, Analysis 1.5).
One trial, Van den Berg‐Emons 1998 (20 children and adolescents, ambulatory and non‐ambulatory), reported that there was no evidence of a difference in the change in daily physical activity (calculated as the ratio of total energy expenditure to sleeping or resting metabolic rate between participants in the intervention group versus usual care after nine months of aerobic exercise (P value not reported). Using the postintervention means and SDs provided, we calculated an MD of 0.21 (95% CI 0.04 to 0.38, Analysis 1.6) in daily physical activity.
Participation
No trial assessed the effect of aerobic exercise in comparison to usual care on participation.
Quality of life
No trial comparing aerobic exercise to usual care assessed quality of life.
Adverse events
Pooled results
No meta‐analysis was possible.
Single study results
Four out of eight trials did not report monitoring adverse events (Van den Berg‐Emons 1998; Chrysagis 2009; Gharib 2011; Emara 2015). Four trials reported that participants did not experience any adverse events (Smania 2011; Chrysagis 2012; Bryant 2013; Mattern‐Baxter 2013).
Body functions and body structures
Pooled results
No meta‐analysis was possible.
Single study results
Only one trial in 20 ambulatory and non‐ambulatory children and adolescents assessed aerobic fitness following an aerobic exercise intervention (Van den Berg‐Emons 1998). This trial reported that after nine months of aerobic exercise there was a greater increase in aerobic fitness in participants with CP in the intervention group compared to the usual care group in the short term (P < 0.05; effect size and exact P value not reported). Our analysis of postintervention means and SDs provided an MD of 0.06 W/kg FFM (95% CI −0.71 W/kg FFM to 0.83 W/kg FFM, Analysis 1.7).
Sensitivity analysis
To assess the influence of our analysis model on the results, we repeated the pooled analyses using a fixed‐effect model instead of a random‐effects model. Using a fixed‐effect model, there was some evidence of an improvement in gait speed following aerobic exercise compared to usual care in 82 children and adolescents in the short term, with no change in heterogeneity (MD 0.08 m/s, 95% CI 0.02 m/s to 0.14 m/s, P = 0.01, I2 = 78%, 4 studies; Gharib 2011; Smania 2011; Chrysagis 2012; Mattern‐Baxter 2013; analysis not shown). Using a fixed‐effect model instead of a random‐effects model had no impact on gross motor function in children and adolescents in the short term (analysis not shown).
Quality of evidence
There is low‐quality evidence (RCT evidence: high, downgraded once for limitations, once for imprecision) that aerobic exercise improves gross motor function and physical activity but does not improve walking endurance or aerobic fitness in children and adolescents with CP in the short term. There is very low‐quality evidence (RCT evidence: high, downgraded once for limitations, once for imprecision, once for inconsistency) that aerobic exercise does not improve gait speed in children and adolescents with CP in the short term.
There is low‐quality evidence (RCT evidence: high, downgraded once for limitations, once for imprecision) that aerobic exercise improves gross motor function but does not improve gait speed in children and adolescents with CP in the intermediate term.
Comparison 2: resistance training versus usual care
Fourteen trials comparing resistance training to usual care reported outcomes of interest; 11 included children and adolescents (Dodd 2003; Engsberg 2006; Liao 2007; Seniorou 2007; Lee 2008; Reid 2010; Scholtes 2010; Pandey 2011; Tedla 2014; Lee 2015; Mitchell 2016), one included adolescents only (Unger 2006), one included adolescents and young adults aged 14 to 22 years (Taylor 2013), and one included adults (Maeland 2009). One trial investigating the effect of resistance training in adolescents and young adults with CP did not report any outcomes of interest, so we do not report the results of this trial (McCubbin 1985).
Activity
Pooled results
Eight trials assessed gross motor function in children and adolescents using the GMFM (Dodd 2003; Engsberg 2006; Liao 2007; Seniorou 2007; Lee 2008; Scholtes 2010; Tedla 2014; Lee 2015). Tedla 2014 did not report between‐group differences, so we could not extract data. For the remaining seven studies, resistance training did not improve short‐term gross motor function more than usual care (SMD 0.12, 95% CI −0.19 to 0.43, P = 0.45, I2 = 0%, 164 children and adolescents, Analysis 2.1; Dodd 2003; Engsberg 2006; Liao 2007; Seniorou 2007; Lee 2008; Scholtes 2010; Lee 2015). Gross motor function also did not improve following resistance training in 85 children and adolescents (GMFCS levels I to III) in the intermediate term (SMD 0.13, 95% CI −0.30 to 0.55, P = 0.57, I2 = 0%, 3 studies, Analysis 2.2; Dodd 2003; Lee 2008; Scholtes 2010).
Short‐term gait speed did not improve in 185 children and adolescents with CP (GMFCS levels I to III) following resistance training compared to usual care (MD 0.03 m/s, 95% CI −0.02 m/s to 0.07 m/s, P = 0.20, I2 = 0%, 8 studies, Analysis 2.3; Dodd 2003; Engsberg 2006; Unger 2006; Liao 2007; Seniorou 2007; Lee 2008; Scholtes 2010; Pandey 2011). In addition, resistance training did not improve intermediate‐term gait speed in comparison to usual care (MD −0.03 m/s, 95% CI −0.17 m/s to 0.11 m/s, P = 0.65, I2 = 0%, 84 children and adolescents, 3 studies, Analysis 2.4; Dodd 2003; Lee 2008; Scholtes 2010).
Single study results
Maeland 2009 reported that resistance training did not improve short‐term gait speed in 12 adults in GMFCS levels II and III (MD 0.30 m/s, 95% CI −0.28 m/s to 0.88 m/s, Analysis 2.5); short‐term gross motor function, assessed with a timed stair climb (MD 10.00 stairs, 95% CI −13.55 stairs to 33.55 stairs, Analysis 2.6); or short‐term walking endurance (MD 127.00 m, 95% CI −95.08 m to 349.08 m, Analysis 2.7).
One trial in 48 adolescents and young adults in GMFCS levels II and III reported that, in the short term, resistance training did not improve gait speed (MD 0.01 m/s, 95% CI −0.06 m/s to 0.07 m/s), gross motor function (MD 0.9%, 95% CI −3.0% to 4.7%), walking endurance (MD 0.1 m, 95% CI −20.6 m to 20.9 m), or steps per day (MD −28 steps/day, 95% CI −1373 steps/day to 1317 steps/day) (Taylor 2013). The same trial reported that resistance training did not improve these outcomes in the intermediate term: gait speed (MD – 0.05 m/s, 95% CI – 0.11 m/s to 0.02 m/s), gross motor function (MD 1.0%, 95% CI –2.6% to 4.5%), walking endurance (MD −12.3 m, 95% CI −34.8 m to 10.2 m) and steps per day (MD −1093 steps/day, 95% CI −2316 steps/day to 130 steps/day).
Only one trial, Mitchell 2016, assessed walking endurance in 101 children and adolescents (GMFCS level I and II), reporting that walking endurance improved following resistance training in comparison to usual care (MD 38.9 m, 95% CI 12.3 m to 64.5 m). Mitchell 2016 also reported that resistance training did not result in an improvement in steps per day among children in the short term (MD 563.7 steps/day, 95% CI −706.5 steps/day to 1833.8 steps/day).
Participation
Pooled results
Pooled analysis of two trials, Mitchell 2016 and Scholtes 2010, suggested that short‐term participation did not improve in participants in GMFCS levels I to III receiving resistance training versus usual care (SMD 0.34, 95% CI −0.01 to 0.70, P = 0.06, I2 = 0%, 127 children and adolescents, Analysis 2.8).
Single study results
One trial, Scholtes 2010, also reported that participation did not improve in the intermediate term (P = 0.12). We calculated an MD of 0.37 (95% CI −6.61 to 7.35, 36 children and adolescents, Analysis 2.9) based on the data provided.
Quality of life
Pooled results
No meta‐analysis was possible.
Single study results
One trial, Engsberg 2006, reported that parent‐reported quality of life improved in 12 children and adolescents with CP following resistance training in the short term, but participant‐reported quality of life did not. However, there was no evidence of a between‐group difference for parent‐ or child‐reported quality of life based on the data provided (parent reported: MD 12.70, 95% CI −5.63 to 31.03, Analysis 2.10; child reported: MD 11.70, 95% CI −8.32 to 31.72, Analysis 2.11).
Adverse events
Pooled results
No meta‐analysis was possible.
Single study results
Seven trials did not state whether they recorded any adverse events (McCubbin 1985; Unger 2006; Seniorou 2007; Lee 2008; Reid 2010; Pandey 2011; Lee 2015). Two trials stated that neither participants nor physiotherapists reported or registered any adverse events (Engsberg 2006; Maeland 2009). One trial stated that there were no adverse events that led to missing training sessions (Dodd 2003). However, one participant reported pressure on the shoulders from a loaded backpack, and two participants reported mild foot and ankle discomfort during heel raises (Dodd 2003). Exercises were modified and enabled participants to continue without incident (Dodd 2003). Four trials stated that participants reported muscle soreness, which subsided with rest (Scholtes 2010; Taylor 2013; Tedla 2014; Mitchell 2016). One trial reported that a participant in the intervention group had seizures during the study period, but this was deemed unrelated to the training (Mitchell 2016). In addition, two participants in one trial reported minor calf strain and discomfort to the plantar fascia, respectively, resulting in the programme being adjusted but no missed sessions (Taylor 2013). One trial reported that participants experienced discomfort due to wearing a weighted vest (Liao 2007).
Body structure and function
Twelve trials assessed muscle strength following resistance training (Dodd 2003; Engsberg 2006; Liao 2007; Seniorou 2007; Lee 2008; Maeland 2009; Reid 2010; Scholtes 2010; Pandey 2011; Taylor 2013; Tedla 2014; Mitchell 2016). It was not possible to extract data from Tedla 2014, which did not present the necessary numerical data. We did not report muscle strength from a second trial because the authors only included data on participants whose muscle strength improved in the analysis (Engsberg 2006).
Pooled results
Muscle strength improved more with resistance training compared to usual care in children and adolescents in GMFCS levels I to III, both in the short term (SMD 0.53, 95% CI 0.00 to 1.06, P = 0.05, I2 = 70%, 247 children and adolescents, 8 studies, Analysis 2.12; Dodd 2003; Liao 2007; Seniorou 2007; Lee 2008; Reid 2010; Scholtes 2010; Pandey 2011; Mitchell 2016) and in the intermediate term (SMD 0.50, 95% CI 0.06 to 0.94, P = 0.03, I2 = 1%, 84 children and adolescents, 3 studies, Analysis 2.13; Dodd 2003; Lee 2008; Scholtes 2010).
Single study results
The results of a single trial, Taylor 2013, suggested that resistance training resulted in a short‐term improvement in muscle strength in 48 adolescents and young adults in GMFCS levels II and III (MD 26.7% increase in strength, 95% CI 7.9% to 45.5%) but not in the intermediate term (MD 21.7%, 95% CI –17.3% to 61.7%).
One trial, Maeland 2009, which included 12 adults in GMFCS levels II and III, reported that resistance training did not result in short‐term improvements in muscle strength compared to usual care (P = 0.78). We calculated an MD of −7.00 Nm/s (95% CI −58.74 Nm/s to 44.74 Nm/s, Analysis 2.14) using data provided.
Sensitivity analysis
To assess the influence of our analysis model on the results, we repeated the pooled analyses using a fixed‐effect model instead of a random‐effects model. Using a fixed‐effect model resulted in a change in the effect size for the effect of short‐term muscle strength in 247 children and adolescents, with no change in heterogeneity (SMD 0.55, 95% CI 0.28 to 0.81, P < 0.001, I2 = 70%, 8 studies; Dodd 2003; Liao 2007; Seniorou 2007; Lee 2008; Reid 2010; Scholtes 2010; Pandey 2011; Mitchell 2016; analysis not shown). Using a fixed‐effect model instead of a random‐effects model had no impact on intermediate‐term muscle strength in children and adolescents, or on gait speed, gross motor function, or participation in children and adolescents at any time point.
Quality of evidence
There is low‐quality evidence (RCT evidence: high, downgraded once for limitations, once for imprecision) that resistance training improves walking endurance but does not improve short‐term gross motor function, gait speed, physical activity, participation or quality of life in children and adolescents with CP. There is very low‐quality evidence (RCT evidence: high, downgraded once for limitations, once for imprecision, once for consistency) that resistance training does improve short‐term muscle strength in children and adolescents with CP. There is low‐quality evidence (RCT evidence: high, downgraded once for limitations, once for imprecision) that resistance training improves muscle strength but does not improve short‐term gait speed, gross motor function, walking endurance or physical activity in adolescents and young adults with CP. There is also low‐quality evidence (RCT evidence: high, downgraded once for limitations, once for imprecision) that resistance training does not improve gait speed, gross motor function, walking endurance or muscle strength in adults with CP in the short term.
There is low‐quality evidence (RCT evidence: high, downgraded once for limitations, once for imprecision) that resistance training does not improve gait speed, gross motor function, walking endurance, physical activity or muscle strength in adolescents and young adults with CP in the intermediate term. There is low‐quality evidence (RCT evidence: high, downgraded once for limitations, once for imprecision) that resistance training improves intermediate‐term muscle strength but not gross motor function, gait speed or participation in children and adolescents with CP.
Comparison 3: mixed training versus usual care
Four trials compared mixed training to usual care in children and adolescents with CP (Verschuren 2007; Fowler 2010; Chen 2012) or adolescents only (Unnithan 2007).
Activity
Pooled results
There was no statistically significant between‐group difference in short‐term gross motor function in 163 participants in GMFCS levels I to III receiving mixed training versus usual care (SMD 0.02, 95% CI −0.29 to 0.33, P = 0.90, I2 = 0%, 4 studies, Analysis 3.1; Unnithan 2007; Verschuren 2007; Fowler 2010; Chen 2012).
Single study results
One trial, Fowler 2010, reported that mixed training did not improve self‐selected short‐term gait speed over 30 seconds (MD 0.10 m/s, 95% CI −0.07 m/s to 0.27 m/s, 58 children and adolescents, Analysis 3.2) or walking endurance, measured as the speed per distance completed on the 600‐yard (548.6 m) walk test (MD 6.50 m/min, 95% CI −14.91 m/min to 27.91 m/min, 55 children and adolescents, Analysis 3.3) compared to usual care, in participants in GMFCS levels I to III.
One study, Verschuren 2007, reported that mixed training improved gross motor function, as measured by dimension D but not dimension E of the GMFM, in 65 children and adolescents (GMFCS levels I and II) in the intermediate term. When we calculated effect sizes using postintervention means and SDs, the effect size for dimension D was MD −2.62% (95% CI −6.26% to 1.03%) and dimension E was MD −4.90% (95% CI −11.58% to 1.78%). No trials reported intermediate changes in gait speed or walking endurance.
Participation
Pooled results
No meta‐analysis was possible.
Single study results
One trial, Verschuren 2007, reported that short‐term participation (as indicated by 'overall activities' scores for participation on the CAPE; King 2004) improved in 65 children and adolescents (GMFCS levels I and II) following mixed training compared to usual care (P = 0.002). We calculated an MD of 0.40 (95% CI 0.13 to 0.67, Analysis 3.4) using the data provided. There was no between‐group difference in participation in the intermediate term (MD 0.15, 95% CI −0.25 to 0.54, Analysis 3.5).
Quality of life
Pooled results
No meta‐analysis was possible.
Single study results
Two trials, Fowler 2010 and Verschuren 2007, reported quality of life following mixed training. One trial, Verschuren 2007, recorded quality of life in children and adolescents using the TNO‐AZL Questionnaire for Children's Health‐Related Quality of Life Parent Form (TACQOL‐PF; Vogels 2000). Scale scores are obtained by adding items scores (between three and seven per scale) within scales and transforming crude scale scores to a 0‐to‐100 scale. Quality of life was scored on seven scales (pain and symptoms, basic motor functioning, autonomy, cognitive functioning, social functioning, global positive emotions, and global negative emotions). The authors reported a statistically significant between‐group difference in scores on the 'basic motor functioning' (P = 0.001) and 'cognitive functioning' (P = 0.04) subscales in the short term but did not report effect sizes. We calculated short‐term effect sizes for 'basic motor functioning' (MD 3.80, 95% CI 1.71 to 5.89) and 'cognitive functioning' (MD 1.10, 95% CI −1.02 to 3.22); analyses not shown. The authors reported that there were no between‐group differences on any scale in the intermediate term (Verschuren 2007).
Another trial, Fowler 2010, assessed quality of life in 58 children and adolescents (GMFCS levels I to III) using participant responses for the Pediatric Quality of Life Inventory SF15 (PedsQL; Chan 2005) and parent responses for the Pediatric Outcomes Data Collection Instrument (PODCI; Daltroy 1998). We extracted the total score from the PedsQL (scale 0 to 100, higher score indicates more positive quality of life) and the score from each of the four sections in the PODCI (global functioning and symptoms, happiness, treatment expectations, and satisfaction with symptoms). There was no between‐group difference in participant‐reported quality of life in the short term (MD 3.5, 95% CI −2.0 to 8.8). There was a between‐group difference in score on one of five subscales (treatment expectations) on the PODCI in the short‐term (MD 17.7, 95% CI 5.2 to 30.0).
Adverse events
Pooled results
No meta‐analysis was possible.
Single study results
One trial, Unnithan 2007, did not report adverse events. One trial, Chen 2012, reported observing no adverse effects during the intervention for either group. One trial, Verschuren 2007, reported that one child fell and fractured her radius during an exercise session. One trial, Fowler 2010, reported observing 28 mild events (in 18 participants) potentially related to the study: 6 observed falls; 17 complaints of soreness, muscle cramping or mild pain; 4 reports of fatigue; and 1 skin rash related to wearing a heart‐rate monitor. Fowler 2010 also noted 30 events unrelated to study procedures: illness, tooth loss, headache, stomachache, tonsillectomy and skin irritation from orthotic use.
Body structure and function
Pooled results
Mixed training did not result in improved short‐term aerobic fitness in 78 children and adolescents (GMFCS levels I, II and II), compared to usual care (SMD 0.05, 95% CI −0.39 to 0.50, P = 0.81, I2 = 0%, 2 studies, Analysis 3.6; Unnithan 2007; Verschuren 2007).
Mixed training also did not improve short‐term muscle strength in 150 children and adolescents with CP compared to usual care (SMD 0.08, 95% CI −0.24 to 0.40, P = 0.63, I2 = 0%, 3 studies, Analysis 3.7; Verschuren 2007; Fowler 2010; Chen 2012).
Single study results
One trial, Verschuren 2007 (65 children and adolescents), reported that anaerobic fitness improved in the short term (MD 25.20 W, 95% CI 8.89 W to 41.51 W, Analysis 3.8). The same trial reported that mixed training did not result in improvements in intermediate‐term aerobic fitness (MD −0.13 min achieved on shuttle run/walk test, 95% CI −2.10 min to 1.84 min, Analysis 3.9) or anaerobic fitness (MD −31.28 W, 95% CI −71.89 W to 9.33 W, Analysis 3.10), but it did result in improved muscle strength. We calculated an effect size using postintervention means and SDs: MD −1.04 repetitions (95% CI −10.33 repetitions to 8.25 repetitions, Analysis 3.11).
Sensitivity analysis
Using a fixed‐effect model rather than a random‐effects model had no impact on the effect size for muscle strength or gross motor function among children (Verschuren 2007; Fowler 2010; Chen 2012). Analyses not shown.
Quality of evidence
There is low‐quality evidence (RCT evidence: high, downgraded once for limitations, once for imprecision) that mixed training does not improve gross motor function, gait speed, walking endurance, aerobic fitness or muscle strength in children and adolescents with CP in the short term. There is low‐quality evidence (RCT evidence: high, downgraded once for limitations, once for imprecision) that mixed training improves short‐term participation and anaerobic fitness in children and adolescents with CP.
There is low‐quality evidence (RCT evidence: high, downgraded once for limitations, once for imprecision) that mixed training does not improve intermediate‐term gross motor function, participation, aerobic fitness, anaerobic fitness or muscle strength in children and adolescents with CP.
Comparison 4: resistance training versus aerobic exercise
Two trials, Johnston 2011 and Olama 2011, compared resistance training to aerobic exercise.
Activity
Pooled results
In two studies, the pooled results indicated there was no statistically significant between‐group change in short‐term gross motor function among 56 children and adolecents (SMD 0.02, 95% CI −0.50 to 0.55, P = 0.94, I2 = 0%; Johnston 2011; Olama 2011).
Single study results
In one study in 26 children and adolescents (GMFCS levels II to IV), there was no statistically significant between‐group change in short‐term gait speed (MD 0.12 m/s, 95% CI −0.15 m/s to 0.39 m/s, Analysis 4.2; Johnston 2011), intermediate‐term gait speed (MD 0.19 m/s, 95% CI −0.05 m/s to 0.43 m/s, Analysis 4.3) or intermediate‐term gross motor function (MD 4.70%, 95% CI −12.70% to 22.10%, Analysis 4.4).
Participation
Pooled results
No meta‐analysis was possible.
Single study results
One study in 26 children and adolescents, Johnston 2011, reported a between‐group difference in participation as measured by the 'with whom' subscale of the CAPE (King 2004) in the short term (P = 0.05). As the authors did not provide an effect size, we calculated this using the data provided and found a between‐group difference for the 'diversity' (MD 6.60, 95% CI 0.35 to 12.85) and 'with whom' (MD 0.48, 95% CI 0.08 to 0.88) subscales of the CAPE, but not for the subscales of 'intensity' (MD 0.48, 95% CI −0.22 to 1.18), 'where' (MD 0.28, 95% CI −0.07 to 0.63) or 'enjoyment' (MD −0.06, 95% CI −0.48 to 0.36). The authors did not report an effect size for between‐group differences in participation in the intermediate term (Johnston 2011). Using the data provided, we calculated effect sizes for the following subscales: 'diversity' (MD 5.20, 95% CI −2.53 to 12.93), 'intensity' (MD 0.59, 95% CI −0.34 to 1.52), 'with whom' (MD 0.18, 95% CI −0.35 to 0.71), 'where' (MD 0.45, 95% CI −0.01 to 0.91) and 'enjoyment' (MD −0.02, 95% CI −0.55 to 0.51). Analyses not shown.
Quality of life
Pooled results
No meta‐analysis was possible.
Single study results
One study of 26 children and adolescents, Johnston 2011, reported a group‐by‐time interaction for child‐reported quality of life (P = 0.02) but did not state at what time point between‐group differences occurred. Our analysis of the reported data indicated that there was no between‐group difference in child‐reported quality of life or adult‐reported quality of life in the short term (child reported: MD 9.50, 95% CI −4.59 to 23.59; adult reported: MD 6.00, 95% CI −11.29 to 23.29) or intermediate term (child reported: MD −1.00, 95% CI −14.61 to 12.61; adult reported: MD 5.10, 95% CI −8.63 to 18.83). Analyses not shown.
Adverse events
Pooled results
No meta‐analysis was possible.
Single study results
One trial did not state that adverse events were recorded (Olama 2011). Some children reported experiencing leg pain in one trial (Johnston 2011).
Body structure and function
Pooled results
There was no statistically significant between‐group change in muscle strength in the short term (SMD −0.11, 95% CI −0.64 to 0.41, P = 0.67, I2 = 0%, 56 children and adolescents, 2 studies, Analysis 4.5; Johnston 2011; Olama 2011).
No trial assessed aerobic fitness following the intervention.
Single study results
There was no statistically significant between‐group change in muscle strength in the intermediate term (MD −0.03 N/kg, 95% CI −2.71 to 2.65 N/kg, 26 children and adolescents, 1 study, Analysis 4.6; Johnston 2011).
Sensitivity analysis
Repeating the analysis using a fixed‐effect model instead of a random‐effects model had no impact on the effect size or statistical significance of any outcome (analyses not shown).
Quality of evidence
There is low‐quality evidence (RCT evidence: high, downgraded once for limitations, once for imprecision) that there is no difference between the effect of aerobic exercise and resistance training on gait speed, gross motor function, quality of life, or muscle strength in children and adolescents with CP in the short or intermediate term.
Post hoc analyses
Folllowing identification of included studies, we noted a large overlap between the content of aerobic exercise interventions and mixed training interventions, and a large overlap between the content of resistance training interventions and mixed training interventions, respectively. We therefore conducted the following post hoc analyses: pooled analyses of aerobic exercise and mixed training versus usual care, and pooled analyses of resistance training and mixed training versus usual care. These analyses only include trials in children and adolescents, as no mixed training trials included adults with CP. Given the post hoc nature of these analyses, readers should interpret results with caution.
Comparison 1: aerobic exercise (incorporating mixed training interventions) versus usual care
Pooled results
In a meta‐analysis of seven studies, aerobic exercise improved short‐term gross motor function more than usual care in 228 children and adolescents (SMD 0.36, 95% CI 0.09 to 0.62, P = 0.008, I2 = 0%, Analysis 5.1; Unnithan 2007; Verschuren 2007; Fowler 2010; Chen 2012; Chrysagis 2012; Bryant 2013; Mattern‐Baxter 2013). However, a meta‐analysis of two studies (77 children and adolescents) showed that aerobic exercise did not improve gross motor function in the intermediate term (SMD 0.25, 95% CI −1.15 to 1.64, P = 0.73, I2 = 77%, Analysis 5.2; Verschuren 2007; Mattern‐Baxter 2013).
In a meta‐analysis of five studies (140 children and adolescents), aerobic exercise did not result in an improvement in gait speed (MD 0.10 m/s, 95% CI −0.05 m/s to 0.24 m/s, P = 0.18, I2 = 70%, Analysis 5.3; Fowler 2010; Gharib 2011; Smania 2011; Chrysagis 2012; Mattern‐Baxter 2013). In addition, aerobic exercise did not improve short‐term walking endurance in two studies of 73 children and adolescents (MD 8.43 m, 95% CI −12.38 m to 29.23 m, P = 0.43, I2 = 0%, Analysis 5.4; Fowler 2010; Smania 2011). There was also no between‐group difference in short‐term aerobic fitness following aerobic exercise in three studies of 98 children and adolescents (SMD 0.06, 95% CI −0.34 to 0.45, P = 0.78, I2 = 0%, Analysis 5.5; Van den Berg‐Emons 1998; Unnithan 2007; Verschuren 2007).
Sensitivity analysis
Using a fixed‐effect model rather than a random‐effects model had no impact on the short‐term results for aerobic fitness, gross motor function or walking endurance. There was, however, a change in the short‐term effect size for gait speed (MD 0.08 m/s, 95% CI 0.02 m/s to 0.14 m/s, P = 0.006, I2 = 70%, 140 participants). Using a fixed‐effect model also had a small impact on the intermediate effect size for gross motor function (SMD −0.16, 95% CI −0.62 to 0.29, P = 0.49, I2 = 77%, 228 participants). Analyses not shown.
Comparison 2: resistance training (incorporating mixed training interventions) versus usual care
Pooled results
A meta‐analysis found that resistance training did not improve gross motor function in the short term (SMD 0.21, 95% CI −0.01 to 0.43, P = 0.06, I2 = 0%, 327 children and adolescents, 11 studies, Analysis 6.1; Dodd 2003; Engsberg 2006; Liao 2007; Seniorou 2007; Unnithan 2007; Verschuren 2007; Lee 2008; Fowler 2010; Scholtes 2010; Chen 2012; Lee 2015) nor in the intermediate term (SMD −0.08, 95% CI −0.41 to 0.24, P = 0.62, I2 = 1%, 150 children and adolescents, 4 studies Analysis 6.2; Dodd 2003; Verschuren 2007; Lee 2008; Scholtes 2010).
Similarly, a meta‐analysis of nine studies involving 243 children and adolescents found that resistance training did not improve short‐term gait speed (MD 0.03 m/s, 95% CI −0.01 m/s to 0.08 m/s, P = 0.13, I2 = 0%, Analysis 6.3; Dodd 2003; Engsberg 2006; Unger 2006; Liao 2007; Seniorou 2007; Lee 2008; Fowler 2010; Scholtes 2010; Pandey 2011).
Resistance training improved participation in the short term (SMD 0.35, 95% CI 0.07 to 0.64, P = 0.02, I2 = 0%, 192 children and adolescents, 3 studies, Analysis 6.4; Verschuren 2007; Scholtes 2010; Mitchell 2016) but not the intermediate term (MD 0.15, 95% CI −0.24 to 0.54, P = 0.46, I2 = 0%, 101 children and adolescents, 2 studies, Analysis 6.5; Verschuren 2007; Scholtes 2010).
Resistance training improved muscle strength more than usual care in the short term (SMD 0.38, 95% CI 0.01 to 0.76, P = 0.04, I2 = 66%, 397 children and adolescents, 11 studies, Analysis 6.6; Dodd 2003; Liao 2007; Seniorou 2007; Verschuren 2007; Lee 2008; Fowler 2010; Reid 2010; Scholtes 2010; Pandey 2011; Chen 2012; Mitchell 2016) but not in the intermediate term (SMD 0.28, 95% CI −0.16 to 0.71, P = 0.21, I2 = 37%, 149 children and adolescents, 4 studies, Analysis 6.7; Dodd 2003; Verschuren 2007; Lee 2008; Scholtes 2010).
Sensitivity analysis
Using a fixed‐effect model rather than a random‐effects model impacted the effect sizes for strength in the short term (SMD 0.36, 95% CI 0.16 to 0.56, P = 0.001, I2 = 66%, 397 participants) and intermediate term (SMD 0.25, 95% CI −0.08 to 0.58, P = 0.13, I2 = 37%, 149 participants). Analyses not shown.
Summary of post hoc analyses
In agreement with the results of the analysis of aerobic exercise only compared to usual care, the pooled analysis showed some evidence that in children and adolescents with CP, aerobic exercise improves gross motor function in the short – but not intermediate – term, and no evidence that it improves short‐term gait speed, walking endurance or aerobic fitness.
The pooled analysis of resistance training and mixed training compared to usual care showed similar results to the analysis of resistance training only in terms of some evidence of an improvement in strength in the short term and no improvement in gross motor function or gait speed in the short term or strength in the intermediate term. The pooled analysis, however, found that participation improved following resistance training in the short term, which differed from findings in the primary analysis.
Discussion
Summary of main results
Overall, we are unable to provide firm conclusions regarding the effectiveness of exercise interventions for people with CP due to the poor quality of the available evidence, which was exacerbated by small sample sizes and, in turn, probably led to an underestimation of the extent of heterogeneity. As a result, there is substantial uncertainty related to the effect estimates presented in this review.
The results of the included trials suggest that aerobic exercise may result in a small improvement in gross motor function in the short and intermediate term and may improve physical activity. There is low‐ to very low‐quality evidence that aerobic exercise does not improve gait speed, walking endurance, or aerobic fitness, although these findings are mostly based on single studies. Generally, the results suggest that resistance training does not improve any aspect of activity or participation in people with CP but may improve muscle strength in children, adolescents and young adults in the short term and in children and adolescents in the intermediate term. In addition, a trial of 101 participants reported that resistance training improves walking endurance in children with CP in the short term (Mitchell 2016). Mixed training may improve participation, but at present, there is low‐quality evidence that it does not improve activity, muscle strength or aerobic fitness in children with CP. These conclusions, however, are largely based on the results of a single study (Verschuren 2007). Although only two trials compared resistance training and aerobic exercise in children and adolescents with CP (Johnston 2011; Olama 2011), the results indicate that there is no difference in terms of gait speed, gross motor function, quality of life or muscle strength between types of exercise in the short or intermediate term. Based on the data provided, exercise appears to be safe for people with CP, with no serious adverse events reported. The evidence for safety, however, is also incomplete because only 16 trials reported that they collected data on adverse events; it is unclear whether or not this reflects an absence of adverse events or a failure to report them. A small number of participants reported experiencing events potentially related to the intervention, including muscle soreness, mild knee, foot and ankle pain, shoulder pain from wearing weighted vests, fatigue, minor calf strain and falls (one of which resulted in a fracture).
Overall completeness and applicability of evidence
The evidence base for the use of exercise interventions for people with CP is incomplete. There is a lack of trials examining the effectiveness of both aerobic and resistance exercise in adults with CP. There is also a lack of trials investigating the intermediate‐ and long‐term effectiveness of exercise for people with CP; the longest follow‐up time point was four months postintervention (Verschuren 2007). Given the decline in mobility among young adults with CP (Bottos 2001; Day 2007; Opheim 2009), the effectiveness of exercise for slowing or preventing decline in activity and participation in the long term is a real concern (Shortland 2009). Few trials investigated the effectiveness of exercise for non‐ambulatory people with CP. Only 5 out of 23 trials that included an intervention that targeted the lower limbs included children and adolescents in GMFCS levels IV or V (Van den Berg‐Emons 1998; Johnston 2011; Smania 2011; Bryant 2013; Tedla 2014), and only one trial included children and adolescents in GMFCS levels IV and V only (Bryant 2013).
The evidence for the effectiveness of interventions at the level of participation on the International Classification of Functioning, Disability and Health (ICF) is incomplete (WHO 2001), with only 4 out of 29 included trials assessing participation (Verschuren 2007; Scholtes 2010; Johnston 2011; Mitchell 2016). Although three of these trials assessed participation using the CAPE, one trial reported the individual scores for each subscale of the CAPE, rather than the total score, making it difficult to pool results. Similarly, the evidence for the effect of exercise interventions on quality of life is incomplete. Of the four trials that assessed quality of life in children and adolescents, three assessed both participant‐ and parent‐reported quality of life, often with contradictory results (Engsberg 2006; Fowler 2010; Johnston 2011). Further, two trials reported the individual results for several subscales of the outcome measure and not an overall score, making it difficult to draw any firm conclusions regarding the impact of exercise on quality of life (Verschuren 2007; Fowler 2010).
Most trials assessed activity capacity, activity performance or both, with most assessing capacity rather than performance. The most commonly used measures of activity capacity were the GMFM and self‐selected gait speed. There was variation, however, in the component of the GMFM that trials assessed and reported (e.g. dimension E only, dimension D and E combined, total score) and in the methods they used to assess self‐selected gait speed (e.g. walking on a treadmill or walking over ground). Further, as a number of trials used the GMFM to assess motor capacity in adolescents outside of the age range for which the tool was developed (i.e. five months to 16 years) (Dodd 2003; Unnithan 2007; Verschuren 2007; Chrysagis 2009; Chrysagis 2012; Bryant 2013; Taylor 2013), the score may not accurately reflect participants' activity capacity. Perhaps unexpectedly, a number of trials did not assess physical fitness, particularly aerobic fitness; 3 of 14 trials assessed aerobic fitness following an aerobic exercise intervention, and 15 of 21 trials assessed muscle strength following a resistance training intervention.
There was consistently incomplete reporting of the comparator across trials. Although most trials reported that the control group received usual physiotherapy, reporting of the content and dose of usual care was poor. Reported physiotherapy varied considerably across individuals, and it was not clear from many trials if participants received the dose and content of physiotherapy prescribed.
We were unable to locate or extract data from three trials (Chrysagis 2009; Bryant 2013; Tedla 2014), which may have had an impact on the results of our meta‐analysis. In particular, the inclusion of data on muscle strength and gross motor function from Tedla 2014 would have increased the power of the analysis through the addition of a further 62 participants. Data from Bryant 2013 were only missing for the intermediate time point, but data on gross motor function from 31 participants in this trial may have impacted the outcome of the meta‐analysis.
The most effective dose of exercise for people with CP is currently unknown, making it difficult to prescribe exercise in this population. This is reflected in the large variation in the frequency, duration and intensity of exercise prescribed. There is a body of evidence supporting the effectiveness of exercise in general to improve aerobic fitness and muscle strength, which has contributed to the development of exercise prescription guidelines for the general population (American College of Sports Medicine 2009; Faigenbaum 2009; Garber 2011), and more recently, for people with CP (Verschuren 2016). While many included trials failed to report the volume and intensity of exercise prescribed, those that did report the dose of exercise prescribed did not meet current guidelines for exercise prescription for people with CP (Verschuren 2016). For example, of the 11 trials included in the pooled analysis of resistance training and mixed training in comparison to usual care, six were prescribed for a shorter duration than that suggested in guidelines (Dodd 2003; Liao 2007; Seniorou 2007; Lee 2008; Reid 2010; Pandey 2011), four trials either did not report the number of sets and repetitions performed or the number of sets and repetitions were lower than guideline recommendations (Verschuren 2007; Fowler 2010; Pandey 2011; Mitchell 2016), and five trials either did not report the intensity of the exercises or the intensity was lower than current guideline recommendations (Liao 2007; Verschuren 2007; Lee 2008; Scholtes 2010; Pandey 2011). Similarly, of the 14 trials that included aerobic exercise in the intervention, 12 did not state the intensity of exercise prescribed (Van den Berg‐Emons 1998; Verschuren 2007; Chrysagis 2009; Gharib 2011; Johnston 2011; Olama 2011; Smania 2011; Chen 2012; Chrysagis 2012; Bryant 2013; Mattern‐Baxter 2013; Emara 2015). It is possible that inadequate prescription of exercise volume and intensity across trials contributed to the limited or null improvement in physical fitness. At present, however, there is insufficient evidence to suggest that higher doses of exercise, in line with the current guidelines for people with and without CP (American College of Sports Medicine 2009; Faigenbaum 2009; Garber 2011, Verschuren 2016), result in improvements in physical fitness, activity or participation in people with CP. Further, the feasibility of delivering these higher doses of exercise to people with CP is not clear. There was variation in fidelity to the intervention among trials that reported this measure, perhaps because it was not feasible to deliver the dose prescribed in this population. This would suggest that failure to implement exercise interventions as planned contributed to the findings of this review. The findings of this review highlight the need for clearer reporting of the frequency, intensity and duration of exercise prescribed in future trials and further investigation into the effect and feasibility of following generic exercise guidelines for people with CP.
Quality of the evidence
Using the GRADE criteria (Guyatt 2008), we rated the quality of evidence for all comparisons as low or very low, mainly as a result of an overall high risk of bias for all trials and issues of imprecision.
We judged all trials as being at high risk of bias for blinding of participants. Unfortunately, while this is unavoidable when examining the effect of exercise in a trial, it does not negate the risk of introducing performance bias by not blinding participants and personnel. We also judged a large number of trials as being at high or unclear risk of bias for blinding of outcome assessment. It was recently reported that less than a quarter of physical therapy trials were adequately blinded and that blinding was poorly reported in trials (Armijo‐Olivo 2017). Our decision to classify studies that used a self‐report outcome as being at high risk of bias inflated the number of trials at high risk for blinding of outcome assessment. We believe that, although conservative, classifying these trials as being at high risk of bias was the correct decision given that lack of, or unclear, double blinding is associated with an average 22% exaggeration of intervention effects when assessing self‐report outcomes (Savović 2012). However, lack of blinding does not appear to exaggerate the intervention effect when assessing objective outcomes (Wood 2008; Savović 2012). Readers should therefore interpret the results for objective outcomes in these trials (judged at high risk of bias due to the inclusion of subjective outcomes) as being at low risk of detection bias. We judged most trials as being at unclear risk of bias for random sequence generation and allocation concealment; a recent study reported that only 39.7% and 11.5% of physical therapy trials achieved adequate random sequence generation and allocation concealment, respectively (Armijo‐Olivo 2015). Intervention effect estimates may be exaggerated by 11% in trials with inadequate or unclear sequence allocation and by 15% for trials with unclear or inadequate allocation concealment (Savović 2012). Effect sizes are exaggerated even further for self‐report outcomes whereas there is little evidence that inadequate or unclear sequence generation or allocation concealment exaggerates the intervention effect in trials with objective outcomes (Wood 2008; Savović 2012). A number of trials reported using sealed envelopes to generate a random sequence, which in itself appears to adequately prevent bias when compared to central randomisation (Herbison 2011). However, several of the trials in this review did not report enhanced security, such as use of opaque envelopes; intervention effects are exaggerated by, on average, 13% for trials that state that they use envelopes but do not give details of enhanced security (Herbison 2011).
Only four trials published a trial protocol prior to the publication of results. In addition, some of these trials were not the most recently published trials, suggesting that this issue is not improving with time. Chan 2004 found that statistically significant outcomes were 2.4 times more likely to be fully reported compared to non‐statistically significant outcomes. Although we judged most included trials as being at low risk of bias for incomplete outcome data, because of low levels of missing data, very few trials stated that they performed an intention‐to‐treat analysis. Excluding participants from the analysis can result in biased estimates of treatment effects (Nüesch 2009; Abraha 2015), although the direction of bias is unpredictable (Nüesch 2009).
Finally, 24 of the 29 included trials had small sample sizes (fewer than 50 participants), and as a result, data from a relatively small number of participants (65 to 397 participants) were included in pooled analyses. The small number of participants included in analyses may have impacted our findings in one of two ways, either inflating effect sizes or resulting in statistically non‐significant findings (Pereira 2012; Button 2013; Dechartres 2013). Effect sizes calculated on samples of fewer than 50 participants are, on average, 23% larger than estimates from trials with sample sizes of more than 50 participants (Dechartres 2013). However, the relatively small number of participants included in the analysis may have resulted in analyses that lacked statistical power. In addition, the small number of participants led to large within‐study variations and subsequently low between‐study variations; in many analyses heterogeneity was estimated as zero. Therefore, although the small sample sizes in trials may have resulted in analyses that lacked statistical power, our analyses likely underestimated the degree of heterogeneity, so we may have observed erroneously significant results.
Potential biases in the review process
We conducted an extensive search of all available literature, including grey literature. We included trials regardless of publication date or language and are therefore confident that this review includes all published evidence on the topic to date.
A broad and varied number of interventions may be described as exercise. The inclusion of certain interventions such as those described as 'gait training' or 'treadmill training' may be contentious. In order to ensure consistency when deciding if an intervention was classified as aerobic or resistance training, we referred to the definitions of exercise published by Caspersen 1985 and the US Department of Health and Human Services (USDHHS 2008). Repetitive movement of the lower limbs during walking on a treadmill or over ground meets the description of aerobic exercise, regardless of the support required to perform this repetitive movement. Similarly, we included any mode of exercise that involved repetitive movement of large muscle groups over a sustained period of time. For example, we included a swimming intervention where it was clear that participants swam continuously for a sustained period. We only included studies of resistance training if it was clear that the body's muscles were working or holding against an applied force, such as body weight, free weights, machine weights, or elastic bands (USDHHS 2008). We did not include studies that provided an intervention in addition to exercise, such as botulinum toxin, motivational interviewing or ankle foot orthoses, as it was not possible to distinguish the independent effect of exercise on the outcomes assessed.
We included postintervention means and SDs in our meta‐analysis if they were presented in the published report. We also calculated effect sizes for single studies where the effect size was not provided using postintervention means and SDs. This may have resulted in conservative estimates of the effect size as there was significant heterogeneity of the baseline scores in many studies. It may also explain the difference between the P values and CIs for effect estimates reported in some trials and those that we calculated.
Three authors are chartered physiotherapists and lecturers in physiotherapy. As professionals who might be involved in the delivery of exercise interventions, it is plausible that they might be perceived as having a bias favouring the effectiveness of exercise.
Agreements and disagreements with other studies or reviews
The results of this review are generally inconsistent with the results of previous reviews primarily because of differences in the number and type of included trials and because most previous reviews used narrative syntheses when drawing conclusions. Most authors accepted the statistical significance of comparisons reported in individual trials as indication of a positive effect. Rogers 2008 and Butler 2010 reviewed the literature on the effects of aerobic exercise for children with CP. Rogers 2008 presented the evidence from three trials, one RCT that was included in this review (Van den Berg‐Emons 1998), one cohort study and one RCT that we did not include in this review because the only difference between the intervention and control group was that the intervention group received active encouragement. Using a narrative synthesis of the literature, the authors concluded that aerobic exercise improved aerobic fitness and that no study assessed activity (Rogers 2008). Similarly, using a narrative synthesis of three trials included in this review (Van den Berg‐Emons 1998; Unnithan 2007; Verschuren 2007), Butler 2010 concluded that aerobic exercise may increase aerobic fitness but there was not enough evidence to indicate that it improved activity.
Two meta‐analyses assessed the effectiveness of resistance training for children and children and adults with CP (Scianni 2009; Park 2014b). Scianni 2009 reported that there was no short‐ or intermediate‐term improvement in strength, gross motor function or gait following resistance training in children with CP. Two of the six included studies are not included in the current review because they used electrical stimulation (Van der Linden 2003; Kerr 2006). Park 2014b reported that there was strong evidence for a large effect of strengthening interventions in people with CP, based on the results of 12 trials described in 13 reports. We included 11 of these trials in our review (Dodd 2003; Engsberg 2006; Unger 2006; Liao 2007; Unnithan 2007; Lee 2008; Maeland 2009; Fowler 2010; Scholtes 2010 (two reports); Chen 2012). However, similar to Scianni 2009, Park 2014b also included two trials that assessed the effect of electrical stimulation (Van der Linden 2003; Kerr 2006). Although Park 2014b did not report a clear plan for the meta‐analysis, it appears that the conclusion was based on a standardised effect size calculated by pooling all outcomes from all trials; this may explain the discrepancy between their results and ours. Further, although subgroup analyses were conducted according to outcome, it is not clear which trials contributed to each subgroup analysis, and it appears that more than one outcome measure from each trial was included in a single meta‐analysis. Park 2014b also combined the results of trials involving children and adults with CP, respectively.
A third systematic review investigated the effect of upper limb resistance training on all levels of the ICF Framework in children with CP (Rameckers 2014). Using a narrative synthesis, the authors concluded that strength training had a small to large effect on strength and that no study assessed the effect on activity or participation. These conclusions were informed by two trials included in the current review (McCubbin 1985; Reid 2010). However, we did not believe McCubbin 1985 assessed muscle strength and therefore did not include it in the meta‐analysis.
In contrast to our findings, a review of all physiotherapy interventions for adults with CP concluded that there was moderate‐quality evidence that strength training improves gait in adolescents and adults with CP (Jeglinsky 2010). However, this conclusion was based on the results of one RCT, Unger 2006, and therefore does not represent a thorough review of the literature as presented here.
Only one review to date has summarised the evidence for aerobic, anaerobic and resistance training for children with CP (Verschuren 2008). In contrast with our findings, the authors concluded that exercise may improve strength and aerobic capacity but that more trials are needed to determine the effects on activity, participation and quality of life. Authors drew these conclusions using a narrative synthesis of the results from both randomised and non‐randomised trials that took place prior to September 2006 and therefore do not represent the most recent or best quality evidence.
8071‐7926‐Study flow diagram.
Risk of bias summary: review authors' judgements about each risk of bias item for each included study.
Risk of bias graph: review authors' judgements about each risk of bias item presented as percentages across all included studies.
Funnel plot of comparison: 6 Resistance training and mixed training versus usual care, outcome: 6.1 Activity: gross motor function; short term.
Funnel plot of comparison: 6 Resistance training and mixed training versus usual care, outcome: 6.6 Muscle strength; short term.

Comparison 1 Aerobic exercise versus usual care, Outcome 1 Activity: gross motor function, short term.

Comparison 1 Aerobic exercise versus usual care, Outcome 2 Activity: gait speed, short term.

Comparison 1 Aerobic exercise versus usual care, Outcome 3 Activity: walking endurance; short term.

Comparison 1 Aerobic exercise versus usual care, Outcome 4 Activity: gait speed, intermediate term.

Comparison 1 Aerobic exercise versus usual care, Outcome 5 Activity: gross motor function, intermediate term.

Comparison 1 Aerobic exercise versus usual care, Outcome 6 Activity: daily physical activity; short term.

Comparison 1 Aerobic exercise versus usual care, Outcome 7 Aerobic fitness; short term.

Comparison 2 Resistance training versus usual care, Outcome 1 Activity: gross motor function, children and adolescents; short term.

Comparison 2 Resistance training versus usual care, Outcome 2 Activity: gross motor function, children and adolescents; intermediate term.

Comparison 2 Resistance training versus usual care, Outcome 3 Activity: gait speed, children and adolescents; short term.

Comparison 2 Resistance training versus usual care, Outcome 4 Activity: gait speed, children and adolescents; intermediate term.

Comparison 2 Resistance training versus usual care, Outcome 5 Activity: gait speed, adults; short term.

Comparison 2 Resistance training versus usual care, Outcome 6 Activity: gross motor function, adults; short term.

Comparison 2 Resistance training versus usual care, Outcome 7 Activity: walking endurance, adults; short term.

Comparison 2 Resistance training versus usual care, Outcome 8 Participation, children and adolescents; short term.

Comparison 2 Resistance training versus usual care, Outcome 9 Participation, children and adolescents; intermediate term.
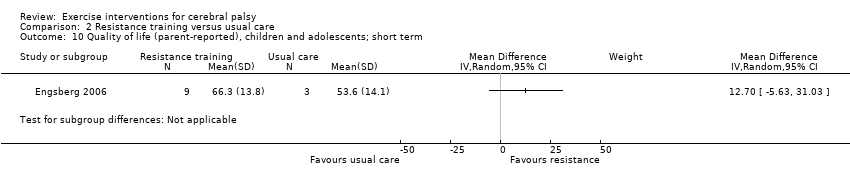
Comparison 2 Resistance training versus usual care, Outcome 10 Quality of life (parent‐reported), children and adolescents; short term.

Comparison 2 Resistance training versus usual care, Outcome 11 Quality of life (child‐reported), children and adolescents; short term.

Comparison 2 Resistance training versus usual care, Outcome 12 Muscle strength, children and adolescents; short term.

Comparison 2 Resistance training versus usual care, Outcome 13 Muscle strength, children and adolescents; intermediate term.

Comparison 2 Resistance training versus usual care, Outcome 14 Muscle strength, adults; short term.

Comparison 3 Mixed training versus usual care, Outcome 1 Activity: gross motor function; short term.

Comparison 3 Mixed training versus usual care, Outcome 2 Activity: gait speed; short term.
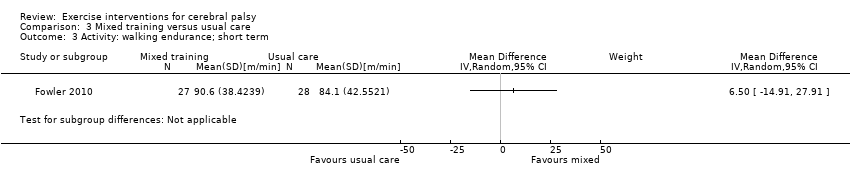
Comparison 3 Mixed training versus usual care, Outcome 3 Activity: walking endurance; short term.
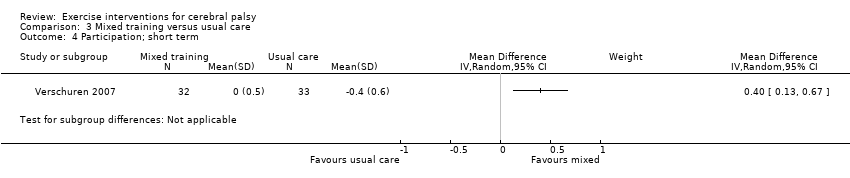
Comparison 3 Mixed training versus usual care, Outcome 4 Participation; short term.

Comparison 3 Mixed training versus usual care, Outcome 5 Participation; intermediate term.

Comparison 3 Mixed training versus usual care, Outcome 6 Aerobic fitness; short term.

Comparison 3 Mixed training versus usual care, Outcome 7 Muscle strength; short term.
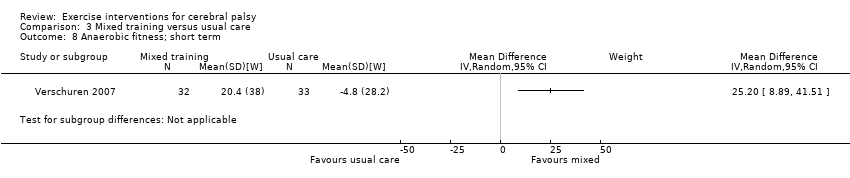
Comparison 3 Mixed training versus usual care, Outcome 8 Anaerobic fitness; short term.

Comparison 3 Mixed training versus usual care, Outcome 9 Aerobic fitness; intermediate term.

Comparison 3 Mixed training versus usual care, Outcome 10 Anaerobic fitness; intermediate term.

Comparison 3 Mixed training versus usual care, Outcome 11 Muscle strength; intermediate term.

Comparison 4 Resistance training versus aerobic exercise, Outcome 1 Activity: gross motor function; short term.

Comparison 4 Resistance training versus aerobic exercise, Outcome 2 Activity: gait speed; short term.

Comparison 4 Resistance training versus aerobic exercise, Outcome 3 Activity: gait speed; intermediate term.
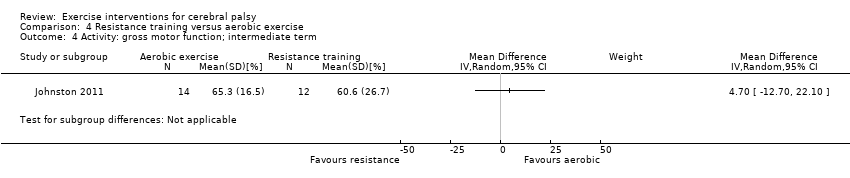
Comparison 4 Resistance training versus aerobic exercise, Outcome 4 Activity: gross motor function; intermediate term.

Comparison 4 Resistance training versus aerobic exercise, Outcome 5 Muscle strength; short term.

Comparison 4 Resistance training versus aerobic exercise, Outcome 6 Muscle strength; intermediate term.

Comparison 5 Aerobic exercise and mixed training versus usual care, Outcome 1 Activity: gross motor function; short term.
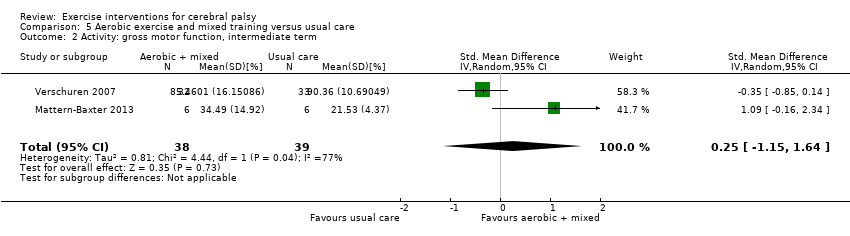
Comparison 5 Aerobic exercise and mixed training versus usual care, Outcome 2 Activity: gross motor function, intermediate term.
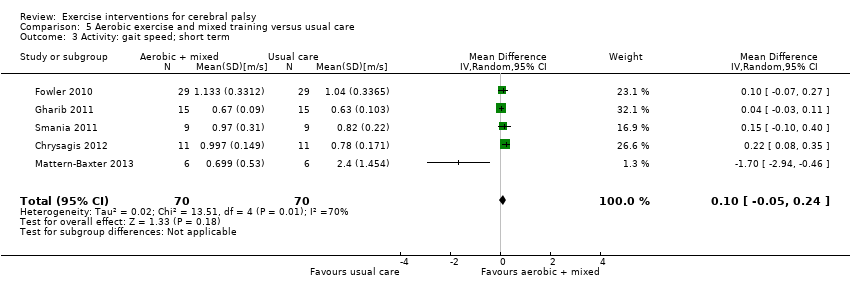
Comparison 5 Aerobic exercise and mixed training versus usual care, Outcome 3 Activity: gait speed; short term.

Comparison 5 Aerobic exercise and mixed training versus usual care, Outcome 4 Activity: walking endurance; short term.

Comparison 5 Aerobic exercise and mixed training versus usual care, Outcome 5 Aerobic fitness; short term.

Comparison 6 Resistance training and mixed training versus usual care, Outcome 1 Activity: gross motor function; short term.

Comparison 6 Resistance training and mixed training versus usual care, Outcome 2 Activity: gross motor function; intermediate term.
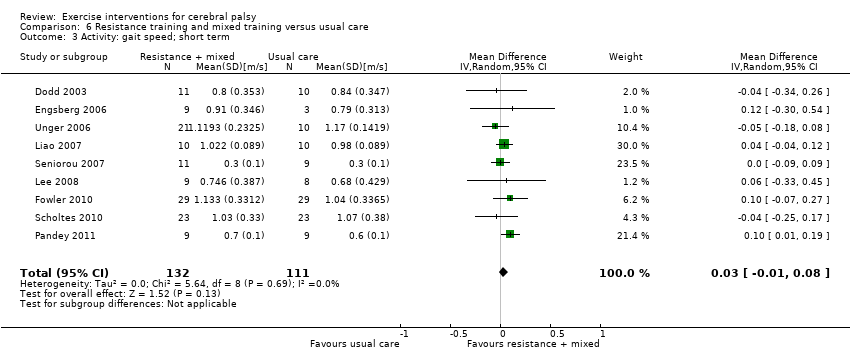
Comparison 6 Resistance training and mixed training versus usual care, Outcome 3 Activity: gait speed; short term.

Comparison 6 Resistance training and mixed training versus usual care, Outcome 4 Participation; short term.

Comparison 6 Resistance training and mixed training versus usual care, Outcome 5 Participation; intermediate term.
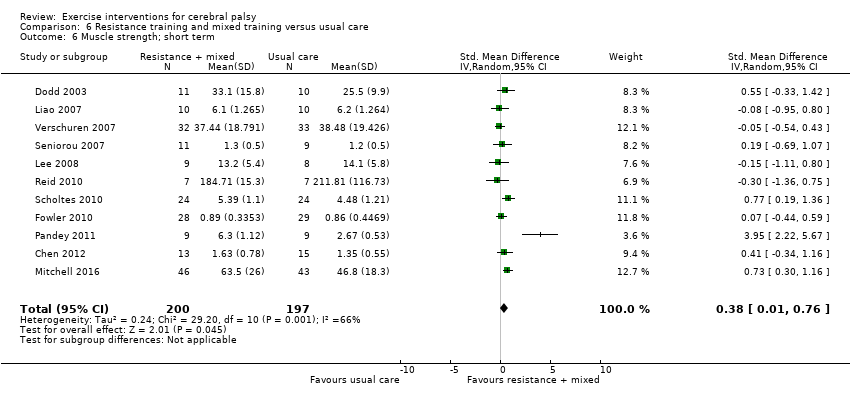
Comparison 6 Resistance training and mixed training versus usual care, Outcome 6 Muscle strength; short term.
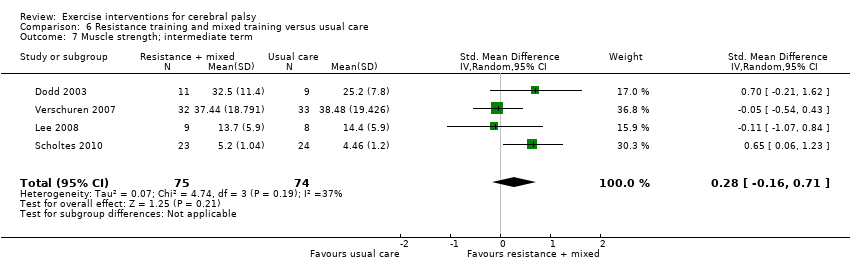
Comparison 6 Resistance training and mixed training versus usual care, Outcome 7 Muscle strength; intermediate term.
| Aerobic exercise versus usual care | ||||||
| Patient or population: children and adolescents with cerebral palsy Setting: mixed (community, outpatients, home) | ||||||
| Outcomes | Anticipated absolute effects* (95% CI) | Relative effect | Number of participants | Quality of the evidence | Comments | |
| Risk with usual care | Risk with aerobic exercise | |||||
| Activity Gross motor function assessed with the Gross Motor Function Measure (follow‐up 0 to 1 month) | The mean gross motor function ranged across control groups from 0.20% to 65.13% | The standardised mean gross motor function in the intervention group was 0.53 higher (0.02 higher to 1.04 higher) | — | 65 | ⊕⊕⊝⊝ | Higher score indicates improved activity A rule of thumb for interpreting SMD is that 0.2 represents a small effect, 0.5 a moderate effect, and 0.8 a large effect (Cohen 1988) |
| Activity Gait speed assessed with a timed walk test (follow‐up 0 to 1 month) | The mean gait speed ranged across control groups from 0.63 m/s to 2.40 m/s | The mean gait speed in the intervention groups was0.09 m/s faster (0.11 m/s slower to 0.28 m/s faster) | — | 82 | ⊕⊝⊝⊝ | Higher speed indicates improved activity |
| *The risk in the intervention group (and its 95% CI) is based on the assumed risk in the comparison group and the relative effect of the intervention (and its 95% CI). | ||||||
| GRADE Working Group grades of evidence | ||||||
| aAll studies are at high risk of bias because it is not possible to blind personnel or participants to group allocation. | ||||||
| Resistance training versus usual care | ||||||
| Patient or population: children and adolescents with cerebral palsy | ||||||
| Outcomes | Anticipated absolute effects* (95% CI) | Relative effect | Number of participants | Quality of the evidence | Comments | |
| Risk with usual care | Risk with resistance training | |||||
| Activity Gross motor function assessed with the Gross Motor Function Measure (follow‐up 0 to 1 month) | The mean gross motor function ranged across control groups from 60.80% to 81.30% | The standardised mean gross motor function in the intervention groups was 0.12 higher (0.19 lower to 0.43 higher) | — | 164 | ⊕⊕⊝⊝ | A rule of thumb for interpreting the SMD is that 0.2 represents a small effect, 0.5 a moderate effect, and 0.8 a large effect (Cohen 1988) Higher score indicates improved activity |
| Activity Gross motor function assessed with the Gross Motor Function Measure (follow‐up > 1 month to 6 months) | The mean gross motor function ranged across control groups from 61.80% to 74.30% | The standardised mean gross motor function in the intervention groups was 0.13 higher (‐0.30 lower to 0.55 higher) | — | 85 | ⊕⊕⊝⊝ | A rule of thumb for interpreting SMD is that 0.2 represents a small effect, 0.5 a moderate effect, and 0.8 a large effect (Cohen 1988) Higher score indicates improved activity |
| Activity Gait speed assessed with a timed walk test (follow‐up 0 to 1 month) | The mean gait speed ranged across control groups from0.30 m/s to 1.17 m/s | The mean gait speed in the intervention groups was 0.03 m/s faster (0.02 m/s slower to 0.07 m/s faster) | — | 185 | ⊕⊕⊝⊝ | Higher speed indicates improved activity |
| Activity Gait speed assessed with a timed walk test (follow‐up > 1 month to 6 months) | The mean gait speed ranged across control groups from 0.68 m/s to 1.06 m/s | The mean gait speed in the intervention groups was 0.03 m/s slower (0.17 m/s slower to 0.11 m/s faster) | — | 84 | ⊕⊕⊝⊝ | Higher speed indicates improved activity |
| Participation Assessed with various measures (follow‐up 0 to 1 month) | The mean participation in the control group ranged from 7.40 to 31.14 | The standardised mean participation in the intervention groups was 0.34 higher (0.01 lower to 0.70 higher) | — | 127 (2) | ⊕⊕⊝⊝ Lowa,b,c | A rule of thumb for interpreting SMD is that 0.2 represents a small effect, 0.5 a moderate effect, and 0.8 a large effect (Cohen 1988) Higher score indicates improved participation |
| *The risk in the intervention group (and its 95% CI) is based on the assumed risk in the comparison group and the relative effect of the intervention (and its 95% CI). | ||||||
| GRADE Working Group grades of evidence | ||||||
| aAll trials are at high risk of bias because it is not possible to blind personnel or participants to group allocation. | ||||||
| Mixed training versus usual care | ||||||
| Patient or population: children and adolescents with cerebral palsy | ||||||
| Outcomes | Anticipated absolute effects* (95% CI) | Relative effect | Number of participants | Quality of the evidence | Comments | |
| Risk with usual care | Risk with mixed training | |||||
| Activity Gross motor function assessed with the Gross Motor Function Measure (follow‐up 0 to 1 month) | The mean gross motor function in the control groups ranged from 30.76% to 90.11% | The standardised mean gross motor function in the intervention groups was 0.02 higher (0.29 lower to 0.33 higher) | — | 163 | ⊕⊕⊝⊝ | A rule of thumb for interpreting SMD is that 0.2 represents a small effect, 0.5 a moderate effect, and 0.8 a large effect (Cohen 1988) Higher score indicates improved activity |
| *The risk in the intervention group (and its 95% CI) is based on the assumed risk in the comparison group and the relative effect of the intervention (and its 95% CI). | ||||||
| GRADE Working Group grades of evidence | ||||||
| aAll trials are at high risk of bias because it is not possible to blind personnel or participants to group allocation. | ||||||
| Resistance training versus aerobic exercise | ||||||
| Patient or population: children with cerebral palsy | ||||||
| Outcomes | Anticipated absolute effects* (95% CI) | Relative effect | Number of participants | Quality of the evidence | Comments | |
| Risk with aerobic exercise | Risk with resistance training | |||||
| Activity Gross motor function assessed with various measures (follow‐up 0 to 1 month) | The mean gross motor function in the aerobic exercise groups ranged from 44.09% to 63.30% | The standardised mean gross motor function in the intervention groups was 0.02 higher (0.50 lower to 0.55 higher) | — | 56 | ⊕⊕⊝⊝ | Higher score indicates improved activity |
| *The risk in the intervention group (and its 95% CI) is based on the assumed risk in the comparison group and the relative effect of the intervention (and its 95% CI). | ||||||
| GRADE Working Group grades of evidence | ||||||
| aAll trials are at high risk of bias because it is not possible to blind participants or personnel to group allocation. | ||||||
| Binary data | We planned to present the relative risk (or risk ratio) with a 95% confidence interval, and calculate the number needed to treat for an additional beneficial outcome as an absolute measure of treatment effect. We will report the odds ratio (OR) with a 95% confidence interval in future updates of this review, as most studies with a dichotomous outcome report the OR. |
| Cluster trials | We planned to seek direct estimates of the effect from an analysis that accounted for cluster design. Where the analysis in a cluster trial did not account for the cluster design, we planned to use the approximately correct analysis approach, presented in the Cochrane Handbook for Systematic Reviews of Interventions (Higgins 2011c). |
| Crossover trials | Where studies presented repeated measurements over time, we planned to only include data from 1 time point from an individual study in any single meta‐analysis. If inadequate data were available to conduct this analysis, we planned to only include data from the first phase of the cross‐over trial, as if it were from a parallel trial design. We planned to combine the results of cross‐over studies with those of parallel studies by imputing the post‐treatment, between‐condition correlation coefficient from an included study that presents individual participant data, and use this to calculate the standard error of the SMD, using the generic inverse‐variance method. |
| Assessment of reporting biases | Where we identified evidence of publication bias, we planned to consider its likely influence on the observed effect sizes in our interpretation of the results. However, as common tests of publication bias lack sensitivity, we planned to consider the possible influence that a dominance of small trials might have on pooled effect sizes in our interpretation. |
| Subgroup analysis and identification of heterogeneity | We planned to further explore possible clinical heterogeneity through preplanned subgroup analysis based on important clinical features. We predicted that some trials would include ambulatory participants only (i.e. people who could walk with or without a mobility aid; GMFCS level I, II, and III), and some studies would include participants who could walk without a mobility aid only (i.e. GMFCS level I and II). Where adequate data allowed, we planned to undertake 2 subgroup analyses for studies that included ambulatory people only (i.e. GMFCS level I, II, and III), and for studies that included ambulatory people who walk without a mobility aid only (i.e. GMFCS level I and II). |
| Sensitivity analysis | We planned to explore the impact of studies at high risk of bias by reanalysis after excluding studies rated at overall high risk of bias. We also planned to explore the impact of excluding studies at high risk of bias for missing data through reanalysis. We planned to explore the influence of using imputed correlation coefficients in our approach to including cross‐over and cluster trials by reanalysing these data with adjusted (higher and lower) coefficient values. |
| GMFCS: Gross Motor Function Classification System; SMD: standardised mean difference. | |
| Outcome or subgroup title | No. of studies | No. of participants | Statistical method | Effect size |
| 1 Activity: gross motor function, short term Show forest plot | 3 | 65 | Std. Mean Difference (IV, Random, 95% CI) | 0.53 [0.02, 1.04] |
| 2 Activity: gait speed, short term Show forest plot | 4 | 82 | Mean Difference (IV, Random, 95% CI) | 0.09 [‐0.11, 0.28] |
| 3 Activity: walking endurance; short term Show forest plot | 1 | Mean Difference (IV, Random, 95% CI) | Subtotals only | |
| 4 Activity: gait speed, intermediate term Show forest plot | 1 | Mean Difference (IV, Random, 95% CI) | Subtotals only | |
| 5 Activity: gross motor function, intermediate term Show forest plot | 1 | Mean Difference (IV, Random, 95% CI) | Subtotals only | |
| 6 Activity: daily physical activity; short term Show forest plot | 1 | Mean Difference (IV, Random, 95% CI) | Subtotals only | |
| 7 Aerobic fitness; short term Show forest plot | 1 | Mean Difference (IV, Random, 95% CI) | Subtotals only | |
| Outcome or subgroup title | No. of studies | No. of participants | Statistical method | Effect size |
| 1 Activity: gross motor function, children and adolescents; short term Show forest plot | 7 | 164 | Std. Mean Difference (IV, Random, 95% CI) | 0.12 [‐0.19, 0.43] |
| 2 Activity: gross motor function, children and adolescents; intermediate term Show forest plot | 3 | 85 | Std. Mean Difference (IV, Random, 95% CI) | 0.13 [‐0.30, 0.55] |
| 3 Activity: gait speed, children and adolescents; short term Show forest plot | 8 | 185 | Mean Difference (IV, Random, 95% CI) | 0.03 [‐0.02, 0.07] |
| 4 Activity: gait speed, children and adolescents; intermediate term Show forest plot | 3 | 84 | Mean Difference (IV, Random, 95% CI) | ‐0.03 [‐0.17, 0.11] |
| 5 Activity: gait speed, adults; short term Show forest plot | 1 | Mean Difference (IV, Random, 95% CI) | Subtotals only | |
| 6 Activity: gross motor function, adults; short term Show forest plot | 1 | Mean Difference (IV, Random, 95% CI) | Subtotals only | |
| 7 Activity: walking endurance, adults; short term Show forest plot | 1 | Mean Difference (IV, Random, 95% CI) | Subtotals only | |
| 8 Participation, children and adolescents; short term Show forest plot | 2 | 127 | Std. Mean Difference (IV, Random, 95% CI) | 0.34 [‐0.01, 0.70] |
| 9 Participation, children and adolescents; intermediate term Show forest plot | 1 | Mean Difference (IV, Random, 95% CI) | Subtotals only | |
| 10 Quality of life (parent‐reported), children and adolescents; short term Show forest plot | 1 | Mean Difference (IV, Random, 95% CI) | Subtotals only | |
| 11 Quality of life (child‐reported), children and adolescents; short term Show forest plot | 1 | Mean Difference (IV, Random, 95% CI) | Subtotals only | |
| 12 Muscle strength, children and adolescents; short term Show forest plot | 8 | 247 | Std. Mean Difference (IV, Random, 95% CI) | 0.53 [0.00, 1.06] |
| 13 Muscle strength, children and adolescents; intermediate term Show forest plot | 3 | 84 | Std. Mean Difference (IV, Random, 95% CI) | 0.50 [0.06, 0.94] |
| 14 Muscle strength, adults; short term Show forest plot | 1 | Mean Difference (IV, Random, 95% CI) | Subtotals only | |
| Outcome or subgroup title | No. of studies | No. of participants | Statistical method | Effect size |
| 1 Activity: gross motor function; short term Show forest plot | 4 | 163 | Std. Mean Difference (IV, Random, 95% CI) | 0.02 [‐0.29, 0.33] |
| 2 Activity: gait speed; short term Show forest plot | 1 | Mean Difference (IV, Random, 95% CI) | Subtotals only | |
| 3 Activity: walking endurance; short term Show forest plot | 1 | Mean Difference (IV, Random, 95% CI) | Subtotals only | |
| 4 Participation; short term Show forest plot | 1 | Mean Difference (IV, Random, 95% CI) | Subtotals only | |
| 5 Participation; intermediate term Show forest plot | 1 | Mean Difference (IV, Random, 95% CI) | Subtotals only | |
| 6 Aerobic fitness; short term Show forest plot | 2 | 78 | Std. Mean Difference (IV, Random, 95% CI) | 0.05 [‐0.39, 0.50] |
| 7 Muscle strength; short term Show forest plot | 3 | 150 | Std. Mean Difference (IV, Random, 95% CI) | 0.08 [‐0.24, 0.40] |
| 8 Anaerobic fitness; short term Show forest plot | 1 | Mean Difference (IV, Random, 95% CI) | Subtotals only | |
| 9 Aerobic fitness; intermediate term Show forest plot | 1 | Mean Difference (IV, Random, 95% CI) | Subtotals only | |
| 10 Anaerobic fitness; intermediate term Show forest plot | 1 | Mean Difference (IV, Random, 95% CI) | Subtotals only | |
| 11 Muscle strength; intermediate term Show forest plot | 1 | Mean Difference (IV, Random, 95% CI) | Subtotals only | |
| Outcome or subgroup title | No. of studies | No. of participants | Statistical method | Effect size |
| 1 Activity: gross motor function; short term Show forest plot | 2 | 56 | Std. Mean Difference (IV, Random, 95% CI) | 0.02 [‐0.50, 0.55] |
| 2 Activity: gait speed; short term Show forest plot | 1 | Mean Difference (IV, Random, 95% CI) | Subtotals only | |
| 3 Activity: gait speed; intermediate term Show forest plot | 1 | Mean Difference (IV, Random, 95% CI) | Subtotals only | |
| 4 Activity: gross motor function; intermediate term Show forest plot | 1 | Mean Difference (IV, Random, 95% CI) | Subtotals only | |
| 5 Muscle strength; short term Show forest plot | 2 | 56 | Std. Mean Difference (IV, Random, 95% CI) | ‐0.11 [‐0.64, 0.41] |
| 6 Muscle strength; intermediate term Show forest plot | 1 | Mean Difference (IV, Random, 95% CI) | Subtotals only | |
| Outcome or subgroup title | No. of studies | No. of participants | Statistical method | Effect size |
| 1 Activity: gross motor function; short term Show forest plot | 7 | 228 | Std. Mean Difference (IV, Random, 95% CI) | 0.36 [0.09, 0.62] |
| 2 Activity: gross motor function, intermediate term Show forest plot | 2 | 77 | Std. Mean Difference (IV, Random, 95% CI) | 0.25 [‐1.15, 1.64] |
| 3 Activity: gait speed; short term Show forest plot | 5 | 140 | Mean Difference (IV, Random, 95% CI) | 0.10 [‐0.05, 0.24] |
| 4 Activity: walking endurance; short term Show forest plot | 2 | 73 | Mean Difference (IV, Random, 95% CI) | 8.43 [‐12.38, 29.23] |
| 5 Aerobic fitness; short term Show forest plot | 3 | 98 | Std. Mean Difference (IV, Random, 95% CI) | 0.06 [‐0.34, 0.45] |
| Outcome or subgroup title | No. of studies | No. of participants | Statistical method | Effect size |
| 1 Activity: gross motor function; short term Show forest plot | 11 | 327 | Std. Mean Difference (IV, Random, 95% CI) | 0.21 [‐0.01, 0.43] |
| 2 Activity: gross motor function; intermediate term Show forest plot | 4 | 150 | Std. Mean Difference (IV, Random, 95% CI) | ‐0.08 [‐0.41, 0.24] |
| 3 Activity: gait speed; short term Show forest plot | 9 | 243 | Mean Difference (IV, Random, 95% CI) | 0.03 [‐0.01, 0.08] |
| 4 Participation; short term Show forest plot | 3 | 192 | Std. Mean Difference (IV, Random, 95% CI) | 0.35 [0.07, 0.64] |
| 5 Participation; intermediate term Show forest plot | 2 | 101 | Mean Difference (IV, Random, 95% CI) | 0.15 [‐0.24, 0.54] |
| 6 Muscle strength; short term Show forest plot | 11 | 397 | Std. Mean Difference (IV, Random, 95% CI) | 0.38 [0.01, 0.76] |
| 7 Muscle strength; intermediate term Show forest plot | 4 | 149 | Std. Mean Difference (IV, Random, 95% CI) | 0.28 [‐0.16, 0.71] |