Exercise interventions for cerebral palsy
Information
- DOI:
- https://doi.org/10.1002/14651858.CD011660.pub2Copy DOI

- Database:
-
- Cochrane Database of Systematic Reviews
- Version published:
-
- 11 June 2017see what's new
- Type:
-
- Intervention
- Stage:
-
- Review
- Cochrane Editorial Group:
-
Cochrane Developmental, Psychosocial and Learning Problems Group
- Copyright:
-
- Copyright © 2017 The Cochrane Collaboration. Published by John Wiley & Sons, Ltd.
Article metrics
Altmetric:
Cited by:
Authors
Contributions of authors
Jennifer M Ryan: conceived and designed the review protocol; implemented the search strategy, applied eligibility criteria, assessed studies, extracted and analysed data; assessed the quality of the evidence using the GRADE approach; led the write‐up of the review; and has overall responsibility for the review.
Elizabeth E Cassidy: informed the protocol design; applied eligibility criteria, assessed studies, extracted data; assessed the quality of the evidence using the GRADE approach; and assisted with the write‐up of the review.
Stephen G Noorduyn: informed the protocol design; acted as the third reviewer; and assisted with the write‐up of the review.
Neil E O'Connell: informed the protocol design; oversaw the data synthesis; acted as the third reviewer; and assisted with the write‐up of the review
Sources of support
Internal sources
-
Brunel University London, UK.
Provided JMR and NEO'C with the time required to undertake this review
External sources
-
None, Other.
Declarations of interest
Jennifer M Ryan, Elizabeth E Cassidy, and Neil E O'Connell are chartered physiotherapists and lecturers in physiotherapy. As professionals who might be involved in the delivery of exercise interventions, it is plausible that they might be perceived as having a bias favouring the effectiveness of exercise.
Jennifer M Ryan is receiving funding from Action Medical Research and the Chartered Society of Physiotherapy Charitable Trust, to evaluate the feasibility, acceptability and efficacy of resistance training for adolescents with CP.
Elizabeth E Cassidy: none known.
Stephen G Noorduyn: Stephen was lead author on Noorduyn 2011, which was screened by JR and EC.
Neil E O'Connell: none known.
Acknowledgements
We thank the Cochrane Developmental, Psychosocial, and Learning Problems editorial team, in particular Geraldine Macdonald and Joanne Wilson, for their guidance and support. We also thank Margaret Anderson, Information Specialist with Cochrane Developmental, Psychosocial, and Learning Problems, for her assistance with designing the search strategy and conducting the search. We are grateful to Georgia Spiliotopoulou and João De Aguiar Greca for their assistance with checking the eligibility of studies that were not published in English. We are also grateful to the authors who provided us with data to include in the review.
Version history
| Published | Title | Stage | Authors | Version |
| 2017 Jun 11 | Exercise interventions for cerebral palsy | Review | Jennifer M Ryan, Elizabeth E Cassidy, Stephen G Noorduyn, Neil E O'Connell | |
| 2015 Apr 15 | Exercise interventions for adults and children with cerebral palsy | Protocol | Jennifer M Ryan, Elizabeth E Cassidy, Stephen G Noorduyn, Neil E O'Connell | |
Differences between protocol and review
-
The title has been changed from 'Exercise interventions for adults and children with cerebral palsy' to 'Exercise interventions for cerebral palsy', in accordance with guidance from the Cochrane Handbook (Higgins 2011b).
-
We planned to include studies that used any validated scale that measured the predefined primary and secondary outcomes. However, as trials used a range of outcome measures for these outcomes, we included any measure that purported to measure them, regardless of whether or not it was validated specifically in people with CP.
-
Although we proposed to classify general gross motor function as unaided walking, walking with aids, or unable to walk (Beckung 2008), most studies reported the GMFCS level of participants. Therefore, we reported the GMFCS level when available and the use of mobility aids when the GMFCS level was not available.
-
We were not able to use the following methods in the review, which we archived for use in future updates (see Table 1).
-
We planned to present the relative risk (or risk ratio (RR)) with 95% CI and calculate the number needed to treat for an additional beneficial outcome as an absolute measure of treatment effect, where studies used dichotomous outcomes (see Measures of treatment effect and Ryan 2015). We did not, however, identify any studies that reported dichotomous outcomes. Further, we will report the odds ratio (OR) with 95% CI in updates of this review as most studies report the OR rather than the RR if the outcome is dichotomous.
-
We planned to combine the results of cross‐over studies with those of parallel studies by imputing the post‐treatment between‐condition correlation coefficient from an included study that presented individual participant data, and using this to calculate the standard error of the SMD, using the generic inverse‐variance method (see Unit of analysis issues and Ryan 2015).
-
We planned to further explore possible clinical heterogeneity through preplanned subgroup analysis based on important clinical features. We predicted that some trials would include ambulatory participants only (i.e. people who could walk with or without a mobility aid; GMFCS level I, II, and III), and some studies would include participants who could walk without a mobility aid only (i.e. GMFCS level I and II). Where adequate data allowed, we planned to undertake two subgroup analyses for studies that include ambulatory people only (i.e. GMFCS level I, II, and III) and for studies that include ambulatory people who walk without a mobility aid only (i.e. GMFCS level I and II). However, due to the small number of trials amenable to meta‐analyses, we did not conduct subgroup analysis.
-
We planned to explore the impact of studies at high risk of bias by reanalysis with studies rated at overall high risk of bias excluded. However, we could not do this as all studies were rated at high risk of bias.
-
As stated in the 'Dealing with missing data' section, we planned to include all studies in the main analysis and exclude studies that were at high risk of bias for incomplete outcome data as a sensitivity analysis (Ryan 2015). However, this was not possible because of the small number of trials in each meta‐analysis.
-
We planned to explore the influence of using imputed correlation coefficients in our approach to including cross‐over and cluster trials (see Unit of analysis issues) by reanalysing these data with adjusted (higher and lower) coefficient values (Ryan 2015). However, we did not identify any cluster trials or include data from cross‐over trials in any pooled analyses.
-
-
We stated in the protocol that Dr Brian Timmons would validate the final list of studies (Ryan 2015). Dr Timmons did not validate the final list of studies, so we deleted this sentence from the 'Selection of studies' section in the review.
-
Following identification of included studies, we noted a large overlap between the content of aerobic exercise interventions and mixed training interventions and between the content of resistance training interventions and mixed training interventions, respectively. We therefore decided to conduct a post hoc pooled analysis of aerobic exercise and mixed training versus usual care and resistance training and mixed training versus usual care.
Keywords
MeSH
Medical Subject Headings (MeSH) Keywords
Medical Subject Headings Check Words
Adolescent; Adult; Child; Female; Humans; Male; Young Adult;
PICOs

8071‐7926‐Study flow diagram.
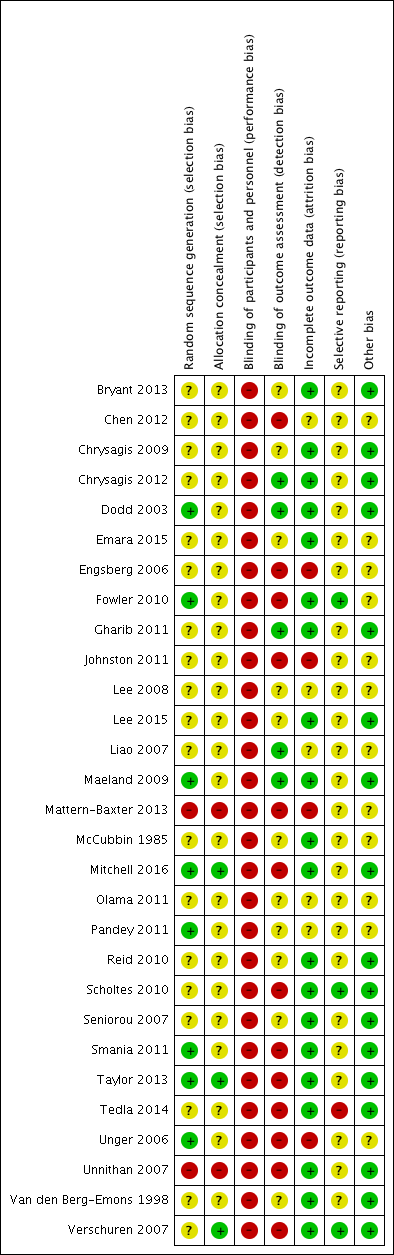
Risk of bias summary: review authors' judgements about each risk of bias item for each included study.

Risk of bias graph: review authors' judgements about each risk of bias item presented as percentages across all included studies.

Funnel plot of comparison: 6 Resistance training and mixed training versus usual care, outcome: 6.1 Activity: gross motor function; short term.

Funnel plot of comparison: 6 Resistance training and mixed training versus usual care, outcome: 6.6 Muscle strength; short term.

Comparison 1 Aerobic exercise versus usual care, Outcome 1 Activity: gross motor function, short term.

Comparison 1 Aerobic exercise versus usual care, Outcome 2 Activity: gait speed, short term.

Comparison 1 Aerobic exercise versus usual care, Outcome 3 Activity: walking endurance; short term.

Comparison 1 Aerobic exercise versus usual care, Outcome 4 Activity: gait speed, intermediate term.

Comparison 1 Aerobic exercise versus usual care, Outcome 5 Activity: gross motor function, intermediate term.

Comparison 1 Aerobic exercise versus usual care, Outcome 6 Activity: daily physical activity; short term.

Comparison 1 Aerobic exercise versus usual care, Outcome 7 Aerobic fitness; short term.

Comparison 2 Resistance training versus usual care, Outcome 1 Activity: gross motor function, children and adolescents; short term.

Comparison 2 Resistance training versus usual care, Outcome 2 Activity: gross motor function, children and adolescents; intermediate term.

Comparison 2 Resistance training versus usual care, Outcome 3 Activity: gait speed, children and adolescents; short term.

Comparison 2 Resistance training versus usual care, Outcome 4 Activity: gait speed, children and adolescents; intermediate term.

Comparison 2 Resistance training versus usual care, Outcome 5 Activity: gait speed, adults; short term.

Comparison 2 Resistance training versus usual care, Outcome 6 Activity: gross motor function, adults; short term.

Comparison 2 Resistance training versus usual care, Outcome 7 Activity: walking endurance, adults; short term.

Comparison 2 Resistance training versus usual care, Outcome 8 Participation, children and adolescents; short term.

Comparison 2 Resistance training versus usual care, Outcome 9 Participation, children and adolescents; intermediate term.
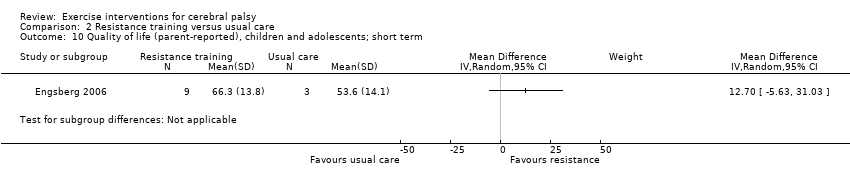
Comparison 2 Resistance training versus usual care, Outcome 10 Quality of life (parent‐reported), children and adolescents; short term.

Comparison 2 Resistance training versus usual care, Outcome 11 Quality of life (child‐reported), children and adolescents; short term.

Comparison 2 Resistance training versus usual care, Outcome 12 Muscle strength, children and adolescents; short term.

Comparison 2 Resistance training versus usual care, Outcome 13 Muscle strength, children and adolescents; intermediate term.

Comparison 2 Resistance training versus usual care, Outcome 14 Muscle strength, adults; short term.

Comparison 3 Mixed training versus usual care, Outcome 1 Activity: gross motor function; short term.

Comparison 3 Mixed training versus usual care, Outcome 2 Activity: gait speed; short term.
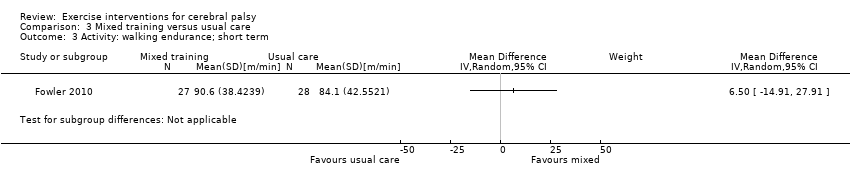
Comparison 3 Mixed training versus usual care, Outcome 3 Activity: walking endurance; short term.
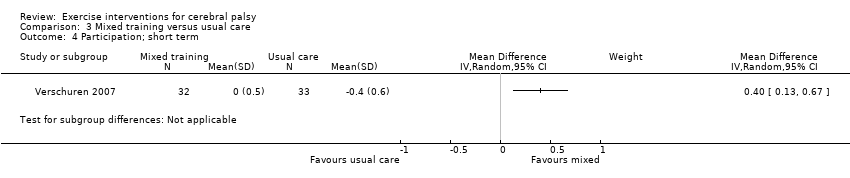
Comparison 3 Mixed training versus usual care, Outcome 4 Participation; short term.

Comparison 3 Mixed training versus usual care, Outcome 5 Participation; intermediate term.

Comparison 3 Mixed training versus usual care, Outcome 6 Aerobic fitness; short term.

Comparison 3 Mixed training versus usual care, Outcome 7 Muscle strength; short term.
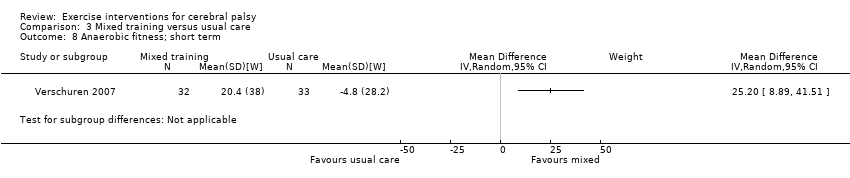
Comparison 3 Mixed training versus usual care, Outcome 8 Anaerobic fitness; short term.

Comparison 3 Mixed training versus usual care, Outcome 9 Aerobic fitness; intermediate term.

Comparison 3 Mixed training versus usual care, Outcome 10 Anaerobic fitness; intermediate term.

Comparison 3 Mixed training versus usual care, Outcome 11 Muscle strength; intermediate term.

Comparison 4 Resistance training versus aerobic exercise, Outcome 1 Activity: gross motor function; short term.

Comparison 4 Resistance training versus aerobic exercise, Outcome 2 Activity: gait speed; short term.

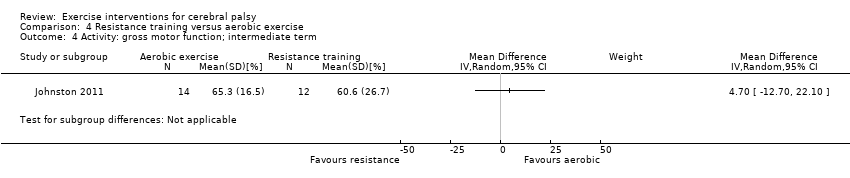
Comparison 4 Resistance training versus aerobic exercise, Outcome 3 Activity: gait speed; intermediate term.
Comparison 4 Resistance training versus aerobic exercise, Outcome 4 Activity: gross motor function; intermediate term.

Comparison 4 Resistance training versus aerobic exercise, Outcome 5 Muscle strength; short term.

Comparison 4 Resistance training versus aerobic exercise, Outcome 6 Muscle strength; intermediate term.

Comparison 5 Aerobic exercise and mixed training versus usual care, Outcome 1 Activity: gross motor function; short term.
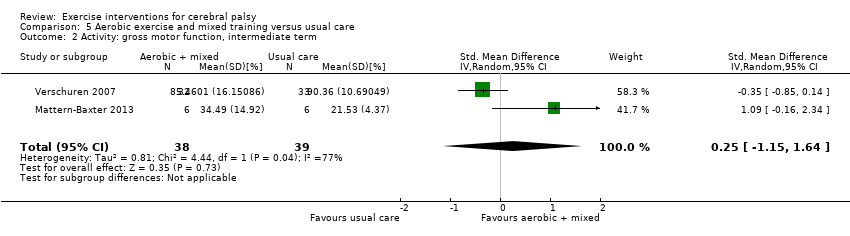
Comparison 5 Aerobic exercise and mixed training versus usual care, Outcome 2 Activity: gross motor function, intermediate term.
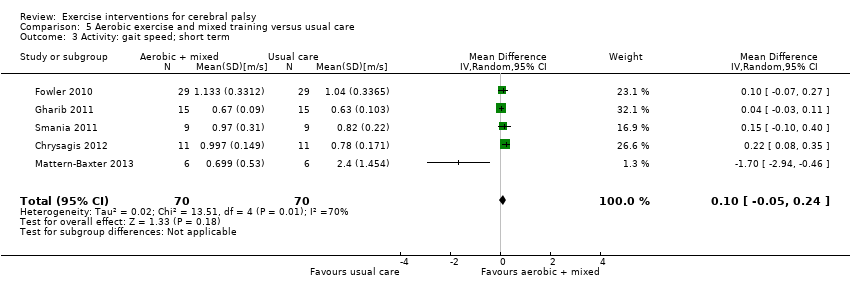
Comparison 5 Aerobic exercise and mixed training versus usual care, Outcome 3 Activity: gait speed; short term.

Comparison 5 Aerobic exercise and mixed training versus usual care, Outcome 4 Activity: walking endurance; short term.

Comparison 5 Aerobic exercise and mixed training versus usual care, Outcome 5 Aerobic fitness; short term.

Comparison 6 Resistance training and mixed training versus usual care, Outcome 1 Activity: gross motor function; short term.

Comparison 6 Resistance training and mixed training versus usual care, Outcome 2 Activity: gross motor function; intermediate term.
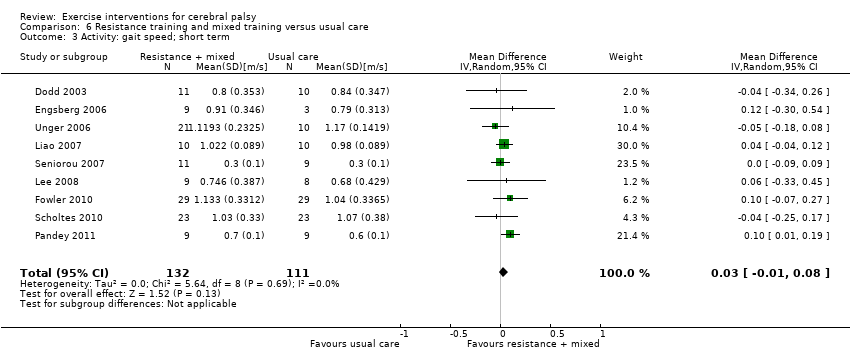
Comparison 6 Resistance training and mixed training versus usual care, Outcome 3 Activity: gait speed; short term.

Comparison 6 Resistance training and mixed training versus usual care, Outcome 4 Participation; short term.

Comparison 6 Resistance training and mixed training versus usual care, Outcome 5 Participation; intermediate term.
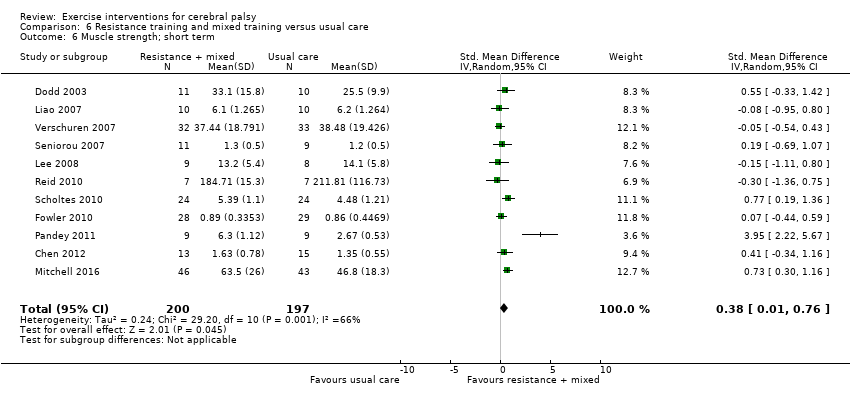
Comparison 6 Resistance training and mixed training versus usual care, Outcome 6 Muscle strength; short term.
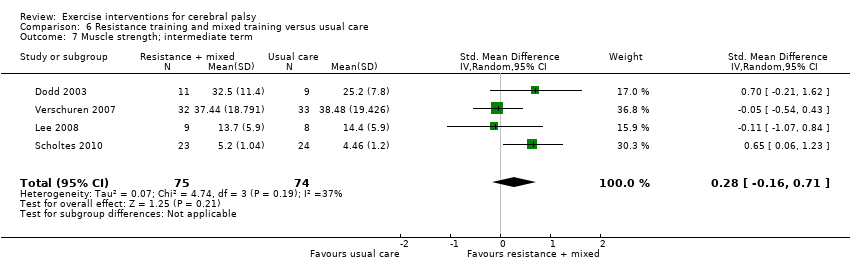
Comparison 6 Resistance training and mixed training versus usual care, Outcome 7 Muscle strength; intermediate term.
| Aerobic exercise versus usual care | ||||||
| Patient or population: children and adolescents with cerebral palsy Setting: mixed (community, outpatients, home) | ||||||
| Outcomes | Anticipated absolute effects* (95% CI) | Relative effect | Number of participants | Quality of the evidence | Comments | |
| Risk with usual care | Risk with aerobic exercise | |||||
| Activity Gross motor function assessed with the Gross Motor Function Measure (follow‐up 0 to 1 month) | The mean gross motor function ranged across control groups from 0.20% to 65.13% | The standardised mean gross motor function in the intervention group was 0.53 higher (0.02 higher to 1.04 higher) | — | 65 | ⊕⊕⊝⊝ | Higher score indicates improved activity A rule of thumb for interpreting SMD is that 0.2 represents a small effect, 0.5 a moderate effect, and 0.8 a large effect (Cohen 1988) |
| Activity Gait speed assessed with a timed walk test (follow‐up 0 to 1 month) | The mean gait speed ranged across control groups from 0.63 m/s to 2.40 m/s | The mean gait speed in the intervention groups was0.09 m/s faster (0.11 m/s slower to 0.28 m/s faster) | — | 82 | ⊕⊝⊝⊝ | Higher speed indicates improved activity |
| *The risk in the intervention group (and its 95% CI) is based on the assumed risk in the comparison group and the relative effect of the intervention (and its 95% CI). | ||||||
| GRADE Working Group grades of evidence | ||||||
| aAll studies are at high risk of bias because it is not possible to blind personnel or participants to group allocation. | ||||||
| Resistance training versus usual care | ||||||
| Patient or population: children and adolescents with cerebral palsy | ||||||
| Outcomes | Anticipated absolute effects* (95% CI) | Relative effect | Number of participants | Quality of the evidence | Comments | |
| Risk with usual care | Risk with resistance training | |||||
| Activity Gross motor function assessed with the Gross Motor Function Measure (follow‐up 0 to 1 month) | The mean gross motor function ranged across control groups from 60.80% to 81.30% | The standardised mean gross motor function in the intervention groups was 0.12 higher (0.19 lower to 0.43 higher) | — | 164 | ⊕⊕⊝⊝ | A rule of thumb for interpreting the SMD is that 0.2 represents a small effect, 0.5 a moderate effect, and 0.8 a large effect (Cohen 1988) Higher score indicates improved activity |
| Activity Gross motor function assessed with the Gross Motor Function Measure (follow‐up > 1 month to 6 months) | The mean gross motor function ranged across control groups from 61.80% to 74.30% | The standardised mean gross motor function in the intervention groups was 0.13 higher (‐0.30 lower to 0.55 higher) | — | 85 | ⊕⊕⊝⊝ | A rule of thumb for interpreting SMD is that 0.2 represents a small effect, 0.5 a moderate effect, and 0.8 a large effect (Cohen 1988) Higher score indicates improved activity |
| Activity Gait speed assessed with a timed walk test (follow‐up 0 to 1 month) | The mean gait speed ranged across control groups from0.30 m/s to 1.17 m/s | The mean gait speed in the intervention groups was 0.03 m/s faster (0.02 m/s slower to 0.07 m/s faster) | — | 185 | ⊕⊕⊝⊝ | Higher speed indicates improved activity |
| Activity Gait speed assessed with a timed walk test (follow‐up > 1 month to 6 months) | The mean gait speed ranged across control groups from 0.68 m/s to 1.06 m/s | The mean gait speed in the intervention groups was 0.03 m/s slower (0.17 m/s slower to 0.11 m/s faster) | — | 84 | ⊕⊕⊝⊝ | Higher speed indicates improved activity |
| Participation Assessed with various measures (follow‐up 0 to 1 month) | The mean participation in the control group ranged from 7.40 to 31.14 | The standardised mean participation in the intervention groups was 0.34 higher (0.01 lower to 0.70 higher) | — | 127 (2) | ⊕⊕⊝⊝ Lowa,b,c | A rule of thumb for interpreting SMD is that 0.2 represents a small effect, 0.5 a moderate effect, and 0.8 a large effect (Cohen 1988) Higher score indicates improved participation |
| *The risk in the intervention group (and its 95% CI) is based on the assumed risk in the comparison group and the relative effect of the intervention (and its 95% CI). | ||||||
| GRADE Working Group grades of evidence | ||||||
| aAll trials are at high risk of bias because it is not possible to blind personnel or participants to group allocation. | ||||||
| Mixed training versus usual care | ||||||
| Patient or population: children and adolescents with cerebral palsy | ||||||
| Outcomes | Anticipated absolute effects* (95% CI) | Relative effect | Number of participants | Quality of the evidence | Comments | |
| Risk with usual care | Risk with mixed training | |||||
| Activity Gross motor function assessed with the Gross Motor Function Measure (follow‐up 0 to 1 month) | The mean gross motor function in the control groups ranged from 30.76% to 90.11% | The standardised mean gross motor function in the intervention groups was 0.02 higher (0.29 lower to 0.33 higher) | — | 163 | ⊕⊕⊝⊝ | A rule of thumb for interpreting SMD is that 0.2 represents a small effect, 0.5 a moderate effect, and 0.8 a large effect (Cohen 1988) Higher score indicates improved activity |
| *The risk in the intervention group (and its 95% CI) is based on the assumed risk in the comparison group and the relative effect of the intervention (and its 95% CI). | ||||||
| GRADE Working Group grades of evidence | ||||||
| aAll trials are at high risk of bias because it is not possible to blind personnel or participants to group allocation. | ||||||
| Resistance training versus aerobic exercise | ||||||
| Patient or population: children with cerebral palsy | ||||||
| Outcomes | Anticipated absolute effects* (95% CI) | Relative effect | Number of participants | Quality of the evidence | Comments | |
| Risk with aerobic exercise | Risk with resistance training | |||||
| Activity Gross motor function assessed with various measures (follow‐up 0 to 1 month) | The mean gross motor function in the aerobic exercise groups ranged from 44.09% to 63.30% | The standardised mean gross motor function in the intervention groups was 0.02 higher (0.50 lower to 0.55 higher) | — | 56 | ⊕⊕⊝⊝ | Higher score indicates improved activity |
| *The risk in the intervention group (and its 95% CI) is based on the assumed risk in the comparison group and the relative effect of the intervention (and its 95% CI). | ||||||
| GRADE Working Group grades of evidence | ||||||
| aAll trials are at high risk of bias because it is not possible to blind participants or personnel to group allocation. | ||||||
| Binary data | We planned to present the relative risk (or risk ratio) with a 95% confidence interval, and calculate the number needed to treat for an additional beneficial outcome as an absolute measure of treatment effect. We will report the odds ratio (OR) with a 95% confidence interval in future updates of this review, as most studies with a dichotomous outcome report the OR. |
| Cluster trials | We planned to seek direct estimates of the effect from an analysis that accounted for cluster design. Where the analysis in a cluster trial did not account for the cluster design, we planned to use the approximately correct analysis approach, presented in the Cochrane Handbook for Systematic Reviews of Interventions (Higgins 2011c). |
| Crossover trials | Where studies presented repeated measurements over time, we planned to only include data from 1 time point from an individual study in any single meta‐analysis. If inadequate data were available to conduct this analysis, we planned to only include data from the first phase of the cross‐over trial, as if it were from a parallel trial design. We planned to combine the results of cross‐over studies with those of parallel studies by imputing the post‐treatment, between‐condition correlation coefficient from an included study that presents individual participant data, and use this to calculate the standard error of the SMD, using the generic inverse‐variance method. |
| Assessment of reporting biases | Where we identified evidence of publication bias, we planned to consider its likely influence on the observed effect sizes in our interpretation of the results. However, as common tests of publication bias lack sensitivity, we planned to consider the possible influence that a dominance of small trials might have on pooled effect sizes in our interpretation. |
| Subgroup analysis and identification of heterogeneity | We planned to further explore possible clinical heterogeneity through preplanned subgroup analysis based on important clinical features. We predicted that some trials would include ambulatory participants only (i.e. people who could walk with or without a mobility aid; GMFCS level I, II, and III), and some studies would include participants who could walk without a mobility aid only (i.e. GMFCS level I and II). Where adequate data allowed, we planned to undertake 2 subgroup analyses for studies that included ambulatory people only (i.e. GMFCS level I, II, and III), and for studies that included ambulatory people who walk without a mobility aid only (i.e. GMFCS level I and II). |
| Sensitivity analysis | We planned to explore the impact of studies at high risk of bias by reanalysis after excluding studies rated at overall high risk of bias. We also planned to explore the impact of excluding studies at high risk of bias for missing data through reanalysis. We planned to explore the influence of using imputed correlation coefficients in our approach to including cross‐over and cluster trials by reanalysing these data with adjusted (higher and lower) coefficient values. |
| GMFCS: Gross Motor Function Classification System; SMD: standardised mean difference. | |
| Outcome or subgroup title | No. of studies | No. of participants | Statistical method | Effect size |
| 1 Activity: gross motor function, short term Show forest plot | 3 | 65 | Std. Mean Difference (IV, Random, 95% CI) | 0.53 [0.02, 1.04] |
| 2 Activity: gait speed, short term Show forest plot | 4 | 82 | Mean Difference (IV, Random, 95% CI) | 0.09 [‐0.11, 0.28] |
| 3 Activity: walking endurance; short term Show forest plot | 1 | Mean Difference (IV, Random, 95% CI) | Subtotals only | |
| 4 Activity: gait speed, intermediate term Show forest plot | 1 | Mean Difference (IV, Random, 95% CI) | Subtotals only | |
| 5 Activity: gross motor function, intermediate term Show forest plot | 1 | Mean Difference (IV, Random, 95% CI) | Subtotals only | |
| 6 Activity: daily physical activity; short term Show forest plot | 1 | Mean Difference (IV, Random, 95% CI) | Subtotals only | |
| 7 Aerobic fitness; short term Show forest plot | 1 | Mean Difference (IV, Random, 95% CI) | Subtotals only | |
| Outcome or subgroup title | No. of studies | No. of participants | Statistical method | Effect size |
| 1 Activity: gross motor function, children and adolescents; short term Show forest plot | 7 | 164 | Std. Mean Difference (IV, Random, 95% CI) | 0.12 [‐0.19, 0.43] |
| 2 Activity: gross motor function, children and adolescents; intermediate term Show forest plot | 3 | 85 | Std. Mean Difference (IV, Random, 95% CI) | 0.13 [‐0.30, 0.55] |
| 3 Activity: gait speed, children and adolescents; short term Show forest plot | 8 | 185 | Mean Difference (IV, Random, 95% CI) | 0.03 [‐0.02, 0.07] |
| 4 Activity: gait speed, children and adolescents; intermediate term Show forest plot | 3 | 84 | Mean Difference (IV, Random, 95% CI) | ‐0.03 [‐0.17, 0.11] |
| 5 Activity: gait speed, adults; short term Show forest plot | 1 | Mean Difference (IV, Random, 95% CI) | Subtotals only | |
| 6 Activity: gross motor function, adults; short term Show forest plot | 1 | Mean Difference (IV, Random, 95% CI) | Subtotals only | |
| 7 Activity: walking endurance, adults; short term Show forest plot | 1 | Mean Difference (IV, Random, 95% CI) | Subtotals only | |
| 8 Participation, children and adolescents; short term Show forest plot | 2 | 127 | Std. Mean Difference (IV, Random, 95% CI) | 0.34 [‐0.01, 0.70] |
| 9 Participation, children and adolescents; intermediate term Show forest plot | 1 | Mean Difference (IV, Random, 95% CI) | Subtotals only | |
| 10 Quality of life (parent‐reported), children and adolescents; short term Show forest plot | 1 | Mean Difference (IV, Random, 95% CI) | Subtotals only | |
| 11 Quality of life (child‐reported), children and adolescents; short term Show forest plot | 1 | Mean Difference (IV, Random, 95% CI) | Subtotals only | |
| 12 Muscle strength, children and adolescents; short term Show forest plot | 8 | 247 | Std. Mean Difference (IV, Random, 95% CI) | 0.53 [0.00, 1.06] |
| 13 Muscle strength, children and adolescents; intermediate term Show forest plot | 3 | 84 | Std. Mean Difference (IV, Random, 95% CI) | 0.50 [0.06, 0.94] |
| 14 Muscle strength, adults; short term Show forest plot | 1 | Mean Difference (IV, Random, 95% CI) | Subtotals only | |
| Outcome or subgroup title | No. of studies | No. of participants | Statistical method | Effect size |
| 1 Activity: gross motor function; short term Show forest plot | 4 | 163 | Std. Mean Difference (IV, Random, 95% CI) | 0.02 [‐0.29, 0.33] |
| 2 Activity: gait speed; short term Show forest plot | 1 | Mean Difference (IV, Random, 95% CI) | Subtotals only | |
| 3 Activity: walking endurance; short term Show forest plot | 1 | Mean Difference (IV, Random, 95% CI) | Subtotals only | |
| 4 Participation; short term Show forest plot | 1 | Mean Difference (IV, Random, 95% CI) | Subtotals only | |
| 5 Participation; intermediate term Show forest plot | 1 | Mean Difference (IV, Random, 95% CI) | Subtotals only | |
| 6 Aerobic fitness; short term Show forest plot | 2 | 78 | Std. Mean Difference (IV, Random, 95% CI) | 0.05 [‐0.39, 0.50] |
| 7 Muscle strength; short term Show forest plot | 3 | 150 | Std. Mean Difference (IV, Random, 95% CI) | 0.08 [‐0.24, 0.40] |
| 8 Anaerobic fitness; short term Show forest plot | 1 | Mean Difference (IV, Random, 95% CI) | Subtotals only | |
| 9 Aerobic fitness; intermediate term Show forest plot | 1 | Mean Difference (IV, Random, 95% CI) | Subtotals only | |
| 10 Anaerobic fitness; intermediate term Show forest plot | 1 | Mean Difference (IV, Random, 95% CI) | Subtotals only | |
| 11 Muscle strength; intermediate term Show forest plot | 1 | Mean Difference (IV, Random, 95% CI) | Subtotals only | |
| Outcome or subgroup title | No. of studies | No. of participants | Statistical method | Effect size |
| 1 Activity: gross motor function; short term Show forest plot | 2 | 56 | Std. Mean Difference (IV, Random, 95% CI) | 0.02 [‐0.50, 0.55] |
| 2 Activity: gait speed; short term Show forest plot | 1 | Mean Difference (IV, Random, 95% CI) | Subtotals only | |
| 3 Activity: gait speed; intermediate term Show forest plot | 1 | Mean Difference (IV, Random, 95% CI) | Subtotals only | |
| 4 Activity: gross motor function; intermediate term Show forest plot | 1 | Mean Difference (IV, Random, 95% CI) | Subtotals only | |
| 5 Muscle strength; short term Show forest plot | 2 | 56 | Std. Mean Difference (IV, Random, 95% CI) | ‐0.11 [‐0.64, 0.41] |
| 6 Muscle strength; intermediate term Show forest plot | 1 | Mean Difference (IV, Random, 95% CI) | Subtotals only | |
| Outcome or subgroup title | No. of studies | No. of participants | Statistical method | Effect size |
| 1 Activity: gross motor function; short term Show forest plot | 7 | 228 | Std. Mean Difference (IV, Random, 95% CI) | 0.36 [0.09, 0.62] |
| 2 Activity: gross motor function, intermediate term Show forest plot | 2 | 77 | Std. Mean Difference (IV, Random, 95% CI) | 0.25 [‐1.15, 1.64] |
| 3 Activity: gait speed; short term Show forest plot | 5 | 140 | Mean Difference (IV, Random, 95% CI) | 0.10 [‐0.05, 0.24] |
| 4 Activity: walking endurance; short term Show forest plot | 2 | 73 | Mean Difference (IV, Random, 95% CI) | 8.43 [‐12.38, 29.23] |
| 5 Aerobic fitness; short term Show forest plot | 3 | 98 | Std. Mean Difference (IV, Random, 95% CI) | 0.06 [‐0.34, 0.45] |
| Outcome or subgroup title | No. of studies | No. of participants | Statistical method | Effect size |
| 1 Activity: gross motor function; short term Show forest plot | 11 | 327 | Std. Mean Difference (IV, Random, 95% CI) | 0.21 [‐0.01, 0.43] |
| 2 Activity: gross motor function; intermediate term Show forest plot | 4 | 150 | Std. Mean Difference (IV, Random, 95% CI) | ‐0.08 [‐0.41, 0.24] |
| 3 Activity: gait speed; short term Show forest plot | 9 | 243 | Mean Difference (IV, Random, 95% CI) | 0.03 [‐0.01, 0.08] |
| 4 Participation; short term Show forest plot | 3 | 192 | Std. Mean Difference (IV, Random, 95% CI) | 0.35 [0.07, 0.64] |
| 5 Participation; intermediate term Show forest plot | 2 | 101 | Mean Difference (IV, Random, 95% CI) | 0.15 [‐0.24, 0.54] |
| 6 Muscle strength; short term Show forest plot | 11 | 397 | Std. Mean Difference (IV, Random, 95% CI) | 0.38 [0.01, 0.76] |
| 7 Muscle strength; intermediate term Show forest plot | 4 | 149 | Std. Mean Difference (IV, Random, 95% CI) | 0.28 [‐0.16, 0.71] |