Person‐directed, non‐pharmacological interventions for sleepiness at work and sleep disturbances caused by shift work
Abstract
Background
Shift work is often associated with sleepiness and sleep disorders. Person‐directed, non‐pharmacological interventions may positively influence the impact of shift work on sleep, thereby improving workers’ well‐being, safety, and health.
Objectives
To assess the effects of person‐directed, non‐pharmacological interventions for reducing sleepiness at work and improving the length and quality of sleep between shifts for shift workers.
Search methods
We searched CENTRAL, MEDLINE Ovid, Embase, Web of Knowledge, ProQuest, PsycINFO, OpenGrey, and OSH‐UPDATE from inception to August 2015. We also screened reference lists and conference proceedings and searched the World Health Organization (WHO) Trial register. We contacted experts to obtain unpublished data.
Selection criteria
Randomised controlled trials (RCTs) (including cross‐over designs) that investigated the effect of any person‐directed, non‐pharmacological intervention on sleepiness on‐shift or sleep length and sleep quality off‐shift in shift workers who also work nights.
Data collection and analysis
At least two authors screened titles and abstracts for relevant studies, extracted data, and assessed risk of bias. We contacted authors to obtain missing information. We conducted meta‐analyses when pooling of studies was possible.
Main results
We included 17 relevant trials (with 556 review‐relevant participants) which we categorised into three types of interventions: (1) various exposures to bright light (n = 10); (2) various opportunities for napping (n = 4); and (3) other interventions, such as physical exercise or sleep education (n = 3). In most instances, the studies were too heterogeneous to pool. Most of the comparisons yielded low to very low quality evidence. Only one comparison provided moderate quality evidence. Overall, the included studies’ results were inconclusive. We present the results regarding sleepiness below.
Bright light
Combining two comparable studies (with 184 participants altogether) that investigated the effect of bright light during the night on sleepiness during a shift, revealed a mean reduction 0.83 score points of sleepiness (measured via the Stanford Sleepiness Scale (SSS) (95% confidence interval (CI) ‐1.3 to ‐0.36, very low quality evidence). Another trial did not find a significant difference in overall sleepiness on another sleepiness scale (16 participants, low quality evidence).
Bright light during the night plus sunglasses at dawn did not significantly influence sleepiness compared to normal light (1 study, 17 participants, assessment via reaction time, very low quality evidence).
Bright light during the day shift did not significantly reduce sleepiness during the day compared to normal light (1 trial, 61 participants, subjective assessment, low quality evidence) or compared to normal light plus placebo capsule (1 trial, 12 participants, assessment via reaction time, very low quality evidence).
Napping during the night shift
A meta‐analysis on a single nap opportunity and the effect on the mean reaction time as a surrogate for sleepiness, resulted in a 11.87 ms reduction (95% CI 31.94 to ‐8.2, very low quality evidence). Two other studies also reported statistically non‐significant decreases in reaction time (1 study seven participants; 1 study 49 participants, very low quality evidence).
A two‐nap opportunity resulted in a statistically non‐significant increase of sleepiness (subjective assessment) in one study (mean difference (MD) 2.32, 95% CI ‐24.74 to 29.38, 1 study, 15 participants, low quality evidence).
Other interventions
Physical exercise and sleep education interventions showed promise, but sufficient data to draw conclusions are lacking.
Authors' conclusions
Given the methodological diversity of the included studies, in terms of interventions, settings, and assessment tools, their limited reporting and the very low to low quality of the evidence they present, it is not possible to determine whether shift workers' sleepiness can be reduced or if their sleep length or quality can be improved with these interventions.
We need better and adequately powered RCTs of the effect of bright light, and naps, either on their own or together and other non‐pharmacological interventions that also consider shift workers’ chronobiology on the investigated sleep parameters.
PICOs
Plain language summary
Non‐drug interventions for sleepiness and sleep problems for shift workers who work nights
Summary text
People who work shifts, especially night shifts, often describe being sleepy at work or having sleep problems after work. This can be bad for their well‐being, safety, and health. On the basis of a systematic literature search, we evaluated whether person‐directed, non‐drug interventions can make shift workers less sleepy during their shift, and help them sleep longer and better after their shift is over.
Studies found
We found 17 randomised controlled trials (with 556 participants) to include in this review. We rated the quality of evidence provided by most of the included studies to be between low and very low. The studies could be divided into three different types of interventions: (1) exposure to bright light; (2) a napping opportunity during the night shift; or (3) others, like physical activity or sleep education.
Key results
Bright light
Almost all of the bright light studies we looked at had some problem with the way they were designed. This problem made it difficult to know if any differences in sleepiness and sleep between those receiving bright light and those not receiving bright light were truly because of the bright light intervention. The studies were also too different in the types of bright light they used and types of light that the control groups received to compare them to one another.
Napping
The studies in the napping group did not report enough information for us to be certain whether napping helps shift workers feel more awake. The studies were very short, with each study lasting only a single night.
Others
This group of studies, which included, for example, physical exercise and sleep education, also reported too little information for us to say whether these interventions can make shift workers less sleepy on‐shift or help them sleep longer and better after their shift.
Conclusion
We conclude that there is too much uncertainty to determine whether any person‐directed, non‐drug interventions can really affect shift workers with sleepiness and sleep problems. We need studies that are better designed, report their designs and results more clearly, include more participants and last for a longer time before we can be certain. Studies also need to find out if their participants are 'morning‐types' or 'evening‐types', to be sure that the right type of shift worker gets the right type of intervention.
How up‐to‐date is this review?
We searched for studies that had been published up to August 2015.
Authors' conclusions
Summary of findings
| Bright light at night versus normal light (300 lux) | ||||||
| Patient or population: Shift workers | ||||||
| Outcomes | Anticipated absolute effects* (95% CI) | Relative effect | № of participants | Quality of the evidence | Comments | |
| Risk with normal light (300 lux) | Risk with bright light ** | |||||
| Sleepiness during the night shift overall; | The mean sleepiness during the night shift overall in the control group was 3.10 score points | The mean sleepiness during the night shift overall in the intervention group was 0.83 lower (1.31 to 0.36 lower) | ‐ | 184 | ⊕⊝⊝⊝ | Lower sleepiness score indicates less sleepiness. Sleepiness score was averaged over the entire night. Although one study actually went on for two nights (Karchani 2011), we included only the measurements from the first night here, so that it was more comparable to the other study (Sadeghniiat‐Haghighi 2011) |
| Sleepiness during the night shift overall; | The mean sleepiness during the night shift overall in the control group was 4.33 score points | The mean sleepiness during the night shift overall in the intervention group was 0.26 lower (0.81 lower to 0.29 higher) | ‐ | 16 | ⊕⊕⊝⊝ | Lower sleepiness score indicates less sleepiness. Sleepiness score was averaged over the entire night |
| Sleepiness during the night shift; postintervention measurement | The mean sleepiness during the night shift; postintervention measurement in the control group was 4.51 score points | The mean sleepiness during the night shift; postintervention measurement in the intervention group was 2.21 lower (2.43 to 1.99 lower) | ‐ | 90 | ⊕⊕⊝⊝ | Lower sleepiness score indicates less sleepiness |
| Sleepiness during the night shift; postintervention measurement | The mean sleepiness during the night shift; postintervention measurement in the control group was 5.25 score points | The mean sleepiness during the night shift; postintervention measurement in the intervention group was 0.25 lower (0.76 lower to 0.26 higher) | ‐ | 16 | ⊕⊕⊝⊝ | Lower sleepiness score indicates less sleepiness |
| Total sleep time, next day ‐ main sleep time only; actigraph | The mean total sleep time, next day ‐ main sleep period only in the control group was 6.53 hours | The mean total sleep time, next day ‐ main sleep time only in the intervention group was 0.25 hours longer (0.36 shorter to 0.86 longer) | ‐ | 15 | ⊕⊕⊝⊝ | Longer sleep time indicates more hours slept during the main sleep period |
| Total sleep time, next day ‐ 24‐hr sleep time, including naps; assessed with actigraph | The mean total sleep time, next day ‐ 24‐hour sleep period (including naps) in the control group was 5.92 hours | The mean total sleep time, next day ‐ 24‐hour sleep period (including naps) in the intervention group was 0.63 hours longer (0.43 shorter to 1.69 longer) | ‐ | 15 | ⊕⊕⊝⊝ | Longer sleep time indicates more hours slept over 24‐hours, including both the main sleep period and naps |
| Sleep efficiency, next day; assessed with actigraph3 | The mean sleep efficiency, next day, in the control group was 89.5% | The mean sleep efficiency, next day, in the intervention group was 0.9% higher (0.49 lower to 2.29 higher) | ‐ | 15 | ⊕⊕⊝⊝ | Higher sleep efficiency indicates that a greater part of the time spent lying in bed was actually spent sleeping |
| *The risk in the intervention group (and its 95% confidence interval) is based on the assumed risk in the comparison group and the relative effect of the intervention (and its 95% CI); ** In the case of cross‐over trials, the 95% CI reported here is based on an assumed correlation coefficient of 0. | ||||||
| GRADE Working Group grades of evidence | ||||||
| 1SSS: Stanford Sleepiness Scale, a 7‐point scale with verbal anchors ranging from 1: 'feeling active, vital, alert, or wide awake' to 7: 'no longer fighting sleep, sleep onset soon, having dream‐like thoughts'. | ||||||
| Bright light alone at night versus normal light (300 lux) plus placebo capsule | ||||||
| Patient or population: Shift workers | ||||||
| Outcomes | Anticipated absolute effects* (95% CI) | Relative effect | № of participants | Quality of the evidence | Comments | |
| Risk with normal light (300 lux) plus placebo capsule | Risk with bright light** | |||||
| Sleepiness during the night shift; assessed with 5‐min Reaction Time Test | The mean reaction time during the night shift in the control group was 325.19 ms | The mean reaction time during the night shift in the intervention group was 14.61 ms faster (68.10 faster to 38.88 slower) | ‐ | 14 | ⊕⊝⊝⊝ | Faster reaction time suggests less sleepiness |
| Total sleep time, next day; | The mean total sleep time, next day, in the control group was 6.72 hours | The mean total sleep time, next day, in the intervention group was 0.26 hours longer (0.47 shorter to 0.99 longer) | ‐ | 15 | ⊕⊝⊝⊝ | Longer sleep time indicates more hours slept during the main sleep period |
| Sleep onset latency, next day; | The mean sleep onset latency, next day, in the control group was 6 minutes | The mean sleep onset latency, next day, in the intervention group was 0 minutes (neither shorter nor longer) (5.08 shorter to 5.08 longer) | ‐ | 15 | ⊕⊝⊝⊝ | Shorter sleep onset latency indicates fewer minutes needed to fall asleep when lying in bed |
| Sleep efficiency, next day; | The mean sleep efficiency, next day, in the control group was 86% | The mean sleep efficiency, next day, in the intervention group was 2% higher (4.10 lower to 8.10 higher) | ‐ | 15 | ⊕⊝⊝⊝ | Higher sleep efficiency indicates that a greater part of the time spent lying in bed was actually spent sleeping |
| *The risk in the intervention group (and its 95% confidence interval) is based on the assumed risk in the comparison group and the relative effect of the intervention (and its 95% CI); ** In the case of cross‐over trials, the 95% CI reported here is based on an assumed correlation coefficient of 0. | ||||||
| GRADE Working Group grades of evidence | ||||||
| 1Sleep efficiency = total sleep time as the percentage of time in bed. | ||||||
| Bright light during day versus normal light (530 to 648 lux) | ||||||
| Patient or population: Shift workers | ||||||
| Outcomes | Anticipated absolute effects* (95% CI) | Relative effect | № of participants | Quality of the evidence | Comments | |
| Risk with normal light (530 to 648 lux) | Risk with bright light | |||||
| Sleepiness during the day shift assessed with KSS1 14:00 | The mean sleepiness during the day shift in the control group was 4.28 score points | The mean sleepiness during the day shift in the intervention group was 0.35 lower (0.72 lower to 0.02 higher) | ‐ | 61 | ⊕⊕⊝⊝ | Lower sleepiness score indicates less sleepiness |
| Sleep quality, next night; assessed with VAS2 | The mean sleep quality, next night, in the control group was 5.94 score points | The mean sleep quality, next night, in the intervention group was 0.37 higher (0.04 to 0.7 higher) | ‐ | 61 | ⊕⊕⊝⊝ | Higher sleep quality indicates a better main sleep period |
| *The risk in the intervention group (and its 95% confidence interval) is based on the assumed risk in the comparison group and the relative effect of the intervention (and its 95% CI). | ||||||
| GRADE Working Group grades of evidence | ||||||
| 1KSS: Karolinska Sleepiness Scale, a 9‐point scale with verbal anchors ranging from 1: 'extremely alert' to 9: 'very sleepy, great effort to keep awake, fighting sleep'. | ||||||
| Bright light during day versus dim red light | ||||||
| Patient or population: Shift workers | ||||||
| Outcomes | Anticipated absolute effects* (95% CI) | Relative effect | № of participants | Quality of the evidence | Comments | |
| Risk with dim red light | Risk with bright light | |||||
| Total sleep time, next night; | The mean total sleep time, next night, in the control group was 7 hours | The mean total sleep time, next night, in the intervention group was 0.1 hours longer (1.09 shorter to 1.29 longer) | ‐ | 16 | ⊕⊕⊝⊝ | Longer sleep time indicates more hours slept during the main sleep period |
| Sleep onset latency, next night assessed with sleep log | The mean sleep onset latency, next night, in the control group was 16.6 minutes | The mean sleep onset latency, next night, in the intervention group was 2.6 minutes shorter (10.72 shorter to 5.52 longer) | ‐ | 16 | ⊕⊕⊝⊝ | Shorter sleep onset latency indicates fewer minutes needed to fall asleep when lying in bed |
| *The risk in the intervention group (and its 95% confidence interval) is based on the assumed risk in the comparison group and the relative effect of the intervention (and its 95% CI); | ||||||
| GRADE Working Group grades of evidence | ||||||
| 1Downgraded one level due to risk of bias and one level due to imprecision (wide confidence intervals). | ||||||
| Bright light alone during day versus normal light (300 lux) plus placebo capsule | ||||||
| Patient or population: Shift workers | ||||||
| Outcomes | Anticipated absolute effects* (95% CI) | Relative effect | № of participants | Quality of the evidence | Comments | |
| Risk with normal light (300 lux) plus placebo capsule | Risk with bright light** | |||||
| Sleepiness during the day shift; days assessed with 5‐min Reaction Time Test | The mean reaction time, during the day‐shift days, in the control group was 296.16 ms | The mean reaction time, during the day‐shift days, in the intervention group was 14.05 ms slower (17.37 faster to 45.47 slower) | ‐ | 12 | ⊕⊝⊝⊝ | Slower reaction time suggests more sleepiness |
| Total sleep time, next night; | The mean total sleep time, next night, in the control group was 5.8 hours | The mean total sleep time next night, in the intervention group was 0.32 hours longer (0.35 shorter to 0.99 longer) | ‐ | 13 | ⊕⊝⊝⊝ | Longer sleep time indicates more hours slept during the main sleep period |
| Sleep onset latency, next night; | The mean sleep onset latency, next night, in the control group was 6 minutes | The mean sleep onset latency, next night, in the intervention group was 1 minute longer (4.47 shorter to 6.47 longer) | ‐ | 13 | ⊕⊝⊝⊝ | Longer sleep onset latency indicates more minutes needed to fall asleep when lying in bed |
| Sleep efficiency, next night; | The mean sleep efficiency, next night, in the control group was 85% | The mean sleep efficiency, next night, in the intervention group was 2% higher (5.19 lower to 9.19 higher) | ‐ | 13 | ⊕⊝⊝⊝ | Higher sleep efficiency indicates that a greater part of the time spent lying in bed was actually spent sleeping |
| *The risk in the intervention group (and its 95% confidence interval) is based on the assumed risk in the comparison group and the relative effect of the intervention (and its 95% CI); ** In the case of cross‐over trials, the 95% confidence interval reported here is based on an assumed correlation coefficient of 0. | ||||||
| GRADE Working Group grades of evidence | ||||||
| 1Sleep efficiency = total sleep time as the percentage of time in bed. | ||||||
| Bright light at night plus glasses versus normal light (unclear lux) and no glasses | ||||||
| Patient or population: Shift workers | ||||||
| Outcomes | Anticipated absolute effects* (95% CI) | Relative effect | № of participants | Quality of the evidence | Comments | |
| Risk with normal light (unclear lux) and no glasses | Risk with bright light at night plus glasses | |||||
| Sleepiness during the night shift assessed with Psychomotor Vigilance Task and Median Reaction Time tests | The median reaction time during the night shift in the control group was 68.29 ms | The median reaction time during the night shift in the intervention group was 0.11 ms slower (20.83 faster to 21.05 slower) | ‐ | 17 | ⊕⊝⊝⊝ | Slower reaction time suggests more sleepiness |
| *The risk in the intervention group (and its 95% confidence interval) is based on the assumed risk in the comparison group and the relative effect of the intervention (and its 95% CI). | ||||||
| GRADE Working Group grades of evidence | ||||||
| 1Downgraded one level due to risk of bias, one level due to imprecision (wide confidence intervals, single trial only), and one level due to indirectness (indirect measurement of sleepiness). | ||||||
| Bright light plus glasses during day versus normal light and no glasses | ||||||
| Patient or population: Shift workers | ||||||
| Outcomes | Anticipated absolute effects* (95% CI) | Relative effect | № of participants | Quality of the evidence | Comments | |
| Risk with normal light and no glasses | Risk with bright light plus glasses** | |||||
| Total sleep time, next night; | The mean total sleep time, next night, in the control group was 6.25 hours | The mean total sleep time, next night, in the intervention group was 0.32 hours longer (0.39 shorter to 1.03 longer) | ‐ | 3 | ⊕⊕⊝⊝ | Longer sleep time indicates more hours slept during the main sleep period |
| Sleep onset latency, next night; | The mean sleep onset latency, next night, in the control group was 18 minutes | The mean sleep onset latency, next night, in the intervention group was 2.4 minutes longer (13.08 shorter to 17.88 longer) | ‐ | 3 | ⊕⊕⊝⊝ | Longer sleep onset latency indicates more minutes needed to fall asleep when lying in bed |
| Sleep efficiency, next night; | The mean sleep efficiency, next night, in the control group was 76.18% | The mean sleep efficiency, next night, in the intervention group was 6.59% higher (4.35 lower to 17.53 higher) | ‐ | 3 | ⊕⊕⊝⊝ | Higher sleep efficiency indicates that a greater part of the time spent lying in bed was actually spent sleeping |
| *The risk in the intervention group (and its 95% confidence interval) is based on the assumed risk in the comparison group and the relative effect of the intervention (and its 95% CI); ** In the case of cross‐over trials, the 95% confidence interval reported here is based on an assumed correlation coefficient of 0. | ||||||
| GRADE Working Group grades of evidence | ||||||
| 1Sleep efficiency = total sleep time as the percentage of time in bed. | ||||||
| Nap at night (single nap opportunity) versus no‐nap | ||||||
| Patient or population: Shift workers | ||||||
| Outcomes | Anticipated absolute effects* (95% CI) | Relative effect | № of participants | Quality of the evidence | Comments | |
| Risk with no‐nap | Risk with nap (single nap opportunity)** | |||||
| Sleepiness during the night shift, postintervention; | The mean reaction time during the night shift, postintervention, in the control group was 180.50 ms | The mean reaction time during the night shift, postintervention, in the intervention group was 11.87 ms faster (31.94 faster to 8.20 slower) | ‐ | 16 | ⊕⊝⊝⊝ | Faster reaction time suggests less sleepiness |
| Sleepiness during the night shift, postintervention; | The mean sleepiness during the night shift, postintervention, in the control group was 6.63 score points | The mean sleepiness during the night shift, postintervention in the intervention group was 0.13 higher (0.46 lower to 0.72 higher) | ‐ | 8 | ⊕⊕⊝⊝ | Higher sleepiness score indicates more sleepiness; study design: cross‐over |
| Sleepiness during the night shift, postintervention; | The mean sleepiness during the night shift, postintervention, in the control group was 6.48 score points | The mean sleepiness during the night shift, postintervention, in the intervention group was 1.12 lower (1.83 to 0.41 lower) | ‐ | 49 | ⊕⊕⊝⊝ | Higher sleepiness score indicates more sleepiness; study design: parallel |
| Sleepiness during the night shift, postintervention; | The mean slowest 10% reciprocal reaction time during the night shift, postintervention, in the control group was 2.46 ms | The mean slowest 10% reciprocal reaction time during the night shift, postintervention, in the intervention group was 0.19 ms faster (0.67 slower to 1.05 faster) | ‐ | 7 | ⊕⊝⊝⊝ | Faster reaction time suggests less sleepiness |
| Sleepiness during the night shift, postintervention; assessed with Psychomotor Vigilance Task Test (slowest 10% reciprocal reaction time) | The mean slowest 10% reciprocal reaction time during the night shift, postintervention, in the control group was 2.13 ms | The mean slowest 10% reciprocal reaction time during the night shift, postintervention, in the intervention group was 0.32 ms faster (0.21 slower to 0.85 faster) | ‐ | 49 | ⊕⊝⊝⊝ | Faster reaction time suggests less sleepiness |
| Sleepiness during the night shift, postintervention; subjective sleepiness score2 | The mean sleepiness during the night shift, postintervention, in the control group was 52.02 score points | The mean sleepiness during the night shift, postintervention, in the intervention group was 16.14 lower (31.37 to 0.91 lower) | ‐ | 9 | ⊕⊝⊝⊝ | Lower sleepiness score indicates less sleepiness |
| *The risk in the intervention group (and its 95% confidence interval) is based on the assumed risk in the comparison group and the relative effect of the intervention (and its 95% CI); ** In the case of cross‐over trials, the 95% confidence interval reported here is based on an assumed correlation coefficient of 0. | ||||||
| GRADE Working Group grades of evidence | ||||||
| 1 KSS: Karolinska Sleepiness Scale, a 9‐point scale with verbal anchors ranging from 1: 'extremely alert' to 9: 'very sleepy, great effort to keep awake, fighting sleep'. | ||||||
| Nap at night (two nap opportunities) versus no‐nap | ||||||
| Patient or population: Shift workers | ||||||
| Outcomes | Anticipated absolute effects* (95% CI) | Relative effect | № of participants | Quality of the evidence | Comments | |
| Risk with no‐nap | Risk with Nap (two‐nap opportunities) | |||||
| Sleepiness during the night shift, postintervention; | The mean sleepiness during the night shift postintervention, in the control group was 40.21 score points | The mean sleepiness during the night shift, postintervention, in the intervention group was 2.32 higher (24.74 lower to 29.38 higher) | ‐ | 15 | ⊕⊕⊝⊝ | Higher sleepiness score indicates more sleepiness |
| *The risk in the intervention group (and its 95% confidence interval) is based on the assumed risk in the comparison group and the relative effect of the intervention (and its 95% CI). | ||||||
| GRADE Working Group grades of evidence | ||||||
| 1VAS: visual analogue scale, 100 millimetre scale ranging from 0 mm: not at all sleepy/tired to 100 mm: extremely sleepy/tired. | ||||||
| Physical exercise and sleep hygiene education versus wait‐list for sleepiness and sleep disturbances caused by shift work | ||||||
| Patient or population: Shift workers Settings: Individual workplace Intervention: Physical exercise and sleep hygiene education Comparison: Wait‐list | ||||||
| Outcomes | Anticipated absolute effects* (95% CI) | Relative effect | No of Participants | Quality of the evidence | Comments | |
| Risk with wait‐list | Risk with physical exercise and sleep hygiene education | |||||
| Sleep quality, postintervention, assessed with PSQI1 | The mean sleep quality, postintervention, over previous one‐month period in the control group was 5.6 score points | The mean sleep quality, postintervention, over previous one‐month period in the intervention group was 1.4 lower (3.10 lower to 0.30 higher) | 32 | ⊕⊕⊕⊝ | Higher sleep quality indicates a better main sleep period | |
| *The risk in the intervention group (and its 95% confidence interval) is based on the assumed risk in the comparison group and the relative effect of the intervention (and its 95% CI). | ||||||
| GRADE Working Group grades of evidence | ||||||
| 1PSQI: Pittsburgh Sleep Quality Index, 0 to 21 point index, lower score = higher sleep quality. | ||||||
Background
Description of the condition
Shift work is common. According to the World Health Organization (WHO), 15% to 20% of employees in Europe and the USA work in some type of shift system (IARC 2010). The International Labour Organization defines working in shifts as “a method of organization of working time in which workers succeed one another at the workplace so that the establishment can operate longer than the hours of work of individual workers” (ILO 1990). There are several different definitions of night work. The ILO defines night work as “all work which is performed during a period of not less than seven consecutive hours, including the interval from midnight to 5 a.m.” (ILO 1990).
Shift work in general, and night‐shift work in particular, is known to have negative effects on personal health and well‐being. Established complaints among shift workers include difficulties in getting enough sleep and in maintaining an acceptable level of alertness while working irregular hours, both of which may lead to an increased risk of errors and accidents (Akerstedt 2011; Landrigan 2004). In the short‐term, shift workers may suffer from sleep‐related complaints, like sleepiness during or after their shift and sleep disturbances. Shift work also appears to be associated with a variety of long‐term effects on individual health, including coronary heart disease (Puttonen 2010), diabetes and metabolic syndrome (Wang 2011), gastrointestinal disorders (Knutsson 2010), and also workplace injuries (Wong 2011). Shift work that involves circadian disruption is classified as probably carcinogenic to humans (International Agency for Research on Cancer (IARC) classification 2a) (IARC 2010; Straif 2007).
Description of the intervention
A number of work‐ and worker‐directed strategies have been explored to help the individual adapt to night‐shift work. These include: (1) person‐directed, non‐pharmacological interventions (the focus of the present review), such as the use of bright light, the use of dark goggles, scheduled darkness, napping, exercise, and educational interventions; (2) shift system manipulation, whereby the actual shift system is altered, for example, by changing the speed and direction of rotation (this is the focus of the review by Erren 2013); and (3) pharmacological interventions, for instance, by the application of melatonin. This is the focus of the Liira 2014 review.
How the intervention might work
Light
One key component in the establishment of the sleep/wake rhythm in humans is melatonin secretion. This secretion peaks during the dark night, which is the habitual sleeping period. Melatonin opens the 'sleep gate' (Shochat 1998), inter alia, by inducing drowsiness and lowering body temperature, making it easier to fall and stay asleep (Burgess 2002; Cajochen 2010). Bright light exposure, predominantly blue light of 460 to 480 nanometres (nm), inhibits melatonin secretion. The application of bright light before, after, or during shifts is hypothesised to help adaptation to different shift schedules (Arendt 2010; Bougrine 1998; Burgess 2002; Costa 1993; Eastman 1991; Eastman 1994).
During the night shift, bright light is intended to increase alertness. This approach might then be supplemented by scheduled exposure to darkness at dawn/during daylight, i.e. via heavy curtains or dark goggles. This may facilitate day sleep after night shifts by preventing light from reaching the retina, thereby allowing melatonin secretions which contribute to the impending day‐sleep period (Eastman 1994; Sasseville 2006). Bright light given during the day shift, following a rotation of night shifts, is hypothesised to accelerate the individual’s readjustment to the external time environment.
Napping
Napping during a longer shift is hypothesised to increase alertness (Takeyama 2005), while napping during an overnight shift has been associated, in some studies, with lower levels of fatigue (Petrie 2004). The question of whether a single nap might impact sleepiness differently than multiple naps remains open (Banks 2015).
Other
Shift work appears to influence sleep length off‐shift. Shift workers tend to sleep less before night shifts than before day shifts, adding to sleepiness during night shifts. Sleep quality can also be influenced, since sleep episodes that occur as the melatonin level declines and body temperature rises usually are shorter and less well consolidated (Foster 2005). Educational interventions such as sleep hygiene courses address these issues, making participants aware of the physiology, and offering strategies to improve sleep off‐shift, with the aim of subsequently reducing sleepiness on‐shift. Associations between physical exercise and improvements in various sleep parameters have been observed (Kredlow 2015). Appropriately timed physical exercise is hypothesised to facilitate adaptation to night shifts and re‐adaptation to daytime schedules (Buxton 2003; Mistlberger 2005).
Why it is important to do this review
Systematic reviews exploring the effects of pharmacological interventions on problems associated with sleep‐wake disturbances have been published with increasing frequency over the past several years (Herxheimer 2008; Ker 2010; Liira 2014). While some of these interventions appear promising, pharmacological interventions may have adverse effects (Liira 2014). Until quite recently, systematic reviews on the topic of non‐pharmacological interventions to treat or prevent sleep and alertness problems were rare in the literature. To our knowledge, only two systematic reviews examining effects of person‐directed, non‐pharmacological interventions on preventing and treating sleep disturbances caused by shift work have been published (Neil‐Sztramko 2014; Ruggiero 2014). Although these reviews overlap with ours, their focus' are slightly different: Neil‐Sztramko 2014 excluded sleepiness and fatigue as outcomes in night‐shift workers, while Ruggiero 2014 examined only napping as an intervention in night‐shift workers.
Objectives
To assess the effects of person‐directed, non‐pharmacological interventions for reducing sleepiness at work abd improving the length and quality of sleep between shifts for shift workers.
Methods
Criteria for considering studies for this review
Types of studies
We included individually‐randomised and cluster‐randomised controlled trials. This includes randomised cross‐over trials, in which individuals eventually receive both interventions, but the order in which they receive these is random (counterbalancing alone was not sufficient). We included studies reported as full‐text, those published as abstract only, and unpublished data.
We also searched for laboratory trials. We defined laboratory trials as trials in which recruited individuals were exposed to the intervention in a laboratory setting that simulates shift work, and that includes night‐shift work. We present an overview of data from laboratory studies in separate tables (Table 1; Table 2; Table 3), and use the data for comparison in the Discussion section, but not for drawing conclusions on intervention effects.
| Light interventions | ||||||
| Reference | Study participants | Shift system | Intervention | Key endpoints | Key results | |
| 11 subjects (females??) | Simulated shift‐work schedule beginning 17:30 and ending 10:00 the next morning | 1 hour bright light + placebo; exposure to 3000 lux occurred between 01:30 and 02:30 hours, placebo at 01:40 | CRT | Exposure for 1 hour to bright light combined with placebo yielded swifter CRTs immediately after the treatment, but also seemed to result in more sleepiness and greater performance deficit than when the subjects were not exposed to the bright light. | ||
| 16 subjects (all males) | Graveyard shift (00:00‐07:59); rapidly rotating shift system, having three continuous nights' work followed by three days’ rest | 1) Low‐illuminance (250 lux, 3900 K) | Sleep quality (by diary); | High, increasing, and decreasing illuminance conditions associated with greater subjective arousal than were the low‐illuminance condition. No difference of performing simple cognitive tasks associated with the lighting conditions. | ||
| 26 subjects (7 females) | 3 consecutive night shifts between 24:00 hours until 08:00 hours the following morning | Exposed group: night 1: > 4000 lux between 00:00 hours to 04:00 hours, followed by ambient room illumination < 100 lux; night 2+3: circa 1000 lux for the duration of each shift Control group: < 100 lux (night 1‐3) | Levels of alertness during shift assessed using the RTSW | There was little effect on measures of on‐duty alertness and performance or on off‐duty sleep. Middle‐aged subjects may be less phase‐tolerant than young subjects. | ||
| 8 subjects (2 females) | 4 day shifts followed by 4 night shifts | Treatment subjects (n = 4) received 2500 lux in the latter half of night shifts + a scheduled 8‐hour evening sleep episode; control subjects were in standard lighting (90 lux) | Subjective sleepiness on‐shift; PVT reaction time | For treatment subjects, by night 2, reaction time was not different from day shifts, and by night 3, subjective sleepiness was not different from day shifts. The preliminary data indicate that a combination treatment of scheduled evening sleep before night shifts and enhanced lighting during night shifts improves on‐shift sleepiness and reaction time. | ||
| 8 subjects (all males) | 1 week of night work | Treatment study condition: circa 7000‐12,000 Iux at night and nearly complete darkness during the day (had to stay in their bedroom from 9:00‐17:00) Control study conditions: circa 150 lux; no restriction for the day | Subjective alertness on‐shift assessed with use of a VAS; cognitive performance measured by a test involving calculations | Both alertness and cognitive performance significantly improved in the treatment group during night‐shift hours. | ||
| 13 subjects (6 females) | 3 consecutive simulated night shifts between 00:00 and 08:00 | Treatment study condition: circa 6000 Iux between 00:00 and 04:00 on the first night shift + dim light (< 200 Iux) for the remainder of the study The control group received dim light throughout | Alertness on‐shift assessed using the RTSW; measures of sleep quality included time in bed, total sleep time, sleep efficiency, sleep onset latency, wake after sleep onset | The treatment was associated with significantly higher alertness across the night shift and improved sleep quality during the day. On‐shift alertness was improved relative to the control group. The data indicate that a single 4‐hour pulse of bright light between midnight and 04:00 is effective in ameliorating the sleep and alertness problems associated with transition to night shift. | ||
| 16 subjects (6 females) | 3 consecutive simulated night shifts between 23:00 and 07:00 | Treatment group condition: bright light (4000‐7000 Iux between 00:00 and 04:00) Control group conditions: dim red light < 50 lux | Sleep quality measured by wrist actigraphy; cognitive performance measured using computer‐based divided attention tasks | Sleep quality and cognitive psychomotor performance was improved in the Iight‐treatment group. | ||
| 46 subjects (21 females) | Simulated night shifts of 8 consecutive night‐work, day‐sleep days | Bright light durations of 6, 3 and 0 hours (i.e. dim light) during simulated night shifts. The bright light (circa 5,000 Iux) was used during all 8 night shifts, and dim light was < 500 Iux | Core body temperature continuously measured; sleep duration assessed by daily sleep log; mood assessed using the POMS | Substantial circadian adaptation (i.e. a large cumulative temperature rhythm phase shift) was produced in many subjects in the bright light groups, but not in the dim light group. Larger temperature rhythm phase shifts were associated with better subjective daytime sleep, less subjective fatigue and better overall mood. | ||
| 22 subjects (all male?) | 1 full day shift (08:00‐16:00) + 2 night shifts (19:00‐07:00) | Four treatment groups: bright light (2000 lux) for three hours at 19:00, 22:00, 01:00 or 04:00 during the first night shift Control group: dim red light during 01:00‐04:00; 200 lux ambient lighting | Core body temperature and wrist activity monitored by a Vitalog PMS‐8; cognitive performance and mood assessed through a battery computerised task battery. Specific measures of mood include: POMS, School of Aerospace Medicine Subjective Fatigue Checklist, SSS | Preliminary analysis indicates equal or better results across all groups on the second night shift as compared to the first night for simple reaction time, logical reasoning, addition/subtraction, sleepiness and fatigue. | ||
| 8 subjects (all males) | Simulated night shift regimen (60‐hour protocol) | Treatment group: during 20:00 to 08:00 (1st night), 4‐hour pulse of bright light (700‐1000 Iux) Control group: during 20:00 to 08:00 (1st night), dim light (circa 50 Iux); 2nd night: dim light in both groups | Self‐rated alertness assessed using a shortened version of the Activation ‐ Deactivation Adjective Checklist; performance tests were 'search and memory' tests derived from the Memory and Search Task | Self‐assessed alertness and task performance were improved by the exposure to bright light. Subjective alertness and performance continued to show a time course during the subsequent night following exposure only to dim light. | ||
| 11 subjects (all males) | Simulated night work | Day 1: dim light (< 15 lux) from 20:00 to 03:00 Day 2: light for four hours from 23:00 to 03:00 with a non‐visor cap (500 lux), red‐visor cap (circa 160 lux), blue‐visor cap (circa 160 lux) | Performance of a PVT as an index of objective sleepiness; subjective sleepiness on‐shift, fatigue, mood, visual comfort and brightness measured using a VAS | The red‐visor cap had no adverse effects on performance of the PVT, brightness and visual comfort, though it tended to increase subjective sleepiness. | ||
| Experiment 1: Pilot study: 5 subjects (4 females) Experiment 2: 6 subjects (all females) Experiment 3: 11 subjects (all males) | Experiment 1: two seven‐day study periods Experiment 2: 4 six‐day study periods Experiment 3: five seven‐day study periods | Experiment 1: ambient lighting in the clinical investigation unit of 50 lux; 2 hours of 10,000 Iux or dim light during 02:00‐04:00 Experiment 2: I‐hour 10,000 Iux at 20:00 or 00:00 or 04:00, or dim light Experiment 3: 1, 2 or 4 hours of 10,000 lux or dim light in time windows 01:00‐05:00 | Subjective fatigue measure on‐shift through Samn‐Perelli scale; alertness and performance measured using digit‐symbol substitution task, CRT, and subjective alertness ratings VAS + G15 | A series of experiments established that 2 hours of bright light (broad spectrum white, 02:00‐04:00, 10,000 lux) did improve subjective alertness and performance. Bright light given in the middle of the night (white 00:00‐01:00, 10,000 lux) was more effective than light given at 20:00 or 04:00. Light of 2 hours and 4 hours duration were more effective than 1 hour of light centred at 03:00 (white, 10,000 lux). Light of shorter wavelengths appeared to be more effective than light of Ionger wavelengths at improving nocturnal alertness and performance (01:00‐05:00, 300 lux). | ||
| 32 subjects (16 females) | Three consecutive simulated night shifts between 22:00‐06:00 | Treatment group: 4‐hour pulse of bright light (3000 lux) between 22:00 and 02:00 on night 1, 1 hour later in night 2, and 2 hours later in night 3 Control group: dim light (300 Iux) | Objective measures of working memory, selective attention, divided attention, concentration performance, and vigilance recorded by established performance tests (including working memory of the TAP, Go/No‐Go, Divided Attention of the test battery for attention testing; Konzentrations‐Leistungs‐Test; Simple Reaction Time Task) | Bright light Ieads to an improvement in working memory, divided attention and concentration performance in all three night shifts. Bright light leads to better performance for some forms of attention tasks in elderly night workers. | ||
| 32 subjects (16 females) | Three consecutive simulated night shifts between 22:00‐06:00 | Treatment group: 4‐hour pulse of bright light (3000 lux) between 22:00 and 02:00 on night 1, 1 hour later in night 2, and 2 hours later in night 3 Control group: dim light (300 Iux) | Objective measures of working memory, selective attention, divided attention, concentration performance, and vigilance recorded by established performance tests (subtest working memory of the TAP, Divided Attention of the test battery for attention testing; Konzentrations‐Leistungs‐Test (KLT‐R); PVT | Bright light exposure results in a better performance for cognitive tasks in older night workers over time. Except for high‐demand tasks, such as sustained attention tasks, bright light induces better performance in working memory and concentration tasks for older night workers. | ||
| 32 subjects (16 females) | Three consecutive simulated night shifts between 22:00‐06:00 | Treatment group: 4‐hour pulse of bright light (3000 lux) between 22:00 and 02:00 on night 1, 1 hour later in night 2, and 2 hours later in night 3 Control group: dim light (300 Iux) | Mood (Der Mehrdimensionale Befindlichkeitsfragebogen and sleepiness on‐shift (SSS) questionnaires and a concentration task, a working memory task, and a divided‐attention task by established performance tests (Konzentrations‐Leistungs‐Test (KLT‐R)); subtest working memory of the TAP; Divided Attention of the test battery for attention testing) | Results indicate that sleepiness and mood did not function as mediators in the prediction of concentration, working memory, and/or divided attention by light exposure. Bright light has a strong direct and independent effect on cognitive performance, particularly on working memory and concentration. | ||
| 35 subjects (9 females) | 6 days of simulated 8‐hour night shifts | Treatment group 1: 5700 lux 3 hours/day Treatment group 2: 12:30 lux 3 hours/day Treatment group 3: < 250 lux All participants wore dark sunglasses while outside during daylight | Core body temperature continuously measured; sleep duration via daily sleep log; mood and fatigue during day assessed using the POMS | During nights 3‐5, most subjects in the high and medium groups (100% and 85%) exhibited phase delays large enough that their body temperature minima occurred within the daytime sleep/dark period. Larger phase shifts were correlated with more sleep and less fatigue. Extremely 'bright' light may not be necessary for circadian adaptation in specific shift work situations. | ||
| 12 subjects (5 females) | All subjects exposed to the five lighting conditions between 20:00 and 08:00 over 5 consecutive weeks | Lighting conditions: 1) complete darkness; 2) unfiltered fluorescent white light (380‐730 nm); 3) fluorescent white light with wavelengths < 480 nm filtered' 4) fluorescent white light with wavelengths < 460 nm filtered; 5) fluorescent white light with wavelengths < 480 partially filtered | During each overnight testing session, objective and subjective neuropsychometric tests and saliva samples were collected every 2 hours. The Toronto Hospital Alertness Test, the Digit Vigilance Test, the SSS, the seven‐item Fatigue Scale self‐report questionnaire and a VAS for subjective mood were employed | Subjective alertness, mood, and errors on an objective vigilance task were significantly less impaired at 08:00 by filtering wavelengths < 480 nm compared with unfiltered nocturnal light exposure. The changes were not associated with significantly increased sleepiness or fatigue compared with unfiltered light exposure. The data suggest that spectral modulation may provide an effective method of regulating the effects of light on physiological processes | ||
| 4 subject (all males) | Two sessions of 11 days of simulated microgravity (6° head down tilt bedrest) with 6‐hour extensions of the wake period on 2 days (12‐hour phase delay) | Bright light (> 3500 Iux) for 5 hours on each of the 2 shift days and the following day at times either expected to accelerate the adjustment to the phase delay (treatment condition) or to have no phase shifting effect (control condition) | Sleep recorded polygraphically; circadian system monitored by recordings of heart rate and body temperature, and by collection of urine (electrolyte and hormone excretion); subjective sleep duration assessed via sleep log | 5‐hour exposures to bright light finishing at the time of the circadian temperature minimum were not more effective at accelerating adjustment to a 12‐hour schedule delay than exposures coinciding with the temperature maximum. We conclude that, while bright light may accelerate adjustment to work‐rest schedule delays, any such effect seems to be largely independent from the timing of the light exposure. No significant effects in polygraphically measured sleep parameters | ||
| 11 subjects (all males) | Three consecutive simulated night shifts (22:00‐06:00); after a 2‐week rest, a second run of three consecutive night shifts | Treatment group: lighting environment (800 lux) with reduced short‐wavelength components Control group: unfiltered bright light (800 lux) environment | Circadian markers (including urinary aMT6s), symptoms of lassitude, and personal mood; fatigue (and other parameters) assessed via mood rating inventory before and after the shift; Vienna Test System, including performance testing (reaction time analysis), vigilance testing and evaluation of attentiveness (Continous Attention) | Mood rating inventories did not result in differences in the subjective perception between the two lighting environments with respect to the dimensions of 'activity', 'concentration', 'deactivation', and 'fatigue'. In addition, changes in signs of vigour and weariness in the course of each night of the study were equally pronounced in test light and bright light. | ||
| 71 subjects (29 females) | after ≥ 2 night shifts in the field, 1 simulated night shift in the laboratory | Treatment group: blue‐enriched white light (17,000 K, 150 lux) from 2300‐0700 Control group: continued background white light (4000 K, 150 lux) | Habitual sleep‐wake patterns monitored for 1‐3 weeks via diaries and actigraphy; urine collected for aMT6s; assessments via KSS, PVT, polysomnography and mood | Exposure to blue‐enriched light was not associated with significant improvements in PVT performance, or electro‐oculogram correlates of alertness. During the biological night, however, blue‐enriched light was associated with improved subjective alertness. | ||
| 30 subjects (19 females) | 2‐night protocol | Lighting conditions: | Sleep estimated with actigraphy; subjective sleepiness (VAS); throughout night 2, the MSLT, SALT performance | 4‐hour exposure to bright light significantly increased MSLT scores and improved SALT performance during the early morning hours on the night following bright‐light exposure. No significant effects were noted with a 2‐hour exposure. | ||
| 19 subjects (5 females) | no less than 1 week between the interventions 1‐3 | Interventions: | Body temperature and psychomotor vigilance (PVT); Saliva collected before and after light treatment for melatonin assay | Temperature, subjective alertness and PVT performance decreased significantly across the night. BL significantly suppressed melatonin, but did not improve subjective alertness or PVT performance. SD markedly increased incidents, accidents, and standard deviation of lane position. BL compared to DL did not improve performance during the first 22 min circuit, but across the 2 circuits BL significantly attenuated the effect of time on task on incidents and accidents. | ||
| Light and glasses interventions | ||||||
| Reference | Study participants | Shift system | Intervention | Key endpoints | Key results | |
| 50 subjects (19 females) | 8 consecutive simulated night shifts | Four groups in 2 x 2 design: light (bright, dim); goggles (yes, no); exposure to bright light (circa 5000 lux) for 6 hours on the first two night shifts; dim light < 500 lux | Core body temperature continuously measured; sleep duration via daily sleep log; mood and fatigue assessed using the POMS | Both bright light and goggles were significant factors for producing circadian rhythm phase shifts. The combination of bright light plus goggles was most effective; the combination of dim light and no goggles was least effective. Larger temperature‐rhythm phase shifts were associated with better subjective daytime sleep, less subjective fatigue and better mood. There was no significant main effect of goggles on sleep duration, but the main effect of light and the interaction of light and goggles were not significant. | ||
| 24 subjects (14 females) | 3 simulated night shifts (2300‐0700), 2 days‐off + 4 more night shifts | Treatment group: five 15 minute bright light pulses during night shifts + sunglasses when outside + sleep in dark bedrooms at scheduled times after night shifts and on days‐off + outdoor afternoon light exposure (the “light brake”) Control group: remained in normal room light during night shifts + lighter sunglasses + unrestricted sleep and outdoor light exposure | DLMO; daily sleep log + actigraphy, alertness on‐shift, total sleep time assessed using sleep logs and actigraphy; reaction time (SRT) test | The final DLMO of the experimental group was close to our target compromise phase position, and significantly later than the control group. Experimental subjects performed better than controls, and slept for nearly all of the allotted time in bed. Controls demonstrated pronounced performance impairments late in the night shifts, and exhibited large individual differences in sleep duration. | ||
| 31 subjects (17 females) | 3 simulated night shifts (23:00‐07:00) + 2 days‐off | Two treatment groups: intermittent bright light during night shifts (75 and 120 min/night) + dark sunglasses when outside + sleep in dark bedrooms at scheduled times after night shifts and on days‐off + outdoor light exposure upon awakening from sleep Control group: dim room light during night shifts + lighter sunglasses + unrestricted sleep and outdoor light | DLMO; daily sleep log + actigraphy; simple reaction time (SRT) test | After the days‐off, the DLMO of the experimental groups was in a good position to reach the target after subsequent night shifts with bright light. The DLMO of the control group changed little from baseline. Experimental subjects performed better than control subjects during night shifts on a reaction time task. | ||
| 19 subjects (11 females) | 3 simulated night shifts (23:00‐07:00); 2 days‐off, 4 night shifts + 2 days‐off | Treatment group: four 15‐min BL pulses during night shifts + sunglasses when outside + sleep in dark bedrooms at scheduled times + outdoor afternoon light (“light brake”) Control group: remained in normal room light during night shifts + lighter sunglasses + unrestricted sleep and outdoor light | DLMO; daily sleep log + Actiwatch‐L; Automated Neurophysiological Assessment Metrics test battery (SRT reported) | The final DLMO of the experimental group was close to the target of 03:00, and later than the control group. Subjects who phase‐delayed (whether in the experimental or control group) close to the target phase performed better during night shifts. | ||
aMT6s: 6‐sulfatoxymelatonin
CRT: Choice Reaction Time
DLMO: Dim Light Melatonin Onset
MSLT: Multiple Sleep Latency Test
POMS: Profile of Mood States
PVT: Psychomotor Vigilance Task
RTSW: Repeated Test of Sustained Wakefulness
SALT: Simulated Assembly Line Task
SRT: Simple Reaction Time
SSS: Stanford Sleepiness Scale
TAP: Test battery for Attentional Performance
VAS: Visual Analogue Scale
| Nap interventions | ||||||
| Reference | Study participants | Shift system | Intervention | Key endpoints | Key results | |
| 20 subjects (6 females) | Subjects awakened at 07:00 of the experimental day and were prohibited from sleeping until the end of experiment except for the nap (01:00‐02:00) in the nap group Participants remained awake for 20 hours ‐ performing cognitive tasks at 21:00, 02:00 and 03:00; experimental chamber below 150 lux, 30 lux during cognitive task period, 0 lux during the nap | Nap condition: 1‐hour nap 01:00‐02:00 Rest condition:1‐hour awake‐rest period 01:00‐02:00 | Sleep logs + Actiwatch‐L + polysomnography + EEG; stimulus‐response compatibility (arrow‐orientation task, reaction time | Behavioural performance and amplitude of the error‐positivity declined after midnight (i.e. 02:00 and 03:00) compared with the 21:00 task period in both groups. During the task period starting at 03:00, the participants in the awake‐rest condition reported less alertness and showed fewer correct responses than those who napped. | ||
| 12 subjects (all males) | 3 consecutive nights and 2 days in the laboratory for 2 consecutive weeks (= session 1+2) | Session 1: 4‐hour afternoon nap + caffeine at 01:30 and 07:30 Session 2: four 1‐hour naps during the night + placebo In both sessions pills (placebo or caffeine) were administered at 01:30, 07:30, 13:30, 19:30) | MSLT, EEG; performance and mood were assessed with repeated batteries of measures (logical reasoning, WAlS, computer‐modified Williams Word Memory Test of immediate free recall, visual vigilance, subjective sleepiness/alertness, POMS, oral temperature) across the 24‐hour operation | After an afternoon nap, subjects had increased objective and subjective alertness, increased oral temperature, and increased performance on complex tasks like logical reasoning and correct additions when compared to the condition that allowed four night‐time naps. | ||
| 24 subjects (all males) | 3 consecutive nights and 2 days in the Iaboratory | Nap condition 1: 16:00‐20:00 prior to a 24‐hour period of sleep loss Nap condition 2: as in 1 + 200 mg caffeine at 01:30 and 07:30 All subjects received pills at 01:30, 07:30, 13:30, 19:30. For all subjects, the pills received at 13:30 and 19:30 were placebos | MSLT, EEG; visual vigilance, subjective sleepiness/alertness, POMS; performance and mood were assessed with repeated batteries of measures (logical reasoning, WAlS, computer‐modified Williams Word Memory Test of immediate free recall | Performance tests all indicated maintenance of baseline performance Ievels in the caffeine group after administration of caffeine, while performance declined in the placebo group. The combination of nap and caffeine was able to maintain alertness and performance at very close to baseline Ievels throughout a 24‐hour period without sleep. | ||
| 140 subjects (all males) | 4 consecutive nights and 3 days in the laboratory | 1) Nap condition: nap at 12:00, 16:00, 18:00 or not at all 2) Caffeine condition: single 400 mg dose of caffeine at 01:30 each night or repeated doses of 150 mg or 300 mg every 6 hours starting at 01:30 on the 1st night of sleep loss 3) Placebo condition: no‐nap and placebo administered every 6 hours on the repeated caffeine schedule was run for 1) and 2) During the sleep‐loss period, all subjects were administered placebo capsules every 6 hours starting at 01:30 | MSLT, EEG; performance and mood were assessed with repeated batteries of measures (logical reasoning, WAlS, computer‐modified Williams Word Memory Test of immediate free recall, visual vigilance, subjective sleepiness, POMS, oral temperature) across the 24‐hour operation | Naps provided Ionger and less graded changes in performance, mood and alertness than did caffeine, which displayed peak effectiveness and loss of effect within about 6 hours. Neither nap nor caffeine conditions could preserve performance, mood, and alertness near baseline Ievels beyond 24 hours, after which Ievels approached those of placebo. | ||
| 12 subjects (all males) | 3 consecutive nights and 2 days in the Iaboratory | Nap condition 1: 4‐hour afternoon nap Nap condition 2: four 1‐hour naps during the night Nap condition 3: 0.125 mg of triazolam prior to a prophylactic 4‐hour nap before the 24‐hour operation | MSLT, EEG; performance and mood were assessed with repeated batteries of measures (logical reasoning, WAlS, computer‐modified Williams Word Memory Test of immediate free recall, visual vigilance, subjective sleepiness/alertness, POMS, oral temperature) across the 24‐hour operation | When a series of 1‐hour naps was taken during the normal night period, oral temperature and psychomotor performance also declined. However, performance was relatively improved on the following evening. In contrast, with an effective 4‐hour prophylactic nap, performance remained near baseline Ievels across the night. Fatigue increased over the course of the study, the increases were similar in each group. | ||
| 18 subjects (all males) | 3 separate 38‐hour periods of continuous wakefulness, each separated by 10 hours of recovery sleep | Nap condition 1: 2‐hour evening nap (at 21:00) induced with 10 mg zolpidem tartrate Nap condition 2: 2‐hour nap (at 21:00) with placebo; Condition 3: 2‐hour rest break with no sleep Following 1) or 2) or 3), subjects remained awake for 23 additional hours | Sleepiness on‐shift, alertness (and others) assessed using VAS; Repeated Test of Sustained Wakefulness; polysomnography of naps; POMS; multiattribute task battery | Results indicated the effectiveness of prophylactic naps for sustaining mood, alertness, and performance throughout the final 23 hours of a 39‐hour period of sustained operations. Both napping conditions attenuated the decrements normally associated with total sleep deprivation, but the zolpidem nap was the most effective because subjects obtained the most sleep. | ||
| 59 subjects (31 females) | 4‐day protocol with 3 early morning shifts (07:00‐15:00) followed by a rapid rotation to the midnight shift (23:00‐07:00) | Nap condition 1: long nap of 2 hours Nap condition 2: a short nap of 45 minutes Nap condition 3: no‐nap condition | Wrist activity monitors; sleepiness on‐shift via Stanford Sleepiness Scale; Air Traffic Scenarios Test; the Bakan, a test of vigilance | While sleepiness increased across the midnight shift for all groups, ratings were generally lower for the long nap condition and were lower for males in the short nap condition. Both cognitive performance and subjective measures of sleepiness supported the use of naps during the midnight shift. | ||
| 12 subjects (all males) | Sleep of 4 hours during the preceding night, work during the day and then kept awake (except for naps) in the laboratory from 17:00 to 08:00 the following morning | Nap condition 1: one‐hour nap (21:00h) Nap condition 2: one‐hour nap (04:30h) Nap condition 3: no‐nap | EEG, EOG; self‐ratings of sleepiness on‐shift, sleep latency tests; single choice visual reaction time task | Clear positive effects of naps (especially the 04:30 nap) on performance. The sleep latency measurements showed similar, but less clear tendencies, while ratings of sleepiness did not differentiate between conditions. | ||
| 30 subjects (18 females) | 3‐day laboratory study including one baseline sleep (22:00‐07:00) and one experimental night | Nap condition 1: total sleep deprivation (NO‐NAP) Nap condition 2: 10‐min nap (10‐NAP) Nap condition 3: 30‐min nap (30‐NAP) Nap opportunities ended at 04:00 | Fatigue scale, sleepiness scale, and self‐rated performance scale; psychomotor vigilance test (PVT‐B), digit‐symbol substitution task | In the 30‐NAP condition, performance immediately deteriorated from pre‐nap and was still worse at 47 min postnap. A 10‐min ‐ but not a 30‐min ‐ night‐time nap had minimal sleep inertia and helped to mitigate short‐term performance impairment during a simulated night shift. | ||
| 21 subjects (12 females) | 3‐day laboratory study; keeping subjects awake for 27 hours for 1 simulated night shift; 40‐min York highway driving task at 07:15 to simulate the commute | Nap condition 1: total sleep deprivation (NO‐NAP) Nap condition 2: 10‐min nap ending at 04:00 + a 10‐min pre‐drive nap ending at 07:10 (10‐NAP) | Polysomnography; SP‐Fatigue; PVT‐B | In the 10‐NAP condition, PVT‐B performance was worse after the nap (07:12) compared to before the nap (06:30); no change across time was found in the NO‐NAP condition. SP‐Fatigue and driving performance did not differ significantly between conditions. | ||
| 79 subjects (27 females) | 10‐day sleep restriction protocol, assignment to one of 18 sleep regimens | Nap condition 1: restricted diurnal sleep + nocturnal nap (0.4‐hour, 0.8‐hour, 1.2‐hour, 1.6‐hour, 2.0‐hour or 2.4‐hour time in bed Nap condition 2: restricted diurnal sleep + no‐nap | Polysomnography; total sleep time (sleep duration) | Napping on the night shift does not degrade subsequent daytime SE above and beyond SE reduction associated with daytime sleep or increasing overall time in bed | ||
| 12 subjects (all males) | 3‐day experiment with 1 simulated night shift (22:00–08:00 ) and subsequent day (11:30–17:30) and night sleep (00:00–07:00) | Nap conditions: 1) 00:00–01:00 (early 60 min; E60); 2) 00:00–02:00 (E120) 3) 04:00–05:00 (late 60 min; L60) 4) 04:00–06:00 (L120) 5) no‐nap | Polysomnography; rectal temperature; VAS for sleepiness; visual vigilance test; set of tasks, including English transcription task + a performance test battery | Posthoc analyses showed significantly longer RTs and more lapses following the L60 nap compared with no‐nap. In contrast, there was no significant difference in sleepiness between the L60, or any of the other nap conditions, and the no‐nap condition. Findings suggest the effect of sleep inertia on visual vigilance test performance was profound in the L60 condition, although no significant effects on sleepiness were self‐reported by VAS. | ||
| 22 subjects (13 females) | Simulated night shift environment with a 2‐hour sleep in the afternoon from 15:00–17:00 hours, followed by nap condition 1 or 2 in 02:30–03:00 | Nap condition 1: 30‐min nap Nap condition 2: no‐nap | Sleepiness on‐shift (SSS, KSS), fatigue and vigour subscales of the POMS, and the VAS for sleepiness; symbol–digit substitution task, the letter cancellation task, and the PVT | The 30‐min nap resulted in some impairment of subjective alertness for a brief period (up to 30 min) immediately following the nap when compared to the no‐nap condition. Following this brief period, alertness improved by the 30‐min nap from 04:00 until the end of the testing period at 07:00. | ||
| 8 subjects (1 female) | Simulated night shift; alertness and performance testing sessions + 2‐hour runs in a driving simulator | From 14:00 to 17:00 Nap condition 1: sleep Nap condition 2: sedentary activities | Polysomnography, subjective fatigue and sleepiness on‐shift via VAS, sleep quality (Sleep Quality Questionnaire); EEG; 3 computerised tests from the Walter Reed performance assessment battery | In the nap condition, the subjects showed lower subjective sleepiness and fatigue, as measured by VAS, and faster reaction times and less variability on psychomotor performance tasks. | ||
| 8 subjects (all male) | 5 Nap conditions between a previous full night's sleep and a day sleep on the day following the night | Nap conditions: a 2‐hour nap between: 1) 22:00‐00:00 (N1) 2) 02:00‐04:00 (N2) 3) 04:00‐06:00 (N3) 4) 06:00‐08:00 (N4) 5) no‐nap(Control group) | EEG, EOG, EMG, ECG, respiratory movement; rectal temperature, oral temperature; flicker fusion frequency, sleepiness, fatigue complaints | Decrease in rectal temperature during the night was more marked for conditions N2, N3 and N4, with a lesser extent of individual differences, than for the Control group and N1. The self‐evaluation of the sleep depth and the rapidness of sleep onset correlated highly with sleep parameters. N3 and N4 were evaluated to have resulted in a better sleep than N1. | ||
| 6 subjects (all female) | 3 x 3 days experimental conditions Day 1+2 daily activities Day 3: awake from 00:00 until 10:00 with a nap period which started at 03:00 | On each of 3 days: nap condition 2: 1‐hour nap nap condition 3: 2‐hour nap | Fatigue Feelings Scale, SSS; EEG, EOG and EMG during the naps | A 1‐hour nocturnal nap gave significantly smaller scores on two subscales of Fatigue Feelings Scale during early morning hours than no napping. A 2‐hour nocturnal nap, which contained significantly Ionger duration of Slow Wave Sleep than a 1‐hour nocturnal nap, did not differ from a 1‐hour nocturnal nap in decreasing scores of fatigue feelings during these hours | ||
| 24 subjects (all males) | 5 nights experimental design with one no‐nap condition before the night tests + a nap condition that comprised the 1‐hour nap followed by the test sessions | Nap condition 1: 1‐hour nap at 00:00 Nap condition 2: 1‐hour nap at 03:00 | Sleep inertia (spatial memory) and logical reasoning tasks | No effects on accuracy, and no circadian effects of napping were found. Pooled data of intervention groups showed that the performance in the 1‐hour nap condition exhibited significant reductions of speed immediately following awakening, when compared with no‐nap, reflecting sleep inertia effects. | ||
| Study A: 10 subjects (7 females); Study B: 12 subjects (5 females) | Study A&B: Two night‐time work periods separated by at least three normally timed nights of sleep | Study A ‐ Nap condition: 3‐hour nap opportunity on 1 night between 20:00 and 23:00 ; Study B ‐ Caffeine condition: 4 mg/kg caffeine on 1 night | Polysomnography, sleepiness on‐shift SSS, VAS; alertness (computer‐driven simulated assembly line task) | Performance and subjective alertness improved after both a 2·3‐hour evening nap or ingestion of caffeine prior to the work shift. Although neither napping nor caffeine countered the strong circadian influence on performance and alertness in the early morning hours, both strategies attenuated their sharp decline. | ||
| 13 subjects (all male) | Simulated shift work schedules of 9 consecutive days: 2 day (08:00‐16:00) + 3 night (22:00‐08:00) + 3 day shifts; between experimenting with nap condition 1 and 2, rest period of 1 week | Nap condition 1: nap from 02:00‐04:00 Nap condition 2: no‐nap | Fatigue and anxiety questionnaire, heart rate variability, oral temperature, salivary cortisol; two performance tasks: typing figures + performing mental arithmetic; CFF, 3‐choice reaction time | Task performances decreased and subjective fatigue and anxiety increased in proportion to the length of time worked in both M‐types (morningness) and E‐types (eveningness) who had no‐nap. In M‐types, these changes were significantly suppressed by the nap on the first night of duty. Changes for E‐types were smaller than those for M‐types in terms of task performance and psycho‐physiological parameters. | ||
| 6 subjects (all male) | 5 nap conditions on‐shift for each participant; 3 consecutive days with one night shift (22:00‐08:00) followed by daytime sleep and night sleep; at least 5 days between the experiments | Nap conditions: | Polysomnography, questionnaire on subjective fatigue, heart rate variability, rectal temperature; performance task (typing text) and tests (choice reaction time test, a logical reasoning test, a vigilance test, and a CFF test) | Sleep latency was shorter and sleep efficiency was higher in the nap in L60 and L120 than that in E60 and E120. Performance was somewhat improved by taking a 2‐hour nap later in the shift, but deteriorated after a one‐hour nap. | ||
| 24 subjects (15 females) | Simulated night‐shift schedules with at least one week intervening between conditions | 2‐hour afternoon sleep opportunity + one of two‐nap conditions: 1) 30‐min night‐nap; 2) no night‐nap | Polysomnography, subjective sleepiness on‐shift (SSS, KSS, VAS), objective sleepiness on‐shift (sleep latency tests); objective performance (Symbol Digit Substitution Task) + reaction time (PVT) | Subjective sleepiness was less correlated with objective sleepiness and objective performance when participants were given a 30‐min night nap. However subjective sleepiness and reaction time performance was strongly correlated in both conditions, and there was no significant difference between the nap and no‐nap conditions. | ||
CFF: Critical Flicker Fusion Frequency
ECG: electrocardiogram
EEG: electroencephalogram
EMG: electromyography
EOG: electro‐oculogram
KSS: Karolinska Sleepiness Scale
MSLT: Multiple Sleep Latency Test
POMS: Profile of Mood States
PVT: Psychomotor Vigilance Task
PVT‐B: brief Psychomotor Vigilance Test
RT: Reaction Time
SE: Standard Error
SP‐Fatigue: Samn‐Perelli Fatigue Scale
SSS: Stanford Sleepiness Scale
VAS: Visual Analogue Scale
WAIS: Wechsler Adult Intelligence Scale
| Other interventions | ||||||
| Reference | Study participants | Shift system | Intervention | Key endpoints | Key results | |
| 33 subjects (17 females) | Simulated night work study with 8 consecutive night shifts followed by daytime sleep/dark periods | 1) Intermittent bright light (6 pulses, 40‐min long each, at 5000 lux) versus dim light (< 500 lux, 20 min ) 2) Intermittent exercise (6 bouts, 15‐min long each, at 50%‐60% of maximum heart rate) versus no exercise; bright light and exercise interventions during the first 6 hours of the first 3 night shifts | Core temperature; sleep duration (sleep log) | Intermittent bright light groups had significantly larger phase delays than dim‐light groups, and 94% of subjects who received bright light had phase shifts large enough for the individual rectal temperature minimum to reach daytime sleep. Exercise did not affect phase shifts; neither facilitating nor inhibiting phase shifts produced by bright light. During the last 4 days of the study, subjects in the bright light groups slept more (within the scheduled sleep/dark periods) and napped less than those in the dim light groups. | ||
| 43 subjects (all male) | 5‐day night work study involving a 10‐hour phase delay of the work/rest cycle | 1) Bright white light (3500‐4300 Iux) versus dim red light (200‐300 Iux) from 22:00‐02:00 each night 2) Inactive LEET versus active LEET therapy for 20 min prior to the daytime sleep periods | Polysomnography; circadian phase shifting evaluated via core body temperature + urinary 6‐SM excretion; indirect measurement of alertness: complex reaction time, simple reaction time; subjective alertness (VAS); performance examined with a cognitive performance assessment battery | 6‐SM data indicate that bright light exposure increased the phase delay seen in this circadian rhythm in the 3 days after the work/rest schedule shift. Bright light treatment shows evidence of improving accuracy on a broad range of cognitive performance, without compensatory decreases in speed. LEET administration before the daytime sleep periods showed little evidence of affecting either performance or 6‐SM. Complex reaction time: bright light‐exposed subjects performed significantly better than did dim light‐exposed on all three postshift testing sessions, with the largest difference the second postshift night (Day 3). Bright light subjects started out slightly less alert at baseline, dropped less the first night after the shift, and rose much more the second night after the shift. On the last night both groups dropped to a similar level. | ||
| 45 subjects (all male) | 5‐day night work study with subjects working and being tested during three 9‐hour night shifts from 18:00‐03:00 | 1) Bright light (3500‐4300 lux) or dim light (200‐300 lux) from 22:00‐02:00 each night 2) LEET for 20 min prior to daytime sleep 3) Both bright light) + LEET) 4) Placebo treatments | Polysomnography; 6‐SM, VAS of sleepiness; cognitive tests in the performance assessment battery, simple and complex reaction times (simple reaction times + complex reaction times) trials, word memory task | Bright light accelerated phase delay of the circadian melatonin rhythm after the work‐rest schedule shift. Further, subjects who received bright light had greater total sleep time and improved sleep continuity. Some minor improvements in cognitive performance were produced by light treatments but not by LEET. | ||
| 28 subjects (all male) | 6‐hour night‐time flight in a flight simulator; a structured sleep/wake schedule for three nights just prior to the study; obtaining their typical amount of night‐time sleep between the hours of 22:00 and 08:00 | Treatment condition: 5 breaks spaced hourly during cruise Control condition: 1 break in the middle of cruise | Questionnaire + interview; EEG/EOG, subjective sleepiness (KSS, VAS); vigilance performance (PVT), subjective sleepiness ratings, electrophysiological measures of drowsiness, continuous video | The treatment group showed significant reductions for 15 min postbreak in slow eye movements, theta‐band activity, and unintended sleep episodes compared with the control group. The treatment group reported significantly greater subjective alertness for up to 25 min postbreak. There was no evidence of objective vigilance performance improvement at 15‐25 min postbreak. | ||
| 35 subjects (14 females) | 10‐day shift work simulation (4 day shifts = 07:00‐15:00 and 3 night shifts = 23:00‐07:00) | 1) Morning Sleep (08:00‐16:00) + phase‐delaying light exposure (23:00‐03:00) 2) Evening Sleep (14:00‐22:00) + phase‐advancing light exposure (03:00‐07:00) | Polysomnography; dim light salivary melatonin onset; RT in the PVT; subjective alertness via the KSS | Analysis of the dim light salivary melatonin onset indicated a modest but significant circadian realignment in both sleep groups. Daytime sleep efficiency and total sleep time did not differ between them or from their respective baseline sleep. On the final night shift, the evening sleep subjects had fewer episodes of attentional impairment and quicker responses on the PVT than their morning sleep counterparts. | ||
| 8 subjects (all male) | Simulated night work (22:00‐08:00) with an hourly exercise consisting of 30 min task, 15 min test and 15 min break | Treatment condition: hourly exercise (3 min during breaks) Control condition: no exercise during breaks | Heart rate variability; a VAS for subjective fatigue + sleepiness, psychomotor vigilance test (PVT) | Work performance in the last 10 min of each 30‐min task was better under the treatment condition than under the control condition. During the second half of the test period, exercise showed an effect on sustained attention. Exercise was not effective in reducing subjective fatigue and sleepiness. | ||
| 17 subjects (all male) | In a temporal isolation facility with dim light conditions (< 10 lux), sleep schedules were phase‐advanced by 8 hours from habitual sleep times for 4 days, followed by a free‐run session for 6 days with no time cues. During the shift schedule, the treatment and control groups performed physical exercise or not | Treatment group: physical exercise with a bicycle ergometer in the early and middle waking period for 2 hours each Control group: sat on a chair at those times | Polysomnography, bed sensor, wrist activity + light intensity (Actiwatch); plasma melatonin, continuous rectal temperature | Sleep‐onset on the first day of free‐run in the exercise group was significantly phase‐advanced from that in the control and from the baseline. The circadian melatonin rhythm was significantly phase‐delayed in both groups, showing internal desynchronisation of the circadian rhythms. | ||
EEG: electroencephalogram
EOG: electro‐oculogram
KSS: Karolinska Sleepiness Scale
LEET: Low Energy Emission Therapy
PVT: Psychomotor Vigilance Task
VAS: Visual Analogue Scale
6‐SM: 6‐ sulphatoxymelatonin
Types of participants
We included studies conducted with adult workers engaged in shift work schedules that include night‐shift work, irrespective of industry, country, age or comorbidities. For inclusion in this review, we placed no restriction on the 'sleep health‐status' of the participants; we included studies examining participants who had sleep problems, studies in which participants were sleep‐disorder free, and studies in which sleep health was not assessed.
Types of interventions
We included trials comparing any person‐directed, non‐pharmacological intervention with any other intervention or no intervention.
Types of outcome measures
Primary outcomes
Sleepiness on‐shift: Measured at the beginning, middle, and end of the shift as either:
-
self‐rated (subjective) sleepiness, measured with a validated questionnaire such as the Karolinska Sleepiness Scale (KSS) (Akerstedt 2014), Stanford Sleepiness Scale (SSS) (Herscovitch 1981; Hoddes 1972), Epworth Sleepiness Scale (ESS) (Johns 1991), relevant questions in the Standard Shift Work Index (Barton 1995), or other visual analogue scales (VAS); or
-
physiological sleepiness, measured by electrophysiological methods while working (e.g. electroencephalogram or electro‐oculogram measurement) or by standardised physiological tests of sleepiness, such as, the Multiple Sleep Latency Test (Carskadon 1986), the Maintenance of Wakefulness Test (Mitler 1982), or the pupillometric assessment; or
-
behavioural sleepiness, measured as performance in a validated vigilance test such as the Psychomotor Vigilance Task (PVT) test (e.g. Basner 2011; Thorne 2005), the Mackworth Clock Test (Mackworth 1950), or single or multiple choice reaction time tests; or
-
behavioural sleepiness measured as characteristics of overt behaviour that are identified through video recording methods, such as, an Observer Rating of Drowsiness (ORD) (e.g. Wierwille 1994), or percentage of eyelid closure (PERCLOS) (Dinges 1998; Sommer 2010).
Sleep length off‐shift: Length of sleep based on the relevant questions in validated questionnaires (see examples above), sleep diaries, or wrist‐worn actigraphy.
Sleep quality off‐shift: Measured with a validated or psychometrically tested questionnaire, such as, the Bergen Insomnia Scale (Pallesen 2008), Pittsburgh Sleep Quality Index (PSQI) (Buysse 1989), Basic Nordic Sleep Questionnaire (Partinen 1995), Jenkins Sleep Questionnaire (Lallukka 2011), Karolinska Sleep Questionnaire (Akerstedt 2002; Kecklund 1992), relevant questions in the Standard Shift Work Index, and sleep diaries or wrist‐worn actigraphy‐based data.
The term 'fatigue' is usually used to describe exhaustion or tiredness due to long‐lasting exertion. Nevertheless, in some studies 'fatigue' is used as a synonym for sleepiness. Therefore, in our search we also included the term 'fatigue' as an outcome measure when it was used as a measure of sleepiness.
Secondary outcomes
In those studies that reported this review's primary outcomes, we also intended to examine the following secondary outcomes.
-
Costs for lighting interventions (e.g. initial and running costs of the lighting equipment).
-
Costs for napping interventions (e.g. number of staff and costs for covering the time when individuals sleep).
Search methods for identification of studies
Electronic searches
We searched the following databases: the Cochrane Central Register of Controlled Trials (CENTRAL; 2015, Issue 8), MEDLINE Ovid (1946 to 1 August 2015), Embase (1974 to 1 August 2015), Web of Knowledge (1945 to 1 August 2015), ProQuest (1970 to 1 August 2015), PsycINFO (1806 to 1 August 2015), OpenGrey (searched 1 August 2015), and OSH‐UPDATE (IOSHTIC, NIOSHTIC‐2, HSELINE, CISDOC) (1930 to 1 August 2015). We used a search strategy specifically designed for MEDLINE and subsequently adapted for other relevant databases (except for Proquest, where we searched using subject headings and keywords only) (see Appendix 1; Appendix 2; Appendix 3; Appendix 4; Appendix 5; Appendix 6).
Because the search term 'shift' alone would have led to a very high number of citations, we combined the term 'shift' with other terms used to describe specific aspects of shift work. Examples are 'shift work', 'night shift', 'shift schedule' and 'graveyard shift'. We also accounted for terms that describe shift work, but do not use the word 'shift', such as 'duty time' or 'hours', 'rota' or 'four‐day week' or 'compressed work week' used to denote a series of 12‐hour shifts. The search was limited by terms for different outcomes or types of interventions. Due to the extreme overlap in the literature on person‐directed interventions and shift system interventions (the latter being the focus of a separate Cochrane Review (Erren 2013)), we conducted one combined search and screened for both the current review and the shift schedule review.
Searching other resources
We checked reference lists of original articles and review articles for additional references. Furthermore, we contacted experts in the field to identify additional unpublished materials. We searched the conference proceedings of the biannual symposium on night and shift work. We searched the World Health Organization (WHO) Trial Register (who.int/ictrp), as well as the most important trial registers within this register directly (clinicaltrials.gov and clinicaltrialsregister.eu).
Data collection and analysis
Selection of studies
Two review authors independently screened titles and abstracts of all the studies identified as a result of the search (pairs included some combination of TS, VG, MB, AD and RR). They coded these as 'retrieve' (eligible or potentially eligible/unclear) or 'do not retrieve'. We retrieved all eligible or potentially eligible/unclear full‐text study reports. Two review authors independently screened these for inclusion and subsequently identified and recorded reasons for the exclusion of ineligible studies (pairs included some combination of TS, VG, MB, AD, RR and GC). We resolved any disagreement through discussion or, if required, we consulted a third review author (TE or AP).
We recorded the selection process in sufficient detail to complete a PRISMA flow diagram and Characteristics of excluded studies table (Moher 2009). We also sought to obtain further information from field study authors when a paper was found to contain insufficient information to enable us to reach a decision on eligibility.
Data extraction and management
Two review authors independently extracted trial data (pairs included some combination of TS, VG, AP, MB, AD and RR). For field studies, extracted data included country, trial design, characteristics of the trial participants, inclusion and exclusion criteria, type of work, branch of industry, and types of interventions and outcomes. For relevant outcomes, we extracted the statistical results, such as means and standard deviations for continuous data. Disagreement was resolved by discussion with a third review author (TE). For laboratory studies, extracted data included author, year, participant number and gender, intervention details, key endpoints, and key results.
Assessment of risk of bias in included studies
Two review authors independently assessed the risk of bias of the included field studies (TS, VG). We resolved disagreements by consensus. We contacted study authors for missing methodological information. Wherever possible we used quotes from the text to support our judgements about the individual 'Risk of bias' items. We assessed the risk of bias across the following eight domains.
-
Sequence generation.
-
Allocation concealment.
-
Blinding of participants and personnel.
-
Blinding of outcome assessors.
-
Incomplete outcome data.
-
Selective outcome reporting.
-
Outcome reliably or objectively measured.
-
Other sources of bias.
We applied a risk of bias rating of 'low', 'high' or 'unclear' to each of the eight bias domains (taken, added to, and modified where applicable from (Higgins 2011)). We judged a study to have a low risk of bias overall if we assessed all seven (or eight, for cross‐over trials) domains as having a low risk of bias. We considered a study to have a high risk of bias overall if we assessed at least one of the domains as high. We judged a study to have an unclear risk of bias overall if we assessed at least one domain as unclear (and no domain was assessed as high).
Measures of treatment effect
All relevant outcomes for this systematic review were available as continuous data (no dichotomous outcomes or measures). In trials presenting the same outcome with objective and subjective measurements, we gave preference to the objective measurements and included only those in our quantitative analyses.
For standard parallel trials, we entered the mean and standard deviation (SD) as they were reported in the publication. In cases where authors presented an effect estimate as the mean difference (MD) and 95% confidence interval (CI) (i.e. Smith‐Coggins 2006), we converted the CI to a standard error using the formula recommended in chapter 7.7.7.2 of the Cochrane Handbook for Systematic Reviews of Interventions (Higgins 2011), and entered these data as Generic Inverse Variance data (MD and standard error).
For cross‐over trial outcomes, we intended to use the MD and its standard error based on a paired analysis.
We converted time parameters, when necessary. For the outcome total sleep time, we converted into hours those means and variance that were reported in minutes (i.e. Lowden 2004). For the outcome sleep onset latency, we converted into minutes those data reported in hours (i.e. Thorne 2010).
We reported the outcomes of studies with different study designs separately.
Unit of analysis issues
In most studies, the authors reported outcomes relevant to our review as several measurements per night, for example, at midnight, 02:00, 04:00 and 06:00. In those cases where we had several subgroups or more than two different intervention groups to combine and the data were presented separately for each group, we took the average of the measurements. We summarised the mean SDs by pooling according to the formula presented in the Cochrane Handbook for Systematic Reviews of Interventions (table 7.7.a; Higgins 2011).
For cross‐over trials, we intended to use results from paired statistical tests. Often these data were not available and we used the method described in Elbourne 2002 to perform sensitivity analyses assuming correlation coefficients of 0, 0.7, and 0.9. When authors presented analysis of variance (ANOVA) P values we reported these values for comparison with our findings (see Table 4). We transformed 95% CIs into P values using the formula recommended by Altman 2011: P = exp(−0.717 × z − 0.416 × z2), where z = the estimate of effect/the standard error.
| Cross‐over trial | Outcome | Description of ANOVA strategy | ANOVA results | Correlation coefficient (CC) | Estimates of P values by CC (see Unit of analysis issues) |
| Sleepiness on‐shift overall | "A two‐factor repeated measurement ANOVA was used. Factors: 1) treatment; 2) time (of night measurement) P values were corrected for sphericity (using the Huynh‐Feldt coefficient). Significance was defined at P < 0.05." | Period 1 : Time of night measurement × Treatment: (F = 8.76; P < 0.001) Time of night measurement: (F = 40.98; P < 0.001) Period 2 : Time of night measurement × Treatment: (F = 5.124, P < 0.01) Time of night measurement: (F = 9.872; P < 0.001) | 0.9 0.7 0.0 | < 0.0001 < 0.0001 < 0.0001 | |
| Sleepiness on‐shift overall | "Using the paired t‐test, we compared subjective sleepiness between two conditions (with bright light and with normal light). A repeated measure ANOVA showed interaction between independent variables in this study. The level of significance was defined at P < 0.05. (examined treatment effect, carry‐over effect, and period effect)." | The findings for treatment effect, period effect and carry‐over effect of the study population: Treatment effect: t df P value –21.95 89 0.001 | 0.9 0.7 0.0 | < 0.0001 < 0.0001 < 0.0001 | |
| Sleep efficiency (actigraph) | "The data obtained during night work were submitted to ANOVA for repeated measures, with correction for unequal variances according to Huynh and Feldt (Huynh 1976). The two‐way ANOVA included the factors of condition (Bright light/Normal light) and day (15 examined night shifts). A third factor, time of day, was added for variables with several measures during 1 day (for melatonin and KSS). A fourth factor, week (three studied night work weeks), was added to give a more detailed analysis of KSS ratings. Posthoc mean comparisons were carried out with contrasts. KSS ratings during the night shift week (means of 3 weeks): As some workers showed missing data on Fridays, this day was omitted from the analysis. To reflect the many data points, a four‐way analysis of variance including the factors of condition, week (3 weeks), night (night 1–4 of each week) and time of day, were used." | Condition: NS (no P value reported) Cond./Night Interaction: NS | 0.9 0.7 0.0 | < 0.0001 0.02 0.20 | |
| Total sleep time‐main sleep (bed time; final awakening) | Condition: NS (no P value reported) Cond./Night Interaction: NS | 0.9 0.7 0.0 | 0.01 0.14 0.43 | ||
| Total sleep time‐24‐hr sleep | Condition: (P < 0.05) Cond./Night Interaction: NS | 0.9 0.7 0.0 | < 0.0001 0.04 0.24 | ||
| Sleepiness on‐shift KSS (overall) | Sleepiness: "No main effects were obtained except for time of day showing an increase of sleepiness throughout the night shift (F = 36.46; P = 0.0001; df = 3/45). A significant interaction was obtained (Fig. 2) for the interaction of condition, night and time (F = 2.39; P = 0.0365; df = 9/135). Sleepiness was significantly reduced in the bright light condition at 02:00 hours on Tuesday; at 04:00 hours on Monday, Tuesday and Thursday; and at 06:00 hours on Tuesday and Thursday as shown by the posthoc mean comparisons. The reduction of sleepiness in the bright light condition was further emphasised by the significant interaction of condition and time of day (F = 3.07; P = 0.0429; df = 3/45). The interaction of week + light was insignificant." | 0.9 0.7 0.0 | < 0.0001 0.06 0.31 | ||
| Sleepiness on‐shift KSS (postintervention) | 0.9 0.7 0.0 | < 0.0001 0.09 0.35 | |||
| Sleepiness on‐shift – Reaction time – postintervention (03:00 and 04:00 and 05:00 and 06:00) | "For each of the dependent variables, a set of 2 x 2 repeated measures ANOVAs were carried out. In order to control for interindividual variability in baseline performance, scores for all four dependent variables (response speed, M10%RT, lapse frequency and subjective sleepiness) were expressed relative to the baseline test score obtained at 00:00 hours, calculated by subtracting the 00:00 hours’ value from each hourly score. That is, 00:00 hours scores were zeroed and subsequent scores were relative to this point. Relative scores at each hour of shift were then averaged to obtain the mean relative performance across participants. In order to analyse specific time differences in the dependent variables after the nap, parallel ANOVAs were carried out with different levels entered for the time factor (i.e. before nap and 03:00 hours; before nap and 04:00 hours; before nap and 05:00 hours; before nap and 06:00 hours). Before‐nap mean scores were calculated from a combined average of 00:00, 01:00 and 02:00 hours data. As the aim was to compare nap and no‐nap conditions after the nap, the statistics of interest were the nap × time interactions. Significant interactions were observed for response speed at 04:00 and 06:00… and for subjective sleepiness at 03:00 and 04:00. … Participants therefore had faster reaction times, and less subjective sleepiness, after the nap." | Before nap vs 06:00 Nap: P = 0.002 Time: P = 0.011 N x T : P = 0.012 | 0.9 0.7 0.0 | < 0.0001 0.02 0.21 | |
| Sleepiness on‐shift – Subjective sleepiness score – postintervention (03:00 and 04:00 and 05:00 and 06:00) | Before nap vs 06:00 Nap: P = 0.16 Time: P = 0.201 N x T : P = 0.095 | 0.9 0.7 0.0 | < 0.0001 < 0.0001 0.05 |
df: Degrees of Freedom
KSS: Karolinska Sleepiness Scale
M10%RT: Mean of the fastest 10% reaction time
NS: Not Significant
RT: Reaction Time
For studies that employed a cluster‐randomised design and reported sufficient data to be included in a meta‐analysis but did not make an allowance for the design effect, we had intended to calculate the design effect based on the methods described in chapter 16.3.6 of the Cochrane Handbook for Systematic Reviews of Interventions (Higgins 2011). However, due to the absence of any included studies using clustered data, this was not possible.
Dealing with missing data
For field studies, we contacted trial authors to obtain data not found in their reports that were needed either for the assessment of risk of bias or for outcomes relevant to this systematic review. We used all reports of trials in order to obtain missing data, including presentations, if found. We used the methods presented in chapter 7.7.3.3 in the Cochrane Handbook for Systematic Reviews of Interventions to calculate statistics (e.g. SDs or correlation coefficients) that can be calculated from other values (Higgins 2011).
Where possible, we used intention‐to‐treat analyses in randomised trials. We examined reasons for dropouts and missing data when these data were available. We recorded the methods the study authors used for dealing with missing data.
Most authors of the cross‐over trials in our review used ANOVA to analyse their data, and they did not report the standard error of the MD between the intervention and the control group postintervention. In these cases, we calculated the standard error of the MD using the formula in Elbourne 2002: SD = √ (SDi2 + SDc2 – 2 x correlation coefficient (SDi)(SDc)). However, none of the studies reported enough data to calculate a correlation coefficient.
Lacking a given correlation coefficient for a comparable analysis, we estimated the standard errors by assuming varying levels of correlation between the intervention and control groups, based on recommendations made in Elbourne 2002. Using the correlation coefficient 0 to represent no correlation, 0.7 to represent a middle level of correlation, and 0.9 to represent a strong correlation, we presented three possibilities for how the variance might behave in each cross‐over trial (see Sensitivity analysis). In the case of single trial outcomes, we present all three levels of correlation in the forest plots. For our meta‐analyses of cross‐over trials and in our 'Summary of findings' tables, we present results assuming zero correlation between cases and controls.
Assessment of heterogeneity
We assessed clinical homogeneity based on similarities of interventions, populations, shift schedules, exact outcome definitions, outcome timing and follow‐up. Subsequently, we did not combine the interventions light, napping, education or physical exercise. Within the category of light, we considered trials administering both bright light and sunglasses different from those administering bright light alone and did not combine these. For light or goggle interventions we had intended to consider the time of day, duration of light, strength, and wavelengths of light (or similar for goggles). However, due to fewer than expected studies per comparison, we were not able to do this (see Differences between protocol and review). Within the category of napping, we considered a single nap to be different from multiple naps and did not combine such trials (Banks 2015).
We had intended to consider all educational interventions to be similar enough, provided they addressed similar topics (e.g. sleep times with regard to shift, sleep conditions, exercise) and had a similar duration. In addition, we had intended to combine all exercise interventions. However, due to fewer than expected studies per comparison, we were not able to do this (see Differences between protocol and review).
Within a single comparison group, we considered studies to be similar enough to combine if they measured the same outcome variable (e.g. sleepiness on‐shift) at a similar time with regard to the shifts examined. To the extent that it was methodologically advisable, we combined different ways of measuring the same outcome variable. However, this was not always possible, as in the example of the Karolinska and Stanford sleepiness scales (see Methodological diversity and pooling).
For all intervention types, we considered interventions administered during the night shift different from those administered during the day shift or days‐off and did not combine them.
We had intended to give priority in our primary analysis to subjective measures of sleepiness, sleep quality, and sleep length, however, in order to maintain consistency with our partner publication (Liira 2014), we gave priority to objective measures (see Differences between protocol and review).
We had intended to separately analyse studies in healthy shift workers and persons with shiftwork disorder. We had also intended to explore other differences in populations through subgroup analyses. However, due to fewer than expected studies per comparison, we were not able to do this (see Differences between protocol and review).
We tested for statistical heterogeneity by means of the Chi2 test, as implemented in the forest plot in Review Manager 5 software (RevMan 2014). We used a significance level of P < 0.10 to indicate heterogeneity. We quantified the degree of heterogeneity by using the I2 statistic, where an I2 value of 25% to 50% indicates a low degree of heterogeneity, 50% to 75% a moderate degree of heterogeneity, and > 75% a high degree of heterogeneity (Higgins 2011).
Assessment of reporting biases
We made every effort to detect duplicate studies. If multiple articles reported on the same data, we extracted data only once in order to reduce the risk of reporting bias. Location bias was prevented by searching for trials across multiple databases. To prevent language bias, we did not limit for any language.
Data synthesis
We pooled those field studies we judged to be sufficiently clinically homogeneous. For these we conducted meta‐analyses. To allow for statistical heterogeneity, we considered a random‐effects model to be appropriate for meta‐analysis.
To present the overall quality of evidence per outcome for the main findings we used the GRADE Approach, as described in the Cochrane Handbook for Systematic Reviews of Intervention (Higgins 2011), and as implemented in the GRADEPro GDT software (GRADEproGDT). Since all included studies were RCTs, we assumed a high level of quality prior to quality assessment. Downgrading was based on five factors: (1) limitations of study; (2) indirectness of evidence; (3) inconsistency of results; (4) imprecision of results; and (5) publication bias. Thus we rated the evidence for each outcome as either, high, moderate, low, or very low.
Subgroup analysis and investigation of heterogeneity
We had intended to conduct subgroup analyses in four areas: chronotype, intervention variations, measurement variations, and age. However, due to the limited number of studies per comparison and outcome, we were not able to conduct any subgroup analyses.
Sensitivity analysis
In order to assess the impact of missing data on the cross‐over trial results, we estimated, per outcome, three separate versions of the standard error (see Dealing with missing data). We subsequently entered, for single study outcomes, all three standard errors into the forest plots, thus allowing a graphic depiction of how varying (missing) levels of correlation affect the significance of the effect estimate.
We had intended to examine the impact of missing data on effect estimates via sensitivity analysis. The total MD among studies with no or little missing data (i.e. data on loss to follow‐up) would be compared to the total MD among studies with extensive missing data. However, no sensitivity analysis was possible, due to the fact that there were never more than two to three studies per comparison, with the vast majority of comparisons containing only a single study.
Results
Description of studies
Results of the search
Figure 1 shows the PRISMA study flow diagram of included and excluded studies. The electronic database search resulted in a total of 30,202 references. We identified a further 153 studies through checking of reference lists of potentially relevant studies and reviews. After removal of duplicates, a total of 29,092 references remained. Based on a screening of titles and abstracts, we identified 2054 potentially relevant references for which we retrieved full‐text articles. Of these, a total of 72 RCTs met our inclusion criteria for this review (17 field studies and 55 laboratory studies). The 17 field study RCTs consisted of 10 bright light studies, four nap studies, and three studies with "other" types of interventions. Of these 17 field studies, 13 presented statistical data that could be included in our quantitative analysis, four of which we examined in two meta‐analyses.

*Reflects search for both the current review and for the review "Adaptation of shift work schedules for preventing and treating sleepiness and sleep disturbances caused by shift work (028) (Erren 2013)"
Included studies
Bright light
Characteristics of the trials and participants
We included ten RCTs that investigated the effect of bright light alone (Bjorvatn 2007; Karchani 2011; Lowden 2004; Ross 1995; Sadeghniiat‐Haghighi 2011; Tanaka 2011; Boivin 2012; Huang 2013; Tapia 2011; Thorne 2010). Two trials were conducted in Iran (Karchani 2011; Sadeghniiat‐Haghighi 2011), two in Norway (Bjorvatn 2007; Thorne 2010), one in Canada (Boivin 2012), one in the USA (Tapia 2011), one in Japan (Tanaka 2011), one in Sweden (Lowden 2004), one in Taiwan (Huang 2013), and one in Antarctica (Ross 1995).
In total, the trials included 362 review‐relevant randomised participants (range: 4 to 94). The average age of the participants ranged between 21 and 46 years. Four studies explored data from men only (Karchani 2011; Ross 1995; Sadeghniiat‐Haghighi 2011; Thorne 2010) and two studies included only women (Huang 2013; Tanaka 2011). In two studies, 94% of the participants were male (Bjorvatn 2007; Lowden 2004) and in two studies women made up between 53% and 61% of the trialists (Boivin 2012; Tapia 2011).
The health status of the populations differed according to trial, with two trials including only participants with sleep problems (Bjorvatn 2007; Huang 2013), three trials including only participants who were healthy overall (Karchani 2011; Tanaka 2011; Thorne 2010), three trials with no health restrictions (Lowden 2004; Ross 1995; Sadeghniiat‐Haghighi 2011), one with untreated 'sleep disorder‐free' participants (Tapia 2011), and one trial including "drug‐free" participants (Boivin 2012).
Two of the studies explored participants' chronotype (Boivin 2012; Thorne 2010); both trials based on a Horne‐Östberg‐Score. Boivin 2012 reported the chronotype to be comparable between the study groups. However, neither analysis included a chronotype‐based subgroup analysis of our outcomes of interest.
(See also Characteristics of included studies).
Interventions
Bright light was administered via either a light box (Bjorvatn 2007; Huang 2013; Tanaka 2011; Tapia 2011; Thorne 2010), fluorescent ceiling bulbs or tubes in the break rooms (Karchani 2011; Lowden 2004; Sadeghniiat‐Haghighi 2011), or a portable lamp (Boivin 2012). One trial described the light administered as "full‐spectrum white" (Boivin 2012), one trial simply as "white" (Tapia 2011), and one trial as "polychromatic white" (Thorne 2010). One trial described the light simply as "artificial bright light" (Huang 2013). Ross 1995 provided no information as to how the bright light was applied.
Intensity of a single dose of bright light varied between 2500 lux (Lowden 2004; Sadeghniiat‐Haghighi 2011), 2500 to 3000 lux (Karchani 2011; Ross 1995; Thorne 2010), 5444 to 8826 lux (Tanaka 2011), 7000 to 10,000 lux (Huang 2013), and 10,000 lux (Bjorvatn 2007; Tapia 2011). Boivin 2012 did not specify the light's intensity.
Six trials administered single doses of bright light (Bjorvatn 2007; Huang 2013; Ross 1995; Tanaka 2011; Tapia 2011; Thorne 2010), while four others administered more than one dose per shift (Boivin 2012; Karchani 2011; Lowden 2004; Sadeghniiat‐Haghighi 2011). Total time exposed to bright light differed according to each trial, with a median exposure time of 30 minutes (≤ 30 minutes (Bjorvatn 2007; Lowden 2004; Tanaka 2011) and > 30 minutes (Boivin 2012; Huang 2013; Karchani 2011; Ross 1995; Sadeghniiat‐Haghighi 2011; Tapia 2011; Thorne 2010).
In six trials, bright light was administered during the night shift only (Boivin 2012; Huang 2013; Karchani 2011; Lowden 2004; Sadeghniiat‐Haghighi 2011; Tapia 2011), and in three trials only during the day shift (Ross 1995; Tanaka 2011; Thorne 2010). A single trial administered bright light both during the night shift and during the day shift (Bjorvatn 2007). When bright light was given during the night shift only, the timing ranged from every two hours in Karchani 2011 to sometime between midnight and 06:00 in Bjorvatn 2007 and Lowden 2004 and intermittently in Boivin 2012. When bright light was administered during the day shift, it was either between 07:30 and 08:00 (Tanaka 2011), or over midday (Bjorvatn 2007; Ross 1995).
In four studies sunglasses after the night shift and prior to their day‐sleep were used (Boivin 2012; Huang 2013; Tapia 2011; Thorne 2010), with the aim of reducing or preventing chronobiologically relevant light exposure. The types of sunglasses were variously described as "orange‐tinted goggles" (Boivin 2012), "dark sunglasses (UV‐protection)" (Huang 2013), “dark goggles” (Tapia 2011), and "specialised light blocking sunglasses" (Thorne 2010). The sunglasses (or goggles) were worn from the end of shift until the beginning of sleep (Boivin 2012; Huang 2013), or during the drive home (Tapia 2011). We considered the effects of all these types of sunglasses as equally effective. In Thorne 2010, the goggles were used from waking time until the start of the bright light intervention.
In three trials, the comparison group was the same: workers exposed on the job to normal light, in which normal light was defined as 300 lux (Karchani 2011; Lowden 2004;Sadeghniiat‐Haghighi 2011). Of the three remaining trials, one defined normal light as between 530 and 648 lux (Tanaka 2011), one used red light as the control (Ross 1995), and one used normal light (300 lux) plus a placebo capsule (as part of a three‐arm study that included melatonin (Bjorvatn 2007)). For those studies investigating the effect of sunglasses, control groups were made up primarily of study participants who were neither exposed to bright light nor asked to wear glasses (Boivin 2012; Tapia 2011; Thorne 2010). In one trial, however, control participants were not exposed to bright light, but were asked to wear glasses "after work and before sleep" (Huang 2013).
Trial design and setting
Seven RCTs used a controlled cross‐over design (Bjorvatn 2007; Karchani 2011; Lowden 2004; Sadeghniiat‐Haghighi 2011; Tanaka 2011; Tapia 2011; Thorne 2010) with the remaining study using a standard parallel design (Boivin 2012; Huang 2013; Ross 1995).
Intervention duration ranged widely between a single night in Sadeghniiat‐Haghighi 2011 and four weeks (Lowden 2004; Tanaka 2011). The cross‐over studies employed washout periods ranging from four days in Sadeghniiat‐Haghighi 2011 to three months in Lowden 2004.
Five trials were conducted in industrial settings: two on an oil rig (Bjorvatn 2007; Thorne 2010), a metallurgic production plant (Karchani 2011), a truck production plant (Lowden 2004), and a ceramic factory (Sadeghniiat‐Haghighi 2011). One trial was conducted in a hospital setting (Huang 2013; Tanaka 2011; Tapia 2011), one in a police workforce (Boivin 2012), and a further trial in a geophysical research unit (Ross 1995). All trials were single‐centre studies. Only two studies reported a power analysis (Huang 2013; Tanaka 2011).
Outcomes
Eight trials reported on the effects of bright light on sleepiness on‐shift or fatigue on‐shift (Bjorvatn 2007; Boivin 2012; Karchani 2011; Lowden 2004; Ross 1995; Sadeghniiat‐Haghighi 2011; Tanaka 2011; Tapia 2011); objectively, sleepiness was measured via reaction time test using a Palm handheld computer (Bjorvatn 2007), actigraphy (Tapia 2011), or the Psychomotor Vigilance Task (PVT) test (Boivin 2012; Tanaka 2011). Data on sleepiness and fatigue on‐shift were collected subjectively via sleepiness scales, including the Karolinska Sleepiness Scale (KSS) (Bjorvatn 2007; Lowden 2004; Tanaka 2011), the Stanford Sleepiness Scale (SSS) (Karchani 2011; Sadeghniiat‐Haghighi 2011), the Epworth Sleepiness Scale (ESS) (Tapia 2011), the Accumulated Time with Sleepiness (ATS) scale (Bjorvatn 2007), a sleep diary (Lowden 2004), and a visual analogue scale (VAS) (Boivin 2012; Ross 1995).
Sleep quality and sleep length were assessed objectively using actigraphy (Bjorvatn 2007; Lowden 2004; Tapia 2011; Thorne 2010). Subjective measurements of sleep quality and length were obtained using sleep diaries (Bjorvatn 2007; Lowden 2004; Tanaka 2011;Tapia 2011; Thorne 2010 ), sleep logs and sleep quality scales (Ross 1995), insomnia severity index (Huang 2013) and a VAS (Tanaka 2011).
Nap
Characteristics of the trials and participants
We included four trials that investigated the effect of napping on our outcomes of interest (Howard 2010; Oriyama 2014; Smith 2007; Smith‐Coggins 2006). Two studies were conducted in Australia (Howard 2010; Smith 2007), one in Japan (Oriyama 2014), and one in the USA (Smith‐Coggins 2006).
In total, the trials included 81 review‐relevant participants (range: 9 to 49). The average age of the trialists ranged between 23 and 45 years. Women made up 66% to 100% of the participants.
Trials were made up of participants who were either 'sleep disorder‐free' (Howard 2010), or for which no health‐based exclusion criteria were reported (Oriyama 2014; Smith 2007; Smith‐Coggins 2006).
One study explored participants’ preference for morning or evening work (Smith‐Coggins 2006), based on the Owl and Lark Questionnaire, and reported finding no preference.
(See also Characteristics of included studies).
Interventions
Three trials explored the effect of a single nap opportunity during the night shift (Howard 2010; Smith 2007; Smith‐Coggins 2006). The fourth study explored the effect of two naps within one night shift period (Oriyama 2014).
The single nap group offered either a 30‐minute (Howard 2010; Smith 2007), or a 40‐minute sleep opportunity (Smith‐Coggins 2006). The two‐nap study allowed for two 15‐minute nap periods (Oriyama 2014). The timing of the nap opportunities varied, with anywhere from a 02:00 to a 04:30 starting time.
The control group for all studies was no‐nap. However, only one study explicitly reported that the non‐treatment group was expected to work while the treatment group was napping (Smith‐Coggins 2006).
Trial design and setting
Two trials used a parallel design (Oriyama 2014; Smith‐Coggins 2006), and two a cross‐over design (Howard 2010; Smith 2007).
In all four trials, the intervention lasted only one night. The cross‐over trials reported washout periods between “at least” one and “at least” two weeks (Howard 2010).
All four studies were conducted in a medical workplace or research setting. The studies investigated nurses (Oriyama 2014; Smith 2007), nurses and physicians (Smith‐Coggins 2006), or persons working in a sleep disorder research unit (Howard 2010). Three studies were conducted in a single study location (Howard 2010; Smith 2007; Smith‐Coggins 2006), and one study was a multicentre study (Oriyama 2014). None of the studies presented a power calculation, although one study discussed the possibility that it “may have been inadequately powered to detect small differences” (Howard 2010), while another described their statistical power as being limited (Smith 2007).
Outcomes
All four trials examined sleepiness on‐shift.
Sleepiness was measured objectively via the PVT test (Howard 2010; Smith 2007; Smith‐Coggins 2006), and catheter simulation (Smith‐Coggins 2006). Subjectively it was measured via KSS (Howard 2010; Smith 2007; Smith‐Coggins 2006), VAS (Oriyama 2014), the Profile of Mood States (POMS), and a sleep diary (Smith‐Coggins 2006). Smith 2007 averaged together results from a VAS and a pictorial sleepiness scale score, arriving at an overall “subjective sleepiness score”.
One trial measured sleep length off‐shift objectively via actigraphy (Smith‐Coggins 2006). None of the nap studies assessed sleep quality off‐shift.
Other person‐directed interventions
Characteristics of the trials and participants
We included three trials that explored neither light nor nap, but rather physical exercise intervention programmes, with or without sleep education (Atlantis 2006; Harma 1988), and a fatigue countermeasure programme (Smith‐Coggins 1997). The studies were conducted in Australia (Atlantis 2006), Finland (Harma 1988), and the USA (Smith‐Coggins 1997).
The trials included a total of 113 review‐relevant participants (range: 6 to 75). The mean age was between 31 and 35 years. One trial included only men (Smith‐Coggins 1997), one only women (Harma 1988), and one failed to specify gender (Atlantis 2006). The health status of the participants ranged from 'overall healthy' in Atlantis 2006 to no restrictions on health status (Harma 1988; Smith‐Coggins 1997).
None of the studies reported on chronotype.
(See also Characteristics of included studies).
Interventions
One trial investigated an aerobic programme and weight‐training combined with an education/sleep hygiene programme (Atlantis 2006). The aerobic exercise and the whole body weight‐training were done over 24 weeks, at least three times per week for at least 20 minutes.
Another trial explored the effect of a physical exercise programme (Harma 1988), based on two to six training sessions per week, over four months.
The third trial offered a three‐component fatigue countermeasure programme that included education on different aspects of sleep (a two‐hour programme), improved shift schedule design, and strategies to maintain alertness and performance during work (Smith‐Coggins 1997). The follow‐up period lasted for one month.
Control groups included persons on a waiting list (Atlantis 2006), individuals not participating in a physical exercise programme (Harma 1988), and a jet lag diet as placebo (Smith‐Coggins 1997).
Trial design and setting
Two trials used a parallel design (Atlantis 2006; Harma 1988) and Smith‐Coggins 1997 used a cross‐over design with a one month washout period.
Two studies took place in a hospital setting (Harma 1988; Smith‐Coggins 1997) and Atlantis 2006 was based in a casino. Atlantis 2006 conducted a power calculation, while Smith‐Coggins 1997 acknowledged that their study may have been underpowered to detect a difference. All were single‐centre trials.
Outcomes
Harma 1988 assessed subjective sleep quality and sleep length off‐shift using a questionnaire. Atlantis 2006 assessed subjective sleep quality off‐shift using the Pittsburgh Sleep Quality Index (PSQI). Smith‐Coggins 1997 assessed subjective sleep quality and sleep length off‐shift using a diary, objective sleep quality and sleep length using polysomnography, and objective sleepiness on‐shift via the PVT test.
Excluded studies
Of the 2054 full‐texts retrieved, we excluded 923 because they did not examine the effectiveness of person‐directed interventions. We excluded the remaining 1059 full‐text articles that did examine person‐directed interventions either because they used an uncontrolled design or were reviews/correspondence (n = 794), they did not measure on‐shift sleepiness or off‐shift sleep length/quality (n = 168), their participants were not actual shift workers (n = 62), or for reasons included under either the Characteristics of excluded studies, the Characteristics of studies awaiting classification, or the Characteristics of ongoing studies table (n = 35).
Risk of bias in included studies
The 'Risk of bias' for each included trial is presented in the Characteristics of included studies tables. These assessments are further presented in Figure 2 and Figure 3.

Risk of bias graph: review authors' judgements about each risk of bias item presented as percentages across all included studies; The "Applicability of design" category assesses whether, in cross‐over designs, a period effect impacted the results (based on an interaction test). If no interaction test was reported, the risk of bias was considered unclear. In cases where the trial had a parallel design, the risk of bias was judged to be low.

Risk of bias summary: review authors' judgements about each risk of bias item for each included study; The "Applicability of design" category assesses whether, in cross‐over designs, a period effect impacted the results (based on an interaction test). If study authors reported no interaction test, we considered the risk of bias to be unclear. In cases where the trial had a parallel design, we considered the risk of bias to be low.
Of the 17 included RCTs, we assessed seven as having an unclear risk of bias (Atlantis 2006; Bjorvatn 2007; Harma 1988; Howard 2010; Oriyama 2014; Smith 2007; Smith‐Coggins 2006).
We assessed the remaining ten trials as having a high risk of bias, due to either a lack of blinding of participants (Huang 2013; Karchani 2011; Lowden 2004; Sadeghniiat‐Haghighi 2011; Tanaka 2011; Tapia 2011; Thorne 2010), or to a non‐appropriate study design or analysis (Boivin 2012; Ross 1995; Smith‐Coggins 1997). We judged none of the studies to have a low risk of bias.
Allocation
Eight studies reported (either in their text or through email communication) the details of their sequence generation process and we judged these studies to be at low risk of bias for random sequence generation (Atlantis 2006; Bjorvatn 2007; Harma 1988; Huang 2013; Lowden 2004; Smith 2007; Smith‐Coggins 2006; Tanaka 2011). We judged all other studies to be at unclear risk of bias for this domain.
Allocation concealment was sufficiently described in four trials and we judged these trials to be at low risk of bias for this domain (Atlantis 2006; Bjorvatn 2007; Smith 2007; Smith‐Coggins 2006); we judged all other trials to be at unclear risk of bias.
Blinding
Only two trials described in detail how participants were blinded to the intervention and we judged these trials to be at low risk of bias for blinding of participants and personnel (Atlantis 2006; Smith‐Coggins 1997). Eight trials provided no information on this aspect of study design and we judged them to be at unclear risk of bias (Bjorvatn 2007; Boivin 2012; Harma 1988; Howard 2010; Oriyama 2014; Ross 1995; Smith 2007; Smith‐Coggins 2006). We judged the remaining eight studies to be at high risk of bias as they either implicitly or explicitly reported that participant blinding was not attempted (Huang 2013; Karchani 2011; Lowden 2004; Sadeghniiat‐Haghighi 2011; Tanaka 2011; Tapia 2011; Thorne 2010) or that it was not possible (Smith 2007).
A lack of blinding of participants was the most common reason we judged a trial as having a high risk of bias. For the nap intervention cross‐over trials we chose to assess this domain as unclear (Howard 2010; Smith 2007), since blinding under such conditions is not possible.
Blinding of outcome assessors was reported in only three trials and we judged these trials to be at low risk of bias (Smith‐Coggins 1997; Tanaka 2011; Tapia 2011); we judged all others to be at unclear risk of bias.
Incomplete outcome data
Eight trials included sufficient detail to warrant a low risk of bias for incomplete outcome data (Harma 1988; Howard 2010; Huang 2013; Karchani 2011; Ross 1995; Sadeghniiat‐Haghighi 2011; Smith‐Coggins 2006; Tanaka 2011). We judged all remaining trials to have an unclear risk of bias in this domain.
Selective reporting
We judged the majority of trials (n = 15) to have a low risk of bias regarding selective reporting. Only two trials alluded to outcomes in their texts that were not included in their final analyses (Oriyama 2014; Tanaka 2011). However, it was unclear how these omissions may have impacted the results.
Outcome reliably or objectively measured
Two trials measured outcomes using tools for which no information on validation was reported and we judged these trials to be at unclear risk of bias (Harma 1988; Ross 1995). We considered all other trials to have used reliable tools to measure their outcomes and judged them to be at low risk of bias.
Other potential sources of bias
Applicability of study design
Of the 17 trials included, 10 utilised a cross‐over design (Bjorvatn 2007; Howard 2010; Karchani 2011; Lowden 2004; Sadeghniiat‐Haghighi 2011; Smith 2007; Smith‐Coggins 1997; Tanaka 2011; Tapia 2011; Thorne 2010).
In four of the cross‐over trials (Bjorvatn 2007; Howard 2010; Lowden 2004; Thorne 2010), the washout period ranged from two weeks to three months. For the most part, we deemed this sufficiently long, since physiologically the length of time needed to wash out the effects of bright light exposure or naps is likely to be short. However, in one trial involving a fatigue countermeasure programme (Smith‐Coggins 1997), we judged the one month washout period likely insufficient for eliminating the carry‐over effects of learned strategies to combat fatigue and judged this study to be at high risk of bias. Two cross‐over trials (Karchani 2011; Tanaka 2011), despite having relatively short washout periods (six days and one week, respectively), conducted tests for interaction between order and intervention and were able to demonstrate that carry‐over effects did not impact effect estimates; we judged both studies to be at low risk of bias.
Three cross‐over trials also had relatively short washout periods (four days to one week) (Sadeghniiat‐Haghighi 2011; Smith 2007; Tapia 2011), but did not report any possible interaction between order and intervention. It remains unclear how the short washout periods may have affected their results.
Only one cross‐over trial took advantage of their within‐person design and generated, from a paired analysis, a risk estimate that included an estimate of variance (Tanaka 2011); we judged this study to be at low risk of bias. Although Karchani 2011 used a paired analysis to estimate overall treatment effect, they did not present paired analysis data that would have allowed us to estimate variance of the risk estimate (See Dealing with missing data).
Of the seven parallel design trials, two included two participants in both the intervention and control groups (essentially partial cross‐over) (Boivin 2012; Ross 1995). Requests for results based solely on the parallel design participants went unanswered; we judged both studies to be at high risk of bias.
Effects of interventions
See: Summary of findings for the main comparison Light interventions (1/7): Bright light at night versus normal light (300 lux); Summary of findings 2 Light interventions (2/7): Bright light alone at night versus normal light (300 lux) plus placebo capsule; Summary of findings 3 Light intervention (3/7): Bright light during day versus normal light (530 to 648 lux); Summary of findings 4 Light interventions (4/7): Bright light during day versus dim red light; Summary of findings 5 Light interventions (5/7): Bright light alone during day versus normal light (300 lux) plus placebo capsule; Summary of findings 6 Light interventions (6/7): Bright light at night plus glasses versus normal light (unclear lux) and no glasses; Summary of findings 7 Light interventions (7/7): Bright light plus glasses during day versus normal light and no glasses; Summary of findings 8 Nap interventions (1/2): Nap at night (single nap opportunity) versus no‐nap; Summary of findings 9 Nap intervention (2/2): Nap at night (two‐nap opportunities) versus no‐nap; Summary of findings 10 Other interventions (1/1): Physical exercise and sleep hygiene education versus wait‐list for sleepiness and sleep disturbances caused by shift work
See: summary of findings Table for the main comparison; summary of findings Table 2; summary of findings Table 3; summary of findings Table 4; summary of findings Table 5; summary of findings Table 6; summary of findings Table 7; summary of findings Table 8; summary of findings Table 9; summary of findings Table 10.
1 Bright light administered during the night shift versus normal light (300 lux)
1.1 Sleepiness during the night shift
1.1.1 Sleepiness during the night shift, overall
Three trials examined the effects of bright light administered during the night shift on on‐shift sleepiness (Karchani 2011; Lowden 2004; Sadeghniiat‐Haghighi 2011).
Two studies used the Stanford Sleepiness Scale (SSS = a 7‐point verbal scale from 1: 'feeling active, vital, alert, or wide awake' to 7: 'no longer fighting sleep, sleep onset soon, having dream‐like thoughts') to explore sleepiness (Karchani 2011; Sadeghniiat‐Haghighi 2011). In both trials, the bright light group was less sleepy than the control group (1.19 and 0.67 fewer degrees of sleepiness, respectively); a meta‐analysis showed that the bright light group was 1.03 scale points less sleepy than the control group, even when 0 correlation was assumed (mean difference (MD) ‐0.83 scale points, 95% confidence interval (CI) ‐1.31 to ‐0.36; 2 trials, 184 participants, very low quality evidence; Analysis 1.1; summary of findings Table for the main comparison). This analysis was based on a single night of bright light intervention and no assessment of chronotype.
Lowden 2004 also examined sleepiness, but using the Karolinska Sleepiness Scale (KSS = a 9‐point scale with verbal anchors ranging from 1: 'extremely alert' to 9: 'very sleepy, great effort to keep awake, fighting sleep'). The bright light group was less sleepy than the control group, but significance depended on the correlation coefficient (CC) (MD ‐0.26 scale points, 95% CI ‐0.42 to ‐0.10 (CC = 0.9); ‐0.53 to 0.01 (CC = 0.7); ‐0.81 to 0.29 (CC = 0); 1 trial, 16 participants, low quality evidence; Analysis 1.2; summary of findings Table for the main comparison). This analysis is based on four weeks of bright light intervention.
1.1.2 Sleepiness during the night shift, postintervention measurements only
Two trials compared on‐shift sleepiness during night shift and reported hourly measurements allowing for a postintervention‐only analysis (Karchani 2011; Lowden 2004). One study used the SSS to measure sleepiness (Karchani 2011). Here, the bright light group was less sleepy postintervention compared to the control group, and the finding remained statistically significant no matter the CC (MD ‐2.21 scale points, 95% CI ‐2.27 to ‐2.15 (CC = 0.9); ‐2.33 to ‐2.09 (CC = 0.7); ‐2.43 to ‐1.99 (CC = 0); 1 trial, 90 participants, low quality evidence; Analysis 1.3; summary of findings Table for the main comparison). This analysis was based on two nights of bright light intervention.
The other study measured sleepiness using the KSS (Lowden 2004). These results showed that the bright light group was also less sleepy postintervention compared to the control group, but that the statistical significance of the finding depended on the CC (MD ‐0.25 scale points, 95% CI ‐0.43 to ‐0.07 (CC = 0.9); ‐0.54 to 0.04 (CC = 0.7); ‐0.76 to 0.26 (CC = 0); 1 trial, 16 participants, low quality evidence; Analysis 1.4; summary of findings Table for the main comparison).
1.2 Sleep quality and sleep length after the night shift
1.2.1 Total sleep time, next day
One trial compared the effect of bright light at night on total sleep time the next day, separately for the main sleep period and for the 24‐hour period following night shift (Lowden 2004). The bright light group slept longer than the control group during the main sleep period, but the difference was statistically significant only when a very high correlation was assumed (MD 0.25 hours, 95% CI: 0.05, 0.45 (CC = 0.9); ‐0.08, 0.58 (CC = 0.7); ‐0.36, 0.86 (CC = 0); 1 trial, 15 participants, low quality evidence; Analysis 1.5; summary of findings Table for the main comparison). When totaling the sleep time from regular sleep and naps over the 24‐hour period following night shift, the bright light group slept longer than the control group. However, statistical significance depended on the level of the assumed correlation (MD 0.63 hours, 95% CI 0.24 to 1.02 (CC = 0.9); 0.02 to 1.24 (CC = 0.7); ‐0.43 to 1.69 (CC = 0); 1 trial, 14 participants, low quality evidence; Analysis 1.5; summary of findings Table for the main comparison).
1.2.2 Sleep efficiency, next day
One trial compared the effect of bright light at night on sleep efficiency the next day (Lowden 2004), using actigraphy‐based data (sleep efficiency = ratio of amount of sleep from bedtime to final awakening/total time in bed). Objectively measured, the bright light group slept more efficiently than the control group, however, the level of significance varied depending upon the assumed extent of correlation between the intervention and control measurements (MD 0.90%, 95% CI 0.47 to 1.33 (CC = 0.9); 0.14 to 1.66 (CC = 0.7); ‐0.49 to 2.29 (CC = 0); 1 trial, 15 participants, low quality evidence; Analysis 1.6; summary of findings Table for the main comparison). The study authors themselves reported no significance, possibly suggesting that their analysis was based on a very low CC.
2 Bright light alone administered during the night shift versus normal light (300 lux) plus placebo capsule
2.1 Sleepiness during the night shift
2.1.1 Sleepiness during the night shift, overall
One study compared the effect of bright light on sleepiness during the night shift to normal light plus the administration of a placebo capsule (Bjorvatn 2007). Results from a 5‐minute reaction time test showed that the bright light group reacted more quickly than the control group (which may suggest less sleepiness), but the results were not statistically significant (MD ‐14.61 milliseconds, 95% CI ‐39.05 to 9.83 (CC = 0.9); ‐47.79 to 18.57 (CC = 0.7); ‐68.10 to 38.88 (CC = 0); 1 trial, 14 participants, very low quality evidence; Analysis 2.1; summary of findings Table 2).
2.2 Sleep quality and sleep length after the night shift
2.2.1 Total sleep time, next day
One study compared the effect of bright light at night on total sleep time the next day to normal light plus the administration of a placebo capsule (Bjorvatn 2007). These Actiwatch data showed that the bright light group slept longer than the control group, but statistical significance was reached only when very high correlation was assumed (MD 0.26 hours, 95% CI 0.02 to 0.50 (CC = 0.9); ‐0.15 to 0.67 (CC = 0.7); ‐0.47 to 0.99 (CC = 0); 1 trial, 15 participants, very low quality evidence; Analysis 2.2; summary of findings Table 2).
2.2.2 Sleep onset latency, next day
One study compared the effect of bright light at night on sleep onset latency the next day to normal light plus the administration of a placebo capsule (Bjorvatn 2007). These Actiwatch data showed that bright light had no effect on sleep onset latency and that for no assumed level of correlation was statistical significance reached (MD 0 minutes, 95% CI ‐1.88 to 1.88 (CC = 0.9); ‐2.90 to 2.90 (CC = 0.7); ‐5.08 to 5.08 (CC = 0); 1 trial, 15 participants, very low quality evidence; Analysis 2.3; summary of findings Table 2).
2.2.3 Sleep efficiency, next day
One study compared the effect of bright light at night on sleep efficiency the next day to normal light plus the administration of a placebo capsule (Bjorvatn 2007). These Actiwatch data showed that the bright light group slept more efficiently than the control group, however statistical significance depended on the CC (MD 2%, 95% CI 0.02 to 3.98 (CC = 0.9); ‐1.37 to 5.37 (CC = 0.7); ‐4.10 to 8.10 (CC = 0); 1 trial, 15 participants, very low quality evidence; Analysis 2.4; summary of findings Table 2).
3 Bright light administered at the beginning of the day shift versus normal light (530 to 648 lux)
3.1 Sleepiness during the day shift
One study compared the effect of bright light administered in the mornings before day shift with normal light on sleepiness on‐shift. Based on the KSS, the bright light group was statistically significantly less sleepy than the control group, at both 10:00 (MD ‐0.55 scale points, 95% CI ‐0.90 to ‐0.20) and at 14:00 (MD ‐0.35 scale points, 95% CI ‐0.72 to ‐0.02) (1 trial, 61 participants, low quality evidence; Analysis 3.1; summary of findings Table 3).
3.2 Sleep quality and sleep length after the day shift
The same study compared the effect of bright light administered in the mornings before day shift with normal light on sleep quality the next night (Tanaka 2011). Based on data from a visual analogue scale (VAS: from 0 = unable to sleep at all, to 10 = slept very well) the bright light group slept better the next night than did the control group, and the difference was statistically significant (MD 0.37 scale points, 95% CI 0.04 to 0.70; 1 trial, 61 participants, low quality evidence; Analysis 3.2; summary of findings Table 3).
4 Bright light administered during the day shift versus dim red light
4.1 Sleep quality and sleep length after the day shift
4.1.1 Total sleep time, next night
One study compared the administration of bright light during the day shift compared to dim red light on the effects of total sleep time measured via sleep log (Ross 1995). They found that the bright light group slept longer than the control group, but this difference was not statistically significant (MD 0.10 hours, 95% CI ‐1.09 to 1.29; 1 trial, 16 participants, low quality evidence; Analysis 4.1; summary of findings Table 4).
4.1.2 Sleep onset latency, next night
The same study compared the administration of bright light during the day shift compared to dim red light on the effects of sleep onset latency measured via sleep log (Ross 1995). They found that the bright light group fell asleep more quickly than the red light group, but the difference was not statistically significant (MD ‐2.60 minutes, 95% CI ‐10.72 to 5.52; 1 trial, 16 participants, low quality evidence; Analysis 4.2; summary of findings Table 4).
5 Bright light alone administered during the day shift versus normal light (300 lux) plus placebo capsule
5.1 Sleepiness during the day shift
5.1.1 Sleepiness during the day shift, over entire day
Bjorvatn 2007 also compared the effect of bright light during the day shift to normal light plus the administration of a placebo capsule on sleepiness during the day shift. Results from a 5‐minute reaction time test showed that the bright light group was slightly sleepier than the control group, but statistical significance was reached only when very high correlation was assumed (MD 14.05 milliseconds, 95% CI 0.57 to 27.53 (CC = 0.9); ‐4.94 to 33.04 (CC = 0.7); ‐17.37 to 45.47 (CC = 0); 1 trial, 12 participants, very low quality evidence; Analysis 5.1; summary of findings Table 5).
5.2 Sleep quality and sleep length after the day shift
5.2.1 Total sleep time, next night
The effect of bright light during the day shift on total sleep time the next night compared to normal light plus the administration of a placebo capsule was assessed as well (Bjorvatn 2007). These Actiwatch data showed that the bright light group slept longer than the control group, but statistical significance was reached only when very high correlation was assumed (MD 0.32 hours, 95% CI 0.08 to 0.56 (CC = 0.9); ‐0.05 to 0.69 (CC = 0.7); ‐0.35 to 0.99 (CC = 0); 1 trial, 13 participants, very low quality evidence; Analysis 5.2; summary of findings Table 5).
5.2.2 Sleep onset latency, next night
The same study compared the effect of bright light during the day shift to normal light plus the administration of a placebo capsule on sleep onset latency the next night (Bjorvatn 2007). These Actiwatch data found that the bright light group took one minute longer to fall asleep, but the results was not statistically significant (MD 1 minute, 95% CI ‐1.25 to 3.25 (CC = 0.9); ‐2.25 to 4.25 (CC = 0.7); ‐4.47 to 6.47 (CC = 0); 1 trial, 13 participants, very low quality evidence; Analysis 5.3; summary of findings Table 5).
5.2.3 Sleep efficiency, next night
One study compared the effect of bright light during the day shift to normal light plus the administration of a placebo capsule on sleep efficiency the next night (Bjorvatn 2007). These Actiwatch data found that the bright light group slept more efficiently than the control group, but findings were not statistically significant (MD 2%, 95% CI ‐0.47 to 4.47 (CC = 0.9); ‐2.04 to 6.04 (CC = 0.7); ‐5.19 to 9.19 (CC = 0); 1 trial, 13 participants, very low quality evidence; Analysis 5.4; summary of findings Table 5).
6 Bright light administered during the night shift plus glasses at dawn versus normal light (unclear lux) and no glasses
6.1 Sleepiness during the night shift, overall
One study examined the effect of bright light at night plus sunglasses at dawn compared to normal light and no sunglasses on sleepiness on‐shift (Boivin 2012). Based on a Psychomotor Vigilance Task (PVT) ‐Median Reaction Time test, the authors found the bright light plus sunglasses group was slightly sleepier than the control group, but the difference was not statistically significant (MD 0.11 milliseconds, 95% CI ‐20.83 to 21.05; 1 trial, 17 participants, very low quality evidence; Analysis 6.1; summary of findings Table 6). This analysis was based on seven nights of bright light intervention.
An additional study assessing sleepiness on‐shift between a bright light at night plus sunglasses group and a normal light and no glasses group found no statistically significant difference (for either the Epworth Sleepiness Scale (ESS) or VAS) (Tapia 2011). However, significant sleepiness was reported not to have been present at baseline (ESS 4.2 ± 1.9, VAS 26.3 ± 21.7 mm). The authors did not present detailed statistical data and a request for more precise data went unanswered. We did not include this trial in any statistical analyses.
One study looked at the same intervention (bright light at night and sunglasses), but included a control group that also wore sunglasses (Huang 2013). As we were unable to obtain data for the subgroup of night shift workers alone, we lacked sufficient data to draw any conclusions about the effect of the intervention. We did not include this trial in any statistical analyses.
7 Bright light plus glasses administered during the day versus normal light and no glasses
7.1 Sleep quality and sleep length, next night following off‐duty bright light intervention
7.1.1 Total sleep time, next night
Thorne 2010 compared bright light during the day plus sunglasses with normal light and no sunglasses on total sleep time the next night. The actigraphic data showed that the bright light plus sunglasses group slept longer than the control group, but statistical significance depended on the assumed CC (MD 0.32 hours, 95% CI 0.08 to 0.56 (CC = 0.9); ‐0.07 to 0.71 (CC = 0.7); ‐0.39 to 1.03 (CC = 0); 1 trial, 3 participants, low quality evidence; Analysis 7.1; summary of findings Table 7).
7.1.2 Sleep onset latency, next night
Thorne 2010 also compared bright light during the day plus sunglasses with normal light and no sunglasses on sleep onset latency the next night. These actigraphic data found that the bright light group lay awake longer than the control group, but the findings did not reach statistical significance (MD 2.4 minutes, 95% CI ‐9.01 to 13.81 (CC = 0.9); ‐10.03 to 14.83 (CC = 0.7); ‐13.08 to 17.88 (CC = 0); 1 trial, 3 participants, low quality evidence; Analysis 7.2; summary of findings Table 7).
7.1.3 Sleep efficiency, next night
One study compared bright light during the day plus sunglasses with normal light and no sunglasses on sleep efficiency the next night (Thorne 2010). Actigraphy showed that the bright light plus sunglasses group slept more efficiently than the control group, but that the statistical significance depended upon the assumed CC (MD 6.59%, 95% CI 2.69 to 10.49 (CC = 0.9); 0.40 to 12.78 (CC = 0.7); ‐4.35 to 17.53 (CC = 0); 1 trial, 3 participants, low quality evidence; Analysis 7.3; summary of findings Table 7).
8 Nap during the night shift (single nap opportunity) versus no‐nap
8.1 Sleepiness during the night shift
8.1.1 Sleepiness during the night shift, postintervention measurement only
Two studies used PVT test data to compare the effect of a single nap opportunity during the night shift on sleepiness on‐shift. One trial found that the nap group was slightly sleepier, while the other trial found that the no‐nap group was sleepier. When we combined these trials for a meta‐analysis, the nap group was less sleepy, but the results were not statistically significant (MD ‐11.87 milliseconds, 95% CI ‐31.94 to 8.20; 2 trials, 16 participants, very low quality evidence; Howard 2010; Smith 2007; Analysis 8.1; summary of findings Table 8). Neither trial assessed chronotype.
In an assessment of the same outcome, two studies of differing study designs used KSS data to examine a single nap opportunity on sleepiness on‐shift (Howard 2010; Smith‐Coggins 2006). The cross‐over designed study found that the nap group was sleepier than the no‐nap group (Howard 2010), but not statistically significantly (MD 0.13 scale points, 95% CI ‐0.40 to 0.66 (CC = 0.9); ‐0.75 to 1.01 (CC = 0.7); ‐1.46 to 1.72 (CC = 0); 1 trial, 8 participants, low quality evidence; Analysis 8.2; summary of findings Table 8). The parallel designed study on the other hand (Smith‐Coggins 2006), found the nap group to be less sleepy than the no‐nap group, and the findings were statistically significant (MD ‐1.12 scale points, 95% CI ‐1.83 to ‐0.41; 1 trial, 49 participants, low quality evidence; Analysis 8.2; summary of findings Table 8).
The same two studies compared the effect of a single nap opportunity during the night shift on sleepiness on‐shift using the PVT test parameter's slowest 10% reciprocal reaction time (Howard 2010; Smith‐Coggins 2006). Both trials found the nap group to be less sleepy than the no‐nap group, but neither finding was statistically significant (MD 0.19 milliseconds, 95% CI ‐0.28 to 0.66 (CC = 0.9); ‐0.40 to 0.78 (CC = 0.7); ‐0.67 to 1.05 (CC = 0); 1 trial, 7 participants, very low quality evidence; Howard 2010; Analysis 8.3; summary of findings Table 8) and MD 0.32 milliseconds, 95% CI ‐0.21 to 0.85; 1 trial, 49 participants, very low quality evidence; Smith‐Coggins 2006; Analysis 8.3; summary of findings Table 8).
Smith 2007 compared the effect of a single nap opportunity during the night shift on sleepiness on‐shift using a subjective sleepiness scale (in which a lower score denoted less sleepiness and a higher score more sleepiness (out of 100)). The nap group was statistically significantly less sleepy than the no‐nap group, irrespective of which CC was used (MD ‐16.14 scale points, 95% CI ‐22.10 to ‐10.18 (CC = 0.9); ‐25.04 to ‐7.24 (CC = 0.7); ‐31.37 to ‐0.91 (CC = 0); 1 trial, 9 participants, very low quality evidence; Analysis 8.4; summary of findings Table 8).
9 Naps during the night shift (two‐nap opportunities) versus no‐naps
9.1 Sleepiness during the night shift
9.1.1 Sleepiness during the night shift, postintervention measurement only
Oriyama 2014 compared the effect of two‐nap opportunities in one night on sleepiness on‐shift.
Data from a VAS showed that the nap group was actually sleepier than the no‐nap group, but that the difference was not statistically significant (MD 2.32 scale points, 95% CI ‐24.74 to 29.38; 1 trial, 15 participants, low quality evidence; Analysis 9.1; summary of findings Table 9).
10 Physical exercise plus sleep education versus wait‐list
10.1 Sleep quality and sleep length off‐shift
10.1.1 Sleep quality off‐shift, postintervention measurement only
In a standard parallel design, Atlantis 2006 examined sleep quality off‐shift (baseline and follow‐up, sleep quality for the preceding month) using physical exercise plus sleep education versus a wait‐list only group. Using the Pittsburgh Sleep Quality Index (PSQI) (0 to 21, a lower score = less sleepiness, a higher score = more), and looking at study completers, the authors reported a P value of 0.001 for the shift worker subgroup, postintervention, wherein the intervention group reported better quality sleep than the control group. However, we found the difference to be statistically non‐significant (MD ‐1.40 index points, 95% CI ‐3.10 to 0.30; 1 trial, 32 participants, moderate quality evidence; Analysis 10.1; summary of findings Table 10).
The authors also reported that a subgroup of shift workers, "the poor sleepers", showed significant improvement in the PSQI postintervention (P = 0.04). Although the overall PSQI findings remained significant when data were analysed on an intention‐to‐treat (ITT) basis, the same cannot be reported with certainty for the shift work subgroup. We were unable to obtain ITT shift worker‐only data.
Harma 1988 examined both sleep length and sleep quality off‐shift following the night shift (baseline and follow‐up, sleep parameters over the preceding three weeks). They reported no significant difference between the group receiving the physical exercise programme and the group not receiving the programme: sleep length off‐shift (intervention: percentage change +6.9, control: +1.9; not significant); sleep quality off‐shift (intervention: percentage change ‐6.2, control: ‐8.3; not significant). Although the authors reported in the publication percentage change and positive significance levels based on their questionnaire, they did not report levels of variance. A request for data went unanswered. We therefore could not include these data in our quantitative analysis.
Smith‐Coggins 1997 concluded that the intervention (intensive sleep education plus improved shift schedule) did not significantly improve sleep and sleepiness compared to the placebo diet. While the majority of the analyses were day versus night, there was insufficient reporting of data (no reported variance) for those analyses that met our inclusion criteria. We did not include these data in our quantitative analysis.
Subgroup analysis
The included studies did not allow us to conduct subgroup analyses. See Differences between protocol and review.
Publication bias and quality of the evidence
None of our comparisons contained a sufficient number of trials to assess publication bias.
We assessed 31 outcomes in our quantitative analysis. We downgraded outcomes one level (i.e. from high quality to moderate quality) if the trials from which they came had an overall high risk of bias. We downgraded both of our two meta‐analyses for inconsistency, once for varying lengths of study duration and once for inconsistency of results. We downgraded all 31 of our outcomes at least once for imprecision due to small sample size (but considered the assessment 'small sample size/wide confidence interval' to be a single category and cause for only a single downgrade). In a number of cases we downgraded a second time for imprecision if the observation period was very short (a single day or night). Downgrading for indirectness occurred most often for the outcome 'sleepiness on‐shift'. This is because we consistently gave priority to objective measurements of our outcomes of interest. Objective sleepiness, however, is a variable that currently can only be measured indirectly (e.g. pupillometric assessment). This needs to be considered in future GRADE assessments of such variables.
Discussion
Summary of main results
In view of the large number of individuals working in shift work and 25% of all workers engaged in shift work described as suffering from sleep related problems (Liira 2014), the number of studies that met the criteria for inclusion in the present review is small (n = 17). The included studies explored person‐directed non‐pharmacological interventions with bright light, naps, or other interventions, such as education or physical exercise.
Bright light
The ten included trials present very low to low quality evidence, with no clear indication as to whether bright light might improve sleep parameters among shift workers.
The included studies administered bright light of wide‐ranging intensities and doses (from 2500 lux for 20 minutes up to 10,000 lux for 180 minutes) during shifts, with or without the additional use of light‐blocking goggles whilst off‐shift. They included diverse control conditions (300 lux normal light; normal light plus placebo medication; red light) and, even for the same outcome measure, a variety of measurement tools (e.g. sleepiness on‐shift: Stanford Sleepiness Scale (SSS), Karolinska Sleepiness Scale (KSS), visual analogue scale (VAS), Psychomotor Vigilance Task (PVT) test, Epworth Sleepiness Scale (ESS), actigraphy). Their population inclusion criteria ranged from workers with sleep problems to those who were sleep‐disorder free, and those who were healthy overall, and finally to those with no specific criteria given. Duration of the interventions ranged from one night or day to four weeks. The shift schedules in which the workers were involved also varied significantly.
The single meta‐analysis we were able to conduct in this category found, albeit based on only two trials at high risk of bias, that a bright light intervention at night, over the span of a single night, reduced sleepiness on‐shift overall by one SSS scale point (Analysis 1.3, very low quality evidence). Whether the observed effect is truly due to the bright light treatment is uncertain. Extremely short‐term interventions can be vulnerable to observer effects (for example, the Hawthorne effect (Zhong 2012)) and to placebo effects.
The extensive clinical heterogeneity makes both quantitative pooling and an overall summary statement about the effects of bright light intervention on sleep quality and sleep length off‐shift, and sleepiness on‐shift impossible. Adding to this, missing information around the correlation coefficients in the cross‐over trials leaves uncertainty around the statistical significance of a majority of our outcomes of interest. Finally, the lack of blinding, particularly among the cross‐over trials, introduces a level of bias that potentially undermines any statistically significant findings.
Napping
Based on the small number of trials available for pooling and the limited quality of reporting, we conclude that the data are currently insufficient to draw conclusions regarding the effectiveness of napping during the night shift on sleep parameters.
We rated the quality of the evidence, based on four trials, that napping reduces sleepiness on‐shift as very low to low.
The largest trial in this category with 49 participants (parallel design) found that the nap group reported being one scale score less sleepy than the no‐nap group and that this finding was statistically significant. However, the finding was not confirmed using the same measurement tool in a smaller cross‐over study, regardless of the assumptions we made regarding missing information (Analysis 8.2). A further trial found that the nap group reported being less sleepy than the no‐nap group, and the estimates remained stable regardless of assumptions of correlation (Analysis 8.4).
All of the studies lasted a single night only. Information on the ambient setting for the nap opportunity or opportunities in regard to the perceived light intensity ('darkness'), room temperature, comfort, and noise was seldom reported.
Other person‐directed interventions
Based on the limited data provided in the reports and the substantial clinical heterogeneity, we do not have sufficient information to conclude whether and to what extent physical exercise or educational programmes impact sleep quality or sleep length off‐shift or sleepiness on‐shift.
Of the three included trials, we judged one as having a high risk of bias and two as having an unclear risk of bias.
Only one trial offered sufficient information for us to conduct our own quantitative analysis, and our results ended up differing from those of the study authors’. The one trial in which the exercise programme included outdoor sports did not address the possibility that light exposure during outdoor sports activities likely acted as an effect modifier of their positive findings.
Methodological diversity and pooling
The methodological diversity of the included studies, in terms of interventions, settings, and assessment tools precluded ‐ with two exceptions – pooling study results. The following example may explain the 'pooling dilemma' among relatively very similar trials: Should results from three studies be statistically pooled if one measured their outcome using the KSS (Lowden 2004), and the other two measured the same outcome using the SSS (Karchani 2011; Sadeghniiat‐Haghighi 2011)? The three studies gave each test every two hours throughout the night shift. On the one hand, all measured subjective sleepiness and in a very similar manner, and, in general, the results obtained by using these two methods seem to correlate (Tremaine 2010). These facts would appear to support pooling the data from the above studies. On the other hand, the scales and verbal anchors are quite different and, indeed, the KSS was developed to replace the SSS, as many researchers had found the SSS to be too multidimensional, that is, it measures more dimensions than simply the difficulty of staying awake. We were unable to identify examples in the literature of successful pooling of KSS and SSS results. Therefore, we did not pool the data, even if the results obtained by using the two scales could have been standardised.
An overview of laboratory studies
As indicated in our protocol (Herbst 2013), we included randomised laboratory studies in our literature search and now present those that met our inclusion criteria in a separate table from the field studies. It is important to point out three caveats to this overview: (1) all trial information is taken verbatim from either the publication (when available), from a published abstract or from a thesis; (2) while we excluded laboratory studies in which randomisation was clearly not done, we did not contact the authors of laboratory studies to settle questions of randomisation; and, perhaps most importantly, (3) we did not assess the risk of bias for any of the laboratory studies.
This overview may be summarised in the following way: 22 experimental studies examined 'light'; four examined 'light and glasses'; 21 examined 'nap'; and seven examined 'other interventions'. The laboratory studies – singly and as a whole – suggest that different interventions can have effects on the outcomes of our review. For instance, one may posit that a certain amount of bright light exposure (hypothetically more than 1000 lux for at least two hours beginning at midnight) during consecutive nights may reduce sleepiness on these shifts. Indications of intervention effects in laboratory settings are important because, if no effects were detected under such controlled conditions, one would not expect less controlled field studies to generate significant results. However, it remains conceivable that differences between laboratory and field studies such as sample size or simulated versus real shift work or study populations in the laboratory (risk of selection bias) versus field setting or other codeterminants of interest may disallow the detection of intervention effects in a laboratory study which may be detected in the field investigation or vice versa.
Simulations of shift work conditions as well as interventions and endpoint assessments differed considerably across studies. With regard to results, while quantitative results were often found in the full‐text, almost none of the 54 investigations provided a quantitative result of intervention effects in their abstract, which is where one would expect to find the most important and defensible results. Overall, the laboratory studies provide no clear‐cut findings which could readily be used to augment what we observe in – and interpret from – the field studies.
Taken together, the scientific literature lacks published systematic reviews, including meta‐analyses, of laboratory studies related to the interventions evaluated in this Cochrane review. Our overview shows that empirical evidence in laboratory trials is inconsistent, fragmentary, and, across studies, no significant effects emerge consistently, even under optimised laboratory conditions. We conclude that, based on this overview, it is not possible to predict with much likelihood, which – if any – of the interventions investigated in laboratory studies will be effective – and detected – under naturalistic conditions in the field. Subject to the provision that a future Cochrane Review of laboratory studies were to identify patterns of interest which may be masked in Table 1, Table 2 and Table 3, the laboratory studies – as presented here – do not support evidence‐based recommendations. Future standards of how to simulate shift work, how to design, conduct and report interventions and how to measure effectiveness appear imperative to allow comparisons across laboratory and field studies.
The possible caveat of biological time not being equal to civil time
Individual chronobiology provides key information regarding the impact of interventions, such as (1) light, (2) napping or (3) physical activity, over 24 hours. Empirically, individuals vary in their chronobiological propensity for when – over 24 hours – physiology, endocrinology, metabolism, and behaviour render them more awake and active ('biological day') or passive or asleep ('biological night') (Erren 2013a; Erren 2014).
With few exceptions, the included studies define 'night' and 'day' according to measures of 'civil' time (Erren 2015), and they do not take latitude into account. Thus, information on critical determinants of the chronobiologically relevant biological day and biological night is lacking in the studies. From a chronobiological point of view, it would appear impossible, in these studies, to temporally attribute observed effects of interventions such as bright light on sleepiness and other outcomes to meaningful estimates of the study participants' biological night and biological day. Using 'artificial' time windows over 24 hours of 'civil night' and 'civil day' which do not correspond with the critical chronobiological timescale of 'biological night' and 'biological day' may blur the chronobiological basis and may mask relevant effects observed in study individuals who must be expected to vary significantly in their chronotype. In principle, this caveat may impede interpretation of single studies. Moreover, it may render grouping, for instance, light studies according to 'civil day' and 'civil night' as chronobiologically uninformative and possibly misleading.
Overall completeness and applicability of evidence
The literature search we conducted for the present review was extensive. We included multiple databases, used a broad range of search terms, and did not limit our search by date or language. We contacted field experts and authors to obtain additional data and information. We are therefore confident that we have identified all relevant and accessible studies pertaining to our study questions.
It is important to note that in several publications the study authors did not present all the relevant data. We attempted to contact study authors to ask for missing information. While a number of study authors responded, many could not be reached or failed to respond. In the latter case, depending on the parameters in question, we indicated in our assessments that the information was unclear or we discussed the studies in only a qualitative way.
Because the term 'shift work' refers not only to night‐shift work but also to differing day shifts (morning shift, afternoon shift, evening shift), it is important to note that our review was limited to the effect of person‐directed interventions on sleep parameters among shift workers involved in night work. Thus, readily extrapolating the effect of these same interventions to day‐shift workers is not possible.
The included studies observed workplaces that do not seem to be generalisable to shift work settings in general. Nine of the 17 studies observed workers in a hospital. Two of these studies investigated workers in a sleep laboratory setting. It can be assumed that persons working in medical settings may differ from individuals in other occupational settings. They may be more familiar with adverse health effects associated with shift work, behavioural options to mitigate the negative effects of shift work, and have knowledge concerning possible effects of interventions like exposure to light or napping. Furthermore, two included studies presented data from oil rigs as a unique workplace environment with very specific tasks and settings. Only three studies explored workers in a 'typical' industrial setting. Hence, the overall study population covered by this Cochrane review does not represent the overall shift work population in modern societies.
We defined sleepiness and sleep‐related parameters (e.g. sleep quality and sleep length) as our outcomes. These outcomes can be measured in different ways, such as directly via the Stanford Sleepiness Scale (SSS) or the Karolinska Sleepiness Scale (KSS), or indirectly via measurement of reaction times. When possible, we gave preference to objective measurements. It is thus possible that we may have missed relevant subjective results. Furthermore, lapses or accidents during shift work (or after work) could also indicate sleepiness. However, we did not include such outcomes and may therefore have missed studies with other indirect measurements of sleepiness. However, we expect that the outcomes we have chosen do cover the most important aspects and facets of sleepiness and sleep.
We had intended to examine as secondary outcomes the cost of the interventions in those studies that reported this review's primary outcomes. As the included studies did not report any information on such specific expenses, this review does not include data in this regard.
Finally, possible adverse effects of some of the included interventions, such as safety risks from wearing sunglasses after the night shift on the way home, or a temporarily decreased alertness in the first minutes following naps during the night shift (inertia), were beyond the scope of our review but should not be ignored.
Quality of the evidence
Although we limited our review to randomised controlled trials (RCTs), the quality of the evidence was limited. Due to the extreme diversity of the interventions and controls, nearly all of our results are based on single trials.
The sample size of each trial was relatively small (mean: 36, median: 18; minimum: 4; maximum: 94), and their risk of bias was unclear or high. Despite the fact that blinding would have been theoretically possible, we found no indication that blinding of participants to the bright light interventions was undertaken. All nap studies lasted only a single night.
In some cases, a cross‐over design was used even when not appropriate (i.e. when the intervention cannot be 'unlearned', such as sleep education; or when participants cannot be blinded to the intervention, such as with naps).
When discussing the quality of our evidence we believe it is important to differentiate between evidence that is based on poorly executed studies and evidence that is based on poorly reported studies. The majority of the studies we identified fall into the latter category.
Misclassification bias and missing information on effect modifiers also impair the quality of the evidence. In the case of the former, some studies investigating light interventions acknowledged that, as field studies, light exposure in the surrounding environment is difficult to control. Other trials, however did not address this factor and how it may have impacted their effect estimates. We found limited information about normal light conditions at the workplaces, about the precise latitudes of the trials’ settings, and on the season when the trials were conducted.
With few exceptions, the studies did not explore their findings in the context of individual chronotypes, a factor that could be a relevant effect modifier of the adjustment to shift work conditions and of the outcomes of the investigated interventions (see Assessment of heterogeneity).
Potential biases in the review process
For our assessment of study quality, we followed the guidelines of The Cochrane Handbook for Systematic Reviews of Interventions (Higgins 2011). Overall, our included studies provided sufficient information for us to assess the domains for reporting bias, attrition bias, and other biases. However, the study authors did not sufficiently report the domains for random sequence generation, allocation concealment, blinding of participants and personnel, and blinding of outcome assessment. Only two of the 17 included studies reported that participants were blinded to the intervention, and both were 'other intervention' studies with parallel groups. Information on blinding in bright light studies and nap studies was either non‐existent or studies directly acknowledged not having blinded. We contacted all study authors when information for this domain was missing. Responses either never arrived or they confirmed that blinding was not performed. For our final assessment of that domain, we judged the study authors’ acknowledgement of no blinding to indicate a potentially high risk of bias, whereas we judged a lack of information to indicate an unclear risk of bias. We understand that this approach is not ideal, and that 'rewarding' a lack of information over full reporting is problematic. However, the approach never transformed a potentially low risk study to high risk. Even if we had instead left blinding unclear for all bright light and nap studies, none would have been assessed as low risk. At most, these high risk of bias trials would have converted to unclear.
For the outcome 'on‐shift sleepiness for nap versus no‐nap', we reported separately RCTs with different study designs (cross‐over or parallel). An alternative approach to present these data would have been to combine the different trial types and then conduct a sensitivity analysis.
As described, we used sleepiness on‐shift and sleep length and sleep quality off‐shift as primary outcomes. We did not include all possible objective measurements of sleepiness and thus may have missed some studies and relevant data. As we gave preference to objective measurements over subjective ones, we may have missed significant findings in the subjective data. Nonetheless, we believe that the outcomes we have chosen capture the most important aspects of shift work sleep problems.
We included studies in which all sleep health groups were represented. The sleep health‐status of a population can impact the effects of person‐directed interventions on sleep parameters. For example, people reporting sleep problems might respond differently to a bright light intervention than those not reporting sleep problems. While it would have been interesting to conduct a sensitivity analysis examining the potential modifying effects of sleep health‐status, our pooling options were too limited to do so.
The missing correlation coefficient information in the cross‐over trials made it necessary for us to assume varying levels of correlation between the intervention and control groups, in order to estimate standard errors of the effect estimates (Elbourne 2002). While such data imputation can lead to bias, we presented the results for each of the assumed levels graphically or in the text or both. In the case of our meta‐analyses (n = 2), we assumed zero correlation between the intervention and control groups, thus minimising the risk of presenting findings as statistically significant when this, in fact, may not be the case. There was no clinical justification for a specific correlation coefficient. None of the studies we found described a correlation coefficient or sufficient data to calculate one (e.g. the overall standard deviation (SD) as well as the SD for intervention and control). Hence, we decided to present three different coefficients using a wide range (0 to 0.9) of assumed correlations to investigate its influence on the results.
Finally, it is possible that an assessment of the quality of evidence for the outcome 'sleepiness on‐shift' based solely on subjective (but direct) measurements might have resulted in less of a downgrading for that outcome overall. However, in no case would such an assessment have resulted in an outcome reaching a high level quality of evidence.
Agreements and disagreements with other studies or reviews
Neil‐Sztramko 2014 conducted a comprehensive review on several aspects of night‐shift work and health‐related interventions. Their review and our review both examined controlled light interventions and interventions based on behaviour modification (i.e. physical activity or rest periods). Because the inclusion criteria of their review and our review differed (most notably, they excluded sleepiness and fatigue as outcomes, and included biological markers of chronic disease, laboratory trials and non‐randomised studies), Neil‐Sztramko 2014 assessed a number of light studies that we had excluded. Conversely, because they excluded sleepiness, they did not include any of our nap studies. However, we identified in our search every study in their included studies lists for light and behavioural interventions and screened them closely for inclusion in our review.
In contrast to our study, Neil‐Sztramko 2014 judged the reporting quality of the light studies to be high. Although they report the summary scores in an appendix, we were unable to find a specific breakdown of these scores, but we assumed that higher scores indicated better quality reporting. Our risk of bias judgement differed mainly in our assessment of one study (Tanaka 2011), likely because of the assessment issue for blinding mentioned above. However, overall, the authors of the Neil‐Sztramko 2014 review described the ‘substantial heterogeneity’ of the studies and concluded, as do we, that meta‐analyses are not possible with the current evidence available.
A narrative systematic review by Ruggiero 2014 specifically investigated napping on sleepiness and sleep‐related performance. The review authors accepted pseudo‐randomised studies and therefore ended up including several more than the four nap trials we included. Most of the remaining studies on their list are listed in our review under Characteristics of excluded studies or Table 1, Table 2 and Table 3. According to Ruggiero 2014 nap interventions appear to “hold promise” in improving sleepiness and performance among shift workers, but that the small sample size and high heterogeneity make conclusions difficult. These are in agreement with our findings. We include one further trial that was likely published too late for the Ruggiero 2014 review (Oriyama 2014). This additional trial found no statistically significant difference between the nap and no‐nap groups. With 15 participants, the trial is also small. The fact that the intervention involves two‐nap opportunities adds to the heterogeneity of the body of evidence for napping, ultimately supporting the findings of both Ruggiero 2014 and our own.
*Reflects search for both the current review and for the review "Adaptation of shift work schedules for preventing and treating sleepiness and sleep disturbances caused by shift work (028) (Erren 2013)"
Risk of bias graph: review authors' judgements about each risk of bias item presented as percentages across all included studies; The "Applicability of design" category assesses whether, in cross‐over designs, a period effect impacted the results (based on an interaction test). If no interaction test was reported, the risk of bias was considered unclear. In cases where the trial had a parallel design, the risk of bias was judged to be low.
Risk of bias summary: review authors' judgements about each risk of bias item for each included study; The "Applicability of design" category assesses whether, in cross‐over designs, a period effect impacted the results (based on an interaction test). If study authors reported no interaction test, we considered the risk of bias to be unclear. In cases where the trial had a parallel design, we considered the risk of bias to be low.

Comparison 1 Bright light at night versus normal light (300 lux), Outcome 1 Sleepiness during the night shift, overall, Stanford Sleepiness Scale (Scale: 1‐7).

Comparison 1 Bright light at night versus normal light (300 lux), Outcome 2 Sleepiness during the night shift, overall, Karolinska Sleepiness Scale (Scale: 1‐9).

Comparison 1 Bright light at night versus normal light (300 lux), Outcome 3 Sleepiness during the night shift, postintervention only, Stanford Sleepiness Scale (Scale: 1‐7).
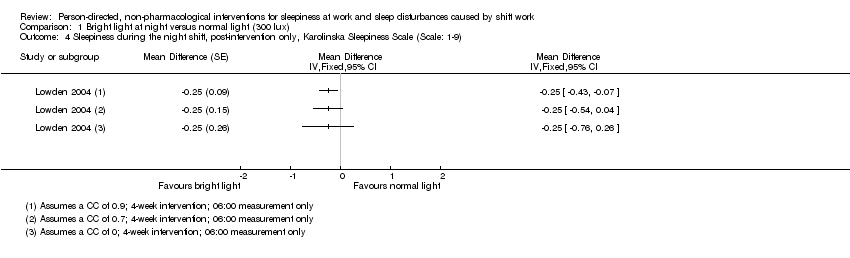
Comparison 1 Bright light at night versus normal light (300 lux), Outcome 4 Sleepiness during the night shift, post‐intervention only, Karolinska Sleepiness Scale (Scale: 1‐9).

Comparison 1 Bright light at night versus normal light (300 lux), Outcome 5 Total sleep time, next day (Actigraph ‐ hours).
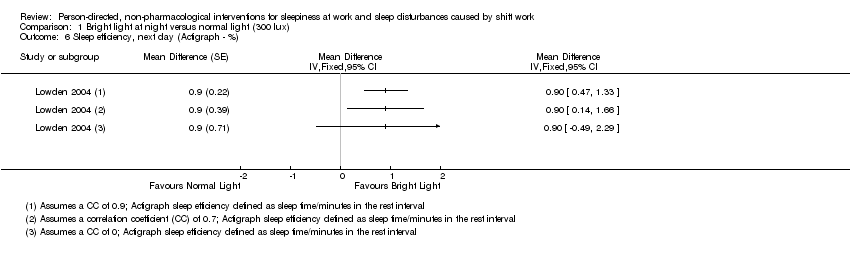
Comparison 1 Bright light at night versus normal light (300 lux), Outcome 6 Sleep efficiency, next day (Actigraph ‐ %).

Comparison 2 Bright light alone at night versus normal light (300 lux) plus placebo capsule, Outcome 1 Sleepiness during the night shift (5‐min. Reaction Time Test ‐ milliseconds).

Comparison 2 Bright light alone at night versus normal light (300 lux) plus placebo capsule, Outcome 2 Total sleep time, next day (Actiwatch ‐ hours).

Comparison 2 Bright light alone at night versus normal light (300 lux) plus placebo capsule, Outcome 3 Sleep onset latency, next day (Actiwatch ‐ minutes).

Comparison 2 Bright light alone at night versus normal light (300 lux) plus placebo capsule, Outcome 4 Sleep efficiency, next day (Actiwatch ‐ %).

Comparison 3 Bright light during day versus normal light (530 to 648 lux), Outcome 1 Sleepiness during the day shift (Karolinska Sleepiness Scale).
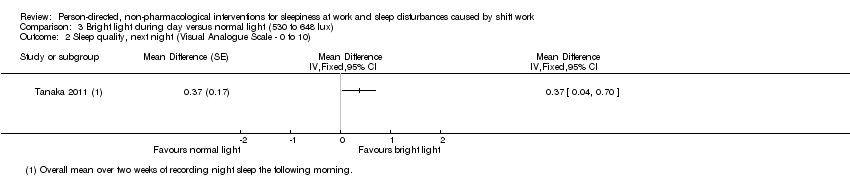
Comparison 3 Bright light during day versus normal light (530 to 648 lux), Outcome 2 Sleep quality, next night (Visual Analogue Scale ‐ 0 to 10).

Comparison 4 Bright light during day versus dim red light, Outcome 1 Total sleep time, next night (sleep log ‐ hours).

Comparison 4 Bright light during day versus dim red light, Outcome 2 Sleep onset latency, next night (sleep log ‐ minutes).

Comparison 5 Bright light alone during day versus normal light (300 lux) plus placebo capsule, Outcome 1 Sleepiness during the day shift, days (5‐min. Reaction Time Test ‐ milliseconds).
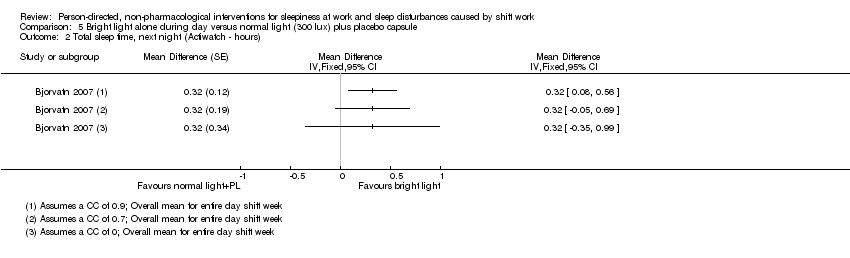
Comparison 5 Bright light alone during day versus normal light (300 lux) plus placebo capsule, Outcome 2 Total sleep time, next night (Actiwatch ‐ hours).

Comparison 5 Bright light alone during day versus normal light (300 lux) plus placebo capsule, Outcome 3 Sleep onset latency, next night (Actiwatch ‐ minutes).
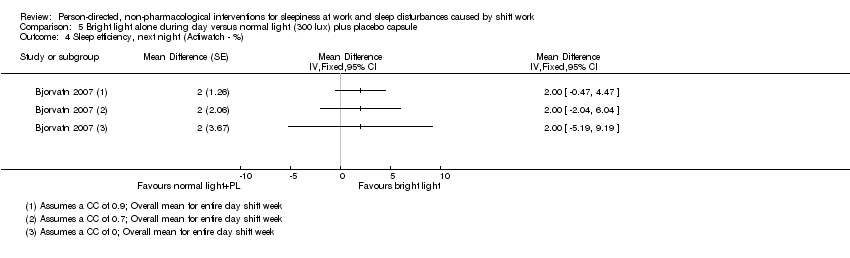
Comparison 5 Bright light alone during day versus normal light (300 lux) plus placebo capsule, Outcome 4 Sleep efficiency, next night (Actiwatch ‐ %).

Comparison 6 Bright light at night plus glasses at dawn versus normal light (unclear lux) and no glasses, Outcome 1 Sleepiness during the night shift (Psychomotor Vigilance Test: Median Reaction Time ‐ milliseconds).

Comparison 7 Bright light plus glasses during day versus normal light and no glasses, Outcome 1 Total sleep time, next night (Actigraph ‐ hours).

Comparison 7 Bright light plus glasses during day versus normal light and no glasses, Outcome 2 Sleep onset latency, next night (Actigraph ‐ minutes).

Comparison 7 Bright light plus glasses during day versus normal light and no glasses, Outcome 3 Sleep efficiency, next night (Actiwatch ‐ %).

Comparison 8 Nap at night (single nap opportunity) versus no‐nap, Outcome 1 Sleepiness during the night shift, postintervention (Psychomotor Vigilance Test ‐ Mean Reaction Time ‐ milliseconds).

Comparison 8 Nap at night (single nap opportunity) versus no‐nap, Outcome 2 Sleepiness during the night shift, postintervention (Karolinska Sleepiness Scale).

Comparison 8 Nap at night (single nap opportunity) versus no‐nap, Outcome 3 Sleepiness during the night shift, postintervention (Psychomotor Vigilance Test (Slowest 10% reciprocal reaction time ‐ milliseconds ).

Comparison 8 Nap at night (single nap opportunity) versus no‐nap, Outcome 4 Sleepiness during the night shift, postintervention (Subjective Sleepiness Score ‐ "0 to 100").

Comparison 9 Naps at night (two‐nap opportunities) versus no‐naps, Outcome 1 Sleepiness during the night shift, postintervention (Visual Analogue Scale ‐ 0 mm to 100 mm).

Comparison 10 Physical exercise plus sleep education versus wait‐list, Outcome 1 Sleep quality, postintervention (PSQI ‐ score).
| Bright light at night versus normal light (300 lux) | ||||||
| Patient or population: Shift workers | ||||||
| Outcomes | Anticipated absolute effects* (95% CI) | Relative effect | № of participants | Quality of the evidence | Comments | |
| Risk with normal light (300 lux) | Risk with bright light ** | |||||
| Sleepiness during the night shift overall; | The mean sleepiness during the night shift overall in the control group was 3.10 score points | The mean sleepiness during the night shift overall in the intervention group was 0.83 lower (1.31 to 0.36 lower) | ‐ | 184 | ⊕⊝⊝⊝ | Lower sleepiness score indicates less sleepiness. Sleepiness score was averaged over the entire night. Although one study actually went on for two nights (Karchani 2011), we included only the measurements from the first night here, so that it was more comparable to the other study (Sadeghniiat‐Haghighi 2011) |
| Sleepiness during the night shift overall; | The mean sleepiness during the night shift overall in the control group was 4.33 score points | The mean sleepiness during the night shift overall in the intervention group was 0.26 lower (0.81 lower to 0.29 higher) | ‐ | 16 | ⊕⊕⊝⊝ | Lower sleepiness score indicates less sleepiness. Sleepiness score was averaged over the entire night |
| Sleepiness during the night shift; postintervention measurement | The mean sleepiness during the night shift; postintervention measurement in the control group was 4.51 score points | The mean sleepiness during the night shift; postintervention measurement in the intervention group was 2.21 lower (2.43 to 1.99 lower) | ‐ | 90 | ⊕⊕⊝⊝ | Lower sleepiness score indicates less sleepiness |
| Sleepiness during the night shift; postintervention measurement | The mean sleepiness during the night shift; postintervention measurement in the control group was 5.25 score points | The mean sleepiness during the night shift; postintervention measurement in the intervention group was 0.25 lower (0.76 lower to 0.26 higher) | ‐ | 16 | ⊕⊕⊝⊝ | Lower sleepiness score indicates less sleepiness |
| Total sleep time, next day ‐ main sleep time only; actigraph | The mean total sleep time, next day ‐ main sleep period only in the control group was 6.53 hours | The mean total sleep time, next day ‐ main sleep time only in the intervention group was 0.25 hours longer (0.36 shorter to 0.86 longer) | ‐ | 15 | ⊕⊕⊝⊝ | Longer sleep time indicates more hours slept during the main sleep period |
| Total sleep time, next day ‐ 24‐hr sleep time, including naps; assessed with actigraph | The mean total sleep time, next day ‐ 24‐hour sleep period (including naps) in the control group was 5.92 hours | The mean total sleep time, next day ‐ 24‐hour sleep period (including naps) in the intervention group was 0.63 hours longer (0.43 shorter to 1.69 longer) | ‐ | 15 | ⊕⊕⊝⊝ | Longer sleep time indicates more hours slept over 24‐hours, including both the main sleep period and naps |
| Sleep efficiency, next day; assessed with actigraph3 | The mean sleep efficiency, next day, in the control group was 89.5% | The mean sleep efficiency, next day, in the intervention group was 0.9% higher (0.49 lower to 2.29 higher) | ‐ | 15 | ⊕⊕⊝⊝ | Higher sleep efficiency indicates that a greater part of the time spent lying in bed was actually spent sleeping |
| *The risk in the intervention group (and its 95% confidence interval) is based on the assumed risk in the comparison group and the relative effect of the intervention (and its 95% CI); ** In the case of cross‐over trials, the 95% CI reported here is based on an assumed correlation coefficient of 0. | ||||||
| GRADE Working Group grades of evidence | ||||||
| 1SSS: Stanford Sleepiness Scale, a 7‐point scale with verbal anchors ranging from 1: 'feeling active, vital, alert, or wide awake' to 7: 'no longer fighting sleep, sleep onset soon, having dream‐like thoughts'. | ||||||
| Bright light alone at night versus normal light (300 lux) plus placebo capsule | ||||||
| Patient or population: Shift workers | ||||||
| Outcomes | Anticipated absolute effects* (95% CI) | Relative effect | № of participants | Quality of the evidence | Comments | |
| Risk with normal light (300 lux) plus placebo capsule | Risk with bright light** | |||||
| Sleepiness during the night shift; assessed with 5‐min Reaction Time Test | The mean reaction time during the night shift in the control group was 325.19 ms | The mean reaction time during the night shift in the intervention group was 14.61 ms faster (68.10 faster to 38.88 slower) | ‐ | 14 | ⊕⊝⊝⊝ | Faster reaction time suggests less sleepiness |
| Total sleep time, next day; | The mean total sleep time, next day, in the control group was 6.72 hours | The mean total sleep time, next day, in the intervention group was 0.26 hours longer (0.47 shorter to 0.99 longer) | ‐ | 15 | ⊕⊝⊝⊝ | Longer sleep time indicates more hours slept during the main sleep period |
| Sleep onset latency, next day; | The mean sleep onset latency, next day, in the control group was 6 minutes | The mean sleep onset latency, next day, in the intervention group was 0 minutes (neither shorter nor longer) (5.08 shorter to 5.08 longer) | ‐ | 15 | ⊕⊝⊝⊝ | Shorter sleep onset latency indicates fewer minutes needed to fall asleep when lying in bed |
| Sleep efficiency, next day; | The mean sleep efficiency, next day, in the control group was 86% | The mean sleep efficiency, next day, in the intervention group was 2% higher (4.10 lower to 8.10 higher) | ‐ | 15 | ⊕⊝⊝⊝ | Higher sleep efficiency indicates that a greater part of the time spent lying in bed was actually spent sleeping |
| *The risk in the intervention group (and its 95% confidence interval) is based on the assumed risk in the comparison group and the relative effect of the intervention (and its 95% CI); ** In the case of cross‐over trials, the 95% CI reported here is based on an assumed correlation coefficient of 0. | ||||||
| GRADE Working Group grades of evidence | ||||||
| 1Sleep efficiency = total sleep time as the percentage of time in bed. | ||||||
| Bright light during day versus normal light (530 to 648 lux) | ||||||
| Patient or population: Shift workers | ||||||
| Outcomes | Anticipated absolute effects* (95% CI) | Relative effect | № of participants | Quality of the evidence | Comments | |
| Risk with normal light (530 to 648 lux) | Risk with bright light | |||||
| Sleepiness during the day shift assessed with KSS1 14:00 | The mean sleepiness during the day shift in the control group was 4.28 score points | The mean sleepiness during the day shift in the intervention group was 0.35 lower (0.72 lower to 0.02 higher) | ‐ | 61 | ⊕⊕⊝⊝ | Lower sleepiness score indicates less sleepiness |
| Sleep quality, next night; assessed with VAS2 | The mean sleep quality, next night, in the control group was 5.94 score points | The mean sleep quality, next night, in the intervention group was 0.37 higher (0.04 to 0.7 higher) | ‐ | 61 | ⊕⊕⊝⊝ | Higher sleep quality indicates a better main sleep period |
| *The risk in the intervention group (and its 95% confidence interval) is based on the assumed risk in the comparison group and the relative effect of the intervention (and its 95% CI). | ||||||
| GRADE Working Group grades of evidence | ||||||
| 1KSS: Karolinska Sleepiness Scale, a 9‐point scale with verbal anchors ranging from 1: 'extremely alert' to 9: 'very sleepy, great effort to keep awake, fighting sleep'. | ||||||
| Bright light during day versus dim red light | ||||||
| Patient or population: Shift workers | ||||||
| Outcomes | Anticipated absolute effects* (95% CI) | Relative effect | № of participants | Quality of the evidence | Comments | |
| Risk with dim red light | Risk with bright light | |||||
| Total sleep time, next night; | The mean total sleep time, next night, in the control group was 7 hours | The mean total sleep time, next night, in the intervention group was 0.1 hours longer (1.09 shorter to 1.29 longer) | ‐ | 16 | ⊕⊕⊝⊝ | Longer sleep time indicates more hours slept during the main sleep period |
| Sleep onset latency, next night assessed with sleep log | The mean sleep onset latency, next night, in the control group was 16.6 minutes | The mean sleep onset latency, next night, in the intervention group was 2.6 minutes shorter (10.72 shorter to 5.52 longer) | ‐ | 16 | ⊕⊕⊝⊝ | Shorter sleep onset latency indicates fewer minutes needed to fall asleep when lying in bed |
| *The risk in the intervention group (and its 95% confidence interval) is based on the assumed risk in the comparison group and the relative effect of the intervention (and its 95% CI); | ||||||
| GRADE Working Group grades of evidence | ||||||
| 1Downgraded one level due to risk of bias and one level due to imprecision (wide confidence intervals). | ||||||
| Bright light alone during day versus normal light (300 lux) plus placebo capsule | ||||||
| Patient or population: Shift workers | ||||||
| Outcomes | Anticipated absolute effects* (95% CI) | Relative effect | № of participants | Quality of the evidence | Comments | |
| Risk with normal light (300 lux) plus placebo capsule | Risk with bright light** | |||||
| Sleepiness during the day shift; days assessed with 5‐min Reaction Time Test | The mean reaction time, during the day‐shift days, in the control group was 296.16 ms | The mean reaction time, during the day‐shift days, in the intervention group was 14.05 ms slower (17.37 faster to 45.47 slower) | ‐ | 12 | ⊕⊝⊝⊝ | Slower reaction time suggests more sleepiness |
| Total sleep time, next night; | The mean total sleep time, next night, in the control group was 5.8 hours | The mean total sleep time next night, in the intervention group was 0.32 hours longer (0.35 shorter to 0.99 longer) | ‐ | 13 | ⊕⊝⊝⊝ | Longer sleep time indicates more hours slept during the main sleep period |
| Sleep onset latency, next night; | The mean sleep onset latency, next night, in the control group was 6 minutes | The mean sleep onset latency, next night, in the intervention group was 1 minute longer (4.47 shorter to 6.47 longer) | ‐ | 13 | ⊕⊝⊝⊝ | Longer sleep onset latency indicates more minutes needed to fall asleep when lying in bed |
| Sleep efficiency, next night; | The mean sleep efficiency, next night, in the control group was 85% | The mean sleep efficiency, next night, in the intervention group was 2% higher (5.19 lower to 9.19 higher) | ‐ | 13 | ⊕⊝⊝⊝ | Higher sleep efficiency indicates that a greater part of the time spent lying in bed was actually spent sleeping |
| *The risk in the intervention group (and its 95% confidence interval) is based on the assumed risk in the comparison group and the relative effect of the intervention (and its 95% CI); ** In the case of cross‐over trials, the 95% confidence interval reported here is based on an assumed correlation coefficient of 0. | ||||||
| GRADE Working Group grades of evidence | ||||||
| 1Sleep efficiency = total sleep time as the percentage of time in bed. | ||||||
| Bright light at night plus glasses versus normal light (unclear lux) and no glasses | ||||||
| Patient or population: Shift workers | ||||||
| Outcomes | Anticipated absolute effects* (95% CI) | Relative effect | № of participants | Quality of the evidence | Comments | |
| Risk with normal light (unclear lux) and no glasses | Risk with bright light at night plus glasses | |||||
| Sleepiness during the night shift assessed with Psychomotor Vigilance Task and Median Reaction Time tests | The median reaction time during the night shift in the control group was 68.29 ms | The median reaction time during the night shift in the intervention group was 0.11 ms slower (20.83 faster to 21.05 slower) | ‐ | 17 | ⊕⊝⊝⊝ | Slower reaction time suggests more sleepiness |
| *The risk in the intervention group (and its 95% confidence interval) is based on the assumed risk in the comparison group and the relative effect of the intervention (and its 95% CI). | ||||||
| GRADE Working Group grades of evidence | ||||||
| 1Downgraded one level due to risk of bias, one level due to imprecision (wide confidence intervals, single trial only), and one level due to indirectness (indirect measurement of sleepiness). | ||||||
| Bright light plus glasses during day versus normal light and no glasses | ||||||
| Patient or population: Shift workers | ||||||
| Outcomes | Anticipated absolute effects* (95% CI) | Relative effect | № of participants | Quality of the evidence | Comments | |
| Risk with normal light and no glasses | Risk with bright light plus glasses** | |||||
| Total sleep time, next night; | The mean total sleep time, next night, in the control group was 6.25 hours | The mean total sleep time, next night, in the intervention group was 0.32 hours longer (0.39 shorter to 1.03 longer) | ‐ | 3 | ⊕⊕⊝⊝ | Longer sleep time indicates more hours slept during the main sleep period |
| Sleep onset latency, next night; | The mean sleep onset latency, next night, in the control group was 18 minutes | The mean sleep onset latency, next night, in the intervention group was 2.4 minutes longer (13.08 shorter to 17.88 longer) | ‐ | 3 | ⊕⊕⊝⊝ | Longer sleep onset latency indicates more minutes needed to fall asleep when lying in bed |
| Sleep efficiency, next night; | The mean sleep efficiency, next night, in the control group was 76.18% | The mean sleep efficiency, next night, in the intervention group was 6.59% higher (4.35 lower to 17.53 higher) | ‐ | 3 | ⊕⊕⊝⊝ | Higher sleep efficiency indicates that a greater part of the time spent lying in bed was actually spent sleeping |
| *The risk in the intervention group (and its 95% confidence interval) is based on the assumed risk in the comparison group and the relative effect of the intervention (and its 95% CI); ** In the case of cross‐over trials, the 95% confidence interval reported here is based on an assumed correlation coefficient of 0. | ||||||
| GRADE Working Group grades of evidence | ||||||
| 1Sleep efficiency = total sleep time as the percentage of time in bed. | ||||||
| Nap at night (single nap opportunity) versus no‐nap | ||||||
| Patient or population: Shift workers | ||||||
| Outcomes | Anticipated absolute effects* (95% CI) | Relative effect | № of participants | Quality of the evidence | Comments | |
| Risk with no‐nap | Risk with nap (single nap opportunity)** | |||||
| Sleepiness during the night shift, postintervention; | The mean reaction time during the night shift, postintervention, in the control group was 180.50 ms | The mean reaction time during the night shift, postintervention, in the intervention group was 11.87 ms faster (31.94 faster to 8.20 slower) | ‐ | 16 | ⊕⊝⊝⊝ | Faster reaction time suggests less sleepiness |
| Sleepiness during the night shift, postintervention; | The mean sleepiness during the night shift, postintervention, in the control group was 6.63 score points | The mean sleepiness during the night shift, postintervention in the intervention group was 0.13 higher (0.46 lower to 0.72 higher) | ‐ | 8 | ⊕⊕⊝⊝ | Higher sleepiness score indicates more sleepiness; study design: cross‐over |
| Sleepiness during the night shift, postintervention; | The mean sleepiness during the night shift, postintervention, in the control group was 6.48 score points | The mean sleepiness during the night shift, postintervention, in the intervention group was 1.12 lower (1.83 to 0.41 lower) | ‐ | 49 | ⊕⊕⊝⊝ | Higher sleepiness score indicates more sleepiness; study design: parallel |
| Sleepiness during the night shift, postintervention; | The mean slowest 10% reciprocal reaction time during the night shift, postintervention, in the control group was 2.46 ms | The mean slowest 10% reciprocal reaction time during the night shift, postintervention, in the intervention group was 0.19 ms faster (0.67 slower to 1.05 faster) | ‐ | 7 | ⊕⊝⊝⊝ | Faster reaction time suggests less sleepiness |
| Sleepiness during the night shift, postintervention; assessed with Psychomotor Vigilance Task Test (slowest 10% reciprocal reaction time) | The mean slowest 10% reciprocal reaction time during the night shift, postintervention, in the control group was 2.13 ms | The mean slowest 10% reciprocal reaction time during the night shift, postintervention, in the intervention group was 0.32 ms faster (0.21 slower to 0.85 faster) | ‐ | 49 | ⊕⊝⊝⊝ | Faster reaction time suggests less sleepiness |
| Sleepiness during the night shift, postintervention; subjective sleepiness score2 | The mean sleepiness during the night shift, postintervention, in the control group was 52.02 score points | The mean sleepiness during the night shift, postintervention, in the intervention group was 16.14 lower (31.37 to 0.91 lower) | ‐ | 9 | ⊕⊝⊝⊝ | Lower sleepiness score indicates less sleepiness |
| *The risk in the intervention group (and its 95% confidence interval) is based on the assumed risk in the comparison group and the relative effect of the intervention (and its 95% CI); ** In the case of cross‐over trials, the 95% confidence interval reported here is based on an assumed correlation coefficient of 0. | ||||||
| GRADE Working Group grades of evidence | ||||||
| 1 KSS: Karolinska Sleepiness Scale, a 9‐point scale with verbal anchors ranging from 1: 'extremely alert' to 9: 'very sleepy, great effort to keep awake, fighting sleep'. | ||||||
| Nap at night (two nap opportunities) versus no‐nap | ||||||
| Patient or population: Shift workers | ||||||
| Outcomes | Anticipated absolute effects* (95% CI) | Relative effect | № of participants | Quality of the evidence | Comments | |
| Risk with no‐nap | Risk with Nap (two‐nap opportunities) | |||||
| Sleepiness during the night shift, postintervention; | The mean sleepiness during the night shift postintervention, in the control group was 40.21 score points | The mean sleepiness during the night shift, postintervention, in the intervention group was 2.32 higher (24.74 lower to 29.38 higher) | ‐ | 15 | ⊕⊕⊝⊝ | Higher sleepiness score indicates more sleepiness |
| *The risk in the intervention group (and its 95% confidence interval) is based on the assumed risk in the comparison group and the relative effect of the intervention (and its 95% CI). | ||||||
| GRADE Working Group grades of evidence | ||||||
| 1VAS: visual analogue scale, 100 millimetre scale ranging from 0 mm: not at all sleepy/tired to 100 mm: extremely sleepy/tired. | ||||||
| Physical exercise and sleep hygiene education versus wait‐list for sleepiness and sleep disturbances caused by shift work | ||||||
| Patient or population: Shift workers Settings: Individual workplace Intervention: Physical exercise and sleep hygiene education Comparison: Wait‐list | ||||||
| Outcomes | Anticipated absolute effects* (95% CI) | Relative effect | No of Participants | Quality of the evidence | Comments | |
| Risk with wait‐list | Risk with physical exercise and sleep hygiene education | |||||
| Sleep quality, postintervention, assessed with PSQI1 | The mean sleep quality, postintervention, over previous one‐month period in the control group was 5.6 score points | The mean sleep quality, postintervention, over previous one‐month period in the intervention group was 1.4 lower (3.10 lower to 0.30 higher) | 32 | ⊕⊕⊕⊝ | Higher sleep quality indicates a better main sleep period | |
| *The risk in the intervention group (and its 95% confidence interval) is based on the assumed risk in the comparison group and the relative effect of the intervention (and its 95% CI). | ||||||
| GRADE Working Group grades of evidence | ||||||
| 1PSQI: Pittsburgh Sleep Quality Index, 0 to 21 point index, lower score = higher sleep quality. | ||||||
| Light interventions | ||||||
| Reference | Study participants | Shift system | Intervention | Key endpoints | Key results | |
| 11 subjects (females??) | Simulated shift‐work schedule beginning 17:30 and ending 10:00 the next morning | 1 hour bright light + placebo; exposure to 3000 lux occurred between 01:30 and 02:30 hours, placebo at 01:40 | CRT | Exposure for 1 hour to bright light combined with placebo yielded swifter CRTs immediately after the treatment, but also seemed to result in more sleepiness and greater performance deficit than when the subjects were not exposed to the bright light. | ||
| 16 subjects (all males) | Graveyard shift (00:00‐07:59); rapidly rotating shift system, having three continuous nights' work followed by three days’ rest | 1) Low‐illuminance (250 lux, 3900 K) | Sleep quality (by diary); | High, increasing, and decreasing illuminance conditions associated with greater subjective arousal than were the low‐illuminance condition. No difference of performing simple cognitive tasks associated with the lighting conditions. | ||
| 26 subjects (7 females) | 3 consecutive night shifts between 24:00 hours until 08:00 hours the following morning | Exposed group: night 1: > 4000 lux between 00:00 hours to 04:00 hours, followed by ambient room illumination < 100 lux; night 2+3: circa 1000 lux for the duration of each shift Control group: < 100 lux (night 1‐3) | Levels of alertness during shift assessed using the RTSW | There was little effect on measures of on‐duty alertness and performance or on off‐duty sleep. Middle‐aged subjects may be less phase‐tolerant than young subjects. | ||
| 8 subjects (2 females) | 4 day shifts followed by 4 night shifts | Treatment subjects (n = 4) received 2500 lux in the latter half of night shifts + a scheduled 8‐hour evening sleep episode; control subjects were in standard lighting (90 lux) | Subjective sleepiness on‐shift; PVT reaction time | For treatment subjects, by night 2, reaction time was not different from day shifts, and by night 3, subjective sleepiness was not different from day shifts. The preliminary data indicate that a combination treatment of scheduled evening sleep before night shifts and enhanced lighting during night shifts improves on‐shift sleepiness and reaction time. | ||
| 8 subjects (all males) | 1 week of night work | Treatment study condition: circa 7000‐12,000 Iux at night and nearly complete darkness during the day (had to stay in their bedroom from 9:00‐17:00) Control study conditions: circa 150 lux; no restriction for the day | Subjective alertness on‐shift assessed with use of a VAS; cognitive performance measured by a test involving calculations | Both alertness and cognitive performance significantly improved in the treatment group during night‐shift hours. | ||
| 13 subjects (6 females) | 3 consecutive simulated night shifts between 00:00 and 08:00 | Treatment study condition: circa 6000 Iux between 00:00 and 04:00 on the first night shift + dim light (< 200 Iux) for the remainder of the study The control group received dim light throughout | Alertness on‐shift assessed using the RTSW; measures of sleep quality included time in bed, total sleep time, sleep efficiency, sleep onset latency, wake after sleep onset | The treatment was associated with significantly higher alertness across the night shift and improved sleep quality during the day. On‐shift alertness was improved relative to the control group. The data indicate that a single 4‐hour pulse of bright light between midnight and 04:00 is effective in ameliorating the sleep and alertness problems associated with transition to night shift. | ||
| 16 subjects (6 females) | 3 consecutive simulated night shifts between 23:00 and 07:00 | Treatment group condition: bright light (4000‐7000 Iux between 00:00 and 04:00) Control group conditions: dim red light < 50 lux | Sleep quality measured by wrist actigraphy; cognitive performance measured using computer‐based divided attention tasks | Sleep quality and cognitive psychomotor performance was improved in the Iight‐treatment group. | ||
| 46 subjects (21 females) | Simulated night shifts of 8 consecutive night‐work, day‐sleep days | Bright light durations of 6, 3 and 0 hours (i.e. dim light) during simulated night shifts. The bright light (circa 5,000 Iux) was used during all 8 night shifts, and dim light was < 500 Iux | Core body temperature continuously measured; sleep duration assessed by daily sleep log; mood assessed using the POMS | Substantial circadian adaptation (i.e. a large cumulative temperature rhythm phase shift) was produced in many subjects in the bright light groups, but not in the dim light group. Larger temperature rhythm phase shifts were associated with better subjective daytime sleep, less subjective fatigue and better overall mood. | ||
| 22 subjects (all male?) | 1 full day shift (08:00‐16:00) + 2 night shifts (19:00‐07:00) | Four treatment groups: bright light (2000 lux) for three hours at 19:00, 22:00, 01:00 or 04:00 during the first night shift Control group: dim red light during 01:00‐04:00; 200 lux ambient lighting | Core body temperature and wrist activity monitored by a Vitalog PMS‐8; cognitive performance and mood assessed through a battery computerised task battery. Specific measures of mood include: POMS, School of Aerospace Medicine Subjective Fatigue Checklist, SSS | Preliminary analysis indicates equal or better results across all groups on the second night shift as compared to the first night for simple reaction time, logical reasoning, addition/subtraction, sleepiness and fatigue. | ||
| 8 subjects (all males) | Simulated night shift regimen (60‐hour protocol) | Treatment group: during 20:00 to 08:00 (1st night), 4‐hour pulse of bright light (700‐1000 Iux) Control group: during 20:00 to 08:00 (1st night), dim light (circa 50 Iux); 2nd night: dim light in both groups | Self‐rated alertness assessed using a shortened version of the Activation ‐ Deactivation Adjective Checklist; performance tests were 'search and memory' tests derived from the Memory and Search Task | Self‐assessed alertness and task performance were improved by the exposure to bright light. Subjective alertness and performance continued to show a time course during the subsequent night following exposure only to dim light. | ||
| 11 subjects (all males) | Simulated night work | Day 1: dim light (< 15 lux) from 20:00 to 03:00 Day 2: light for four hours from 23:00 to 03:00 with a non‐visor cap (500 lux), red‐visor cap (circa 160 lux), blue‐visor cap (circa 160 lux) | Performance of a PVT as an index of objective sleepiness; subjective sleepiness on‐shift, fatigue, mood, visual comfort and brightness measured using a VAS | The red‐visor cap had no adverse effects on performance of the PVT, brightness and visual comfort, though it tended to increase subjective sleepiness. | ||
| Experiment 1: Pilot study: 5 subjects (4 females) Experiment 2: 6 subjects (all females) Experiment 3: 11 subjects (all males) | Experiment 1: two seven‐day study periods Experiment 2: 4 six‐day study periods Experiment 3: five seven‐day study periods | Experiment 1: ambient lighting in the clinical investigation unit of 50 lux; 2 hours of 10,000 Iux or dim light during 02:00‐04:00 Experiment 2: I‐hour 10,000 Iux at 20:00 or 00:00 or 04:00, or dim light Experiment 3: 1, 2 or 4 hours of 10,000 lux or dim light in time windows 01:00‐05:00 | Subjective fatigue measure on‐shift through Samn‐Perelli scale; alertness and performance measured using digit‐symbol substitution task, CRT, and subjective alertness ratings VAS + G15 | A series of experiments established that 2 hours of bright light (broad spectrum white, 02:00‐04:00, 10,000 lux) did improve subjective alertness and performance. Bright light given in the middle of the night (white 00:00‐01:00, 10,000 lux) was more effective than light given at 20:00 or 04:00. Light of 2 hours and 4 hours duration were more effective than 1 hour of light centred at 03:00 (white, 10,000 lux). Light of shorter wavelengths appeared to be more effective than light of Ionger wavelengths at improving nocturnal alertness and performance (01:00‐05:00, 300 lux). | ||
| 32 subjects (16 females) | Three consecutive simulated night shifts between 22:00‐06:00 | Treatment group: 4‐hour pulse of bright light (3000 lux) between 22:00 and 02:00 on night 1, 1 hour later in night 2, and 2 hours later in night 3 Control group: dim light (300 Iux) | Objective measures of working memory, selective attention, divided attention, concentration performance, and vigilance recorded by established performance tests (including working memory of the TAP, Go/No‐Go, Divided Attention of the test battery for attention testing; Konzentrations‐Leistungs‐Test; Simple Reaction Time Task) | Bright light Ieads to an improvement in working memory, divided attention and concentration performance in all three night shifts. Bright light leads to better performance for some forms of attention tasks in elderly night workers. | ||
| 32 subjects (16 females) | Three consecutive simulated night shifts between 22:00‐06:00 | Treatment group: 4‐hour pulse of bright light (3000 lux) between 22:00 and 02:00 on night 1, 1 hour later in night 2, and 2 hours later in night 3 Control group: dim light (300 Iux) | Objective measures of working memory, selective attention, divided attention, concentration performance, and vigilance recorded by established performance tests (subtest working memory of the TAP, Divided Attention of the test battery for attention testing; Konzentrations‐Leistungs‐Test (KLT‐R); PVT | Bright light exposure results in a better performance for cognitive tasks in older night workers over time. Except for high‐demand tasks, such as sustained attention tasks, bright light induces better performance in working memory and concentration tasks for older night workers. | ||
| 32 subjects (16 females) | Three consecutive simulated night shifts between 22:00‐06:00 | Treatment group: 4‐hour pulse of bright light (3000 lux) between 22:00 and 02:00 on night 1, 1 hour later in night 2, and 2 hours later in night 3 Control group: dim light (300 Iux) | Mood (Der Mehrdimensionale Befindlichkeitsfragebogen and sleepiness on‐shift (SSS) questionnaires and a concentration task, a working memory task, and a divided‐attention task by established performance tests (Konzentrations‐Leistungs‐Test (KLT‐R)); subtest working memory of the TAP; Divided Attention of the test battery for attention testing) | Results indicate that sleepiness and mood did not function as mediators in the prediction of concentration, working memory, and/or divided attention by light exposure. Bright light has a strong direct and independent effect on cognitive performance, particularly on working memory and concentration. | ||
| 35 subjects (9 females) | 6 days of simulated 8‐hour night shifts | Treatment group 1: 5700 lux 3 hours/day Treatment group 2: 12:30 lux 3 hours/day Treatment group 3: < 250 lux All participants wore dark sunglasses while outside during daylight | Core body temperature continuously measured; sleep duration via daily sleep log; mood and fatigue during day assessed using the POMS | During nights 3‐5, most subjects in the high and medium groups (100% and 85%) exhibited phase delays large enough that their body temperature minima occurred within the daytime sleep/dark period. Larger phase shifts were correlated with more sleep and less fatigue. Extremely 'bright' light may not be necessary for circadian adaptation in specific shift work situations. | ||
| 12 subjects (5 females) | All subjects exposed to the five lighting conditions between 20:00 and 08:00 over 5 consecutive weeks | Lighting conditions: 1) complete darkness; 2) unfiltered fluorescent white light (380‐730 nm); 3) fluorescent white light with wavelengths < 480 nm filtered' 4) fluorescent white light with wavelengths < 460 nm filtered; 5) fluorescent white light with wavelengths < 480 partially filtered | During each overnight testing session, objective and subjective neuropsychometric tests and saliva samples were collected every 2 hours. The Toronto Hospital Alertness Test, the Digit Vigilance Test, the SSS, the seven‐item Fatigue Scale self‐report questionnaire and a VAS for subjective mood were employed | Subjective alertness, mood, and errors on an objective vigilance task were significantly less impaired at 08:00 by filtering wavelengths < 480 nm compared with unfiltered nocturnal light exposure. The changes were not associated with significantly increased sleepiness or fatigue compared with unfiltered light exposure. The data suggest that spectral modulation may provide an effective method of regulating the effects of light on physiological processes | ||
| 4 subject (all males) | Two sessions of 11 days of simulated microgravity (6° head down tilt bedrest) with 6‐hour extensions of the wake period on 2 days (12‐hour phase delay) | Bright light (> 3500 Iux) for 5 hours on each of the 2 shift days and the following day at times either expected to accelerate the adjustment to the phase delay (treatment condition) or to have no phase shifting effect (control condition) | Sleep recorded polygraphically; circadian system monitored by recordings of heart rate and body temperature, and by collection of urine (electrolyte and hormone excretion); subjective sleep duration assessed via sleep log | 5‐hour exposures to bright light finishing at the time of the circadian temperature minimum were not more effective at accelerating adjustment to a 12‐hour schedule delay than exposures coinciding with the temperature maximum. We conclude that, while bright light may accelerate adjustment to work‐rest schedule delays, any such effect seems to be largely independent from the timing of the light exposure. No significant effects in polygraphically measured sleep parameters | ||
| 11 subjects (all males) | Three consecutive simulated night shifts (22:00‐06:00); after a 2‐week rest, a second run of three consecutive night shifts | Treatment group: lighting environment (800 lux) with reduced short‐wavelength components Control group: unfiltered bright light (800 lux) environment | Circadian markers (including urinary aMT6s), symptoms of lassitude, and personal mood; fatigue (and other parameters) assessed via mood rating inventory before and after the shift; Vienna Test System, including performance testing (reaction time analysis), vigilance testing and evaluation of attentiveness (Continous Attention) | Mood rating inventories did not result in differences in the subjective perception between the two lighting environments with respect to the dimensions of 'activity', 'concentration', 'deactivation', and 'fatigue'. In addition, changes in signs of vigour and weariness in the course of each night of the study were equally pronounced in test light and bright light. | ||
| 71 subjects (29 females) | after ≥ 2 night shifts in the field, 1 simulated night shift in the laboratory | Treatment group: blue‐enriched white light (17,000 K, 150 lux) from 2300‐0700 Control group: continued background white light (4000 K, 150 lux) | Habitual sleep‐wake patterns monitored for 1‐3 weeks via diaries and actigraphy; urine collected for aMT6s; assessments via KSS, PVT, polysomnography and mood | Exposure to blue‐enriched light was not associated with significant improvements in PVT performance, or electro‐oculogram correlates of alertness. During the biological night, however, blue‐enriched light was associated with improved subjective alertness. | ||
| 30 subjects (19 females) | 2‐night protocol | Lighting conditions: | Sleep estimated with actigraphy; subjective sleepiness (VAS); throughout night 2, the MSLT, SALT performance | 4‐hour exposure to bright light significantly increased MSLT scores and improved SALT performance during the early morning hours on the night following bright‐light exposure. No significant effects were noted with a 2‐hour exposure. | ||
| 19 subjects (5 females) | no less than 1 week between the interventions 1‐3 | Interventions: | Body temperature and psychomotor vigilance (PVT); Saliva collected before and after light treatment for melatonin assay | Temperature, subjective alertness and PVT performance decreased significantly across the night. BL significantly suppressed melatonin, but did not improve subjective alertness or PVT performance. SD markedly increased incidents, accidents, and standard deviation of lane position. BL compared to DL did not improve performance during the first 22 min circuit, but across the 2 circuits BL significantly attenuated the effect of time on task on incidents and accidents. | ||
| Light and glasses interventions | ||||||
| Reference | Study participants | Shift system | Intervention | Key endpoints | Key results | |
| 50 subjects (19 females) | 8 consecutive simulated night shifts | Four groups in 2 x 2 design: light (bright, dim); goggles (yes, no); exposure to bright light (circa 5000 lux) for 6 hours on the first two night shifts; dim light < 500 lux | Core body temperature continuously measured; sleep duration via daily sleep log; mood and fatigue assessed using the POMS | Both bright light and goggles were significant factors for producing circadian rhythm phase shifts. The combination of bright light plus goggles was most effective; the combination of dim light and no goggles was least effective. Larger temperature‐rhythm phase shifts were associated with better subjective daytime sleep, less subjective fatigue and better mood. There was no significant main effect of goggles on sleep duration, but the main effect of light and the interaction of light and goggles were not significant. | ||
| 24 subjects (14 females) | 3 simulated night shifts (2300‐0700), 2 days‐off + 4 more night shifts | Treatment group: five 15 minute bright light pulses during night shifts + sunglasses when outside + sleep in dark bedrooms at scheduled times after night shifts and on days‐off + outdoor afternoon light exposure (the “light brake”) Control group: remained in normal room light during night shifts + lighter sunglasses + unrestricted sleep and outdoor light exposure | DLMO; daily sleep log + actigraphy, alertness on‐shift, total sleep time assessed using sleep logs and actigraphy; reaction time (SRT) test | The final DLMO of the experimental group was close to our target compromise phase position, and significantly later than the control group. Experimental subjects performed better than controls, and slept for nearly all of the allotted time in bed. Controls demonstrated pronounced performance impairments late in the night shifts, and exhibited large individual differences in sleep duration. | ||
| 31 subjects (17 females) | 3 simulated night shifts (23:00‐07:00) + 2 days‐off | Two treatment groups: intermittent bright light during night shifts (75 and 120 min/night) + dark sunglasses when outside + sleep in dark bedrooms at scheduled times after night shifts and on days‐off + outdoor light exposure upon awakening from sleep Control group: dim room light during night shifts + lighter sunglasses + unrestricted sleep and outdoor light | DLMO; daily sleep log + actigraphy; simple reaction time (SRT) test | After the days‐off, the DLMO of the experimental groups was in a good position to reach the target after subsequent night shifts with bright light. The DLMO of the control group changed little from baseline. Experimental subjects performed better than control subjects during night shifts on a reaction time task. | ||
| 19 subjects (11 females) | 3 simulated night shifts (23:00‐07:00); 2 days‐off, 4 night shifts + 2 days‐off | Treatment group: four 15‐min BL pulses during night shifts + sunglasses when outside + sleep in dark bedrooms at scheduled times + outdoor afternoon light (“light brake”) Control group: remained in normal room light during night shifts + lighter sunglasses + unrestricted sleep and outdoor light | DLMO; daily sleep log + Actiwatch‐L; Automated Neurophysiological Assessment Metrics test battery (SRT reported) | The final DLMO of the experimental group was close to the target of 03:00, and later than the control group. Subjects who phase‐delayed (whether in the experimental or control group) close to the target phase performed better during night shifts. | ||
| aMT6s: 6‐sulfatoxymelatonin | ||||||
| Nap interventions | ||||||
| Reference | Study participants | Shift system | Intervention | Key endpoints | Key results | |
| 20 subjects (6 females) | Subjects awakened at 07:00 of the experimental day and were prohibited from sleeping until the end of experiment except for the nap (01:00‐02:00) in the nap group Participants remained awake for 20 hours ‐ performing cognitive tasks at 21:00, 02:00 and 03:00; experimental chamber below 150 lux, 30 lux during cognitive task period, 0 lux during the nap | Nap condition: 1‐hour nap 01:00‐02:00 Rest condition:1‐hour awake‐rest period 01:00‐02:00 | Sleep logs + Actiwatch‐L + polysomnography + EEG; stimulus‐response compatibility (arrow‐orientation task, reaction time | Behavioural performance and amplitude of the error‐positivity declined after midnight (i.e. 02:00 and 03:00) compared with the 21:00 task period in both groups. During the task period starting at 03:00, the participants in the awake‐rest condition reported less alertness and showed fewer correct responses than those who napped. | ||
| 12 subjects (all males) | 3 consecutive nights and 2 days in the laboratory for 2 consecutive weeks (= session 1+2) | Session 1: 4‐hour afternoon nap + caffeine at 01:30 and 07:30 Session 2: four 1‐hour naps during the night + placebo In both sessions pills (placebo or caffeine) were administered at 01:30, 07:30, 13:30, 19:30) | MSLT, EEG; performance and mood were assessed with repeated batteries of measures (logical reasoning, WAlS, computer‐modified Williams Word Memory Test of immediate free recall, visual vigilance, subjective sleepiness/alertness, POMS, oral temperature) across the 24‐hour operation | After an afternoon nap, subjects had increased objective and subjective alertness, increased oral temperature, and increased performance on complex tasks like logical reasoning and correct additions when compared to the condition that allowed four night‐time naps. | ||
| 24 subjects (all males) | 3 consecutive nights and 2 days in the Iaboratory | Nap condition 1: 16:00‐20:00 prior to a 24‐hour period of sleep loss Nap condition 2: as in 1 + 200 mg caffeine at 01:30 and 07:30 All subjects received pills at 01:30, 07:30, 13:30, 19:30. For all subjects, the pills received at 13:30 and 19:30 were placebos | MSLT, EEG; visual vigilance, subjective sleepiness/alertness, POMS; performance and mood were assessed with repeated batteries of measures (logical reasoning, WAlS, computer‐modified Williams Word Memory Test of immediate free recall | Performance tests all indicated maintenance of baseline performance Ievels in the caffeine group after administration of caffeine, while performance declined in the placebo group. The combination of nap and caffeine was able to maintain alertness and performance at very close to baseline Ievels throughout a 24‐hour period without sleep. | ||
| 140 subjects (all males) | 4 consecutive nights and 3 days in the laboratory | 1) Nap condition: nap at 12:00, 16:00, 18:00 or not at all 2) Caffeine condition: single 400 mg dose of caffeine at 01:30 each night or repeated doses of 150 mg or 300 mg every 6 hours starting at 01:30 on the 1st night of sleep loss 3) Placebo condition: no‐nap and placebo administered every 6 hours on the repeated caffeine schedule was run for 1) and 2) During the sleep‐loss period, all subjects were administered placebo capsules every 6 hours starting at 01:30 | MSLT, EEG; performance and mood were assessed with repeated batteries of measures (logical reasoning, WAlS, computer‐modified Williams Word Memory Test of immediate free recall, visual vigilance, subjective sleepiness, POMS, oral temperature) across the 24‐hour operation | Naps provided Ionger and less graded changes in performance, mood and alertness than did caffeine, which displayed peak effectiveness and loss of effect within about 6 hours. Neither nap nor caffeine conditions could preserve performance, mood, and alertness near baseline Ievels beyond 24 hours, after which Ievels approached those of placebo. | ||
| 12 subjects (all males) | 3 consecutive nights and 2 days in the Iaboratory | Nap condition 1: 4‐hour afternoon nap Nap condition 2: four 1‐hour naps during the night Nap condition 3: 0.125 mg of triazolam prior to a prophylactic 4‐hour nap before the 24‐hour operation | MSLT, EEG; performance and mood were assessed with repeated batteries of measures (logical reasoning, WAlS, computer‐modified Williams Word Memory Test of immediate free recall, visual vigilance, subjective sleepiness/alertness, POMS, oral temperature) across the 24‐hour operation | When a series of 1‐hour naps was taken during the normal night period, oral temperature and psychomotor performance also declined. However, performance was relatively improved on the following evening. In contrast, with an effective 4‐hour prophylactic nap, performance remained near baseline Ievels across the night. Fatigue increased over the course of the study, the increases were similar in each group. | ||
| 18 subjects (all males) | 3 separate 38‐hour periods of continuous wakefulness, each separated by 10 hours of recovery sleep | Nap condition 1: 2‐hour evening nap (at 21:00) induced with 10 mg zolpidem tartrate Nap condition 2: 2‐hour nap (at 21:00) with placebo; Condition 3: 2‐hour rest break with no sleep Following 1) or 2) or 3), subjects remained awake for 23 additional hours | Sleepiness on‐shift, alertness (and others) assessed using VAS; Repeated Test of Sustained Wakefulness; polysomnography of naps; POMS; multiattribute task battery | Results indicated the effectiveness of prophylactic naps for sustaining mood, alertness, and performance throughout the final 23 hours of a 39‐hour period of sustained operations. Both napping conditions attenuated the decrements normally associated with total sleep deprivation, but the zolpidem nap was the most effective because subjects obtained the most sleep. | ||
| 59 subjects (31 females) | 4‐day protocol with 3 early morning shifts (07:00‐15:00) followed by a rapid rotation to the midnight shift (23:00‐07:00) | Nap condition 1: long nap of 2 hours Nap condition 2: a short nap of 45 minutes Nap condition 3: no‐nap condition | Wrist activity monitors; sleepiness on‐shift via Stanford Sleepiness Scale; Air Traffic Scenarios Test; the Bakan, a test of vigilance | While sleepiness increased across the midnight shift for all groups, ratings were generally lower for the long nap condition and were lower for males in the short nap condition. Both cognitive performance and subjective measures of sleepiness supported the use of naps during the midnight shift. | ||
| 12 subjects (all males) | Sleep of 4 hours during the preceding night, work during the day and then kept awake (except for naps) in the laboratory from 17:00 to 08:00 the following morning | Nap condition 1: one‐hour nap (21:00h) Nap condition 2: one‐hour nap (04:30h) Nap condition 3: no‐nap | EEG, EOG; self‐ratings of sleepiness on‐shift, sleep latency tests; single choice visual reaction time task | Clear positive effects of naps (especially the 04:30 nap) on performance. The sleep latency measurements showed similar, but less clear tendencies, while ratings of sleepiness did not differentiate between conditions. | ||
| 30 subjects (18 females) | 3‐day laboratory study including one baseline sleep (22:00‐07:00) and one experimental night | Nap condition 1: total sleep deprivation (NO‐NAP) Nap condition 2: 10‐min nap (10‐NAP) Nap condition 3: 30‐min nap (30‐NAP) Nap opportunities ended at 04:00 | Fatigue scale, sleepiness scale, and self‐rated performance scale; psychomotor vigilance test (PVT‐B), digit‐symbol substitution task | In the 30‐NAP condition, performance immediately deteriorated from pre‐nap and was still worse at 47 min postnap. A 10‐min ‐ but not a 30‐min ‐ night‐time nap had minimal sleep inertia and helped to mitigate short‐term performance impairment during a simulated night shift. | ||
| 21 subjects (12 females) | 3‐day laboratory study; keeping subjects awake for 27 hours for 1 simulated night shift; 40‐min York highway driving task at 07:15 to simulate the commute | Nap condition 1: total sleep deprivation (NO‐NAP) Nap condition 2: 10‐min nap ending at 04:00 + a 10‐min pre‐drive nap ending at 07:10 (10‐NAP) | Polysomnography; SP‐Fatigue; PVT‐B | In the 10‐NAP condition, PVT‐B performance was worse after the nap (07:12) compared to before the nap (06:30); no change across time was found in the NO‐NAP condition. SP‐Fatigue and driving performance did not differ significantly between conditions. | ||
| 79 subjects (27 females) | 10‐day sleep restriction protocol, assignment to one of 18 sleep regimens | Nap condition 1: restricted diurnal sleep + nocturnal nap (0.4‐hour, 0.8‐hour, 1.2‐hour, 1.6‐hour, 2.0‐hour or 2.4‐hour time in bed Nap condition 2: restricted diurnal sleep + no‐nap | Polysomnography; total sleep time (sleep duration) | Napping on the night shift does not degrade subsequent daytime SE above and beyond SE reduction associated with daytime sleep or increasing overall time in bed | ||
| 12 subjects (all males) | 3‐day experiment with 1 simulated night shift (22:00–08:00 ) and subsequent day (11:30–17:30) and night sleep (00:00–07:00) | Nap conditions: 1) 00:00–01:00 (early 60 min; E60); 2) 00:00–02:00 (E120) 3) 04:00–05:00 (late 60 min; L60) 4) 04:00–06:00 (L120) 5) no‐nap | Polysomnography; rectal temperature; VAS for sleepiness; visual vigilance test; set of tasks, including English transcription task + a performance test battery | Posthoc analyses showed significantly longer RTs and more lapses following the L60 nap compared with no‐nap. In contrast, there was no significant difference in sleepiness between the L60, or any of the other nap conditions, and the no‐nap condition. Findings suggest the effect of sleep inertia on visual vigilance test performance was profound in the L60 condition, although no significant effects on sleepiness were self‐reported by VAS. | ||
| 22 subjects (13 females) | Simulated night shift environment with a 2‐hour sleep in the afternoon from 15:00–17:00 hours, followed by nap condition 1 or 2 in 02:30–03:00 | Nap condition 1: 30‐min nap Nap condition 2: no‐nap | Sleepiness on‐shift (SSS, KSS), fatigue and vigour subscales of the POMS, and the VAS for sleepiness; symbol–digit substitution task, the letter cancellation task, and the PVT | The 30‐min nap resulted in some impairment of subjective alertness for a brief period (up to 30 min) immediately following the nap when compared to the no‐nap condition. Following this brief period, alertness improved by the 30‐min nap from 04:00 until the end of the testing period at 07:00. | ||
| 8 subjects (1 female) | Simulated night shift; alertness and performance testing sessions + 2‐hour runs in a driving simulator | From 14:00 to 17:00 Nap condition 1: sleep Nap condition 2: sedentary activities | Polysomnography, subjective fatigue and sleepiness on‐shift via VAS, sleep quality (Sleep Quality Questionnaire); EEG; 3 computerised tests from the Walter Reed performance assessment battery | In the nap condition, the subjects showed lower subjective sleepiness and fatigue, as measured by VAS, and faster reaction times and less variability on psychomotor performance tasks. | ||
| 8 subjects (all male) | 5 Nap conditions between a previous full night's sleep and a day sleep on the day following the night | Nap conditions: a 2‐hour nap between: 1) 22:00‐00:00 (N1) 2) 02:00‐04:00 (N2) 3) 04:00‐06:00 (N3) 4) 06:00‐08:00 (N4) 5) no‐nap(Control group) | EEG, EOG, EMG, ECG, respiratory movement; rectal temperature, oral temperature; flicker fusion frequency, sleepiness, fatigue complaints | Decrease in rectal temperature during the night was more marked for conditions N2, N3 and N4, with a lesser extent of individual differences, than for the Control group and N1. The self‐evaluation of the sleep depth and the rapidness of sleep onset correlated highly with sleep parameters. N3 and N4 were evaluated to have resulted in a better sleep than N1. | ||
| 6 subjects (all female) | 3 x 3 days experimental conditions Day 1+2 daily activities Day 3: awake from 00:00 until 10:00 with a nap period which started at 03:00 | On each of 3 days: nap condition 2: 1‐hour nap nap condition 3: 2‐hour nap | Fatigue Feelings Scale, SSS; EEG, EOG and EMG during the naps | A 1‐hour nocturnal nap gave significantly smaller scores on two subscales of Fatigue Feelings Scale during early morning hours than no napping. A 2‐hour nocturnal nap, which contained significantly Ionger duration of Slow Wave Sleep than a 1‐hour nocturnal nap, did not differ from a 1‐hour nocturnal nap in decreasing scores of fatigue feelings during these hours | ||
| 24 subjects (all males) | 5 nights experimental design with one no‐nap condition before the night tests + a nap condition that comprised the 1‐hour nap followed by the test sessions | Nap condition 1: 1‐hour nap at 00:00 Nap condition 2: 1‐hour nap at 03:00 | Sleep inertia (spatial memory) and logical reasoning tasks | No effects on accuracy, and no circadian effects of napping were found. Pooled data of intervention groups showed that the performance in the 1‐hour nap condition exhibited significant reductions of speed immediately following awakening, when compared with no‐nap, reflecting sleep inertia effects. | ||
| Study A: 10 subjects (7 females); Study B: 12 subjects (5 females) | Study A&B: Two night‐time work periods separated by at least three normally timed nights of sleep | Study A ‐ Nap condition: 3‐hour nap opportunity on 1 night between 20:00 and 23:00 ; Study B ‐ Caffeine condition: 4 mg/kg caffeine on 1 night | Polysomnography, sleepiness on‐shift SSS, VAS; alertness (computer‐driven simulated assembly line task) | Performance and subjective alertness improved after both a 2·3‐hour evening nap or ingestion of caffeine prior to the work shift. Although neither napping nor caffeine countered the strong circadian influence on performance and alertness in the early morning hours, both strategies attenuated their sharp decline. | ||
| 13 subjects (all male) | Simulated shift work schedules of 9 consecutive days: 2 day (08:00‐16:00) + 3 night (22:00‐08:00) + 3 day shifts; between experimenting with nap condition 1 and 2, rest period of 1 week | Nap condition 1: nap from 02:00‐04:00 Nap condition 2: no‐nap | Fatigue and anxiety questionnaire, heart rate variability, oral temperature, salivary cortisol; two performance tasks: typing figures + performing mental arithmetic; CFF, 3‐choice reaction time | Task performances decreased and subjective fatigue and anxiety increased in proportion to the length of time worked in both M‐types (morningness) and E‐types (eveningness) who had no‐nap. In M‐types, these changes were significantly suppressed by the nap on the first night of duty. Changes for E‐types were smaller than those for M‐types in terms of task performance and psycho‐physiological parameters. | ||
| 6 subjects (all male) | 5 nap conditions on‐shift for each participant; 3 consecutive days with one night shift (22:00‐08:00) followed by daytime sleep and night sleep; at least 5 days between the experiments | Nap conditions: | Polysomnography, questionnaire on subjective fatigue, heart rate variability, rectal temperature; performance task (typing text) and tests (choice reaction time test, a logical reasoning test, a vigilance test, and a CFF test) | Sleep latency was shorter and sleep efficiency was higher in the nap in L60 and L120 than that in E60 and E120. Performance was somewhat improved by taking a 2‐hour nap later in the shift, but deteriorated after a one‐hour nap. | ||
| 24 subjects (15 females) | Simulated night‐shift schedules with at least one week intervening between conditions | 2‐hour afternoon sleep opportunity + one of two‐nap conditions: 1) 30‐min night‐nap; 2) no night‐nap | Polysomnography, subjective sleepiness on‐shift (SSS, KSS, VAS), objective sleepiness on‐shift (sleep latency tests); objective performance (Symbol Digit Substitution Task) + reaction time (PVT) | Subjective sleepiness was less correlated with objective sleepiness and objective performance when participants were given a 30‐min night nap. However subjective sleepiness and reaction time performance was strongly correlated in both conditions, and there was no significant difference between the nap and no‐nap conditions. | ||
| CFF: Critical Flicker Fusion Frequency RT: Reaction Time SE: Standard Error WAIS: Wechsler Adult Intelligence Scale | ||||||
| Other interventions | ||||||
| Reference | Study participants | Shift system | Intervention | Key endpoints | Key results | |
| 33 subjects (17 females) | Simulated night work study with 8 consecutive night shifts followed by daytime sleep/dark periods | 1) Intermittent bright light (6 pulses, 40‐min long each, at 5000 lux) versus dim light (< 500 lux, 20 min ) 2) Intermittent exercise (6 bouts, 15‐min long each, at 50%‐60% of maximum heart rate) versus no exercise; bright light and exercise interventions during the first 6 hours of the first 3 night shifts | Core temperature; sleep duration (sleep log) | Intermittent bright light groups had significantly larger phase delays than dim‐light groups, and 94% of subjects who received bright light had phase shifts large enough for the individual rectal temperature minimum to reach daytime sleep. Exercise did not affect phase shifts; neither facilitating nor inhibiting phase shifts produced by bright light. During the last 4 days of the study, subjects in the bright light groups slept more (within the scheduled sleep/dark periods) and napped less than those in the dim light groups. | ||
| 43 subjects (all male) | 5‐day night work study involving a 10‐hour phase delay of the work/rest cycle | 1) Bright white light (3500‐4300 Iux) versus dim red light (200‐300 Iux) from 22:00‐02:00 each night 2) Inactive LEET versus active LEET therapy for 20 min prior to the daytime sleep periods | Polysomnography; circadian phase shifting evaluated via core body temperature + urinary 6‐SM excretion; indirect measurement of alertness: complex reaction time, simple reaction time; subjective alertness (VAS); performance examined with a cognitive performance assessment battery | 6‐SM data indicate that bright light exposure increased the phase delay seen in this circadian rhythm in the 3 days after the work/rest schedule shift. Bright light treatment shows evidence of improving accuracy on a broad range of cognitive performance, without compensatory decreases in speed. LEET administration before the daytime sleep periods showed little evidence of affecting either performance or 6‐SM. Complex reaction time: bright light‐exposed subjects performed significantly better than did dim light‐exposed on all three postshift testing sessions, with the largest difference the second postshift night (Day 3). Bright light subjects started out slightly less alert at baseline, dropped less the first night after the shift, and rose much more the second night after the shift. On the last night both groups dropped to a similar level. | ||
| 45 subjects (all male) | 5‐day night work study with subjects working and being tested during three 9‐hour night shifts from 18:00‐03:00 | 1) Bright light (3500‐4300 lux) or dim light (200‐300 lux) from 22:00‐02:00 each night 2) LEET for 20 min prior to daytime sleep 3) Both bright light) + LEET) 4) Placebo treatments | Polysomnography; 6‐SM, VAS of sleepiness; cognitive tests in the performance assessment battery, simple and complex reaction times (simple reaction times + complex reaction times) trials, word memory task | Bright light accelerated phase delay of the circadian melatonin rhythm after the work‐rest schedule shift. Further, subjects who received bright light had greater total sleep time and improved sleep continuity. Some minor improvements in cognitive performance were produced by light treatments but not by LEET. | ||
| 28 subjects (all male) | 6‐hour night‐time flight in a flight simulator; a structured sleep/wake schedule for three nights just prior to the study; obtaining their typical amount of night‐time sleep between the hours of 22:00 and 08:00 | Treatment condition: 5 breaks spaced hourly during cruise Control condition: 1 break in the middle of cruise | Questionnaire + interview; EEG/EOG, subjective sleepiness (KSS, VAS); vigilance performance (PVT), subjective sleepiness ratings, electrophysiological measures of drowsiness, continuous video | The treatment group showed significant reductions for 15 min postbreak in slow eye movements, theta‐band activity, and unintended sleep episodes compared with the control group. The treatment group reported significantly greater subjective alertness for up to 25 min postbreak. There was no evidence of objective vigilance performance improvement at 15‐25 min postbreak. | ||
| 35 subjects (14 females) | 10‐day shift work simulation (4 day shifts = 07:00‐15:00 and 3 night shifts = 23:00‐07:00) | 1) Morning Sleep (08:00‐16:00) + phase‐delaying light exposure (23:00‐03:00) 2) Evening Sleep (14:00‐22:00) + phase‐advancing light exposure (03:00‐07:00) | Polysomnography; dim light salivary melatonin onset; RT in the PVT; subjective alertness via the KSS | Analysis of the dim light salivary melatonin onset indicated a modest but significant circadian realignment in both sleep groups. Daytime sleep efficiency and total sleep time did not differ between them or from their respective baseline sleep. On the final night shift, the evening sleep subjects had fewer episodes of attentional impairment and quicker responses on the PVT than their morning sleep counterparts. | ||
| 8 subjects (all male) | Simulated night work (22:00‐08:00) with an hourly exercise consisting of 30 min task, 15 min test and 15 min break | Treatment condition: hourly exercise (3 min during breaks) Control condition: no exercise during breaks | Heart rate variability; a VAS for subjective fatigue + sleepiness, psychomotor vigilance test (PVT) | Work performance in the last 10 min of each 30‐min task was better under the treatment condition than under the control condition. During the second half of the test period, exercise showed an effect on sustained attention. Exercise was not effective in reducing subjective fatigue and sleepiness. | ||
| 17 subjects (all male) | In a temporal isolation facility with dim light conditions (< 10 lux), sleep schedules were phase‐advanced by 8 hours from habitual sleep times for 4 days, followed by a free‐run session for 6 days with no time cues. During the shift schedule, the treatment and control groups performed physical exercise or not | Treatment group: physical exercise with a bicycle ergometer in the early and middle waking period for 2 hours each Control group: sat on a chair at those times | Polysomnography, bed sensor, wrist activity + light intensity (Actiwatch); plasma melatonin, continuous rectal temperature | Sleep‐onset on the first day of free‐run in the exercise group was significantly phase‐advanced from that in the control and from the baseline. The circadian melatonin rhythm was significantly phase‐delayed in both groups, showing internal desynchronisation of the circadian rhythms. | ||
| EEG: electroencephalogram | ||||||
| Cross‐over trial | Outcome | Description of ANOVA strategy | ANOVA results | Correlation coefficient (CC) | Estimates of P values by CC (see Unit of analysis issues) |
| Sleepiness on‐shift overall | "A two‐factor repeated measurement ANOVA was used. Factors: 1) treatment; 2) time (of night measurement) P values were corrected for sphericity (using the Huynh‐Feldt coefficient). Significance was defined at P < 0.05." | Period 1 : Time of night measurement × Treatment: (F = 8.76; P < 0.001) Time of night measurement: (F = 40.98; P < 0.001) Period 2 : Time of night measurement × Treatment: (F = 5.124, P < 0.01) Time of night measurement: (F = 9.872; P < 0.001) | 0.9 0.7 0.0 | < 0.0001 < 0.0001 < 0.0001 | |
| Sleepiness on‐shift overall | "Using the paired t‐test, we compared subjective sleepiness between two conditions (with bright light and with normal light). A repeated measure ANOVA showed interaction between independent variables in this study. The level of significance was defined at P < 0.05. (examined treatment effect, carry‐over effect, and period effect)." | The findings for treatment effect, period effect and carry‐over effect of the study population: Treatment effect: t df P value –21.95 89 0.001 | 0.9 0.7 0.0 | < 0.0001 < 0.0001 < 0.0001 | |
| Sleep efficiency (actigraph) | "The data obtained during night work were submitted to ANOVA for repeated measures, with correction for unequal variances according to Huynh and Feldt (Huynh 1976). The two‐way ANOVA included the factors of condition (Bright light/Normal light) and day (15 examined night shifts). A third factor, time of day, was added for variables with several measures during 1 day (for melatonin and KSS). A fourth factor, week (three studied night work weeks), was added to give a more detailed analysis of KSS ratings. Posthoc mean comparisons were carried out with contrasts. KSS ratings during the night shift week (means of 3 weeks): As some workers showed missing data on Fridays, this day was omitted from the analysis. To reflect the many data points, a four‐way analysis of variance including the factors of condition, week (3 weeks), night (night 1–4 of each week) and time of day, were used." | Condition: NS (no P value reported) Cond./Night Interaction: NS | 0.9 0.7 0.0 | < 0.0001 0.02 0.20 | |
| Total sleep time‐main sleep (bed time; final awakening) | Condition: NS (no P value reported) Cond./Night Interaction: NS | 0.9 0.7 0.0 | 0.01 0.14 0.43 | ||
| Total sleep time‐24‐hr sleep | Condition: (P < 0.05) Cond./Night Interaction: NS | 0.9 0.7 0.0 | < 0.0001 0.04 0.24 | ||
| Sleepiness on‐shift KSS (overall) | Sleepiness: "No main effects were obtained except for time of day showing an increase of sleepiness throughout the night shift (F = 36.46; P = 0.0001; df = 3/45). A significant interaction was obtained (Fig. 2) for the interaction of condition, night and time (F = 2.39; P = 0.0365; df = 9/135). Sleepiness was significantly reduced in the bright light condition at 02:00 hours on Tuesday; at 04:00 hours on Monday, Tuesday and Thursday; and at 06:00 hours on Tuesday and Thursday as shown by the posthoc mean comparisons. The reduction of sleepiness in the bright light condition was further emphasised by the significant interaction of condition and time of day (F = 3.07; P = 0.0429; df = 3/45). The interaction of week + light was insignificant." | 0.9 0.7 0.0 | < 0.0001 0.06 0.31 | ||
| Sleepiness on‐shift KSS (postintervention) | 0.9 0.7 0.0 | < 0.0001 0.09 0.35 | |||
| Sleepiness on‐shift – Reaction time – postintervention (03:00 and 04:00 and 05:00 and 06:00) | "For each of the dependent variables, a set of 2 x 2 repeated measures ANOVAs were carried out. In order to control for interindividual variability in baseline performance, scores for all four dependent variables (response speed, M10%RT, lapse frequency and subjective sleepiness) were expressed relative to the baseline test score obtained at 00:00 hours, calculated by subtracting the 00:00 hours’ value from each hourly score. That is, 00:00 hours scores were zeroed and subsequent scores were relative to this point. Relative scores at each hour of shift were then averaged to obtain the mean relative performance across participants. In order to analyse specific time differences in the dependent variables after the nap, parallel ANOVAs were carried out with different levels entered for the time factor (i.e. before nap and 03:00 hours; before nap and 04:00 hours; before nap and 05:00 hours; before nap and 06:00 hours). Before‐nap mean scores were calculated from a combined average of 00:00, 01:00 and 02:00 hours data. As the aim was to compare nap and no‐nap conditions after the nap, the statistics of interest were the nap × time interactions. Significant interactions were observed for response speed at 04:00 and 06:00… and for subjective sleepiness at 03:00 and 04:00. … Participants therefore had faster reaction times, and less subjective sleepiness, after the nap." | Before nap vs 06:00 Nap: P = 0.002 Time: P = 0.011 N x T : P = 0.012 | 0.9 0.7 0.0 | < 0.0001 0.02 0.21 | |
| Sleepiness on‐shift – Subjective sleepiness score – postintervention (03:00 and 04:00 and 05:00 and 06:00) | Before nap vs 06:00 Nap: P = 0.16 Time: P = 0.201 N x T : P = 0.095 | 0.9 0.7 0.0 | < 0.0001 < 0.0001 0.05 | ||
| df: Degrees of Freedom KSS: Karolinska Sleepiness Scale M10%RT: Mean of the fastest 10% reaction time NS: Not Significant RT: Reaction Time | |||||
| Outcome or subgroup title | No. of studies | No. of participants | Statistical method | Effect size |
| 1 Sleepiness during the night shift, overall, Stanford Sleepiness Scale (Scale: 1‐7) Show forest plot | 2 | Mean Difference (Random, 95% CI) | ‐0.83 [‐1.31, ‐0.36] | |
| 2 Sleepiness during the night shift, overall, Karolinska Sleepiness Scale (Scale: 1‐9) Show forest plot | 1 | Mean Difference (Fixed, 95% CI) | Totals not selected | |
| 3 Sleepiness during the night shift, postintervention only, Stanford Sleepiness Scale (Scale: 1‐7) Show forest plot | 1 | Mean Difference (Fixed, 95% CI) | Totals not selected | |
| 4 Sleepiness during the night shift, post‐intervention only, Karolinska Sleepiness Scale (Scale: 1‐9) Show forest plot | 1 | Mean Difference (Fixed, 95% CI) | Totals not selected | |
| 5 Total sleep time, next day (Actigraph ‐ hours) Show forest plot | 1 | Mean Difference (Fixed, 95% CI) | Totals not selected | |
| 5.1 Main sleep time only | 1 | Mean Difference (Fixed, 95% CI) | 0.0 [0.0, 0.0] | |
| 5.2 24‐hr sleep time, including naps | 1 | Mean Difference (Fixed, 95% CI) | 0.0 [0.0, 0.0] | |
| 6 Sleep efficiency, next day (Actigraph ‐ %) Show forest plot | 1 | Mean Difference (Fixed, 95% CI) | Totals not selected | |
| Outcome or subgroup title | No. of studies | No. of participants | Statistical method | Effect size |
| 1 Sleepiness during the night shift (5‐min. Reaction Time Test ‐ milliseconds) Show forest plot | 1 | Mean Difference (Fixed, 95% CI) | Totals not selected | |
| 2 Total sleep time, next day (Actiwatch ‐ hours) Show forest plot | 1 | Mean Difference (Fixed, 95% CI) | Totals not selected | |
| 3 Sleep onset latency, next day (Actiwatch ‐ minutes) Show forest plot | 1 | Mean Difference (Fixed, 95% CI) | Totals not selected | |
| 4 Sleep efficiency, next day (Actiwatch ‐ %) Show forest plot | 1 | Mean Difference (Fixed, 95% CI) | Totals not selected | |
| Outcome or subgroup title | No. of studies | No. of participants | Statistical method | Effect size |
| 1 Sleepiness during the day shift (Karolinska Sleepiness Scale) Show forest plot | 1 | Mean Difference (Fixed, 95% CI) | Totals not selected | |
| 2 Sleep quality, next night (Visual Analogue Scale ‐ 0 to 10) Show forest plot | 1 | Mean Difference (Fixed, 95% CI) | Totals not selected | |
| Outcome or subgroup title | No. of studies | No. of participants | Statistical method | Effect size |
| 1 Total sleep time, next night (sleep log ‐ hours) Show forest plot | 1 | Mean Difference (IV, Fixed, 95% CI) | Totals not selected | |
| 2 Sleep onset latency, next night (sleep log ‐ minutes) Show forest plot | 1 | Mean Difference (IV, Fixed, 95% CI) | Totals not selected | |
| Outcome or subgroup title | No. of studies | No. of participants | Statistical method | Effect size |
| 1 Sleepiness during the day shift, days (5‐min. Reaction Time Test ‐ milliseconds) Show forest plot | 1 | Mean Difference (Fixed, 95% CI) | Totals not selected | |
| 2 Total sleep time, next night (Actiwatch ‐ hours) Show forest plot | 1 | Mean Difference (Fixed, 95% CI) | Totals not selected | |
| 3 Sleep onset latency, next night (Actiwatch ‐ minutes) Show forest plot | 1 | Mean Difference (Fixed, 95% CI) | Totals not selected | |
| 4 Sleep efficiency, next night (Actiwatch ‐ %) Show forest plot | 1 | Mean Difference (Fixed, 95% CI) | Totals not selected | |
| Outcome or subgroup title | No. of studies | No. of participants | Statistical method | Effect size |
| 1 Sleepiness during the night shift (Psychomotor Vigilance Test: Median Reaction Time ‐ milliseconds) Show forest plot | 1 | Mean Difference (IV, Fixed, 95% CI) | Totals not selected | |
| Outcome or subgroup title | No. of studies | No. of participants | Statistical method | Effect size |
| 1 Total sleep time, next night (Actigraph ‐ hours) Show forest plot | 1 | Mean Difference (Fixed, 95% CI) | Totals not selected | |
| 2 Sleep onset latency, next night (Actigraph ‐ minutes) Show forest plot | 1 | Mean Difference (Fixed, 95% CI) | Totals not selected | |
| 3 Sleep efficiency, next night (Actiwatch ‐ %) Show forest plot | 1 | Mean Difference (Fixed, 95% CI) | Totals not selected | |
| Outcome or subgroup title | No. of studies | No. of participants | Statistical method | Effect size |
| 1 Sleepiness during the night shift, postintervention (Psychomotor Vigilance Test ‐ Mean Reaction Time ‐ milliseconds) Show forest plot | 2 | Mean Difference (Random, 95% CI) | ‐11.87 [‐31.94, 8.20] | |
| 2 Sleepiness during the night shift, postintervention (Karolinska Sleepiness Scale) Show forest plot | 2 | Mean Difference (Fixed, 95% CI) | Totals not selected | |
| 2.1 Cross‐over design | 1 | Mean Difference (Fixed, 95% CI) | 0.0 [0.0, 0.0] | |
| 2.2 Parallel design | 1 | Mean Difference (Fixed, 95% CI) | 0.0 [0.0, 0.0] | |
| 3 Sleepiness during the night shift, postintervention (Psychomotor Vigilance Test (Slowest 10% reciprocal reaction time ‐ milliseconds ) Show forest plot | 2 | Mean Difference (Fixed, 95% CI) | Totals not selected | |
| 3.1 Cross‐over design | 1 | Mean Difference (Fixed, 95% CI) | 0.0 [0.0, 0.0] | |
| 3.2 Parallel design | 1 | Mean Difference (Fixed, 95% CI) | 0.0 [0.0, 0.0] | |
| 4 Sleepiness during the night shift, postintervention (Subjective Sleepiness Score ‐ "0 to 100") Show forest plot | 1 | Mean Difference (Fixed, 95% CI) | Totals not selected | |
| Outcome or subgroup title | No. of studies | No. of participants | Statistical method | Effect size |
| 1 Sleepiness during the night shift, postintervention (Visual Analogue Scale ‐ 0 mm to 100 mm) Show forest plot | 1 | Mean Difference (IV, Fixed, 95% CI) | Totals not selected | |
| Outcome or subgroup title | No. of studies | No. of participants | Statistical method | Effect size |
| 1 Sleep quality, postintervention (PSQI ‐ score) Show forest plot | 1 | Mean Difference (IV, Fixed, 95% CI) | Totals not selected | |