Person‐directed, non‐pharmacological interventions for sleepiness at work and sleep disturbances caused by shift work
Appendices
Appendix 1. MEDLINE search strategy
1. exp Chronobiology Disorders/
2. exp Sleep Disorders/
3. exp Circadian Rhythm/
4. exp "wounds and injuries"/ OR occupational injuries/
5. (errors OR incidents OR accidents OR mistakes OR safety).tw.
6. Death, Sudden, Cardiac/ OR Death, Sudden/ OR death?.tw. OR Death/
7. exp "costs and cost analysis"/
8. (econom$ OR cost OR costs).tw.
9. (chronotherapy OR light OR daylight OR dark OR darkness).tw.
10. exp sleep disorders, intrinsic/ OR exp "sleep initiation and maintenance disorders"/
11. (sleep OR sleepiness OR circadian OR vigilance OR altertness OR alert OR wakefulness OR drowsiness OR fatigue OR insomnia OR hypersomnolence OR dyssomnia OR eveningness OR morningness OR "concentration difficulties" OR attentiveness OR arousal OR performance OR vigilance OR vigilant).tw.
12. (nap OR napping OR rest OR resting).tw.
13. 1 OR 2 OR 3 OR 4 OR 5 OR 6 OR 7 OR 8 OR 9 OR 10 OR 11 OR 12
14. ((shift OR shifts) adj1 (rota OR system OR systems OR schedul* OR hours OR time OR pattern$ OR cycle OR extend$ OR evening OR late OR roster OR early OR weekend OR twilight OR graveyard OR night$ OR split OR non‐standard OR "non standard" OR flex$ OR turnaround OR continuous OR rotat$)).tw.
15. (day adj2 schedule?).tw.
16. (rota OR roster OR 'day week' OR flexitime OR 'hours of work' OR nightshift* OR shiftwork*).tw.
17. ((work$ OR duty) adj1 (shift OR shifts OR rota OR system OR systems OR schedul* OR hours OR time OR pattern$ OR cycle OR extend$ OR evening OR late OR roster OR early OR weekend OR twilight OR graveyard OR night* OR split OR non‐standard OR "non standard" OR flex$ OR turnaround OR continuous OR rotation$)).tw.
18. ((backward OR forward OR rapid OR slow OR rapidly OR slowly OR advancing OR delaying) adj1 (rotation OR rotate OR rotating)).tw.
19. (rota OR roster OR duty OR shift OR shifts OR shiftwork OR hours OR week OR work).mp.
20. 18 and 19
21. 14 OR 15 OR 16 OR 17 OR 20
22. (randomized controlled trial OR controlled clinical trial).pt. OR randomized.ab. OR placebo.ab. OR drug therapy.fs. OR randomly.ab. OR trial.ab. OR groups.ab.
23. (effect* OR controll* OR control OR controls* OR controli* OR controle* OR controla* OR evaluation* OR program*).tw.
24. (work OR works* OR work* OR worka* OR worke* OR workg* OR worki* OR workl* OR occupation* or prevention* OR protect*).tw.
25. 24 and 23
26. (cohort OR cross sectional OR study OR survey OR questionnaire? OR diary OR diaries).tw.
27. Case‐control studies/ OR cohort studies/ OR evaluation studies/ OR feasibility studies/ OR longitudinal studies/ OR program evaluation/ OR prospective studies/ OR retrospective studies/ OR exp follow‐up studies/ OR exp risk Factors/ OR exp evaluation studies/ OR exp retrospective Studies OR exp chi‐square distribution/ OR logistic models/ OR exp treatment outcome/ OR exp comparative studies OR cross‐sectional studies/ OR multivariate analysis/
28. 22 OR 25 OR 26 OR 27
29. exp animals/ not humans.sh.
30. 28 NOT 29
31. 13 AND 21 AND 30
Appendix 2. Embase search strategy
1. ((work NEAR/2 hour*) OR (shift NEAR/2 work*) OR (work* NEAR/2 week) OR nightshift* OR shiftwork* OR (day NEAR/2 schedule))
2. ((rotat* NEAR/2 (backward OR forward OR rapid OR slow OR rapidly OR slowly OR advancing OR delaying)) AND (shift* OR work* OR schedule OR time OR duty OR hours OR rota OR roster))
3. (shift$ NEAR/1 (rota OR system$ OR schedul* OR hours OR time OR pattern* OR cycle OR extend* OR evening OR late OR roster OR early OR weekend OR twilight OR graveyard OR night$ OR split OR non‐standard OR "non standard" OR flex$ OR turnaround OR continuous OR rotat*)
4. (shift* NEAR/2 (backward OR forward OR rapid OR slow OR rapidly OR slowly OR advancing OR delaying OR roster OR rota OR "day week"))
5. (nightshift* OR shiftwork*).tw. OR rota*?.tw. OR roster*.tw. OR 'day week'.tw.
6.exp Sleep Disorders/ OR 3. exp Circadian Rhythm/ OR exp "wounds and injuries"/ OR occupational injuries/ OR exp Death, Sudden, Cardiac/ OR Death, Sudden/ OR Death/ OR exp "costs and cost analysis"/ OR exp Chronobiology Disorders/
7. (sleep OR sleepiness OR circadian OR vigilance OR altertness OR alert OR wakefulness OR drowsiness OR fatigue OR insomnia OR hypersomnolence OR dyssomnia OR eveningness OR morningness OR "concentration difficulties" OR attentiveness OR arousal OR performance OR vigilant OR nap OR napping OR rest OR resting OR errors OR incidents OR accidents OR mistakes OR safety OR deaths OR death OR mortality OR injury OR injuries OR chronotherapy OR light OR daylight OR dark OR darkness OR econom$ OR cost OR costs).tw.
8. treatment outcome/ OR intermethod comparison/ OR major clinical study/ OR controlled study/ OR prospective study/ OR case‐control study/ OR clinical article/ OR controlled study/ OR risk factor/ OR exp Follow Up/ OR outcomes research/ OR multivariate analysis/ OR retrospective study/ OR cohort analysis/ OR comparative study/ OR population research/ OR risk factors/
9. (cross adj1 sectional).tw OR compared.tw OR compares.tw. OR (cohort OR cross‐sectional OR case‐control OR study OR survey OR surveys OR diary OR diaries OR questionnaire? OR groups OR comparison$ OR multivariate OR risk factor$ OR effectiveness).mp.
10. 1 OR 2 OR 3 OR 4 OR 5
11. 6 OR 7
12. 8 OR 9
13. 10 AND 11 AND 12
Appendix 3. OPEN GREY
(((work NEAR/2 hour*) OR (shift NEAR/2 work*) OR (work* NEAR/2 week) OR nightshift* OR shiftwork* OR (day NEAR/2 schedule) OR ((rotat* NEAR/1 (backward OR forward OR rapid OR slow OR rapidly OR slowly OR advancing OR delaying) AND (shift* OR work* OR schedule OR time OR duty OR hours OR rota OR roster)) OR (shift$ NEAR/1 (rota OR system$ OR schedul* OR hours OR time OR pattern* OR cycle OR extend* OR evening OR late OR roster OR early OR weekend OR twilight OR graveyard OR night$ OR split OR non‐standard OR "non standard" OR flex$ OR turnaround OR continuous OR rotat*)) OR (shift* NEAR/2 (backward OR forward OR rapid OR slow OR rapidly OR slowly OR advancing OR delaying OR roster OR rota OR “day week” )) AND (sleep OR sleepiness OR circadian OR vigilance OR altertness OR alert OR wakefulness OR drowsiness OR fatigue OR insomnia OR hypersomnolence OR dyssomnia OR eveningness OR morningness OR "neurocognitive performance" OR "concentration difficulties" OR attentiveness OR arousal OR performance OR vigilant OR nap OR napping OR rest OR resting OR errors OR incidents OR accidents OR mistakes OR safety OR deaths OR death OR mortality OR injury OR injuries OR chronotherapy OR light OR daylight OR dark OR darkness OR econom$ OR cost OR costs OR light OR dark OR darkness OR goggles OR exercise))
Appendix 4. PsycINFO
S1 TX ((work N2 hour*) OR (shift N2 work*) OR (work* N2 week) OR nightshift* OR shiftwork* OR (day N2 schedule))
S2 TX ((rotat* N2 (backward OR forward OR rapid OR slow OR rapidly OR slowly OR advancing OR delaying)) AND (shift* OR work* OR schedule OR time OR duty OR hours OR rota OR roster))
S3 TX (shift$ N2 (rota OR system$ OR schedul* OR hours OR time OR pattern* OR cycle OR extend* OR evening OR late OR roster OR early OR weekend OR twilight OR graveyard OR night$ OR split OR non‐standard OR "non standard" OR flex$ OR turnaround OR continuous OR rotat*))
S4 TX (shift* N2 (backward OR forward OR rapid OR slow OR rapidly OR slowly OR advancing OR delaying) OR (roster OR rota) OR "day week")
S5 TX (sleep OR sleepiness OR circadian OR vigilance OR altertness OR alert OR wakefulness OR drowsiness OR fatigue OR insomnia OR hypersomnolence OR dyssomnia OR eveningness OR morningness OR "neurocognitive performance" OR "concentration difficulties" OR attentiveness OR arousal OR performance OR vigilant OR nap OR napping OR rest OR resting OR errors OR incidents OR accidents OR mistakes OR safety OR deaths OR death OR mortality OR injury OR injuries OR chronotherapy OR light OR daylight OR dark OR darkness OR econom$ OR cost OR costs)
S6 DE workday shifts
S7 DE human biological rhythms
S8 DE sleepiness
S9 DE sleep deprivation
S10 DE sleep disorders
S11 DE sleep
S12 DE physiological arousal
S13 DE fatigue
S14 DE workday shifts
S15 DE work scheduling
S16 DE performance
S17 DE occupational safety
S18 DE napping
S19 DE job performance
S20 DE wakefulness
S21 DE sleep onset
S22 DE mortality rate
S23 DE trends
S24 DE risk factors
S25 DE longitudinal studies
S26 DE follow up studies
S27 DE retrospective studies
S28 TX control OR (cross N1 sectional) OR compared OR compares OR cohort OR cross‐sectional OR (case N1 control) OR study OR survey OR surveys OR diary OR diaries OR questionnaire? OR evaluation OR evaluate OR groups OR comparison$ OR multivariate OR risk factor$ OR effectiveness OR random* OR allocation OR allocate OR allocated
S29 S28 OR S27 OR S26 OR S25 OR S24 OR S23
S30 S22 OR S21 OR S20 OR S19 OR S18 OR S17 OR S16 OR S13 OR S12 OR S11 OR S10 OR S9 OR S8 OR S7 OR S5
S31 S1 OR S2 OR S3 OR S4 OR S6 OR S15
S32 S31 AND S30 AND S29
Appendix 5. Web of Knowledge
-
TS=(work NEAR/2 hour*)
-
TS=(shift NEAR/2 work*)
-
TS=(work* NEAR/2 week)
-
TS=(nightshift* OR shiftwork*)
-
TS=(day NEAR/2 schedule*)
-
TS=(rotat* NEAR/1 (backward OR forward OR rapid OR slow OR rapidly OR slowly OR advancing OR delaying))
-
TS=(shift* OR work* OR schedule OR time OR duty OR hours OR rota OR roster)
-
#6 AND #7
-
TS=(shift$ NEAR/1 (rota OR system$ OR schedul* OR hours OR time OR pattern* OR cycle OR extend* OR evening OR late OR roster OR early OR weekend OR twilight OR graveyard OR night$ OR split OR non‐standard OR "non standard" OR flex$ OR turnaround OR continuous OR rotat*))
-
TS=(roster OR rota)
-
TS=("day week")
-
TS=(shift* NEAR/1 (backward OR forward OR rapid OR slow OR rapidly OR slowly OR advancing OR delaying))
-
TS=(sleep OR sleepiness OR circadian OR vigilance OR altertness OR alert OR wakefulness OR drowsiness OR fatigue OR insomnia OR hypersomnolence OR dyssomnia OR eveningness OR morningness OR "neurocognitive performance" OR "concentration difficulties" OR attentiveness OR arousal OR performance OR vigilant OR nap OR napping OR rest OR resting OR errors OR incidents OR accidents OR mistakes OR safety OR deaths OR death OR mortality OR injury OR injuries OR chronotherapy OR light OR daylight OR dark OR darkness OR econom$ OR cost OR costs)
-
TS=(effect* OR controll* OR control OR controls* OR controli* OR controle* OR controla* OR evaluation* OR program* OR cohort OR cross sectional OR study OR survey OR questionnaire? OR diary OR diaries OR placebo OR random* OR trial OR groups OR multivariate OR compare? OR comparison* OR risk factor?)
-
#1 OR #2 OR #3 OR #4 OR #5 OR #8 OR #9 OR #10 OR #11 OR #12#15 AND #14 AND #13
-
TI=(mice OR rats)
-
#15 NOT #16
Appendix 6. Cochrane CENTRAL
#1 ((work NEAR/2 hour*) OR (shift NEAR/2 work*) OR (work* NEAR/2 week) OR nightshift* OR shiftwork* OR (day NEAR/2 schedule)):kw
#2 ((rotat* NEAR/2 (backward OR forward OR rapid OR slow OR rapidly OR slowly OR advancing OR delaying)) AND (shift* OR work* OR schedule OR time OR duty OR hours OR rota OR roster)):kw
#3 (shift$ NEAR/2 (rota OR system$ OR schedul* OR hours OR time OR pattern* OR cycle OR extend* OR evening OR late OR roster OR early OR weekend OR twilight OR graveyard OR night$ OR split OR non‐standard OR "non standard" OR flex$ OR turnaround OR continuous OR rotat*)):kw
#4 (shift* NEAR/2 (backward OR forward OR rapid OR slow OR rapidly OR slowly OR advancing OR delaying) OR (roster OR rota) OR "day week"):kw
#5 MeSH descriptOR Work Schedule Tolerance explode all trees
#6 (sleep OR sleepiness OR circadian OR vigilance OR altertness OR alert OR wakefulness OR drowsiness OR fatigue OR insomnia OR hypersomnolence OR dyssomnia OR eveningness OR morningness OR "neurocognitive performance" OR "concentration difficulties" OR attentiveness OR arousal OR performance OR vigilant OR nap OR napping OR rest OR resting OR errors OR incidents OR accidents OR mistakes OR safety OR deaths OR death OR mortality OR injury OR injuries OR chronotherapy OR light OR daylight OR dark OR darkness OR econom$ OR cost OR costs):kw
#7 MeSH descriptor Sleep Phase Chronotherapy explode all trees
#8 MeSH descriptor Chronotherapy explode all trees
#9 MeSH descriptor Chronobiology Disorders explode all trees
#10 MeSH descriptor Sleep Disorders, Circadian Rhythm explode all trees
#11 MeSH descriptor Dyssomnias explode all tree
#12 MeSH descriptor Sleep Disorders, Circadian Rhythm explode all trees
#13 MeSH descriptor Sleep Initiation and Maintenance Disorders explode all trees
#14 MeSH descriptor Sleep Deprivation explode all trees
#15 MeSH descriptor Sleep Disorders, Intrinsic explode all trees
#16 MeSH descriptor Sleep Disorders explode all trees
#17 MeSH descriptor Sleep explode all trees
#18 MeSH descriptor Psychomotor Performance explode all trees
#19 MeSH descriptor Medical Errors explode all trees
#20 MeSH descriptor Mortality explode all trees
#21 MeSH descriptor Death explode all trees
#22 MeSH descriptor Wounds and Injuries explode all trees
#23 MeSH descriptor Fatigue explode all trees
#24 MeSH descriptor Economics explode all trees
#25 MeSH descriptor Cost of Illness explode all trees
#26 (#1 OR #2 OR #3 OR #4 OR #5)
#27 (#6 OR #7 OR #8 OR #9 OR #10 OR #11 OR #12 OR #13 OR #14 OR #15 OR #16 OR #17 OR #18 OR #19 OR #20 OR #21 OR #22 OR #23 OR #24 OR #25)
#28 (#26 AND #27)

*Reflects search for both the current review and for the review "Adaptation of shift work schedules for preventing and treating sleepiness and sleep disturbances caused by shift work (028) (Erren 2013)"

Risk of bias graph: review authors' judgements about each risk of bias item presented as percentages across all included studies; The "Applicability of design" category assesses whether, in cross‐over designs, a period effect impacted the results (based on an interaction test). If no interaction test was reported, the risk of bias was considered unclear. In cases where the trial had a parallel design, the risk of bias was judged to be low.

Risk of bias summary: review authors' judgements about each risk of bias item for each included study; The "Applicability of design" category assesses whether, in cross‐over designs, a period effect impacted the results (based on an interaction test). If study authors reported no interaction test, we considered the risk of bias to be unclear. In cases where the trial had a parallel design, we considered the risk of bias to be low.

Comparison 1 Bright light at night versus normal light (300 lux), Outcome 1 Sleepiness during the night shift, overall, Stanford Sleepiness Scale (Scale: 1‐7).

Comparison 1 Bright light at night versus normal light (300 lux), Outcome 2 Sleepiness during the night shift, overall, Karolinska Sleepiness Scale (Scale: 1‐9).

Comparison 1 Bright light at night versus normal light (300 lux), Outcome 3 Sleepiness during the night shift, postintervention only, Stanford Sleepiness Scale (Scale: 1‐7).
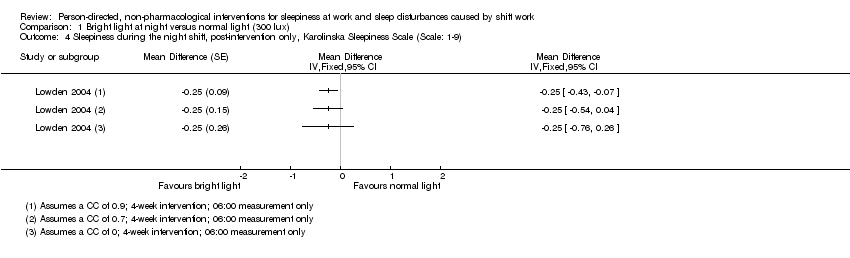
Comparison 1 Bright light at night versus normal light (300 lux), Outcome 4 Sleepiness during the night shift, post‐intervention only, Karolinska Sleepiness Scale (Scale: 1‐9).

Comparison 1 Bright light at night versus normal light (300 lux), Outcome 5 Total sleep time, next day (Actigraph ‐ hours).
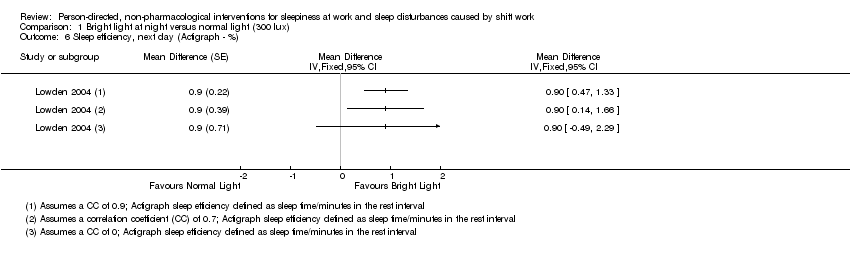
Comparison 1 Bright light at night versus normal light (300 lux), Outcome 6 Sleep efficiency, next day (Actigraph ‐ %).

Comparison 2 Bright light alone at night versus normal light (300 lux) plus placebo capsule, Outcome 1 Sleepiness during the night shift (5‐min. Reaction Time Test ‐ milliseconds).

Comparison 2 Bright light alone at night versus normal light (300 lux) plus placebo capsule, Outcome 2 Total sleep time, next day (Actiwatch ‐ hours).

Comparison 2 Bright light alone at night versus normal light (300 lux) plus placebo capsule, Outcome 3 Sleep onset latency, next day (Actiwatch ‐ minutes).

Comparison 2 Bright light alone at night versus normal light (300 lux) plus placebo capsule, Outcome 4 Sleep efficiency, next day (Actiwatch ‐ %).

Comparison 3 Bright light during day versus normal light (530 to 648 lux), Outcome 1 Sleepiness during the day shift (Karolinska Sleepiness Scale).
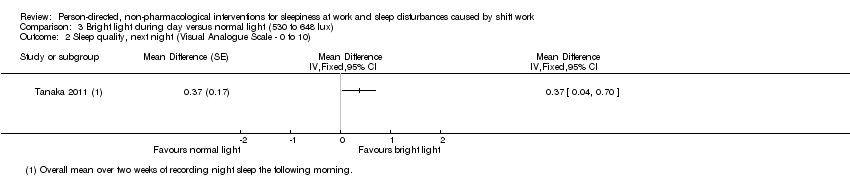
Comparison 3 Bright light during day versus normal light (530 to 648 lux), Outcome 2 Sleep quality, next night (Visual Analogue Scale ‐ 0 to 10).

Comparison 4 Bright light during day versus dim red light, Outcome 1 Total sleep time, next night (sleep log ‐ hours).

Comparison 4 Bright light during day versus dim red light, Outcome 2 Sleep onset latency, next night (sleep log ‐ minutes).

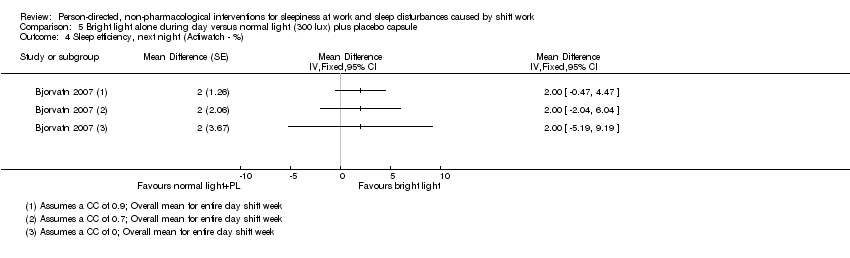
Comparison 5 Bright light alone during day versus normal light (300 lux) plus placebo capsule, Outcome 1 Sleepiness during the day shift, days (5‐min. Reaction Time Test ‐ milliseconds).
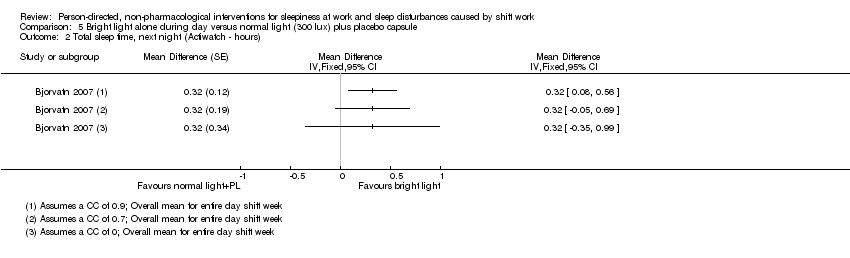
Comparison 5 Bright light alone during day versus normal light (300 lux) plus placebo capsule, Outcome 2 Total sleep time, next night (Actiwatch ‐ hours).

Comparison 5 Bright light alone during day versus normal light (300 lux) plus placebo capsule, Outcome 3 Sleep onset latency, next night (Actiwatch ‐ minutes).
Comparison 5 Bright light alone during day versus normal light (300 lux) plus placebo capsule, Outcome 4 Sleep efficiency, next night (Actiwatch ‐ %).

Comparison 6 Bright light at night plus glasses at dawn versus normal light (unclear lux) and no glasses, Outcome 1 Sleepiness during the night shift (Psychomotor Vigilance Test: Median Reaction Time ‐ milliseconds).

Comparison 7 Bright light plus glasses during day versus normal light and no glasses, Outcome 1 Total sleep time, next night (Actigraph ‐ hours).

Comparison 7 Bright light plus glasses during day versus normal light and no glasses, Outcome 2 Sleep onset latency, next night (Actigraph ‐ minutes).

Comparison 7 Bright light plus glasses during day versus normal light and no glasses, Outcome 3 Sleep efficiency, next night (Actiwatch ‐ %).

Comparison 8 Nap at night (single nap opportunity) versus no‐nap, Outcome 1 Sleepiness during the night shift, postintervention (Psychomotor Vigilance Test ‐ Mean Reaction Time ‐ milliseconds).

Comparison 8 Nap at night (single nap opportunity) versus no‐nap, Outcome 2 Sleepiness during the night shift, postintervention (Karolinska Sleepiness Scale).

Comparison 8 Nap at night (single nap opportunity) versus no‐nap, Outcome 3 Sleepiness during the night shift, postintervention (Psychomotor Vigilance Test (Slowest 10% reciprocal reaction time ‐ milliseconds ).

Comparison 8 Nap at night (single nap opportunity) versus no‐nap, Outcome 4 Sleepiness during the night shift, postintervention (Subjective Sleepiness Score ‐ "0 to 100").

Comparison 9 Naps at night (two‐nap opportunities) versus no‐naps, Outcome 1 Sleepiness during the night shift, postintervention (Visual Analogue Scale ‐ 0 mm to 100 mm).

Comparison 10 Physical exercise plus sleep education versus wait‐list, Outcome 1 Sleep quality, postintervention (PSQI ‐ score).
| Bright light at night versus normal light (300 lux) | ||||||
| Patient or population: Shift workers | ||||||
| Outcomes | Anticipated absolute effects* (95% CI) | Relative effect | № of participants | Quality of the evidence | Comments | |
| Risk with normal light (300 lux) | Risk with bright light ** | |||||
| Sleepiness during the night shift overall; | The mean sleepiness during the night shift overall in the control group was 3.10 score points | The mean sleepiness during the night shift overall in the intervention group was 0.83 lower (1.31 to 0.36 lower) | ‐ | 184 | ⊕⊝⊝⊝ | Lower sleepiness score indicates less sleepiness. Sleepiness score was averaged over the entire night. Although one study actually went on for two nights (Karchani 2011), we included only the measurements from the first night here, so that it was more comparable to the other study (Sadeghniiat‐Haghighi 2011) |
| Sleepiness during the night shift overall; | The mean sleepiness during the night shift overall in the control group was 4.33 score points | The mean sleepiness during the night shift overall in the intervention group was 0.26 lower (0.81 lower to 0.29 higher) | ‐ | 16 | ⊕⊕⊝⊝ | Lower sleepiness score indicates less sleepiness. Sleepiness score was averaged over the entire night |
| Sleepiness during the night shift; postintervention measurement | The mean sleepiness during the night shift; postintervention measurement in the control group was 4.51 score points | The mean sleepiness during the night shift; postintervention measurement in the intervention group was 2.21 lower (2.43 to 1.99 lower) | ‐ | 90 | ⊕⊕⊝⊝ | Lower sleepiness score indicates less sleepiness |
| Sleepiness during the night shift; postintervention measurement | The mean sleepiness during the night shift; postintervention measurement in the control group was 5.25 score points | The mean sleepiness during the night shift; postintervention measurement in the intervention group was 0.25 lower (0.76 lower to 0.26 higher) | ‐ | 16 | ⊕⊕⊝⊝ | Lower sleepiness score indicates less sleepiness |
| Total sleep time, next day ‐ main sleep time only; actigraph | The mean total sleep time, next day ‐ main sleep period only in the control group was 6.53 hours | The mean total sleep time, next day ‐ main sleep time only in the intervention group was 0.25 hours longer (0.36 shorter to 0.86 longer) | ‐ | 15 | ⊕⊕⊝⊝ | Longer sleep time indicates more hours slept during the main sleep period |
| Total sleep time, next day ‐ 24‐hr sleep time, including naps; assessed with actigraph | The mean total sleep time, next day ‐ 24‐hour sleep period (including naps) in the control group was 5.92 hours | The mean total sleep time, next day ‐ 24‐hour sleep period (including naps) in the intervention group was 0.63 hours longer (0.43 shorter to 1.69 longer) | ‐ | 15 | ⊕⊕⊝⊝ | Longer sleep time indicates more hours slept over 24‐hours, including both the main sleep period and naps |
| Sleep efficiency, next day; assessed with actigraph3 | The mean sleep efficiency, next day, in the control group was 89.5% | The mean sleep efficiency, next day, in the intervention group was 0.9% higher (0.49 lower to 2.29 higher) | ‐ | 15 | ⊕⊕⊝⊝ | Higher sleep efficiency indicates that a greater part of the time spent lying in bed was actually spent sleeping |
| *The risk in the intervention group (and its 95% confidence interval) is based on the assumed risk in the comparison group and the relative effect of the intervention (and its 95% CI); ** In the case of cross‐over trials, the 95% CI reported here is based on an assumed correlation coefficient of 0. | ||||||
| GRADE Working Group grades of evidence | ||||||
| 1SSS: Stanford Sleepiness Scale, a 7‐point scale with verbal anchors ranging from 1: 'feeling active, vital, alert, or wide awake' to 7: 'no longer fighting sleep, sleep onset soon, having dream‐like thoughts'. | ||||||
| Bright light alone at night versus normal light (300 lux) plus placebo capsule | ||||||
| Patient or population: Shift workers | ||||||
| Outcomes | Anticipated absolute effects* (95% CI) | Relative effect | № of participants | Quality of the evidence | Comments | |
| Risk with normal light (300 lux) plus placebo capsule | Risk with bright light** | |||||
| Sleepiness during the night shift; assessed with 5‐min Reaction Time Test | The mean reaction time during the night shift in the control group was 325.19 ms | The mean reaction time during the night shift in the intervention group was 14.61 ms faster (68.10 faster to 38.88 slower) | ‐ | 14 | ⊕⊝⊝⊝ | Faster reaction time suggests less sleepiness |
| Total sleep time, next day; | The mean total sleep time, next day, in the control group was 6.72 hours | The mean total sleep time, next day, in the intervention group was 0.26 hours longer (0.47 shorter to 0.99 longer) | ‐ | 15 | ⊕⊝⊝⊝ | Longer sleep time indicates more hours slept during the main sleep period |
| Sleep onset latency, next day; | The mean sleep onset latency, next day, in the control group was 6 minutes | The mean sleep onset latency, next day, in the intervention group was 0 minutes (neither shorter nor longer) (5.08 shorter to 5.08 longer) | ‐ | 15 | ⊕⊝⊝⊝ | Shorter sleep onset latency indicates fewer minutes needed to fall asleep when lying in bed |
| Sleep efficiency, next day; | The mean sleep efficiency, next day, in the control group was 86% | The mean sleep efficiency, next day, in the intervention group was 2% higher (4.10 lower to 8.10 higher) | ‐ | 15 | ⊕⊝⊝⊝ | Higher sleep efficiency indicates that a greater part of the time spent lying in bed was actually spent sleeping |
| *The risk in the intervention group (and its 95% confidence interval) is based on the assumed risk in the comparison group and the relative effect of the intervention (and its 95% CI); ** In the case of cross‐over trials, the 95% CI reported here is based on an assumed correlation coefficient of 0. | ||||||
| GRADE Working Group grades of evidence | ||||||
| 1Sleep efficiency = total sleep time as the percentage of time in bed. | ||||||
| Bright light during day versus normal light (530 to 648 lux) | ||||||
| Patient or population: Shift workers | ||||||
| Outcomes | Anticipated absolute effects* (95% CI) | Relative effect | № of participants | Quality of the evidence | Comments | |
| Risk with normal light (530 to 648 lux) | Risk with bright light | |||||
| Sleepiness during the day shift assessed with KSS1 14:00 | The mean sleepiness during the day shift in the control group was 4.28 score points | The mean sleepiness during the day shift in the intervention group was 0.35 lower (0.72 lower to 0.02 higher) | ‐ | 61 | ⊕⊕⊝⊝ | Lower sleepiness score indicates less sleepiness |
| Sleep quality, next night; assessed with VAS2 | The mean sleep quality, next night, in the control group was 5.94 score points | The mean sleep quality, next night, in the intervention group was 0.37 higher (0.04 to 0.7 higher) | ‐ | 61 | ⊕⊕⊝⊝ | Higher sleep quality indicates a better main sleep period |
| *The risk in the intervention group (and its 95% confidence interval) is based on the assumed risk in the comparison group and the relative effect of the intervention (and its 95% CI). | ||||||
| GRADE Working Group grades of evidence | ||||||
| 1KSS: Karolinska Sleepiness Scale, a 9‐point scale with verbal anchors ranging from 1: 'extremely alert' to 9: 'very sleepy, great effort to keep awake, fighting sleep'. | ||||||
| Bright light during day versus dim red light | ||||||
| Patient or population: Shift workers | ||||||
| Outcomes | Anticipated absolute effects* (95% CI) | Relative effect | № of participants | Quality of the evidence | Comments | |
| Risk with dim red light | Risk with bright light | |||||
| Total sleep time, next night; | The mean total sleep time, next night, in the control group was 7 hours | The mean total sleep time, next night, in the intervention group was 0.1 hours longer (1.09 shorter to 1.29 longer) | ‐ | 16 | ⊕⊕⊝⊝ | Longer sleep time indicates more hours slept during the main sleep period |
| Sleep onset latency, next night assessed with sleep log | The mean sleep onset latency, next night, in the control group was 16.6 minutes | The mean sleep onset latency, next night, in the intervention group was 2.6 minutes shorter (10.72 shorter to 5.52 longer) | ‐ | 16 | ⊕⊕⊝⊝ | Shorter sleep onset latency indicates fewer minutes needed to fall asleep when lying in bed |
| *The risk in the intervention group (and its 95% confidence interval) is based on the assumed risk in the comparison group and the relative effect of the intervention (and its 95% CI); | ||||||
| GRADE Working Group grades of evidence | ||||||
| 1Downgraded one level due to risk of bias and one level due to imprecision (wide confidence intervals). | ||||||
| Bright light alone during day versus normal light (300 lux) plus placebo capsule | ||||||
| Patient or population: Shift workers | ||||||
| Outcomes | Anticipated absolute effects* (95% CI) | Relative effect | № of participants | Quality of the evidence | Comments | |
| Risk with normal light (300 lux) plus placebo capsule | Risk with bright light** | |||||
| Sleepiness during the day shift; days assessed with 5‐min Reaction Time Test | The mean reaction time, during the day‐shift days, in the control group was 296.16 ms | The mean reaction time, during the day‐shift days, in the intervention group was 14.05 ms slower (17.37 faster to 45.47 slower) | ‐ | 12 | ⊕⊝⊝⊝ | Slower reaction time suggests more sleepiness |
| Total sleep time, next night; | The mean total sleep time, next night, in the control group was 5.8 hours | The mean total sleep time next night, in the intervention group was 0.32 hours longer (0.35 shorter to 0.99 longer) | ‐ | 13 | ⊕⊝⊝⊝ | Longer sleep time indicates more hours slept during the main sleep period |
| Sleep onset latency, next night; | The mean sleep onset latency, next night, in the control group was 6 minutes | The mean sleep onset latency, next night, in the intervention group was 1 minute longer (4.47 shorter to 6.47 longer) | ‐ | 13 | ⊕⊝⊝⊝ | Longer sleep onset latency indicates more minutes needed to fall asleep when lying in bed |
| Sleep efficiency, next night; | The mean sleep efficiency, next night, in the control group was 85% | The mean sleep efficiency, next night, in the intervention group was 2% higher (5.19 lower to 9.19 higher) | ‐ | 13 | ⊕⊝⊝⊝ | Higher sleep efficiency indicates that a greater part of the time spent lying in bed was actually spent sleeping |
| *The risk in the intervention group (and its 95% confidence interval) is based on the assumed risk in the comparison group and the relative effect of the intervention (and its 95% CI); ** In the case of cross‐over trials, the 95% confidence interval reported here is based on an assumed correlation coefficient of 0. | ||||||
| GRADE Working Group grades of evidence | ||||||
| 1Sleep efficiency = total sleep time as the percentage of time in bed. | ||||||
| Bright light at night plus glasses versus normal light (unclear lux) and no glasses | ||||||
| Patient or population: Shift workers | ||||||
| Outcomes | Anticipated absolute effects* (95% CI) | Relative effect | № of participants | Quality of the evidence | Comments | |
| Risk with normal light (unclear lux) and no glasses | Risk with bright light at night plus glasses | |||||
| Sleepiness during the night shift assessed with Psychomotor Vigilance Task and Median Reaction Time tests | The median reaction time during the night shift in the control group was 68.29 ms | The median reaction time during the night shift in the intervention group was 0.11 ms slower (20.83 faster to 21.05 slower) | ‐ | 17 | ⊕⊝⊝⊝ | Slower reaction time suggests more sleepiness |
| *The risk in the intervention group (and its 95% confidence interval) is based on the assumed risk in the comparison group and the relative effect of the intervention (and its 95% CI). | ||||||
| GRADE Working Group grades of evidence | ||||||
| 1Downgraded one level due to risk of bias, one level due to imprecision (wide confidence intervals, single trial only), and one level due to indirectness (indirect measurement of sleepiness). | ||||||
| Bright light plus glasses during day versus normal light and no glasses | ||||||
| Patient or population: Shift workers | ||||||
| Outcomes | Anticipated absolute effects* (95% CI) | Relative effect | № of participants | Quality of the evidence | Comments | |
| Risk with normal light and no glasses | Risk with bright light plus glasses** | |||||
| Total sleep time, next night; | The mean total sleep time, next night, in the control group was 6.25 hours | The mean total sleep time, next night, in the intervention group was 0.32 hours longer (0.39 shorter to 1.03 longer) | ‐ | 3 | ⊕⊕⊝⊝ | Longer sleep time indicates more hours slept during the main sleep period |
| Sleep onset latency, next night; | The mean sleep onset latency, next night, in the control group was 18 minutes | The mean sleep onset latency, next night, in the intervention group was 2.4 minutes longer (13.08 shorter to 17.88 longer) | ‐ | 3 | ⊕⊕⊝⊝ | Longer sleep onset latency indicates more minutes needed to fall asleep when lying in bed |
| Sleep efficiency, next night; | The mean sleep efficiency, next night, in the control group was 76.18% | The mean sleep efficiency, next night, in the intervention group was 6.59% higher (4.35 lower to 17.53 higher) | ‐ | 3 | ⊕⊕⊝⊝ | Higher sleep efficiency indicates that a greater part of the time spent lying in bed was actually spent sleeping |
| *The risk in the intervention group (and its 95% confidence interval) is based on the assumed risk in the comparison group and the relative effect of the intervention (and its 95% CI); ** In the case of cross‐over trials, the 95% confidence interval reported here is based on an assumed correlation coefficient of 0. | ||||||
| GRADE Working Group grades of evidence | ||||||
| 1Sleep efficiency = total sleep time as the percentage of time in bed. | ||||||
| Nap at night (single nap opportunity) versus no‐nap | ||||||
| Patient or population: Shift workers | ||||||
| Outcomes | Anticipated absolute effects* (95% CI) | Relative effect | № of participants | Quality of the evidence | Comments | |
| Risk with no‐nap | Risk with nap (single nap opportunity)** | |||||
| Sleepiness during the night shift, postintervention; | The mean reaction time during the night shift, postintervention, in the control group was 180.50 ms | The mean reaction time during the night shift, postintervention, in the intervention group was 11.87 ms faster (31.94 faster to 8.20 slower) | ‐ | 16 | ⊕⊝⊝⊝ | Faster reaction time suggests less sleepiness |
| Sleepiness during the night shift, postintervention; | The mean sleepiness during the night shift, postintervention, in the control group was 6.63 score points | The mean sleepiness during the night shift, postintervention in the intervention group was 0.13 higher (0.46 lower to 0.72 higher) | ‐ | 8 | ⊕⊕⊝⊝ | Higher sleepiness score indicates more sleepiness; study design: cross‐over |
| Sleepiness during the night shift, postintervention; | The mean sleepiness during the night shift, postintervention, in the control group was 6.48 score points | The mean sleepiness during the night shift, postintervention, in the intervention group was 1.12 lower (1.83 to 0.41 lower) | ‐ | 49 | ⊕⊕⊝⊝ | Higher sleepiness score indicates more sleepiness; study design: parallel |
| Sleepiness during the night shift, postintervention; | The mean slowest 10% reciprocal reaction time during the night shift, postintervention, in the control group was 2.46 ms | The mean slowest 10% reciprocal reaction time during the night shift, postintervention, in the intervention group was 0.19 ms faster (0.67 slower to 1.05 faster) | ‐ | 7 | ⊕⊝⊝⊝ | Faster reaction time suggests less sleepiness |
| Sleepiness during the night shift, postintervention; assessed with Psychomotor Vigilance Task Test (slowest 10% reciprocal reaction time) | The mean slowest 10% reciprocal reaction time during the night shift, postintervention, in the control group was 2.13 ms | The mean slowest 10% reciprocal reaction time during the night shift, postintervention, in the intervention group was 0.32 ms faster (0.21 slower to 0.85 faster) | ‐ | 49 | ⊕⊝⊝⊝ | Faster reaction time suggests less sleepiness |
| Sleepiness during the night shift, postintervention; subjective sleepiness score2 | The mean sleepiness during the night shift, postintervention, in the control group was 52.02 score points | The mean sleepiness during the night shift, postintervention, in the intervention group was 16.14 lower (31.37 to 0.91 lower) | ‐ | 9 | ⊕⊝⊝⊝ | Lower sleepiness score indicates less sleepiness |
| *The risk in the intervention group (and its 95% confidence interval) is based on the assumed risk in the comparison group and the relative effect of the intervention (and its 95% CI); ** In the case of cross‐over trials, the 95% confidence interval reported here is based on an assumed correlation coefficient of 0. | ||||||
| GRADE Working Group grades of evidence | ||||||
| 1 KSS: Karolinska Sleepiness Scale, a 9‐point scale with verbal anchors ranging from 1: 'extremely alert' to 9: 'very sleepy, great effort to keep awake, fighting sleep'. | ||||||
| Nap at night (two nap opportunities) versus no‐nap | ||||||
| Patient or population: Shift workers | ||||||
| Outcomes | Anticipated absolute effects* (95% CI) | Relative effect | № of participants | Quality of the evidence | Comments | |
| Risk with no‐nap | Risk with Nap (two‐nap opportunities) | |||||
| Sleepiness during the night shift, postintervention; | The mean sleepiness during the night shift postintervention, in the control group was 40.21 score points | The mean sleepiness during the night shift, postintervention, in the intervention group was 2.32 higher (24.74 lower to 29.38 higher) | ‐ | 15 | ⊕⊕⊝⊝ | Higher sleepiness score indicates more sleepiness |
| *The risk in the intervention group (and its 95% confidence interval) is based on the assumed risk in the comparison group and the relative effect of the intervention (and its 95% CI). | ||||||
| GRADE Working Group grades of evidence | ||||||
| 1VAS: visual analogue scale, 100 millimetre scale ranging from 0 mm: not at all sleepy/tired to 100 mm: extremely sleepy/tired. | ||||||
| Physical exercise and sleep hygiene education versus wait‐list for sleepiness and sleep disturbances caused by shift work | ||||||
| Patient or population: Shift workers Settings: Individual workplace Intervention: Physical exercise and sleep hygiene education Comparison: Wait‐list | ||||||
| Outcomes | Anticipated absolute effects* (95% CI) | Relative effect | No of Participants | Quality of the evidence | Comments | |
| Risk with wait‐list | Risk with physical exercise and sleep hygiene education | |||||
| Sleep quality, postintervention, assessed with PSQI1 | The mean sleep quality, postintervention, over previous one‐month period in the control group was 5.6 score points | The mean sleep quality, postintervention, over previous one‐month period in the intervention group was 1.4 lower (3.10 lower to 0.30 higher) | 32 | ⊕⊕⊕⊝ | Higher sleep quality indicates a better main sleep period | |
| *The risk in the intervention group (and its 95% confidence interval) is based on the assumed risk in the comparison group and the relative effect of the intervention (and its 95% CI). | ||||||
| GRADE Working Group grades of evidence | ||||||
| 1PSQI: Pittsburgh Sleep Quality Index, 0 to 21 point index, lower score = higher sleep quality. | ||||||
| Light interventions | ||||||
| Reference | Study participants | Shift system | Intervention | Key endpoints | Key results | |
| 11 subjects (females??) | Simulated shift‐work schedule beginning 17:30 and ending 10:00 the next morning | 1 hour bright light + placebo; exposure to 3000 lux occurred between 01:30 and 02:30 hours, placebo at 01:40 | CRT | Exposure for 1 hour to bright light combined with placebo yielded swifter CRTs immediately after the treatment, but also seemed to result in more sleepiness and greater performance deficit than when the subjects were not exposed to the bright light. | ||
| 16 subjects (all males) | Graveyard shift (00:00‐07:59); rapidly rotating shift system, having three continuous nights' work followed by three days’ rest | 1) Low‐illuminance (250 lux, 3900 K) | Sleep quality (by diary); | High, increasing, and decreasing illuminance conditions associated with greater subjective arousal than were the low‐illuminance condition. No difference of performing simple cognitive tasks associated with the lighting conditions. | ||
| 26 subjects (7 females) | 3 consecutive night shifts between 24:00 hours until 08:00 hours the following morning | Exposed group: night 1: > 4000 lux between 00:00 hours to 04:00 hours, followed by ambient room illumination < 100 lux; night 2+3: circa 1000 lux for the duration of each shift Control group: < 100 lux (night 1‐3) | Levels of alertness during shift assessed using the RTSW | There was little effect on measures of on‐duty alertness and performance or on off‐duty sleep. Middle‐aged subjects may be less phase‐tolerant than young subjects. | ||
| 8 subjects (2 females) | 4 day shifts followed by 4 night shifts | Treatment subjects (n = 4) received 2500 lux in the latter half of night shifts + a scheduled 8‐hour evening sleep episode; control subjects were in standard lighting (90 lux) | Subjective sleepiness on‐shift; PVT reaction time | For treatment subjects, by night 2, reaction time was not different from day shifts, and by night 3, subjective sleepiness was not different from day shifts. The preliminary data indicate that a combination treatment of scheduled evening sleep before night shifts and enhanced lighting during night shifts improves on‐shift sleepiness and reaction time. | ||
| 8 subjects (all males) | 1 week of night work | Treatment study condition: circa 7000‐12,000 Iux at night and nearly complete darkness during the day (had to stay in their bedroom from 9:00‐17:00) Control study conditions: circa 150 lux; no restriction for the day | Subjective alertness on‐shift assessed with use of a VAS; cognitive performance measured by a test involving calculations | Both alertness and cognitive performance significantly improved in the treatment group during night‐shift hours. | ||
| 13 subjects (6 females) | 3 consecutive simulated night shifts between 00:00 and 08:00 | Treatment study condition: circa 6000 Iux between 00:00 and 04:00 on the first night shift + dim light (< 200 Iux) for the remainder of the study The control group received dim light throughout | Alertness on‐shift assessed using the RTSW; measures of sleep quality included time in bed, total sleep time, sleep efficiency, sleep onset latency, wake after sleep onset | The treatment was associated with significantly higher alertness across the night shift and improved sleep quality during the day. On‐shift alertness was improved relative to the control group. The data indicate that a single 4‐hour pulse of bright light between midnight and 04:00 is effective in ameliorating the sleep and alertness problems associated with transition to night shift. | ||
| 16 subjects (6 females) | 3 consecutive simulated night shifts between 23:00 and 07:00 | Treatment group condition: bright light (4000‐7000 Iux between 00:00 and 04:00) Control group conditions: dim red light < 50 lux | Sleep quality measured by wrist actigraphy; cognitive performance measured using computer‐based divided attention tasks | Sleep quality and cognitive psychomotor performance was improved in the Iight‐treatment group. | ||
| 46 subjects (21 females) | Simulated night shifts of 8 consecutive night‐work, day‐sleep days | Bright light durations of 6, 3 and 0 hours (i.e. dim light) during simulated night shifts. The bright light (circa 5,000 Iux) was used during all 8 night shifts, and dim light was < 500 Iux | Core body temperature continuously measured; sleep duration assessed by daily sleep log; mood assessed using the POMS | Substantial circadian adaptation (i.e. a large cumulative temperature rhythm phase shift) was produced in many subjects in the bright light groups, but not in the dim light group. Larger temperature rhythm phase shifts were associated with better subjective daytime sleep, less subjective fatigue and better overall mood. | ||
| 22 subjects (all male?) | 1 full day shift (08:00‐16:00) + 2 night shifts (19:00‐07:00) | Four treatment groups: bright light (2000 lux) for three hours at 19:00, 22:00, 01:00 or 04:00 during the first night shift Control group: dim red light during 01:00‐04:00; 200 lux ambient lighting | Core body temperature and wrist activity monitored by a Vitalog PMS‐8; cognitive performance and mood assessed through a battery computerised task battery. Specific measures of mood include: POMS, School of Aerospace Medicine Subjective Fatigue Checklist, SSS | Preliminary analysis indicates equal or better results across all groups on the second night shift as compared to the first night for simple reaction time, logical reasoning, addition/subtraction, sleepiness and fatigue. | ||
| 8 subjects (all males) | Simulated night shift regimen (60‐hour protocol) | Treatment group: during 20:00 to 08:00 (1st night), 4‐hour pulse of bright light (700‐1000 Iux) Control group: during 20:00 to 08:00 (1st night), dim light (circa 50 Iux); 2nd night: dim light in both groups | Self‐rated alertness assessed using a shortened version of the Activation ‐ Deactivation Adjective Checklist; performance tests were 'search and memory' tests derived from the Memory and Search Task | Self‐assessed alertness and task performance were improved by the exposure to bright light. Subjective alertness and performance continued to show a time course during the subsequent night following exposure only to dim light. | ||
| 11 subjects (all males) | Simulated night work | Day 1: dim light (< 15 lux) from 20:00 to 03:00 Day 2: light for four hours from 23:00 to 03:00 with a non‐visor cap (500 lux), red‐visor cap (circa 160 lux), blue‐visor cap (circa 160 lux) | Performance of a PVT as an index of objective sleepiness; subjective sleepiness on‐shift, fatigue, mood, visual comfort and brightness measured using a VAS | The red‐visor cap had no adverse effects on performance of the PVT, brightness and visual comfort, though it tended to increase subjective sleepiness. | ||
| Experiment 1: Pilot study: 5 subjects (4 females) Experiment 2: 6 subjects (all females) Experiment 3: 11 subjects (all males) | Experiment 1: two seven‐day study periods Experiment 2: 4 six‐day study periods Experiment 3: five seven‐day study periods | Experiment 1: ambient lighting in the clinical investigation unit of 50 lux; 2 hours of 10,000 Iux or dim light during 02:00‐04:00 Experiment 2: I‐hour 10,000 Iux at 20:00 or 00:00 or 04:00, or dim light Experiment 3: 1, 2 or 4 hours of 10,000 lux or dim light in time windows 01:00‐05:00 | Subjective fatigue measure on‐shift through Samn‐Perelli scale; alertness and performance measured using digit‐symbol substitution task, CRT, and subjective alertness ratings VAS + G15 | A series of experiments established that 2 hours of bright light (broad spectrum white, 02:00‐04:00, 10,000 lux) did improve subjective alertness and performance. Bright light given in the middle of the night (white 00:00‐01:00, 10,000 lux) was more effective than light given at 20:00 or 04:00. Light of 2 hours and 4 hours duration were more effective than 1 hour of light centred at 03:00 (white, 10,000 lux). Light of shorter wavelengths appeared to be more effective than light of Ionger wavelengths at improving nocturnal alertness and performance (01:00‐05:00, 300 lux). | ||
| 32 subjects (16 females) | Three consecutive simulated night shifts between 22:00‐06:00 | Treatment group: 4‐hour pulse of bright light (3000 lux) between 22:00 and 02:00 on night 1, 1 hour later in night 2, and 2 hours later in night 3 Control group: dim light (300 Iux) | Objective measures of working memory, selective attention, divided attention, concentration performance, and vigilance recorded by established performance tests (including working memory of the TAP, Go/No‐Go, Divided Attention of the test battery for attention testing; Konzentrations‐Leistungs‐Test; Simple Reaction Time Task) | Bright light Ieads to an improvement in working memory, divided attention and concentration performance in all three night shifts. Bright light leads to better performance for some forms of attention tasks in elderly night workers. | ||
| 32 subjects (16 females) | Three consecutive simulated night shifts between 22:00‐06:00 | Treatment group: 4‐hour pulse of bright light (3000 lux) between 22:00 and 02:00 on night 1, 1 hour later in night 2, and 2 hours later in night 3 Control group: dim light (300 Iux) | Objective measures of working memory, selective attention, divided attention, concentration performance, and vigilance recorded by established performance tests (subtest working memory of the TAP, Divided Attention of the test battery for attention testing; Konzentrations‐Leistungs‐Test (KLT‐R); PVT | Bright light exposure results in a better performance for cognitive tasks in older night workers over time. Except for high‐demand tasks, such as sustained attention tasks, bright light induces better performance in working memory and concentration tasks for older night workers. | ||
| 32 subjects (16 females) | Three consecutive simulated night shifts between 22:00‐06:00 | Treatment group: 4‐hour pulse of bright light (3000 lux) between 22:00 and 02:00 on night 1, 1 hour later in night 2, and 2 hours later in night 3 Control group: dim light (300 Iux) | Mood (Der Mehrdimensionale Befindlichkeitsfragebogen and sleepiness on‐shift (SSS) questionnaires and a concentration task, a working memory task, and a divided‐attention task by established performance tests (Konzentrations‐Leistungs‐Test (KLT‐R)); subtest working memory of the TAP; Divided Attention of the test battery for attention testing) | Results indicate that sleepiness and mood did not function as mediators in the prediction of concentration, working memory, and/or divided attention by light exposure. Bright light has a strong direct and independent effect on cognitive performance, particularly on working memory and concentration. | ||
| 35 subjects (9 females) | 6 days of simulated 8‐hour night shifts | Treatment group 1: 5700 lux 3 hours/day Treatment group 2: 12:30 lux 3 hours/day Treatment group 3: < 250 lux All participants wore dark sunglasses while outside during daylight | Core body temperature continuously measured; sleep duration via daily sleep log; mood and fatigue during day assessed using the POMS | During nights 3‐5, most subjects in the high and medium groups (100% and 85%) exhibited phase delays large enough that their body temperature minima occurred within the daytime sleep/dark period. Larger phase shifts were correlated with more sleep and less fatigue. Extremely 'bright' light may not be necessary for circadian adaptation in specific shift work situations. | ||
| 12 subjects (5 females) | All subjects exposed to the five lighting conditions between 20:00 and 08:00 over 5 consecutive weeks | Lighting conditions: 1) complete darkness; 2) unfiltered fluorescent white light (380‐730 nm); 3) fluorescent white light with wavelengths < 480 nm filtered' 4) fluorescent white light with wavelengths < 460 nm filtered; 5) fluorescent white light with wavelengths < 480 partially filtered | During each overnight testing session, objective and subjective neuropsychometric tests and saliva samples were collected every 2 hours. The Toronto Hospital Alertness Test, the Digit Vigilance Test, the SSS, the seven‐item Fatigue Scale self‐report questionnaire and a VAS for subjective mood were employed | Subjective alertness, mood, and errors on an objective vigilance task were significantly less impaired at 08:00 by filtering wavelengths < 480 nm compared with unfiltered nocturnal light exposure. The changes were not associated with significantly increased sleepiness or fatigue compared with unfiltered light exposure. The data suggest that spectral modulation may provide an effective method of regulating the effects of light on physiological processes | ||
| 4 subject (all males) | Two sessions of 11 days of simulated microgravity (6° head down tilt bedrest) with 6‐hour extensions of the wake period on 2 days (12‐hour phase delay) | Bright light (> 3500 Iux) for 5 hours on each of the 2 shift days and the following day at times either expected to accelerate the adjustment to the phase delay (treatment condition) or to have no phase shifting effect (control condition) | Sleep recorded polygraphically; circadian system monitored by recordings of heart rate and body temperature, and by collection of urine (electrolyte and hormone excretion); subjective sleep duration assessed via sleep log | 5‐hour exposures to bright light finishing at the time of the circadian temperature minimum were not more effective at accelerating adjustment to a 12‐hour schedule delay than exposures coinciding with the temperature maximum. We conclude that, while bright light may accelerate adjustment to work‐rest schedule delays, any such effect seems to be largely independent from the timing of the light exposure. No significant effects in polygraphically measured sleep parameters | ||
| 11 subjects (all males) | Three consecutive simulated night shifts (22:00‐06:00); after a 2‐week rest, a second run of three consecutive night shifts | Treatment group: lighting environment (800 lux) with reduced short‐wavelength components Control group: unfiltered bright light (800 lux) environment | Circadian markers (including urinary aMT6s), symptoms of lassitude, and personal mood; fatigue (and other parameters) assessed via mood rating inventory before and after the shift; Vienna Test System, including performance testing (reaction time analysis), vigilance testing and evaluation of attentiveness (Continous Attention) | Mood rating inventories did not result in differences in the subjective perception between the two lighting environments with respect to the dimensions of 'activity', 'concentration', 'deactivation', and 'fatigue'. In addition, changes in signs of vigour and weariness in the course of each night of the study were equally pronounced in test light and bright light. | ||
| 71 subjects (29 females) | after ≥ 2 night shifts in the field, 1 simulated night shift in the laboratory | Treatment group: blue‐enriched white light (17,000 K, 150 lux) from 2300‐0700 Control group: continued background white light (4000 K, 150 lux) | Habitual sleep‐wake patterns monitored for 1‐3 weeks via diaries and actigraphy; urine collected for aMT6s; assessments via KSS, PVT, polysomnography and mood | Exposure to blue‐enriched light was not associated with significant improvements in PVT performance, or electro‐oculogram correlates of alertness. During the biological night, however, blue‐enriched light was associated with improved subjective alertness. | ||
| 30 subjects (19 females) | 2‐night protocol | Lighting conditions: | Sleep estimated with actigraphy; subjective sleepiness (VAS); throughout night 2, the MSLT, SALT performance | 4‐hour exposure to bright light significantly increased MSLT scores and improved SALT performance during the early morning hours on the night following bright‐light exposure. No significant effects were noted with a 2‐hour exposure. | ||
| 19 subjects (5 females) | no less than 1 week between the interventions 1‐3 | Interventions: | Body temperature and psychomotor vigilance (PVT); Saliva collected before and after light treatment for melatonin assay | Temperature, subjective alertness and PVT performance decreased significantly across the night. BL significantly suppressed melatonin, but did not improve subjective alertness or PVT performance. SD markedly increased incidents, accidents, and standard deviation of lane position. BL compared to DL did not improve performance during the first 22 min circuit, but across the 2 circuits BL significantly attenuated the effect of time on task on incidents and accidents. | ||
| Light and glasses interventions | ||||||
| Reference | Study participants | Shift system | Intervention | Key endpoints | Key results | |
| 50 subjects (19 females) | 8 consecutive simulated night shifts | Four groups in 2 x 2 design: light (bright, dim); goggles (yes, no); exposure to bright light (circa 5000 lux) for 6 hours on the first two night shifts; dim light < 500 lux | Core body temperature continuously measured; sleep duration via daily sleep log; mood and fatigue assessed using the POMS | Both bright light and goggles were significant factors for producing circadian rhythm phase shifts. The combination of bright light plus goggles was most effective; the combination of dim light and no goggles was least effective. Larger temperature‐rhythm phase shifts were associated with better subjective daytime sleep, less subjective fatigue and better mood. There was no significant main effect of goggles on sleep duration, but the main effect of light and the interaction of light and goggles were not significant. | ||
| 24 subjects (14 females) | 3 simulated night shifts (2300‐0700), 2 days‐off + 4 more night shifts | Treatment group: five 15 minute bright light pulses during night shifts + sunglasses when outside + sleep in dark bedrooms at scheduled times after night shifts and on days‐off + outdoor afternoon light exposure (the “light brake”) Control group: remained in normal room light during night shifts + lighter sunglasses + unrestricted sleep and outdoor light exposure | DLMO; daily sleep log + actigraphy, alertness on‐shift, total sleep time assessed using sleep logs and actigraphy; reaction time (SRT) test | The final DLMO of the experimental group was close to our target compromise phase position, and significantly later than the control group. Experimental subjects performed better than controls, and slept for nearly all of the allotted time in bed. Controls demonstrated pronounced performance impairments late in the night shifts, and exhibited large individual differences in sleep duration. | ||
| 31 subjects (17 females) | 3 simulated night shifts (23:00‐07:00) + 2 days‐off | Two treatment groups: intermittent bright light during night shifts (75 and 120 min/night) + dark sunglasses when outside + sleep in dark bedrooms at scheduled times after night shifts and on days‐off + outdoor light exposure upon awakening from sleep Control group: dim room light during night shifts + lighter sunglasses + unrestricted sleep and outdoor light | DLMO; daily sleep log + actigraphy; simple reaction time (SRT) test | After the days‐off, the DLMO of the experimental groups was in a good position to reach the target after subsequent night shifts with bright light. The DLMO of the control group changed little from baseline. Experimental subjects performed better than control subjects during night shifts on a reaction time task. | ||
| 19 subjects (11 females) | 3 simulated night shifts (23:00‐07:00); 2 days‐off, 4 night shifts + 2 days‐off | Treatment group: four 15‐min BL pulses during night shifts + sunglasses when outside + sleep in dark bedrooms at scheduled times + outdoor afternoon light (“light brake”) Control group: remained in normal room light during night shifts + lighter sunglasses + unrestricted sleep and outdoor light | DLMO; daily sleep log + Actiwatch‐L; Automated Neurophysiological Assessment Metrics test battery (SRT reported) | The final DLMO of the experimental group was close to the target of 03:00, and later than the control group. Subjects who phase‐delayed (whether in the experimental or control group) close to the target phase performed better during night shifts. | ||
| aMT6s: 6‐sulfatoxymelatonin | ||||||
| Nap interventions | ||||||
| Reference | Study participants | Shift system | Intervention | Key endpoints | Key results | |
| 20 subjects (6 females) | Subjects awakened at 07:00 of the experimental day and were prohibited from sleeping until the end of experiment except for the nap (01:00‐02:00) in the nap group Participants remained awake for 20 hours ‐ performing cognitive tasks at 21:00, 02:00 and 03:00; experimental chamber below 150 lux, 30 lux during cognitive task period, 0 lux during the nap | Nap condition: 1‐hour nap 01:00‐02:00 Rest condition:1‐hour awake‐rest period 01:00‐02:00 | Sleep logs + Actiwatch‐L + polysomnography + EEG; stimulus‐response compatibility (arrow‐orientation task, reaction time | Behavioural performance and amplitude of the error‐positivity declined after midnight (i.e. 02:00 and 03:00) compared with the 21:00 task period in both groups. During the task period starting at 03:00, the participants in the awake‐rest condition reported less alertness and showed fewer correct responses than those who napped. | ||
| 12 subjects (all males) | 3 consecutive nights and 2 days in the laboratory for 2 consecutive weeks (= session 1+2) | Session 1: 4‐hour afternoon nap + caffeine at 01:30 and 07:30 Session 2: four 1‐hour naps during the night + placebo In both sessions pills (placebo or caffeine) were administered at 01:30, 07:30, 13:30, 19:30) | MSLT, EEG; performance and mood were assessed with repeated batteries of measures (logical reasoning, WAlS, computer‐modified Williams Word Memory Test of immediate free recall, visual vigilance, subjective sleepiness/alertness, POMS, oral temperature) across the 24‐hour operation | After an afternoon nap, subjects had increased objective and subjective alertness, increased oral temperature, and increased performance on complex tasks like logical reasoning and correct additions when compared to the condition that allowed four night‐time naps. | ||
| 24 subjects (all males) | 3 consecutive nights and 2 days in the Iaboratory | Nap condition 1: 16:00‐20:00 prior to a 24‐hour period of sleep loss Nap condition 2: as in 1 + 200 mg caffeine at 01:30 and 07:30 All subjects received pills at 01:30, 07:30, 13:30, 19:30. For all subjects, the pills received at 13:30 and 19:30 were placebos | MSLT, EEG; visual vigilance, subjective sleepiness/alertness, POMS; performance and mood were assessed with repeated batteries of measures (logical reasoning, WAlS, computer‐modified Williams Word Memory Test of immediate free recall | Performance tests all indicated maintenance of baseline performance Ievels in the caffeine group after administration of caffeine, while performance declined in the placebo group. The combination of nap and caffeine was able to maintain alertness and performance at very close to baseline Ievels throughout a 24‐hour period without sleep. | ||
| 140 subjects (all males) | 4 consecutive nights and 3 days in the laboratory | 1) Nap condition: nap at 12:00, 16:00, 18:00 or not at all 2) Caffeine condition: single 400 mg dose of caffeine at 01:30 each night or repeated doses of 150 mg or 300 mg every 6 hours starting at 01:30 on the 1st night of sleep loss 3) Placebo condition: no‐nap and placebo administered every 6 hours on the repeated caffeine schedule was run for 1) and 2) During the sleep‐loss period, all subjects were administered placebo capsules every 6 hours starting at 01:30 | MSLT, EEG; performance and mood were assessed with repeated batteries of measures (logical reasoning, WAlS, computer‐modified Williams Word Memory Test of immediate free recall, visual vigilance, subjective sleepiness, POMS, oral temperature) across the 24‐hour operation | Naps provided Ionger and less graded changes in performance, mood and alertness than did caffeine, which displayed peak effectiveness and loss of effect within about 6 hours. Neither nap nor caffeine conditions could preserve performance, mood, and alertness near baseline Ievels beyond 24 hours, after which Ievels approached those of placebo. | ||
| 12 subjects (all males) | 3 consecutive nights and 2 days in the Iaboratory | Nap condition 1: 4‐hour afternoon nap Nap condition 2: four 1‐hour naps during the night Nap condition 3: 0.125 mg of triazolam prior to a prophylactic 4‐hour nap before the 24‐hour operation | MSLT, EEG; performance and mood were assessed with repeated batteries of measures (logical reasoning, WAlS, computer‐modified Williams Word Memory Test of immediate free recall, visual vigilance, subjective sleepiness/alertness, POMS, oral temperature) across the 24‐hour operation | When a series of 1‐hour naps was taken during the normal night period, oral temperature and psychomotor performance also declined. However, performance was relatively improved on the following evening. In contrast, with an effective 4‐hour prophylactic nap, performance remained near baseline Ievels across the night. Fatigue increased over the course of the study, the increases were similar in each group. | ||
| 18 subjects (all males) | 3 separate 38‐hour periods of continuous wakefulness, each separated by 10 hours of recovery sleep | Nap condition 1: 2‐hour evening nap (at 21:00) induced with 10 mg zolpidem tartrate Nap condition 2: 2‐hour nap (at 21:00) with placebo; Condition 3: 2‐hour rest break with no sleep Following 1) or 2) or 3), subjects remained awake for 23 additional hours | Sleepiness on‐shift, alertness (and others) assessed using VAS; Repeated Test of Sustained Wakefulness; polysomnography of naps; POMS; multiattribute task battery | Results indicated the effectiveness of prophylactic naps for sustaining mood, alertness, and performance throughout the final 23 hours of a 39‐hour period of sustained operations. Both napping conditions attenuated the decrements normally associated with total sleep deprivation, but the zolpidem nap was the most effective because subjects obtained the most sleep. | ||
| 59 subjects (31 females) | 4‐day protocol with 3 early morning shifts (07:00‐15:00) followed by a rapid rotation to the midnight shift (23:00‐07:00) | Nap condition 1: long nap of 2 hours Nap condition 2: a short nap of 45 minutes Nap condition 3: no‐nap condition | Wrist activity monitors; sleepiness on‐shift via Stanford Sleepiness Scale; Air Traffic Scenarios Test; the Bakan, a test of vigilance | While sleepiness increased across the midnight shift for all groups, ratings were generally lower for the long nap condition and were lower for males in the short nap condition. Both cognitive performance and subjective measures of sleepiness supported the use of naps during the midnight shift. | ||
| 12 subjects (all males) | Sleep of 4 hours during the preceding night, work during the day and then kept awake (except for naps) in the laboratory from 17:00 to 08:00 the following morning | Nap condition 1: one‐hour nap (21:00h) Nap condition 2: one‐hour nap (04:30h) Nap condition 3: no‐nap | EEG, EOG; self‐ratings of sleepiness on‐shift, sleep latency tests; single choice visual reaction time task | Clear positive effects of naps (especially the 04:30 nap) on performance. The sleep latency measurements showed similar, but less clear tendencies, while ratings of sleepiness did not differentiate between conditions. | ||
| 30 subjects (18 females) | 3‐day laboratory study including one baseline sleep (22:00‐07:00) and one experimental night | Nap condition 1: total sleep deprivation (NO‐NAP) Nap condition 2: 10‐min nap (10‐NAP) Nap condition 3: 30‐min nap (30‐NAP) Nap opportunities ended at 04:00 | Fatigue scale, sleepiness scale, and self‐rated performance scale; psychomotor vigilance test (PVT‐B), digit‐symbol substitution task | In the 30‐NAP condition, performance immediately deteriorated from pre‐nap and was still worse at 47 min postnap. A 10‐min ‐ but not a 30‐min ‐ night‐time nap had minimal sleep inertia and helped to mitigate short‐term performance impairment during a simulated night shift. | ||
| 21 subjects (12 females) | 3‐day laboratory study; keeping subjects awake for 27 hours for 1 simulated night shift; 40‐min York highway driving task at 07:15 to simulate the commute | Nap condition 1: total sleep deprivation (NO‐NAP) Nap condition 2: 10‐min nap ending at 04:00 + a 10‐min pre‐drive nap ending at 07:10 (10‐NAP) | Polysomnography; SP‐Fatigue; PVT‐B | In the 10‐NAP condition, PVT‐B performance was worse after the nap (07:12) compared to before the nap (06:30); no change across time was found in the NO‐NAP condition. SP‐Fatigue and driving performance did not differ significantly between conditions. | ||
| 79 subjects (27 females) | 10‐day sleep restriction protocol, assignment to one of 18 sleep regimens | Nap condition 1: restricted diurnal sleep + nocturnal nap (0.4‐hour, 0.8‐hour, 1.2‐hour, 1.6‐hour, 2.0‐hour or 2.4‐hour time in bed Nap condition 2: restricted diurnal sleep + no‐nap | Polysomnography; total sleep time (sleep duration) | Napping on the night shift does not degrade subsequent daytime SE above and beyond SE reduction associated with daytime sleep or increasing overall time in bed | ||
| 12 subjects (all males) | 3‐day experiment with 1 simulated night shift (22:00–08:00 ) and subsequent day (11:30–17:30) and night sleep (00:00–07:00) | Nap conditions: 1) 00:00–01:00 (early 60 min; E60); 2) 00:00–02:00 (E120) 3) 04:00–05:00 (late 60 min; L60) 4) 04:00–06:00 (L120) 5) no‐nap | Polysomnography; rectal temperature; VAS for sleepiness; visual vigilance test; set of tasks, including English transcription task + a performance test battery | Posthoc analyses showed significantly longer RTs and more lapses following the L60 nap compared with no‐nap. In contrast, there was no significant difference in sleepiness between the L60, or any of the other nap conditions, and the no‐nap condition. Findings suggest the effect of sleep inertia on visual vigilance test performance was profound in the L60 condition, although no significant effects on sleepiness were self‐reported by VAS. | ||
| 22 subjects (13 females) | Simulated night shift environment with a 2‐hour sleep in the afternoon from 15:00–17:00 hours, followed by nap condition 1 or 2 in 02:30–03:00 | Nap condition 1: 30‐min nap Nap condition 2: no‐nap | Sleepiness on‐shift (SSS, KSS), fatigue and vigour subscales of the POMS, and the VAS for sleepiness; symbol–digit substitution task, the letter cancellation task, and the PVT | The 30‐min nap resulted in some impairment of subjective alertness for a brief period (up to 30 min) immediately following the nap when compared to the no‐nap condition. Following this brief period, alertness improved by the 30‐min nap from 04:00 until the end of the testing period at 07:00. | ||
| 8 subjects (1 female) | Simulated night shift; alertness and performance testing sessions + 2‐hour runs in a driving simulator | From 14:00 to 17:00 Nap condition 1: sleep Nap condition 2: sedentary activities | Polysomnography, subjective fatigue and sleepiness on‐shift via VAS, sleep quality (Sleep Quality Questionnaire); EEG; 3 computerised tests from the Walter Reed performance assessment battery | In the nap condition, the subjects showed lower subjective sleepiness and fatigue, as measured by VAS, and faster reaction times and less variability on psychomotor performance tasks. | ||
| 8 subjects (all male) | 5 Nap conditions between a previous full night's sleep and a day sleep on the day following the night | Nap conditions: a 2‐hour nap between: 1) 22:00‐00:00 (N1) 2) 02:00‐04:00 (N2) 3) 04:00‐06:00 (N3) 4) 06:00‐08:00 (N4) 5) no‐nap(Control group) | EEG, EOG, EMG, ECG, respiratory movement; rectal temperature, oral temperature; flicker fusion frequency, sleepiness, fatigue complaints | Decrease in rectal temperature during the night was more marked for conditions N2, N3 and N4, with a lesser extent of individual differences, than for the Control group and N1. The self‐evaluation of the sleep depth and the rapidness of sleep onset correlated highly with sleep parameters. N3 and N4 were evaluated to have resulted in a better sleep than N1. | ||
| 6 subjects (all female) | 3 x 3 days experimental conditions Day 1+2 daily activities Day 3: awake from 00:00 until 10:00 with a nap period which started at 03:00 | On each of 3 days: nap condition 2: 1‐hour nap nap condition 3: 2‐hour nap | Fatigue Feelings Scale, SSS; EEG, EOG and EMG during the naps | A 1‐hour nocturnal nap gave significantly smaller scores on two subscales of Fatigue Feelings Scale during early morning hours than no napping. A 2‐hour nocturnal nap, which contained significantly Ionger duration of Slow Wave Sleep than a 1‐hour nocturnal nap, did not differ from a 1‐hour nocturnal nap in decreasing scores of fatigue feelings during these hours | ||
| 24 subjects (all males) | 5 nights experimental design with one no‐nap condition before the night tests + a nap condition that comprised the 1‐hour nap followed by the test sessions | Nap condition 1: 1‐hour nap at 00:00 Nap condition 2: 1‐hour nap at 03:00 | Sleep inertia (spatial memory) and logical reasoning tasks | No effects on accuracy, and no circadian effects of napping were found. Pooled data of intervention groups showed that the performance in the 1‐hour nap condition exhibited significant reductions of speed immediately following awakening, when compared with no‐nap, reflecting sleep inertia effects. | ||
| Study A: 10 subjects (7 females); Study B: 12 subjects (5 females) | Study A&B: Two night‐time work periods separated by at least three normally timed nights of sleep | Study A ‐ Nap condition: 3‐hour nap opportunity on 1 night between 20:00 and 23:00 ; Study B ‐ Caffeine condition: 4 mg/kg caffeine on 1 night | Polysomnography, sleepiness on‐shift SSS, VAS; alertness (computer‐driven simulated assembly line task) | Performance and subjective alertness improved after both a 2·3‐hour evening nap or ingestion of caffeine prior to the work shift. Although neither napping nor caffeine countered the strong circadian influence on performance and alertness in the early morning hours, both strategies attenuated their sharp decline. | ||
| 13 subjects (all male) | Simulated shift work schedules of 9 consecutive days: 2 day (08:00‐16:00) + 3 night (22:00‐08:00) + 3 day shifts; between experimenting with nap condition 1 and 2, rest period of 1 week | Nap condition 1: nap from 02:00‐04:00 Nap condition 2: no‐nap | Fatigue and anxiety questionnaire, heart rate variability, oral temperature, salivary cortisol; two performance tasks: typing figures + performing mental arithmetic; CFF, 3‐choice reaction time | Task performances decreased and subjective fatigue and anxiety increased in proportion to the length of time worked in both M‐types (morningness) and E‐types (eveningness) who had no‐nap. In M‐types, these changes were significantly suppressed by the nap on the first night of duty. Changes for E‐types were smaller than those for M‐types in terms of task performance and psycho‐physiological parameters. | ||
| 6 subjects (all male) | 5 nap conditions on‐shift for each participant; 3 consecutive days with one night shift (22:00‐08:00) followed by daytime sleep and night sleep; at least 5 days between the experiments | Nap conditions: | Polysomnography, questionnaire on subjective fatigue, heart rate variability, rectal temperature; performance task (typing text) and tests (choice reaction time test, a logical reasoning test, a vigilance test, and a CFF test) | Sleep latency was shorter and sleep efficiency was higher in the nap in L60 and L120 than that in E60 and E120. Performance was somewhat improved by taking a 2‐hour nap later in the shift, but deteriorated after a one‐hour nap. | ||
| 24 subjects (15 females) | Simulated night‐shift schedules with at least one week intervening between conditions | 2‐hour afternoon sleep opportunity + one of two‐nap conditions: 1) 30‐min night‐nap; 2) no night‐nap | Polysomnography, subjective sleepiness on‐shift (SSS, KSS, VAS), objective sleepiness on‐shift (sleep latency tests); objective performance (Symbol Digit Substitution Task) + reaction time (PVT) | Subjective sleepiness was less correlated with objective sleepiness and objective performance when participants were given a 30‐min night nap. However subjective sleepiness and reaction time performance was strongly correlated in both conditions, and there was no significant difference between the nap and no‐nap conditions. | ||
| CFF: Critical Flicker Fusion Frequency RT: Reaction Time SE: Standard Error WAIS: Wechsler Adult Intelligence Scale | ||||||
| Other interventions | ||||||
| Reference | Study participants | Shift system | Intervention | Key endpoints | Key results | |
| 33 subjects (17 females) | Simulated night work study with 8 consecutive night shifts followed by daytime sleep/dark periods | 1) Intermittent bright light (6 pulses, 40‐min long each, at 5000 lux) versus dim light (< 500 lux, 20 min ) 2) Intermittent exercise (6 bouts, 15‐min long each, at 50%‐60% of maximum heart rate) versus no exercise; bright light and exercise interventions during the first 6 hours of the first 3 night shifts | Core temperature; sleep duration (sleep log) | Intermittent bright light groups had significantly larger phase delays than dim‐light groups, and 94% of subjects who received bright light had phase shifts large enough for the individual rectal temperature minimum to reach daytime sleep. Exercise did not affect phase shifts; neither facilitating nor inhibiting phase shifts produced by bright light. During the last 4 days of the study, subjects in the bright light groups slept more (within the scheduled sleep/dark periods) and napped less than those in the dim light groups. | ||
| 43 subjects (all male) | 5‐day night work study involving a 10‐hour phase delay of the work/rest cycle | 1) Bright white light (3500‐4300 Iux) versus dim red light (200‐300 Iux) from 22:00‐02:00 each night 2) Inactive LEET versus active LEET therapy for 20 min prior to the daytime sleep periods | Polysomnography; circadian phase shifting evaluated via core body temperature + urinary 6‐SM excretion; indirect measurement of alertness: complex reaction time, simple reaction time; subjective alertness (VAS); performance examined with a cognitive performance assessment battery | 6‐SM data indicate that bright light exposure increased the phase delay seen in this circadian rhythm in the 3 days after the work/rest schedule shift. Bright light treatment shows evidence of improving accuracy on a broad range of cognitive performance, without compensatory decreases in speed. LEET administration before the daytime sleep periods showed little evidence of affecting either performance or 6‐SM. Complex reaction time: bright light‐exposed subjects performed significantly better than did dim light‐exposed on all three postshift testing sessions, with the largest difference the second postshift night (Day 3). Bright light subjects started out slightly less alert at baseline, dropped less the first night after the shift, and rose much more the second night after the shift. On the last night both groups dropped to a similar level. | ||
| 45 subjects (all male) | 5‐day night work study with subjects working and being tested during three 9‐hour night shifts from 18:00‐03:00 | 1) Bright light (3500‐4300 lux) or dim light (200‐300 lux) from 22:00‐02:00 each night 2) LEET for 20 min prior to daytime sleep 3) Both bright light) + LEET) 4) Placebo treatments | Polysomnography; 6‐SM, VAS of sleepiness; cognitive tests in the performance assessment battery, simple and complex reaction times (simple reaction times + complex reaction times) trials, word memory task | Bright light accelerated phase delay of the circadian melatonin rhythm after the work‐rest schedule shift. Further, subjects who received bright light had greater total sleep time and improved sleep continuity. Some minor improvements in cognitive performance were produced by light treatments but not by LEET. | ||
| 28 subjects (all male) | 6‐hour night‐time flight in a flight simulator; a structured sleep/wake schedule for three nights just prior to the study; obtaining their typical amount of night‐time sleep between the hours of 22:00 and 08:00 | Treatment condition: 5 breaks spaced hourly during cruise Control condition: 1 break in the middle of cruise | Questionnaire + interview; EEG/EOG, subjective sleepiness (KSS, VAS); vigilance performance (PVT), subjective sleepiness ratings, electrophysiological measures of drowsiness, continuous video | The treatment group showed significant reductions for 15 min postbreak in slow eye movements, theta‐band activity, and unintended sleep episodes compared with the control group. The treatment group reported significantly greater subjective alertness for up to 25 min postbreak. There was no evidence of objective vigilance performance improvement at 15‐25 min postbreak. | ||
| 35 subjects (14 females) | 10‐day shift work simulation (4 day shifts = 07:00‐15:00 and 3 night shifts = 23:00‐07:00) | 1) Morning Sleep (08:00‐16:00) + phase‐delaying light exposure (23:00‐03:00) 2) Evening Sleep (14:00‐22:00) + phase‐advancing light exposure (03:00‐07:00) | Polysomnography; dim light salivary melatonin onset; RT in the PVT; subjective alertness via the KSS | Analysis of the dim light salivary melatonin onset indicated a modest but significant circadian realignment in both sleep groups. Daytime sleep efficiency and total sleep time did not differ between them or from their respective baseline sleep. On the final night shift, the evening sleep subjects had fewer episodes of attentional impairment and quicker responses on the PVT than their morning sleep counterparts. | ||
| 8 subjects (all male) | Simulated night work (22:00‐08:00) with an hourly exercise consisting of 30 min task, 15 min test and 15 min break | Treatment condition: hourly exercise (3 min during breaks) Control condition: no exercise during breaks | Heart rate variability; a VAS for subjective fatigue + sleepiness, psychomotor vigilance test (PVT) | Work performance in the last 10 min of each 30‐min task was better under the treatment condition than under the control condition. During the second half of the test period, exercise showed an effect on sustained attention. Exercise was not effective in reducing subjective fatigue and sleepiness. | ||
| 17 subjects (all male) | In a temporal isolation facility with dim light conditions (< 10 lux), sleep schedules were phase‐advanced by 8 hours from habitual sleep times for 4 days, followed by a free‐run session for 6 days with no time cues. During the shift schedule, the treatment and control groups performed physical exercise or not | Treatment group: physical exercise with a bicycle ergometer in the early and middle waking period for 2 hours each Control group: sat on a chair at those times | Polysomnography, bed sensor, wrist activity + light intensity (Actiwatch); plasma melatonin, continuous rectal temperature | Sleep‐onset on the first day of free‐run in the exercise group was significantly phase‐advanced from that in the control and from the baseline. The circadian melatonin rhythm was significantly phase‐delayed in both groups, showing internal desynchronisation of the circadian rhythms. | ||
| EEG: electroencephalogram | ||||||
| Cross‐over trial | Outcome | Description of ANOVA strategy | ANOVA results | Correlation coefficient (CC) | Estimates of P values by CC (see Unit of analysis issues) |
| Sleepiness on‐shift overall | "A two‐factor repeated measurement ANOVA was used. Factors: 1) treatment; 2) time (of night measurement) P values were corrected for sphericity (using the Huynh‐Feldt coefficient). Significance was defined at P < 0.05." | Period 1 : Time of night measurement × Treatment: (F = 8.76; P < 0.001) Time of night measurement: (F = 40.98; P < 0.001) Period 2 : Time of night measurement × Treatment: (F = 5.124, P < 0.01) Time of night measurement: (F = 9.872; P < 0.001) | 0.9 0.7 0.0 | < 0.0001 < 0.0001 < 0.0001 | |
| Sleepiness on‐shift overall | "Using the paired t‐test, we compared subjective sleepiness between two conditions (with bright light and with normal light). A repeated measure ANOVA showed interaction between independent variables in this study. The level of significance was defined at P < 0.05. (examined treatment effect, carry‐over effect, and period effect)." | The findings for treatment effect, period effect and carry‐over effect of the study population: Treatment effect: t df P value –21.95 89 0.001 | 0.9 0.7 0.0 | < 0.0001 < 0.0001 < 0.0001 | |
| Sleep efficiency (actigraph) | "The data obtained during night work were submitted to ANOVA for repeated measures, with correction for unequal variances according to Huynh and Feldt (Huynh 1976). The two‐way ANOVA included the factors of condition (Bright light/Normal light) and day (15 examined night shifts). A third factor, time of day, was added for variables with several measures during 1 day (for melatonin and KSS). A fourth factor, week (three studied night work weeks), was added to give a more detailed analysis of KSS ratings. Posthoc mean comparisons were carried out with contrasts. KSS ratings during the night shift week (means of 3 weeks): As some workers showed missing data on Fridays, this day was omitted from the analysis. To reflect the many data points, a four‐way analysis of variance including the factors of condition, week (3 weeks), night (night 1–4 of each week) and time of day, were used." | Condition: NS (no P value reported) Cond./Night Interaction: NS | 0.9 0.7 0.0 | < 0.0001 0.02 0.20 | |
| Total sleep time‐main sleep (bed time; final awakening) | Condition: NS (no P value reported) Cond./Night Interaction: NS | 0.9 0.7 0.0 | 0.01 0.14 0.43 | ||
| Total sleep time‐24‐hr sleep | Condition: (P < 0.05) Cond./Night Interaction: NS | 0.9 0.7 0.0 | < 0.0001 0.04 0.24 | ||
| Sleepiness on‐shift KSS (overall) | Sleepiness: "No main effects were obtained except for time of day showing an increase of sleepiness throughout the night shift (F = 36.46; P = 0.0001; df = 3/45). A significant interaction was obtained (Fig. 2) for the interaction of condition, night and time (F = 2.39; P = 0.0365; df = 9/135). Sleepiness was significantly reduced in the bright light condition at 02:00 hours on Tuesday; at 04:00 hours on Monday, Tuesday and Thursday; and at 06:00 hours on Tuesday and Thursday as shown by the posthoc mean comparisons. The reduction of sleepiness in the bright light condition was further emphasised by the significant interaction of condition and time of day (F = 3.07; P = 0.0429; df = 3/45). The interaction of week + light was insignificant." | 0.9 0.7 0.0 | < 0.0001 0.06 0.31 | ||
| Sleepiness on‐shift KSS (postintervention) | 0.9 0.7 0.0 | < 0.0001 0.09 0.35 | |||
| Sleepiness on‐shift – Reaction time – postintervention (03:00 and 04:00 and 05:00 and 06:00) | "For each of the dependent variables, a set of 2 x 2 repeated measures ANOVAs were carried out. In order to control for interindividual variability in baseline performance, scores for all four dependent variables (response speed, M10%RT, lapse frequency and subjective sleepiness) were expressed relative to the baseline test score obtained at 00:00 hours, calculated by subtracting the 00:00 hours’ value from each hourly score. That is, 00:00 hours scores were zeroed and subsequent scores were relative to this point. Relative scores at each hour of shift were then averaged to obtain the mean relative performance across participants. In order to analyse specific time differences in the dependent variables after the nap, parallel ANOVAs were carried out with different levels entered for the time factor (i.e. before nap and 03:00 hours; before nap and 04:00 hours; before nap and 05:00 hours; before nap and 06:00 hours). Before‐nap mean scores were calculated from a combined average of 00:00, 01:00 and 02:00 hours data. As the aim was to compare nap and no‐nap conditions after the nap, the statistics of interest were the nap × time interactions. Significant interactions were observed for response speed at 04:00 and 06:00… and for subjective sleepiness at 03:00 and 04:00. … Participants therefore had faster reaction times, and less subjective sleepiness, after the nap." | Before nap vs 06:00 Nap: P = 0.002 Time: P = 0.011 N x T : P = 0.012 | 0.9 0.7 0.0 | < 0.0001 0.02 0.21 | |
| Sleepiness on‐shift – Subjective sleepiness score – postintervention (03:00 and 04:00 and 05:00 and 06:00) | Before nap vs 06:00 Nap: P = 0.16 Time: P = 0.201 N x T : P = 0.095 | 0.9 0.7 0.0 | < 0.0001 < 0.0001 0.05 | ||
| df: Degrees of Freedom KSS: Karolinska Sleepiness Scale M10%RT: Mean of the fastest 10% reaction time NS: Not Significant RT: Reaction Time | |||||
| Outcome or subgroup title | No. of studies | No. of participants | Statistical method | Effect size |
| 1 Sleepiness during the night shift, overall, Stanford Sleepiness Scale (Scale: 1‐7) Show forest plot | 2 | Mean Difference (Random, 95% CI) | ‐0.83 [‐1.31, ‐0.36] | |
| 2 Sleepiness during the night shift, overall, Karolinska Sleepiness Scale (Scale: 1‐9) Show forest plot | 1 | Mean Difference (Fixed, 95% CI) | Totals not selected | |
| 3 Sleepiness during the night shift, postintervention only, Stanford Sleepiness Scale (Scale: 1‐7) Show forest plot | 1 | Mean Difference (Fixed, 95% CI) | Totals not selected | |
| 4 Sleepiness during the night shift, post‐intervention only, Karolinska Sleepiness Scale (Scale: 1‐9) Show forest plot | 1 | Mean Difference (Fixed, 95% CI) | Totals not selected | |
| 5 Total sleep time, next day (Actigraph ‐ hours) Show forest plot | 1 | Mean Difference (Fixed, 95% CI) | Totals not selected | |
| 5.1 Main sleep time only | 1 | Mean Difference (Fixed, 95% CI) | 0.0 [0.0, 0.0] | |
| 5.2 24‐hr sleep time, including naps | 1 | Mean Difference (Fixed, 95% CI) | 0.0 [0.0, 0.0] | |
| 6 Sleep efficiency, next day (Actigraph ‐ %) Show forest plot | 1 | Mean Difference (Fixed, 95% CI) | Totals not selected | |
| Outcome or subgroup title | No. of studies | No. of participants | Statistical method | Effect size |
| 1 Sleepiness during the night shift (5‐min. Reaction Time Test ‐ milliseconds) Show forest plot | 1 | Mean Difference (Fixed, 95% CI) | Totals not selected | |
| 2 Total sleep time, next day (Actiwatch ‐ hours) Show forest plot | 1 | Mean Difference (Fixed, 95% CI) | Totals not selected | |
| 3 Sleep onset latency, next day (Actiwatch ‐ minutes) Show forest plot | 1 | Mean Difference (Fixed, 95% CI) | Totals not selected | |
| 4 Sleep efficiency, next day (Actiwatch ‐ %) Show forest plot | 1 | Mean Difference (Fixed, 95% CI) | Totals not selected | |
| Outcome or subgroup title | No. of studies | No. of participants | Statistical method | Effect size |
| 1 Sleepiness during the day shift (Karolinska Sleepiness Scale) Show forest plot | 1 | Mean Difference (Fixed, 95% CI) | Totals not selected | |
| 2 Sleep quality, next night (Visual Analogue Scale ‐ 0 to 10) Show forest plot | 1 | Mean Difference (Fixed, 95% CI) | Totals not selected | |
| Outcome or subgroup title | No. of studies | No. of participants | Statistical method | Effect size |
| 1 Total sleep time, next night (sleep log ‐ hours) Show forest plot | 1 | Mean Difference (IV, Fixed, 95% CI) | Totals not selected | |
| 2 Sleep onset latency, next night (sleep log ‐ minutes) Show forest plot | 1 | Mean Difference (IV, Fixed, 95% CI) | Totals not selected | |
| Outcome or subgroup title | No. of studies | No. of participants | Statistical method | Effect size |
| 1 Sleepiness during the day shift, days (5‐min. Reaction Time Test ‐ milliseconds) Show forest plot | 1 | Mean Difference (Fixed, 95% CI) | Totals not selected | |
| 2 Total sleep time, next night (Actiwatch ‐ hours) Show forest plot | 1 | Mean Difference (Fixed, 95% CI) | Totals not selected | |
| 3 Sleep onset latency, next night (Actiwatch ‐ minutes) Show forest plot | 1 | Mean Difference (Fixed, 95% CI) | Totals not selected | |
| 4 Sleep efficiency, next night (Actiwatch ‐ %) Show forest plot | 1 | Mean Difference (Fixed, 95% CI) | Totals not selected | |
| Outcome or subgroup title | No. of studies | No. of participants | Statistical method | Effect size |
| 1 Sleepiness during the night shift (Psychomotor Vigilance Test: Median Reaction Time ‐ milliseconds) Show forest plot | 1 | Mean Difference (IV, Fixed, 95% CI) | Totals not selected | |
| Outcome or subgroup title | No. of studies | No. of participants | Statistical method | Effect size |
| 1 Total sleep time, next night (Actigraph ‐ hours) Show forest plot | 1 | Mean Difference (Fixed, 95% CI) | Totals not selected | |
| 2 Sleep onset latency, next night (Actigraph ‐ minutes) Show forest plot | 1 | Mean Difference (Fixed, 95% CI) | Totals not selected | |
| 3 Sleep efficiency, next night (Actiwatch ‐ %) Show forest plot | 1 | Mean Difference (Fixed, 95% CI) | Totals not selected | |
| Outcome or subgroup title | No. of studies | No. of participants | Statistical method | Effect size |
| 1 Sleepiness during the night shift, postintervention (Psychomotor Vigilance Test ‐ Mean Reaction Time ‐ milliseconds) Show forest plot | 2 | Mean Difference (Random, 95% CI) | ‐11.87 [‐31.94, 8.20] | |
| 2 Sleepiness during the night shift, postintervention (Karolinska Sleepiness Scale) Show forest plot | 2 | Mean Difference (Fixed, 95% CI) | Totals not selected | |
| 2.1 Cross‐over design | 1 | Mean Difference (Fixed, 95% CI) | 0.0 [0.0, 0.0] | |
| 2.2 Parallel design | 1 | Mean Difference (Fixed, 95% CI) | 0.0 [0.0, 0.0] | |
| 3 Sleepiness during the night shift, postintervention (Psychomotor Vigilance Test (Slowest 10% reciprocal reaction time ‐ milliseconds ) Show forest plot | 2 | Mean Difference (Fixed, 95% CI) | Totals not selected | |
| 3.1 Cross‐over design | 1 | Mean Difference (Fixed, 95% CI) | 0.0 [0.0, 0.0] | |
| 3.2 Parallel design | 1 | Mean Difference (Fixed, 95% CI) | 0.0 [0.0, 0.0] | |
| 4 Sleepiness during the night shift, postintervention (Subjective Sleepiness Score ‐ "0 to 100") Show forest plot | 1 | Mean Difference (Fixed, 95% CI) | Totals not selected | |
| Outcome or subgroup title | No. of studies | No. of participants | Statistical method | Effect size |
| 1 Sleepiness during the night shift, postintervention (Visual Analogue Scale ‐ 0 mm to 100 mm) Show forest plot | 1 | Mean Difference (IV, Fixed, 95% CI) | Totals not selected | |
| Outcome or subgroup title | No. of studies | No. of participants | Statistical method | Effect size |
| 1 Sleep quality, postintervention (PSQI ‐ score) Show forest plot | 1 | Mean Difference (IV, Fixed, 95% CI) | Totals not selected | |