Rociamiento espacial con insecticida para la prevención de la transmisión del paludismo
Appendices
Appendix 1. Detailed search strategies
CENTRAL
Issue 4 of 12, April 2018
ID Search Hits
#1 "malaria":ti,ab,kw (Word variations have been searched)
#2 MeSH descriptor: [Malaria] explode all trees
#3 MeSH descriptor: [Insect Vectors] explode all trees
#4 mosquito* or anophel*
#5 MeSH descriptor: [Mosquito Control] explode all trees
#6 MeSH descriptor: [Anopheles] explode all trees
#7 #1 or #2 or #3 or #4 or #5 or #6 4652
#8 aerosol* or droplet* or "cold fog*" or "thermal fog* " or "space spray*" or fogging or misters
#9 "Mist Blower" or "fumigant canister*" or "aerial spray*" or "spray* equipment" or "ultralow volume" or "ultralow‐volume" or ULV
#10 MeSH descriptor: [Aerosols] explode all trees
#11 MeSH descriptor: [Fumigation] explode all trees
#12 #8 or #9 or #10 or #11
#13 #7 and #12
MEDLINE
| Search set | Search terms |
| 1 | Malaria* Title/Abstract , [Mesh] |
| 2 | "Insect Vectors"[Mesh] OR vector* ti, ab OR mosquito* or anophel* Title/Abstract |
| 3 | 1 or 2 |
| 4 | "Mosquito Control"[Mesh] |
| 5 | "Anopheles"[Mesh] |
| 6 | 3 or 4 or 5 |
| 7 | ((((aerosol*) OR droplet*) OR "cold fog*") OR "thermal fog* ") OR space spray* OR fogging OR misters Title/Abstract |
| 8 | “Mist Blower” OR “fumigant canister*” OR “aerial spray*” OR “spray* equipment” OR “ultralow volume” OR “ultralow‐volume” OR ULV Title/Abstract |
| 9 | "Aerosols"[Mesh] |
| 10 | "Fumigation"[Mesh] |
| 11 | 7 OR 8 OR 9 OR 10 |
| 12 | 6 AND 11 |
Embase
1 malaria/ or malaria.mp.
2 insect vector/
3 (mosquito* or anophel*).mp.
4 mosquito control.mp. or mosquito control/
5 exp Anopheles/
6 1 or 2 or 3 or 4 or 5
7 (aerosol* or droplet* or "cold fog*" or "thermal fog*" or "space spray*" or fogging or misters).mp.
8 pesticide spraying/
9 ("Mist Blower" or "fumigant canister*" or "aerial spray*" or "spray* equipment" or "ultralow volume" or "ultra‐low volume" or ULV).mp
10 aerosol/
11 fumigation.mp. or fumigation/
12 7 or 8 or 9 or 10 or 11
13 6 and 12
CABI: CAB Abstracts®
| Set | |
| # 3 | #4 AND #2 Indexes=CAB Abstracts Timespan=All years |
| # 2 | TOPIC: (malaria or anopheles) Indexes=CAB Abstracts Timespan=All years |
| # 1 | TOPIC: (aerosol* or droplet* or "cold fog*" or "thermal fog* " or "space spray*" or fogging or misters) ORTOPIC: ("Mist Blower" or "fumigant canister*" or "aerial spray*" or "spray* equipment" or "ultralow volume" or ULV) Indexes=CAB Abstracts Timespan=All years |
LILACS
(tw:(malaria OR anopheles)) AND (tw:(aerosol* OR droplet* OR "cold fog*" OR "thermal fog* " OR "space spray*" OR fogging OR misters OR "Mist Blower" OR "fumigant canister*" OR "aerial spray*" OR "spray* equipment" OR "ultralow volume" OR ulv)) AND (instance:"regional") AND ( db:("LILACS"))
WHO ICTRP
Mosquito AND “space spraying”
Mosquito AND spraying
Mosquito AND insecticides
ClinicalTrials.gov
Mosquito AND “space spraying”
Mosquito AND spraying
Mosquito AND insecticides
Space spraying with hand‐held equipment to control the mosquito population in Thailand

‘Risk of bias' summary: review authors' judgements about each risk of bias item for each included study. We did not assess the risk of bias for Hobbs 1976 or Seleena 2004, as the evidence of the effectiveness of space spraying in these studies has not been presented in this review or included in the analysis.

Incidence of clinical malaria per 1000 population in the Miragoane Valley of Haiti, March 1972 to February 1973. Incidence in the sprayed zone of the study site is shown in blue; the incidence in the surrounding untreated area is shown in red. The vertical red lines indicate the start and end of the space spraying intervention.

Number of cases of clinical malaria in Pudupettai, India, reported monthly between 1979 and 1982. The vertical red line indicates the start of the space spraying intervention.

Number of cases of clinical malaria in Vanapuram, India, reported monthly between 1980 and 1984. The vertical red line indicates the start of the space spraying intervention.

Number of cases of clinical malaria in Melpallipattu, India, reported monthly between 1980 and 1984. The vertical red line indicates the start of the space spraying intervention.

Number of cases of clinical malaria in Sathanur Dam, India, reported monthly between 1980 and 1984. The vertical red line indicates the start of the space spraying intervention.

Mosquito density measured in the sprayed region in Haiti using updraft UV light‐traps, March 1972 to February 1973. The initial implementation and end of the space spraying intervention are illustrated by vertical red lines.

Mosquito density measured as a human biting rate in the sprayed region in Haiti, March 1972 to February 1973. The initial implementation and end of the space spraying intervention are illustrated by vertical red lines.

Comparison 1 Space spraying versus no space spraying, Outcome 1 Incidence of malaria (step rate ratio: indicating the impact of space spraying at the first pre‐intervention time point).
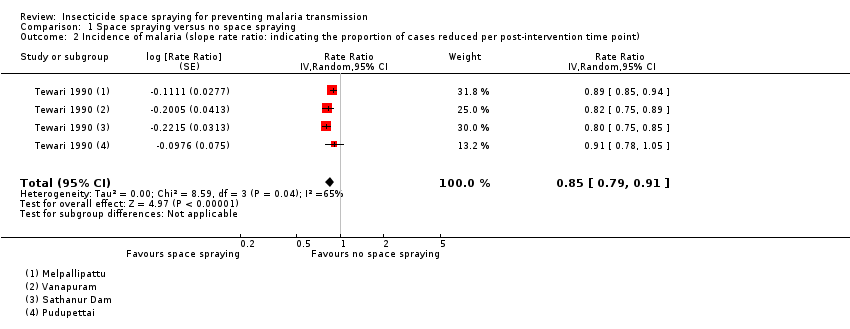
Comparison 1 Space spraying versus no space spraying, Outcome 2 Incidence of malaria (slope rate ratio: indicating the proportion of cases reduced per post‐intervention time point).
| Space spraying compared to no space spraying for reducing malaria transmission | ||||||
| Patient or population: people of all ages | ||||||
| Outcomes | Anticipated absolute effects* (95% CI) | Relative effect | Number of participants | Certainty of the evidence | Comments | |
| Risk with no space sprayinga | Risk following space sprayingb | |||||
| Malaria cases per month | 6 per 1000 | Instant effect: 6 per 1000 (3 to 12) Effect after 12 months follow‐up: 1 per 1000 (0 to 2 per 1000) | Step rate ratio: 1.00 Slope rate ratio: 0.85 | (1 observational study: 4 sites) | ⊕⊝⊝⊝ downgraded due to risk of bias, indirectness, and imprecision | We do not know if space spraying causes an immediate shift in the trend of malaria incidence over time or a change in the slope of the trend (that is, a proportional reduction in cases per month). |
| *The risk in the intervention group (and its 95% CI) is based on the assumed risk in the comparison group and the relative effect of the intervention (and its 95% CI). | ||||||
| GRADE Working Group grades of evidence | ||||||
| aWe estimated the risk with no space spraying by calculating the mean monthly incidence of malaria across each of the study sites. We include only incidence data from complete years (January to December without intervention) in the calculation. | ||||||
| Compound and formulation | Concentration (g Al/ha) | |
| Cold fog | Thermal fog | |
| Deltamethrin ULV | 0.5 to 1.0 | 0.5 to 1.0 |
| Deltamethrin EW | 1.0 | — |
| Lambda‐cyhalothrin EC | 1.0 to 2.0 | 2.0 |
| Malathion EW and ULV | 112 to 600 | 112 to 600 |
| d‐d, trans‐cyphenothrin EC | 3.5 to 4.0 | 3.5 to 4.0 |
| Abbreviations: EC: emulsifiable concentrate; EW: emulsion, oil in water; ULV: ultra‐low volume liquid; AI: active ingredient | ||
| Study | Active ingredient/formulation/dose | Delivery method | Frequency and timing of application | Who implemented the intervention | Vector species |
| Haiti (Krogstad 1975) | Malathion 95%
| Aerial (Beech D‐18 aircraft) | Every 10 days | The Service National d'Eradication de la Malaria (SNEM), supported by USAID | An albimanus |
| India (Tewari 1990) | Malathion
See Characteristics of included studies for further details | Ground (hand‐held Fontan and Enfog sprayers, jeep‐mounted Tifa machines and handcart‐mounted Tiga machines | In Pudupettai, spraying was conducted weekly for 6 rounds, and subsequently applied in response to new cases or increases in vector density. Time of spraying: 8pm ‐ 10pm and 5am ‐ 7am | State National Malaria Elimination Programme (NMEP), with guidance from the Pondicherry Vector Control Research Centre | An culicifacies |
| El Salvador (Hobbs 1976) | 5% pyrethrin with 15% piperonyl butoxide
| Ground (truck‐mounted Leco sprayer) | Weekly. Time of spraying: 6pm ‐ 7pm | Central America Research Station (CARS) | An albimanus |
| Malaysia (Seleena 2004) | Alphacypermethrin
| Ground, with hand‐held sprayers | Monthly Time of spraying: not stated | Spray team of villagers, headed by a local public health inspector | (1o)Anopheles balabacensis (2o)An sundaicus, An flavirostris |
| Abbreviations: AI: active ingredient; ULV: ultra‐low volume. | |||||
| Outcome or subgroup title | No. of studies | No. of participants | Statistical method | Effect size |
| 1 Incidence of malaria (step rate ratio: indicating the impact of space spraying at the first pre‐intervention time point) Show forest plot | 1 | Rate Ratio (Random, 95% CI) | 1.00 [0.51, 1.92] | |
| 2 Incidence of malaria (slope rate ratio: indicating the proportion of cases reduced per post‐intervention time point) Show forest plot | 1 | Rate Ratio (Random, 95% CI) | 0.85 [0.79, 0.91] | |