Enteral versus parenteral nutrition and enteral versus a combination of enteral and parenteral nutrition for adults in the intensive care unit
Abstract
Background
Critically ill people are at increased risk of malnutrition. Acute and chronic illness, trauma and inflammation induce stress‐related catabolism, and drug‐induced adverse effects may reduce appetite or increase nausea and vomiting. In addition, patient management in the intensive care unit (ICU) may also interrupt feeding routines. Methods to deliver nutritional requirements include provision of enteral nutrition (EN), or parenteral nutrition (PN), or a combination of both (EN and PN). However, each method is problematic. This review aimed to determine the route of delivery that optimizes uptake of nutrition.
Objectives
To compare the effects of enteral versus parenteral methods of nutrition, and the effects of enteral versus a combination of enteral and parenteral methods of nutrition, among critically ill adults, in terms of mortality, number of ICU‐free days up to day 28, and adverse events.
Search methods
We searched CENTRAL, MEDLINE, and Embase on 3 October 2017. We searched clinical trials registries and grey literature, and handsearched reference lists of included studies and related reviews.
Selection criteria
We included randomized controlled studies (RCTs) and quasi‐randomized studies comparing EN given to adults in the ICU versus PN or versus EN and PN. We included participants that were trauma, emergency, and postsurgical patients in the ICU.
Data collection and analysis
Two review authors independently assessed studies for inclusion, extracted data, and assessed risk of bias. We assessed the certainty of evidence with GRADE.
Main results
We included 25 studies with 8816 participants; 23 studies were RCTs and two were quasi‐randomized studies. All included participants were critically ill in the ICU with a wide range of diagnoses; mechanical ventilation status between study participants varied. We identified 11 studies awaiting classification for which we were unable to assess eligibility, and two ongoing studies.
Seventeen studies compared EN versus PN, six compared EN versus EN and PN, two were multi‐arm studies comparing EN versus PN versus EN and PN. Most studies reported randomization and allocation concealment inadequately. Most studies reported no methods to blind personnel or outcome assessors to nutrition groups; one study used adequate methods to reduce risk of performance bias.
Enteral nutrition versus parenteral nutrition
We found that one feeding route rather than the other (EN or PN) may make little or no difference to mortality in hospital (risk ratio (RR) 1.19, 95% confidence interval (CI) 0.80 to 1.77; 361 participants; 6 studies; low‐certainty evidence), or mortality within 30 days (RR 1.02, 95% CI 0.92 to 1.13; 3148 participants; 11 studies; low‐certainty evidence). It is uncertain whether one feeding route rather than the other reduces mortality within 90 days because the certainty of the evidence is very low (RR 1.06, 95% CI 0.95 to 1.17; 2461 participants; 3 studies). One study reported mortality at one to four months and we did not combine this in the analysis; we reported this data as mortality within 180 days and it is uncertain whether EN or PN affects the number of deaths within 180 days because the certainty of the evidence is very low (RR 0.33, 95% CI 0.04 to 2.97; 46 participants).
No studies reported number of ICU‐free days up to day 28, and one study reported number of ventilator‐free days up to day 28 and it is uncertain whether one feeding route rather than the other reduces the number of ventilator‐free days up to day 28 because the certainty of the evidence is very low (mean difference, inverse variance, 0.00, 95% CI ‐0.97 to 0.97; 2388 participants).
We combined data for adverse events reported by more than one study. It is uncertain whether EN or PN affects aspiration because the certainty of the evidence is very low (RR 1.53, 95% CI 0.46 to 5.03; 2437 participants; 2 studies), and we found that one feeding route rather than the other may make little or no difference to pneumonia (RR 1.10, 95% CI 0.82 to 1.48; 415 participants; 7 studies; low‐certainty evidence). We found that EN may reduce sepsis (RR 0.59, 95% CI 0.37 to 0.95; 361 participants; 7 studies; low‐certainty evidence), and it is uncertain whether PN reduces vomiting because the certainty of the evidence is very low (RR 3.42, 95% CI 1.15 to 10.16; 2525 participants; 3 studies).
Enteral nutrition versus enteral nutrition and parenteral nutrition
We found that one feeding regimen rather than another (EN or combined EN or PN) may make little or no difference to mortality in hospital (RR 0.99, 95% CI 0.84 to 1.16; 5111 participants; 5 studies; low‐certainty evidence), and at 90 days (RR 1.00, 95% CI 0.86 to 1.18; 4760 participants; 2 studies; low‐certainty evidence). It is uncertain whether combined EN and PN leads to fewer deaths at 30 days because the certainty of the evidence is very low (RR 1.64, 95% CI 1.06 to 2.54; 409 participants; 3 studies). It is uncertain whether one feeding regimen rather than another reduces mortality within 180 days because the certainty of the evidence is very low (RR 1.00, 95% CI 0.65 to 1.55; 120 participants; 1 study).
No studies reported number of ICU‐free days or ventilator‐free days up to day 28. It is uncertain whether either feeding method reduces pneumonia because the certainty of the evidence is very low (RR 1.40, 95% CI 0.91 to 2.15; 205 participants; 2 studies). No studies reported aspiration, sepsis, or vomiting.
Authors' conclusions
We found insufficient evidence to determine whether EN is better or worse than PN, or than combined EN and PN for mortality in hospital, at 90 days and at 180 days, and on the number of ventilator‐free days and adverse events. We found fewer deaths at 30 days when studies gave combined EN and PN, and reduced sepsis for EN rather than PN. We found no studies that reported number of ICU‐free days up to day 28. Certainty of the evidence for all outcomes is either low or very low. The 11 studies awaiting classification may alter the conclusions of the review once assessed.
PICOs
Plain language summary
Delivery of nutrition (food) to critically ill adults other than by the person eating and swallowing the food/nutrition
Background
Critically ill adults in the intensive care unit (ICU) are at an increased risk of malnutrition because the body responds to serious illness or injury by increasing the metabolic rate. Also, the person's feeding routine may be disrupted because they are unconscious or too ill to feed themselves or eat normally. This means alternative ways to ensure people receive adequate nutrition must be used. People may be given artificial nutrition in three ways: enteral feeding (through a tube placed into the stomach or small intestine; parenteral feeding (through a tube inserted into a vein whereby nutrients enter the bloodstream directly); or by a combination of both routes. This review compared the effects of these routes.
Study characteristics
The evidence is current to 3 October 2017. We included 25 studies with 8816 participants who had trauma, emergency, medical or postsurgical conditions and were in the ICU. Eleven studies are awaiting classification (because we did not have enough details to assess them) and two studies are ongoing. Included studies compared enteral feeding with parenteral feeding, or with combined enteral and parenteral feeding.
Key results
Studies reported the number of people who died from any cause at different time points. We found no evidence that enteral feeding compared to parenteral feeding or compared to a combination of routes was more or less likely to reduce the number of deaths in hospital, within 90 days and 180 days. We found evidence from three small studies that fewer people died within 30 days when feeding was given through combined enteral and parenteral routes. No studies reported number of ICU‐free days up to day 28 (i.e. length of stay in the ICU by taking account of expected participant loss because of death) and one study reported that the feeding route did not affect the number of ventilator‐free days.
We found no evidence that enteral feeding compared to parenteral feeding was likely to increase or decrease cases of aspiration (the entry of materials such as food from the digestive system to the lungs) or pneumonia (swelling of the tissue in one or both lungs that is usually caused by a bacterial infection). Enteral nutrition may reduce sepsis (a life‐threatening condition that arises when the body's response to infection causes injury to its own tissues and organs), although evidence was from studies of people with different conditions (such as trauma, medical, or postsurgical conditions). We found that fewer participants vomited if they were given parenteral feeding rather than enteral feeding, although there were few studies with very few reported events.
Certainty of the evidence
It was not possible for researchers to mask the ICU staff to the type of feeding route, which may have biased the findings, and study authors did not consistently report good study methods. People in each study had different types of critical illness (such as trauma, medical, or postsurgical conditions) which may have affected how they responded to the type of feeding route, and there were limited data for many of our measurements. We believed that the certainty of the evidence was low or very low.
Conclusion
We found insufficient evidence to determine with confidence whether one feeding route was better at reducing the number of deaths, the number of ventilator‐free days, and side effects. No studies reported number of ICU‐free days up to day 28. Evidence was of low and very low certainty, and we could not be confident in the findings of our review.
Authors' conclusions
Summary of findings
| Enteral versus parenteral nutrition for adults in the intensive care unit | |||||
| Patient or population: critically ill adults admitted to the ICU for trauma, emergency, or surgical care; population excluded people with acute pancreatitis | |||||
| Outcomes | Anticipated absolute effects* (95% CI) | Relative effect | Number of participants | Certainty of the evidence | |
| Risk with EN | Risk with PN | ||||
| Mortality | In‐hospital mortality | RR 1.19 | 361 | ⊕⊕⊝⊝ | |
| Study population | |||||
| 229 per 1000 | 192 per 1000 | ||||
| Mortality within 30 days | RR 1.02 (0.92 to 1.13) | 3148 | ⊕⊕⊝⊝ | ||
| Study population | |||||
| 304 per 1000 | 298 per 1000 | ||||
| Mortality within 90 days | RR 1.06 | 2461 | ⊕⊝⊝⊝ | ||
| Study population | |||||
| 393 per 1000 | 371 per 1000 | ||||
| Mortality within 180 days | RR 0.33 (0.04 to 2.97) | 46 | ⊕⊝⊝⊝ | ||
| Study population | |||||
| 130 per 1000 | 43 per 1000 (5 in 387) | ||||
| Number of ICU‐free days up to day 28 | – | – | – | – | Not measured |
| Number of ventilator‐free days up to day 28 | Mean number of ventilator‐free days: 14.2 (SD ± 12.2) | Mean difference 0 days (0.97 fewer to 0.97 more) | N/A | 2388 | ⊕⊝⊝⊝ |
| Adverse events: aspiration (as reported by study authors at end of study follow‐up period) | Study population | RR 1.53 | 2437 | ⊕⊝⊝⊝ | |
| 5 per 1000 | 3 per 1000 | ||||
| Adverse events: sepsis (as reported by study authors at end of study follow‐up period) | Study population | RR 0.59 (0.37 to 0.95) | 361 | ⊕⊕⊝⊝ | |
| 123 per 1000 | 209 per 1000 | ||||
| Adverse events: pneumonia (as reported by study authors at end of study follow‐up period) | Study population | RR 1.10 (0.82 to 1.48) | 415 | ⊕⊕⊝⊝ | |
| 314 per 1000 | 268 per 1000 | ||||
| Adverse events: vomiting (as reported by study authors at end of study follow‐up period) | Study population | RR 3.42 | 2525 | ⊕⊝⊝⊝ | |
| 11 per 1000 | 3 per 1000 | ||||
| *The risk in the intervention group (and its 95% confidence interval) is based on the assumed risk in the comparison group and the relative effect of the intervention (and its 95% CI). CI: confidence interval; EN: enteral nutrition; ICU: intensive care unit; N/A: not applicable; PN: parenteral nutrition; RR: risk ratio; SD: standard deviation. | |||||
| GRADE Working Group grades of evidence | |||||
| aAll studies had a high risk of performance bias; downgraded one level for study limitations. Studies included a variety of primary diagnoses and evidence was less direct; downgraded one level for indirectness. bAll studies had a high risk of performance bias; downgraded one level for study limitations. Studies included a variety of primary diagnoses and study designs and evidence were less direct; downgraded one level for indirectness. cAll studies had a high risk of performance bias; downgraded one level for study limitations. Studies included a variety of primary diagnoses and study designs and evidence were less direct; downgraded one level for indirectness. Few studies and one included study had a large number of participants relative to other included studies; downgraded one level for imprecision. dData from only one study that had a high risk of performance bias; downgraded one level for study limitations and two levels for imprecision. eAll studies had a high risk of performance bias; downgraded one level for study limitations. Studies included a variety of primary diagnoses and evidence was less direct; downgraded one level for indirectness. Few studies and one included study had a large number of participants relative to other included studies; downgraded one level for imprecision. fAll studies had a high risk of performance bias; downgraded one level for study limitations. Studies included a variety of primary diagnoses and evidence was less direct; downgraded one level for indirectness. gAll studies had a high risk of performance bias; downgraded one level for study limitations. Studies included a variety of primary diagnoses and study designs and evidence were less direct; downgraded one level for indirectness. Few studies, with very few events, and one included study had a large number of participants relative to other included studies; downgraded one level for imprecision. | |||||
| Enteral versus enteral and parenteral nutrition for adults in the intensive care unit | |||||
| Patient or population: critically ill adults admitted to the ICU for trauma, emergency, or post‐surgical care; population excludes participants with acute pancreatitis | |||||
| Outcomes | Anticipated absolute effects* (95% CI) | Relative effect | Number of participants | Certainty of the evidence | |
| Risk with EN | Risk with EN + PN | ||||
| Mortality | In‐hospital mortality | RR 0.99 (0.84 to 1.16) | 5111 | ⊕⊕⊝⊝ | |
| Study population | |||||
| 106 per 1000 | 107 per 1000 | ||||
| Mortality within 30 days | RR 1.64 (1.06 to 2.54) | 409 | ⊕⊝⊝⊝ | ||
| Study population | |||||
| 216 per 1000 | 132 per 1000 | ||||
| Mortality within 90 days | RR 1.00 (0.86 to 1.18) | 4760 (2 studies) | ⊕⊕⊝⊝ | ||
| Study population | |||||
| 115 per 1000 (99 to 135) | 115 per 1000 | ||||
| Mortality within 180 days | RR 1.00 | 120 (1 RCT) | ⊕⊝⊝⊝ | ||
| Study population | |||||
| 400 per 1000 (260 to 620) | 400 per 1000 | ||||
| Number of ICU‐free days up to day 28 | – | – | – | – | Not measured |
| Number of ventilator‐free days up to day 28 | – | – | – | – | Not measured |
| Adverse events: aspiration (as reported by study authors at end of study follow‐up period) | – | – | – | – | Not measured |
| Adverse events: sepsis (as reported by study authors at end of study follow‐up period) | – | – | – | – | Not measured |
| Adverse events: pneumonia (as reported by study authors at end of study follow‐up period) | 350 per 1000 (228 to 538) | 250 per 1000 | RR 1.40 (0.91 to 2.15) | 205 (2 studies) | ⊕⊝⊝⊝ Very lowd |
| Adverse events: vomiting (as reported by study authors at end of study follow‐up period) | – | – | – | – | Not measured |
| *The risk in the intervention group (and its 95% confidence interval) is based on the assumed risk in the comparison group and the relative effect of the intervention (and its 95% CI). CI: confidence interval; EN: enteral nutrition; ICU: intensive care unit; PN: parenteral nutrition; RCT: randomized controlled trial; RR: risk ratio. | |||||
| GRADE Working Group grades of evidence | |||||
| aAll studies had high risk of performance bias; downgraded one level for study limitations. Studies included a variety of primary diagnoses and evidence was less direct; downgraded one level for indirectness. bAll studies had high risk of performance bias; downgraded one level for study limitations. Studies included a variety of primary diagnoses and evidence was less direct; downgraded one level for indirectness. Few studies with increased risk of imprecision; downgraded one level. cBoth studies had high risk of performance bias; downgraded one level for study limitations. Studies included a variety of primary diagnoses and evidence was less direct; downgraded one level for indirectness. dData from only one study that had a high risk of performance bias; downgraded one level for study limitations and two levels for imprecision. | |||||
Background
Description of the condition
Malnutrition is associated with increased mortality and morbidity to include susceptibility to infectious complications, such as pulmonary infections, urinary infections, wound infections, and sepsis, and susceptibility to non‐infectious complications, such as respiratory failure and cardiac arrhythmias (Correia 2003; Mogensen 2015).
Acute and chronic illness, trauma, and inflammation induce stress‐related catabolism, increasing the metabolic rate at which the body breaks down food. In addition to this, drug‐related side effects may affect ingestion and lead to loss of appetite or nausea and vomiting, or both, and it has been suggested that hospital routines and lack of awareness among nursing staff may affect nutritional care (Norman 2008). Critically ill people, who may be unconscious, unable to feed themselves or unable to receive oral nutritional support, or both, are at increased susceptibility to malnutrition.
Nutritional support is a complex aspect of care for critically ill people. This systematic review aimed specifically to address the route of delivery that will optimize uptake of nutrition. It did not deal with supplementation of specific nutrients as a number of these are reviewed already (Allingstrup 2016; Dushianthan 2016; Tao 2014).
Description of the intervention
Enteral nutrition (EN) refers to the delivery of a nutritionally complete feed via a tube into the stomach, duodenum, or jejunum (NICE 2006). This method is suitable for people who have inadequate oral intake but a functional gastrointestinal tract, and some evidence suggests that it is an effective method of providing nutrition to particular patient groups (e.g. people with sepsis (Elke 2013); people with acute pancreatitis (Al‐Omran 2010)). EN may help to maintain the function and integrity of the gut barrier (Altintas 2011; King 1999; Kyle 2006), and is associated with increased immunoglobulin A production, which in turn may provide increased protection against airway infections. However, critically ill people may not tolerate enteral feeding well, and side effects such as nausea and vomiting may occur (Harvey 2015), and non‐occlusive bowel necrosis (Marvin 2000). In addition, high volumes of gastric residual may allow bacteria to colonize, and increase the risk of aspiration and complications, such as ventilator‐associated pneumonia (Altintas 2011), although one study assessing monitoring of gastric residual volume showed no difference in ventilator‐associated pneumonia with absence of monitoring (Reignier 2013). Furthermore, EN can be disturbed by patient care and diagnostic interventions, particularly among people receiving respiratory support (Corley 2017), and this may affect the capacity for EN to maintain nutritional goals (Kyle 2006; Seres 2013). Some benefit has been found from placing the tube into the duodenum or jejunum rather than the stomach (Alkhawaja 2015).
Parenteral nutrition (PN) is unphysiological and bypasses the gastrointestinal tract and portal venous system. It delivers a nutritionally complete feed intravenously via a central or peripheral venous catheter, and may be used as an alternative for people in need of nutritional support. It confers the advantage of ease of administration to the person (Seres 2013), often with no further intervention needed to provide nutritional support when all components are administered via an 'all in one bag' system. Whilst interrupting feeding during patient care is not necessary, PN may increase the risk of overfeeding (Singer 2009). PN is associated with a higher rate of hyperglycaemia; subsequently, people may require glycaemic control alongside PN. Earlier studies have reported increased susceptibility to infectious complications, such as catheter‐related bloodstream infections (Peter 2005).
PN may be used to supplement EN to achieve target energy requirements when EN alone is inadequate (Singer 2011).
Research findings are unclear regarding sufficient caloric intake needed to meet the energy requirements of critically ill people, and no evidence currently supports the assumption that these people benefit from a normocaloric intake (80% to 100% of energy requirements) rather than permissive underfeeding (less than 70% of energy requirements) (Marik 2016). Similarly, a target time for initiation of nutrition has been debated by researchers, with large randomized controlled trials (RCTs) (e.g. the EDEN (Early versus delayed enteral feeding to treat people with acute lung injury or acute respiratory distress syndrome) study (ARDS Clinical Trials Network 2012); the EPaNIC (Early Parenteral Nutrition Completing Enteral Nutrition in Adult Critically Ill Patients) study (Casaer 2011)), providing evidence that conflicts with European nutrition guidelines (ESPEN; Singer 2009), which advise early feeding during critical illness (Casaer 2014). Whilst this review aimed specifically to address the route of nutrition, both caloric intake and initiation time are also important considerations.
Why it is important to do this review
The most current American Society for Parenteral and Enteral Nutrition (ASPEN) guidelines recommend use of EN over PN (Taylor 2016), suggesting a reduction in infectious morbidity and length of stay in the intensive care unit (ICU) for people given EN. This is comparable with guidelines of the European Society for Parenteral and Enteral Nutrition (ESPEN) (Kreymann 2006; Singer 2009), and the UK National Institute for Health and Care Excellence (NICE) (NICE 2006). However, these guidelines reflect only research findings of small RCTs published prior to these guidelines, and current evidence contradicts some outcomes, for example, risk of infectious complications with PN.
It is highly debated if, how, and when nutritional support may contribute to improved patient outcomes (Casaer 2014; Preiser 2015; Schetz 2013). Nutrition for critically ill people has global relevance, achieving benefits for the patient and reducing impact on healthcare resources. This review aimed specifically to consider whether the route of delivery of nutrition is a significant factor in the treatment of critically ill adults, and incorporates recent findings to assess both evidence of benefit and risk of adverse events.
Objectives
To compare the effects of enteral versus parenteral methods of nutrition, and the effects of enteral versus a combination of enteral and parenteral methods of nutrition, among critically ill adults, in terms of mortality, number of ICU‐free days up to day 28 and adverse events.
Methods
Criteria for considering studies for this review
Types of studies
We included all randomized controlled trials (RCTs), including quasi‐randomized studies (e.g. studies in which the method of assignment was based on alternation, date of birth, or medical record number) and cluster‐randomized studies.
Types of participants
We included all adults, over 16 years of age, who had been in an ICU for at least 24 hours.
We included participants admitted for all conditions, except acute pancreatitis as this patient group is reviewed elsewhere (Al‐Omran 2010). We aimed to include studies that had a mixed population that included acute pancreatitis, if fewer than 50% of participants had acute pancreatitis; we aimed to contact study authors to request additional information if necessary.
We included trauma, emergency, medical, and elective postsurgical participants. We included mechanically ventilated and non‐mechanically ventilated participants.
If studies included participants of which not all were in the ICU, we included the study if study authors reported that more than 75% of participants were in the ICU.
Types of interventions
We included studies that compare EN versus PN, and studies that compared EN versus EN and PN. These represent two comparison groups; we analysed separately data from studies comparing EN versus PN and studies comparing EN versus EN and PN.
We included EN that was given via a tube into the stomach, duodenum, or jejunum, and PN that was given via a central venous catheter or a peripheral venous catheter. We anticipated that the protocol used to administer nutrition would differ between studies. We included EN and PN initiated early or delayed, and given to meet a normocaloric or hypocaloric goal.
Types of outcome measures
We aimed to establish whether one type of feeding method reduced the rate of mortality among study participants and considered data gathered at different time points, up to 180 days. Length of stay in the ICU was an important outcome for this review topic. Given that rates of mortality may be high in the included population, and to avoid the effect of death on this outcome, we planned to report data presented as ICU‐free days. Similarly, we planned to assess duration of mechanical ventilation as the number of ventilator‐free days. These outcomes account for the number of days that a person is alive or is no longer using mechanical ventilation; therefore, a participant who has died would be counted as having zero ICU‐free or ventilator‐free days. Adverse events represent an important outcome for this review, and EN and PN may lead to different adverse events. For each adverse event reported by study authors, we collected data during the study follow‐up period.
Primary outcomes
-
Mortality (measured: in‐hospital, within 30 days, within 90 days, and within 180 days).
Secondary outcomes
-
Number of ICU‐free days up to day 28.
-
Number of ventilator‐free days up to day 28.
-
Adverse events as reported by study authors (to include hyperglycaemia, aspiration pneumonia, catheter‐related bloodstream infections, and gastrointestinal events).
Search methods for identification of studies
Electronic searches
We identified RCTs through literature searching with systematic and sensitive search strategies as outlined in Chapter 6.4 of the Cochrane Handbook of Systematic Reviews of Interventions (Higgins 2011). We applied no restrictions to language or publication status.
We searched the following databases for relevant trials:
-
Cochrane Central Register of Controlled Trials (CENTRAL; 2017, Issue 9);
-
MEDLINE (OvidSP, 1946 to 3 October 2017);
-
Embase (OvidSP, 1974 to 3 October 2017).
We developed a subject‐specific search strategy in MEDLINE and used that as the basis for the search strategies in the other listed databases. The search strategy was developed in consultation with the Information Specialist. Search strategies can be found in Appendix 1; Appendix 2; and Appendix 3.
We scanned the following trial registries for ongoing and unpublished trials (8 January 2018):
-
World Health Organization International Clinical Trials Registry Platform (www.who.int/ictrp/en/);
-
ClinicalTrials.gov (clinicaltrials.gov).
Searching other resources
We carried out citation searching of identified included studies in Web of Science (apps.webofknowledge.com), on 24 March 2017 and conducted a search of grey literature through Opengrey (www.opengrey.eu./), on 27 April 2017. We scanned reference lists of relevant systematic reviews to search for additional trials. We did not contact study authors or organizations to ask if they were aware of other completed or ongoing studies.
Data collection and analysis
Two review authors (SL and OSR) independently completed all data collection and analyses before comparing results and reaching consensus. We consulted with a third review author (AS) to resolve conflicts when necessary.
Selection of studies
We used reference management software to collate the results of searches and to remove duplicates (Endnote). We used Covidence software to screen results of the search of titles and abstracts and identify potentially relevant studies (Covidence). We sourced the full texts of all potentially relevant studies and considered whether they meet the inclusion criteria (see Criteria for considering studies for this review). We reviewed abstracts at this stage and included these in the review only if they provided sufficient information and relevant results that included denominator figures for each intervention/comparison group. We recorded the number of papers retrieved at each stage and reported this information using a PRISMA flow chart. We reported in the review brief details of closely related but excluded papers.
Data extraction and management
We used Covidence software to extract data from individual studies (Covidence). A basic template for data extraction forms is available at www.covidence.org. We adapted this template to include the following information.
-
Methods: type of study design; setting; dates of study; funding sources.
-
Participants: number of participants randomized to each group; baseline characteristics (to include "Acute Physiology and Chronic Health Evaluation II" (APACHE II) scores, whether mechanically ventilated and length of time in the ICU before study commencement).
-
Interventions: details of intervention and comparison nutrition (kilocalories per kilogram received, time of initiation, duration of delivery, use of glycaemic controls).
-
Outcomes: all relevant review outcomes as measured and reported by study authors.
-
Outcome data: results of outcome measures.
We considered the applicability of information from individual studies and the generalizability of data to our intended study population (i.e. the potential for indirectness in our review). If we found associated publications from the same study, we created a composite dataset based on all eligible publications.
Assessment of risk of bias in included studies
Two review authors (SL and OSR) independently assessed study quality, study limitations, and the extent of potential bias by using the Cochrane ’Risk of bias’ tool (Higgins 2011). We considered the following domains.
-
Sequence generation (selection bias).
-
Allocation concealment (selection bias).
-
Blinding of participants, personnel, and outcome assessors (performance and detection bias).
-
Incomplete outcome data (attrition bias).
-
Selective outcome reporting (reporting bias).
-
Other: use of concomitant drugs.
We anticipated that it would not be feasible for studies to blind participants and personnel and, in the absence of any description of personnel blinding, we assumed that no blinding occurred. However, we anticipated that it was feasible to blind outcome assessors and we considered risk of detection bias (outcome assessor blinding) by each outcome. We considered whether investigators used standard criteria for diagnosis of outcomes, for example, aspiration pneumonia or ventilator‐acquired pneumonia, which may be subject to clinician bias.
For each domain, we judged whether study authors had made sufficient attempts to minimize bias in their study design. We made judgements using three measures; high, low, and unclear risk of bias. We recorded this judgement in ’Risk of bias’ tables and presented a summary ’Risk of bias’ figure.
Measures of treatment effect
We collected dichotomous data for mortality and adverse events, and continuous data for number of ICU‐free days and number of ventilator‐free days. We reported dichotomous data as risk ratios (RR) to compare groups, and continuous data as a mean difference (MD). We reported 95% confidence intervals (CI).
Unit of analysis issues
(See Differences between protocol and review.) We conducted separate analysis for the comparison arms PN, and EN and PN; this method avoided double‐counting in multi‐arm studies.
In the event of cluster trials, we would have defined the unit of allocation as the ICU or the hospital rather than the individual participant and analysed data accordingly, calculating effect estimates using the generic inverse variance method (Higgins 2011).
Dealing with missing data
In the event that study authors did not account for missing data, we would have contacted them for information. We considered data to be complete if losses were reported and explained by study authors and we combined no incomplete data in the meta‐analysis.
Assessment of heterogeneity
We assessed whether evidence of inconsistency was apparent in our results by considering heterogeneity. We assessed clinical heterogeneity by comparing similarities in our included studies between study designs, participants, interventions, and outcomes, and used the data collected as stated under Data extraction and management. We assessed statistical heterogeneity by calculating the Chi² test or I² statistic and judged any heterogeneity above an I² value of 60% and a Chi² P value less than or equal to 0.05 to indicate moderate to substantial statistical heterogeneity (Higgins 2011).
In addition to looking at statistical results, we considered point estimates and overlap of CIs. If CIs overlap, then results are more consistent. Combined studies may show a large consistent effect but with significant heterogeneity. Therefore, we planned to interpret heterogeneity with caution (Guyatt 2011a).
Assessment of reporting biases
We attempted to source published protocols for each of our included studies by using clinical trials registers. We compared published protocols with published study results to assess the risk of selective reporting bias. If we identified sufficient studies reporting on an outcome (i.e. more than 10 studies (Higgins 2011)), we planned to generate a funnel plot to assess risk of publication bias in the review; an asymmetrical funnel plot may suggest publication of only positive results (Egger 1997).
Data synthesis
We completed meta‐analyses of outcomes for which we had comparable effect measures from more than one study, and when measures of heterogeneity indicated that pooling of results was appropriate. We did not pool studies that had a high level of clinical heterogeneity and moderate to high statistical heterogeneity indicated by I² statistics and Chi² P values. We used the statistical calculator provided in Review Manager to perform meta‐analysis (Review Manager 2014).
For dichotomous outcomes, for example, mortality rate, we calculated the RR using summary data presented in each trial. We used the Mantel‐Haenszel effects model. If events had been extremely rare (one per 1000), we would have used the Peto odds ratio (Higgins 2011). For continuous outcomes, we aimed to use the MD. We used a fixed‐effect statistical model. In the event of finding evidence of moderate statistical or clinical heterogeneity, we would have investigated this by performing subgroup analyses, as below, and analysed data using a random‐effects model to incorporate unexplained heterogeneity.
We calculated CIs at 95% and used a P value less than or equal to 0.05 to judge whether a result was statistically significant. We considered imprecision in the results of analyses by assessing the CI around an effects measure; a wide CI would suggest a higher level of imprecision in our results. A small number of identified studies may also reduce precision (Guyatt 2011b).
Subgroup analysis and investigation of heterogeneity
Study designs may differ in relation to time of initiation of feeding and target energy requirements given to participants. Therefore, we considered these subgroups for each of our outcomes. We used cut‐offs for time of feeding from the most recent ASPEN guidelines (Taylor 2016), and cut‐offs for target energy requirements from Marik 2016. Critically ill people who are elderly may have different nutritional requirements and metabolism (ASPEN 2002), leading to different responses to EN and PN methods as compared with younger participants. We did not supply a cut‐off age for this subgroup but aimed to separate participants described as 'frail elderly' by study authors from remaining participants. Heterogeneity may be introduced by the types of procedures that participants have undergone or by their reason for admission; people who have had abdominal or bowel surgery and people admitted with gastrointestinal complications may have greater difficulty with ingestion and digestion. In summary, we aimed to perform subgroup analysis as follows.
-
Early initiation of feeding (less than 48 hours) versus late initiation of feeding (48 hours or greater).
-
Normocaloric intake (to match 80% to 100% of energy expenditure) versus hypocaloric intake (less than 70% of energy expenditure).
-
'Frail elderly' versus other participants.
-
Gastrointestinal medical or surgical participants versus non‐gastrointestinal medical or surgical participants.
We performed subgroup analysis only when study authors reported outcome data for identified subgroups. In the absence of numerical data, we planned to present qualitative analysis of these factors as a possible source of heterogeneity.
We aimed to perform subgroup analyses on the following outcomes: mortality, number of ICU‐free days up to day 28, and number of ventilator‐free days up to day 28.
Sensitivity analysis
We explored the potential effects of decisions made as part of the review process as follows.
-
We excluded all studies that we judged at high or unclear risk of selection bias.
-
We assessed decisions made regarding missing data, excluding studies that provided incomplete data.
-
We conducted meta‐analysis using the alternate meta‐analytical effects model (fixed‐effect or random‐effects).
We compared effect estimates from the above results with effect estimates from the main analysis. We aimed to report differences that altered interpretation of effects.
We aimed to perform sensitivity analyses on the following outcomes: mortality, number of ICU‐free days up to day 28, and number of ventilator‐free days up to day 28.
'Summary of findings' table and GRADE
Two review authors (SL and OSR) independently used the GRADE system to assess the certainty of the body of evidence associated with the following outcomes (Guyatt 2008):
-
mortality (at time points: in‐hospital, 30 days, 90 days, 180 days);
-
number of ICU‐free days up to day 28;
-
number of ventilator‐free days up to day 28;
-
adverse events as reported by study authors (aspiration, sepsis, pneumonia, and vomiting).
The GRADE approach appraises the certainty of a body of evidence based on the extent to which one can be confident that an estimate of effect or association reflects the item being assessed. Evaluation of the certainty of a body of evidence considers within‐study risk of bias, directness of the evidence, heterogeneity of the data, precision of effect estimates, and risk of publication bias.
We constructed two 'Summary of findings' tables using the GRADE profiler software for the following comparisons in this review (www.guidelinedevelopment.org/):
-
EN versus PN for adults in the ICU;
-
EN versus EN and PN for adults in the ICU.
We reached consensus without consulting a third review author.
Results
Description of studies
Results of the search
We screened 4173 titles and abstracts, of which we identified 1369 through forward and backward citation searches. We screened titles from clinical trials registers and grey literature searches. We assessed 147 full texts for eligibility. See Figure 1.
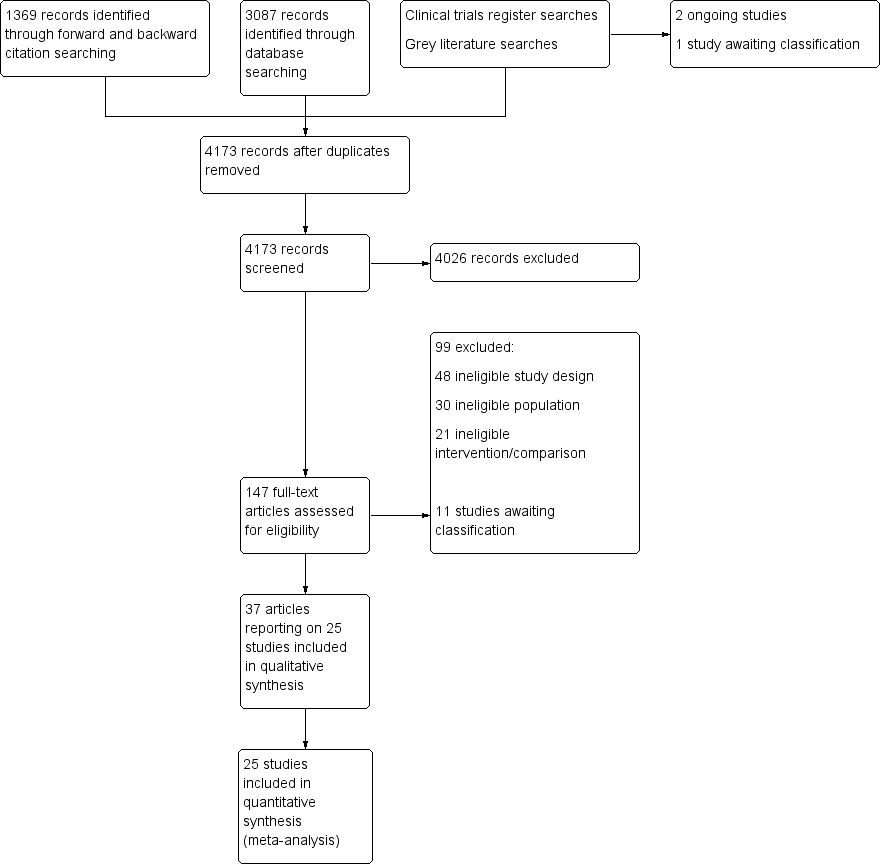
Flow diagram of search strategy.
Included studies
See Characteristics of included studies table.
We included 25 studies (37 publications), with 8816 participants (Abdulmeguid 2007; Abrishami 2010; Adams 1986; Altintas 2011; Bauer 2000; Bertolini 2003; Borzotta 1994; Casaer 2011; Cerra 1988; Chiarelli 1996; Dunham 1994; Engel 1997; Fan 2016; Gencer 2010; Hadfield 1995; Harvey 2014; Heidegger 2013; Justo Meirelles 2011; Kudsk 1992; Peterson 1988; Radrizzani 2006; Rapp 1983; Xi 2014; Young 1987). Two studies were quasi‐randomized (Altintas 2011; Fan 2016), and the remaining studies were RCTs. We found no cluster‐randomized studies. Reports for Bertolini 2003 and Radrizzani 2006 were for the same study, but participants were divided according to criteria for sepsis (severe sepsis in Bertolini 2003; and non‐severe sepsis in Radrizzani 2006), and we included them as separate studies for the purpose of this review. We included one study for which we could only source the abstract (Abdulmeguid 2007); we sourced the full text of all remaining studies.
Study population
Participants had a wide variety of primary diagnoses but all were critically ill. Sixteen studies reported that participants were mechanically ventilated (Abdulmeguid 2007; Adams 1986; Altintas 2011; Bertolini 2003; Borzotta 1994; Cerra 1988; Chiarelli 1996; Dunham 1994; Harvey 2014; Heidegger 2013; Justo Meirelles 2011; Kudsk 1992; Radrizzani 2006; Rapp 1983; Wischmeyer 2017; Xi 2014); nine studies did not describe mechanical ventilation status as part of the inclusion or exclusion criteria (Abrishami 2010; Bauer 2000; Casaer 2011; Engel 1997; Fan 2016; Gencer 2010; Hadfield 1995; Peterson 1988; Young 1987).
Study setting
All studies were conducted in the ICU (Abdulmeguid 2007; Abrishami 2010; Adams 1986; Altintas 2011; Bauer 2000; Bertolini 2003; Casaer 2011; Cerra 1988; Chiarelli 1996; Dunham 1994; Fan 2016; Gencer 2010; Hadfield 1995; Harvey 2014; Heidegger 2013; Justo Meirelles 2011; Kudsk 1992; Peterson 1988; Radrizzani 2006; Rapp 1983; Wischmeyer 2017; Xi 2014), or assumed to be in the ICU (Borzotta 1994; Engel 1997; Young 1987). Eight studies were undertaken in the USA (Adams 1986; Borzotta 1994; Cerra 1988; Dunham 1994; Kudsk 1992; Peterson 1988; Rapp 1983; Young 1987); three were in Italy (Bertolini 2003; Chiarelli 1996; Radrizzani 2006); two were in the UK (Hadfield 1995; Harvey 2014); two were in Turkey (Altintas 2011; Gencer 2010); two were in China (Fan 2016; Xi 2014); and one each in Iran (Abrishami 2010); France (Bauer 2000); Belgium (Casaer 2011); Germany (Engel 1997); Switzerland (Heidegger 2013); and Brazil (Justo Meirelles 2011). One international study was undertaken in Belgium, Canada, France, and the USA (Wischmeyer 2017). One study did not report the country in which it was conducted (Abdulmeguid 2007).
Intervention and comparisons
Seventeen studies compared an EN feeding protocol to a PN feeding protocol (Abdulmeguid 2007; Adams 1986; Altintas 2011; Bertolini 2003; Borzotta 1994; Cerra 1988; Engel 1997; Gencer 2010; Hadfield 1995; Harvey 2014; Justo Meirelles 2011; Kudsk 1992; Peterson 1988; Radrizzani 2006; Rapp 1983; Xi 2014; Young 1987); Engel 1997 was a multi‐arm study with two EN groups (one standard EN formula and one formula supplemented with arginine, omega‐3 fatty acid, nucleotide, and selenium). Six studies compared an EN feeding protocol to a protocol in which EN was supplemented with PN (Abrishami 2010; Bauer 2000; Casaer 2011; Chiarelli 1996; Heidegger 2013; Wischmeyer 2017). Two studies compared EN versus PN and versus combined EN and PN (Dunham 1994; Fan 2016).
Study authors reported initiation of both EN and PN within 48 hours of ICU admission in 13 studies (Adams 1986; Altintas 2011; Bauer 2000; Bertolini 2003; Dunham 1994; Engel 1997; Fan 2016; Harvey 2014; Justo Meirelles 2011; Kudsk 1992; Peterson 1988; Radrizzani 2006; Wischmeyer 2017). One study reported that all participants were given PN within 24 to 36 hours and that EN was initiated in one group at four days (Chiarelli 1996). One study reported that initiation of EN in one group was after at least 14 days of fasting, and study authors did not state at which time point PN was initiated (Xi 2014). Two studies initiated supplemental PN after all participants had been given EN for three days (Casaer 2011; Heidegger 2013). The remaining five study authors did not report time of initiation of feeding (Abdulmeguid 2007; Abrishami 2010; Gencer 2010; Hadfield 1995; Young 1987).
Outcomes
All studies, except Engel 1997, reported participant deaths; some studies did not clearly report time points and some studies reported deaths as participant losses with mortality as a reason for withdrawal from the study. No studies reported data for number of ICU‐free days up to day 28, and one study reported data for number of ventilator‐free days up to day 28 (Harvey 2014). Study authors reported adverse events which were: mechanical (Borzotta 1994; Casaer 2011; Harvey 2014); metabolic (Borzotta 1994; Fan 2016; Harvey 2014); gastrointestinal (Adams 1986; Altintas 2011; Bauer 2000; Borzotta 1994; Casaer 2011; Cerra 1988; Chiarelli 1996; Fan 2016; Harvey 2014); and infective (Abdulmeguid 2007; Adams 1986; Altintas 2011; Borzotta 1994; Casaer 2011; Engel 1997; Fan 2016; Gencer 2010; Justo Meirelles 2011; Heidegger 2013; Kudsk 1992; Rapp 1983; Wischmeyer 2017; Xi 2014; Young 1987).
Funding sources
Study authors reported funding sources in 11 studies (Abrishami 2010; Adams 1986; Bertolini 2003; Borzotta 1994; Casaer 2011; Hadfield 1995; Harvey 2014; Heidegger 2013; Radrizzani 2006; Rapp 1983; Wischmeyer 2017). Three studies noted no involvement in trial management from funders (Casaer 2011; Heidegger 2013; Radrizzani 2006); remaining studies reported no details of funders' involvement.
Excluded studies
We excluded 99 articles after reading the full text. We reported details of 32 of these studies in Characteristics of excluded studies. Of these 32 studies, we excluded studies in which the setting was not reported and we could not assume it was the ICU (Arefian 2007; Baigrie 1996; Braga 1996; Braga 1998; Braga 2001; Chen 2004; DiCarlo 1999; Dong 2010; Hermann 2004; Kim 2012; Klek 2008; Klek 2011; Malhotra 2004; McArdle 1981; Moore 1989; Reynolds 1997; Ryu 2009; Sand 1997; Suchner 1996; Van Barneveld 2016; Xiao‐Bo 2014; Yu 2009; Zhang 2016; Zhu 2012), or too few participants were in the ICU (Woodcock 2001). We excluded two studies of participants with acute pancreatitis (Abou‐Assi 2002; Pupelis 2001). One study compared EN versus PN in people in the ICU (Zhang 2005), but reported that participants in the EN group were also given PN as required for the first three to four days and it was therefore ineligible for our review, and one study was described as an RCT but not all participants randomized to the control group received EN (Doig 2013). We excluded one study that compared early‐goal directed nutrition (EGDN) versus EN in people in the ICU; the EGDN group were given EN supplemented with PN; however, the supplemented PN was only given if required to meet feeding goals and study authors did not report which participants had and did not have PN (Allingstrup 2017). One study compared EN versus PN but feeding took place for only one day in the ICU and feeding was continued for an additional six days on the ward (Fujita 2012). We excluded one abstract that had not been published as a full report (Zanello 1992); the abstract included no outcomes of interest and was published in 1992.
Studies awaiting classification
We were unable to assess eligibility in 11 studies (Braga 1995; Cao 2014; Chen 2011; NCT00522730; NCT01802099; Ridley 2015; Soliani 2001; Theodorakopoulou 2016; Xiang 2006; Xiu 2015; Yi 2015). We identified one study in clinical trials registers that was completed without published results (NCT00522730). From database searches we identified one protocol for a terminated study (NCT01802099), and one study that had been completed but not published (Ridley 2015). We were unable to source full texts for three trials and could not assess eligibility from abstracts (Braga 1995; Chen 2011; Soliani 2001). Four trials were published only as abstracts with insufficient information to assess eligibility (Cao 2014; Theodorakopoulou 2016; Xiu 2015; Yi 2015), and one study report requires translation before we assess eligibility (Xiang 2006). See Characteristics of studies awaiting classification table.
Ongoing studies
We identified two ongoing studies from clinical trials registers (NCT00512122; NCT02022813). See Characteristics of ongoing studies table.
Risk of bias in included studies
We have included a summary of risk of bias assessments in Figure 2 and Figure 3. Blank spaces in the risk bias summary figures indicate that study authors did not report the review outcome.
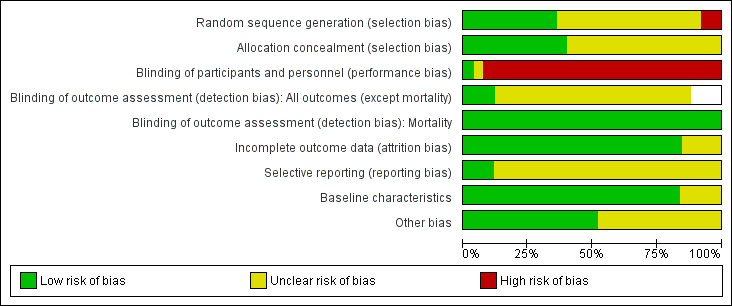
Risk of bias graph: review authors' judgements about each risk of bias item presented as percentages across all included studies. Blank spaces in tables indicated that study authors did not report the review outcome.
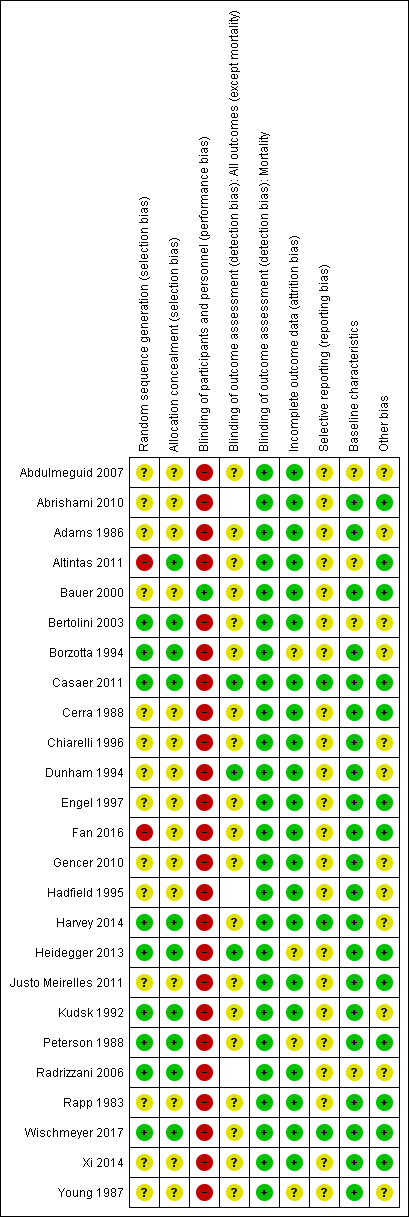
Risk of bias summary: review authors' judgements about each risk of bias item for each included study. Blank spaces in tables indicate that study authors did not report the review outcome.
Allocation
All studies were described as randomized and nine studies provided sufficient information on the method of randomization (Bertolini 2003; Borzotta 1994; Casaer 2011; Harvey 2014; Heidegger 2013; Kudsk 1992; Peterson 1988; Radrizzani 2006; Wischmeyer 2017). Two studies randomized participants according to hospital record number (Altintas 2011; Fan 2016), and we judged these to have high risk of bias. The remaining 14 studies reported insufficient information on method of randomization and we recorded these as having unclear risk of bias (Abdulmeguid 2007; Abrishami 2010; Adams 1986; Bauer 2000; Cerra 1988; Chiarelli 1996; Dunham 1994; Engel 1997; Gencer 2010; Hadfield 1995; Justo Meirelles 2011; Rapp 1983; Xi 2014; Young 1987).
Ten studies described adequate allocation concealment methods, and we judged these to have low risk of selection bias (Altintas 2011; Bertolini 2003; Borzotta 1994; Casaer 2011; Harvey 2014; Heidegger 2013; Kudsk 1992; Peterson 1988; Radrizzani 2006; Wischmeyer 2017) The remaining 15 studies reported no description of methods to conceal allocation and we recorded these as having unclear risk of bias (Abdulmeguid 2007; Abrishami 2010; Adams 1986; Bauer 2000; Cerra 1988; Chiarelli 1996; Dunham 1994; Engel 1997; Fan 2016; Gencer 2010; Hadfield 1995; Justo Meirelles 2011; Rapp 1983; Xi 2014; Young 1987).
Blinding
One study reported that participants in the enteral group were given a placebo parenteral solution and we judged this study to have low risk of performance bias (Bauer 2000). One study reported that personnel were not blinded to the intervention group (Heidegger 2013). The remaining studies did not report whether attempts had been made to blind personnel; adequate blinding would involve intrusive procedures (e.g. central line placement or nasogastric tube placement) and if these procedures were not described we assumed that blinding had not occurred (Abdulmeguid 2007; Abrishami 2010; Adams 1986; Altintas 2011; Bertolini 2003; Borzotta 1994; Casaer 2011; Cerra 1988; Chiarelli 1996; Dunham 1994; Engel 1997; Fan 2016; Gencer 2010; Hadfield 1995; Harvey 2014; Justo Meirelles 2011; Kudsk 1992; Peterson 1988; Radrizzani 2006; Rapp 1983; Wischmeyer 2017; Xi 2014; Young 1987). We judged these studies, and Heidegger 2013, to have high risk of performance bias.
We did not believe that lack of blinding of outcome assessors would influence data for the mortality outcome and we judged all studies to have low risk of detection bias for mortality, regardless of whether study authors reported blinding of outcome assessors. Three studies adequately reported blinding of outcome assessors for the remaining review outcomes and we judged these to have low risk of detection bias (Casaer 2011; Dunham 1994; Heidegger 2013). Nineteen studies reported insufficient details of outcome assessor blinding and we judged these to have unclear risk of detection bias (Abdulmeguid 2007; Adams 1986; Altintas 2011; Bauer 2000; Bertolini 2003; Borzotta 1994; Cerra 1988; Chiarelli 1996; Engel 1997; Fan 2016; Gencer 2010; Harvey 2014; Justo Meirelles 2011; Kudsk 1992; Peterson 1988; Rapp 1983; Wischmeyer 2017; Xi 2014; Young 1987). Three studies included data only for mortality and our assessment of detection bias was limited to this outcome (Abrishami 2010; Hadfield 1995; Radrizzani 2006). We noted whether studies had included criteria for diagnoses of outcomes and we were not concerned that lack of information or type of measurement tools had introduced risk of clinician bias.
Incomplete outcome data
We judged 21 studies to have low risk of attrition bias, as there appeared to be no reported losses (Abdulmeguid 2007; Adams 1986; Altintas 2011; Bertolini 2003; Chiarelli 1996; Engel 1997; Fan 2016; Gencer 2010; Hadfield 1995; Justo Meirelles 2011; Rapp 1983; Wischmeyer 2017; Xi 2014), or losses were few and adequately explained by study authors (Abrishami 2010; Bauer 2000; Casaer 2011; Cerra 1988; Dunham 1994; Harvey 2014; Kudsk 1992; Radrizzani 2006). Four studies had a large number of losses or losses were unevenly distributed between groups and we were unclear whether these losses could influence outcome data (Borzotta 1994; Heidegger 2013; Peterson 1988; Young 1987).
Selective reporting
We were able to source prospective clinical trials registration reports for four studies, of which we judged three studies to have low risk of reporting bias (Casaer 2011; Harvey 2014; Wischmeyer 2017). We noted changes to the clinical trials registration documents after completion of the study with regard to data collection time points and we could not be certain whether these changes may have introduced bias to the results; we judged this study to have an unclear risk of selective reporting bias (Heidegger 2013). We were unable to judge reporting bias for the remaining 21 studies because study authors did not report clinical trials registration reports or published protocols (Abdulmeguid 2007; Abrishami 2010; Adams 1986; Altintas 2011; Bauer 2000; Bertolini 2003; Borzotta 1994; Cerra 1988; Chiarelli 1996; Dunham 1994; Engel 1997; Fan 2016; Gencer 2010; Hadfield 1995; Justo Meirelles 2011; Kudsk 1992; Peterson 1988; Radrizzani 2006; Rapp 1983; Xi 2014; Young 1987).
Baseline characteristics
Three studies reported some baseline imbalances between groups and we did not know if these differences could influence outcome data (Altintas 2011; Bertolini 2003; Radrizzani 2006). One study was an abstract and did not provide sufficient detail on baseline characteristics (Abdulmeguid 2007). We judged 21 studies to have low risk of bias for baseline characteristics because data for characteristics were comparable between groups (Abrishami 2010; Adams 1986; Bauer 2000; Borzotta 1994; Casaer 2011; Cerra 1988; Chiarelli 1996; Dunham 1994; Engel 1997; Fan 2016; Gencer 2010; Hadfield 1995; Harvey 2014; Heidegger 2013; Justo Meirelles 2011; Kudsk 1992; Peterson 1988; Rapp 1983; Wischmeyer 2017; Xi 2014; Young 1987).
Other potential sources of bias
We considered whether differences between intervention and comparison groups could have introduced bias; in particular we considered nutritional protocols, patient management and use of concomitant medication, and glycaemic controls. We noted some differences in 12 studies (Abdulmeguid 2007; Adams 1986; Bertolini 2003; Borzotta 1994; Chiarelli 1996; Dunham 1994; Gencer 2010; Hadfield 1995; Harvey 2014; Kudsk 1992; Radrizzani 2006; Young 1987). We were not able to judge if these differences influenced study outcome data and we reported these as having unclear risk of bias. We identified no other sources of bias in the remaining studies.
Effects of interventions
See: Summary of findings for the main comparison Enteral versus parenteral nutrition for adults in the intensive care unit; Summary of findings 2 Enteral versus enteral and parenteral nutrition for adults in the intensive care unit
Enteral nutrition versus parenteral nutrition
Primary outcome
1. Mortality
We noted that some studies reported loss of randomized participants from analysis due to death (Borzotta 1994; Dunham 1994; Kudsk 1992; Peterson 1988; Young 1987). We included participants from three of these studies (Borzotta 1994; Dunham 1994; Kudsk 1992), as data for our primary analysis; we did not include mortality data from Young 1987 or Peterson 1988 because study authors did not report to which intervention group these participants belonged. Data were grouped according to time point.
In hospital
Deaths were reported in Abrishami 2010 during the seven‐day study period, at various time points up to day 18 in Borzotta 1994, and at four days in Kudsk 1992 and we assumed that these occurred in hospital. Three studies reported ICU mortality and did not report hospital mortality (Bertolini 2003; Cerra 1988; Heidegger 2013); in this instance, we included data for ICU mortality in this analysis.
One feeding route rather than the other may make little or no difference to in‐hospital mortality (RR 1.19, 95% CI 0.80 to 1.77; 361 participants; 6 studies; I² = 3%; low‐certainty evidence; Analysis 1.1). We used GRADE to downgrade by two levels; we were concerned by study limitations and indirectness. See summary of findings Table for the main comparison.
Within 30 days
Six studies did not specify time points and we reported outcome data for these studies with mortality at 30 days (Abdulmeguid 2007; Chiarelli 1996; Fan 2016; Gencer 2010; Hadfield 1995; Justo Meirelles 2011).
One feeding route rather than the other may make little or no difference to mortality within 30 days (RR 1.02, 95% CI 0.92 to 1.13; 3148 participants; I² = 32%; low‐certainty evidence; Analysis 1.2). We used GRADE to downgrade by two levels; we were concerned by study limitations and indirectness. See summary of findings Table for the main comparison.
Within 90 days
Three studies reported mortality within 90 days (Harvey 2014; Rapp 1983; Young 1987). It is uncertain whether one feeding route rather than another reduces mortality within 90 days because the certainty of the evidence is very low (RR 1.06, 95% CI 0.95 to 1.17; 2461 participants; I² = 55%; Analysis 1.3). We used GRADE to downgrade by three levels; we were concerned by study limitations, indirectness, and imprecision. See summary of findings Table for the main comparison.
Within 180 days
One study comparing EN versus PN reported mortality from one to four months; we assumed that there were no earlier deaths and we included it as mortality data within 180 days (Adams 1986). Study authors reported one death in the EN group (23 participants) and three deaths in the PN group (23 participants). We used the Review Manager 5 calculator to calculate an effect estimate (RR 0.33, 95% CI 0.04 to 2.97) (Review Manager 2014). It is uncertain whether either feeding route affects number of people who die within 180 days because the certainty of this evidence is very low; we were concerned by study limitations and imprecision. See summary of findings Table for the main comparison.
Secondary outcomes
1. Number of intensive care unit‐free days up to day 28
No studies reported data for number of ICU‐free days.
2. Number of ventilator‐free days up to day 28
One study (2388 participants included in the analysis) reported data for number of ventilator‐free days up to day 28 (Harvey 2014). Study authors reported little or no difference in number of days free of respiratory support (EN group: mean 14.2 (standard deviation (SD) ± 12.2) days versus PN group: mean 14.2 (SD ± 12.1) days; P = 0.94). It is uncertain whether either feeding route affected the number of ventilator‐free days up to day 28 because the certainty of the evidence is very low; we were concerned by study limitations and imprecision. See summary of findings Table for the main comparison.
3. Adverse events as reported by study authors
Study authors did not always describe outcomes as 'adverse events.' We collected outcomes as described by study authors, which we categorized as mechanical events, metabolic events, gastrointestinal events, and infective events. We combined data when more than one study reported an event, and when data were reported as 'number of participants' with an event rather than number of events. We reported single study data of adverse events in Table 1.
| Study ID | Description of event | EN group (n/N) | PN group (n/N) |
| Mechanical events | |||
| Clogged jejunostomy tube | 9/23 | N/A | |
| Disconnected line | N/A | 1/23 | |
| Line eroded into right upper lobe bronchus | N/A | 1/23 | |
| Malfunctioned line | N/A | 7/23 | |
| Transpyloric tube occlusion | 2/12 | 0/15 | |
| Failure to intubate | 0/12 | 0/15 | |
| Withdrawal of tube by participant | 1/12 | N/A | |
| Metabolic events | |||
| Hepatic failure | 1/23 | 1/23 | |
| Acute renal failure | 1/23 | 1/23 | |
| Pancreatitis | 2/23 | 1/23 | |
| Hypoproteinaemia | 22/40 | 32/40 | |
| Electrolyte disturbance | 5/1197 | 8/1191 | |
| Gastrointestinal events | |||
| Nausea, cramps, bloating | 19/23 | 16/23 | |
| Gastrointestinal bleeding | 0/23 | 0/23 | |
| Gastric reflux | 0/12 | 0/15 | |
| Ileus | 1/12 | 0/15 | |
| Small bowel ileus | 0/12 | 1/15 | |
| Stress ulcer | 7/40 | 19/40 | |
| Elevated liver enzymes | 7/1197 | 3/1191 | |
| Jaundice | 1/1197 | 1/1191 | |
| Ischaemic bowel | 0/1197 | 1/1191 | |
| Anastomotic leak | 2/22 | 6/23 | |
| Infective events | |||
| Persistent fever without obvious cause | 1/23 | 5/23 | |
| Catheter infection | 2/30 | 4/41 | |
| Meningitis | 2/28 | 0/21 | |
| Sinusitis | 3/28 | 6/21 | |
| Bronchitis | 6/28 | 6/28 | |
| Clostridium difficile | 2/28 | 4/21 | |
| Peritonitis | 0/28 | 1/21 | |
| Intracranial infection | 7/40 | 13/40 | |
| Pyaemia | 3/40 | 19/40 | |
| Pulmonary infection | 2/30 | 2/30 | |
| Empyema | 1/51 | 4/45 | |
| Aspiration pneumonia | 9/28 | 3/23 | |
| Infection (type of infection not described) | 5/28 | 4/23 | |
EN: enteral nutrition; n: number of participants with an event; N: total number randomized to group; N/A: not applicable; PN: parenteral nutrition.
Mechanical events
Two studies comparing EN versus PN reported data for aspiration (Borzotta 1994; Harvey 2014). It is uncertain whether one feeding route rather than another reduces aspiration because the certainty of this evidence is very low (RR 1.53, 95% CI 0.46 to 5.03; 2437 participants; I² = 0%; Analysis 1.4). We used GRADE to downgrade by three levels; we were concerned by study limitations, indirectness, and imprecision. See summary of findings Table for the main comparison.
Two studies comparing EN versus PN reported data for pneumothorax, with little or no difference in incidences of pneumothorax according to feeding group (RR 1.46, 95% CI 0.19 to 11.22; 2437 participants; I² = 0%; Analysis 1.5) (Borzotta 1994; Harvey 2014).
Single studies reported data for malfunctioned line, clogged jejunostomy tube, accidental disconnected line, and eroded line (Adams 1986), and one study reported data for transpyloric tube occlusion, failure to intubate, and withdrawal of tube by participant (Dunham 1994). See Table 1.
Metabolic events
Two studies comparing EN versus PN reported data for hyperglycaemia (Borzotta 1994; Harvey 2014). We found fewer people had hyperglycaemia who were given EN (RR 0.57, 95% CI 0.35 to 0.93; 2437 participants; I² = 0%; Analysis 1.6). We noted that very few people in either group had hyperglycaemia in one large study (Harvey 2014).
Single studies reported data for hepatic failure, acute renal failure, and pancreatitis (Adams 1986), electrolyte disturbance (Harvey 2014), and hypoproteinaemia (Fan 2016). See Table 1.
Gastrointestinal events
Three studies comparing EN versus PN reported data for vomiting (Altintas 2011; Cerra 1988; Harvey 2014). It is uncertain whether PN leads to a reduction in vomiting because the certainty of this evidence is very low (RR 3.42, 95% CI 1.15 to 10.16; 2525 participants; I² = 0%; Analysis 1.7). We used GRADE to downgrade by three levels; we were concerned by study limitations, indirectness, and imprecision. See summary of findings Table for the main comparison.
Six studies comparing EN versus PN reported data for diarrhoea (Adams 1986; Altintas 2011; Borzotta 1994; Cerra 1988; Fan 2016; Young 1987). We found that fewer people had diarrhoea when given PN (RR 2.17, 95% CI 1.72 to 2.75; 363 participants; I² = 57%; Analysis 1.8).
Three studies comparing EN versus PN reported data for abdominal distension, with little or no difference in incidence of abdominal distension according to feeding regimen (RR 1.53, 95% CI 0.34 to 6.96; 2505 participants; I² = 0%; Analysis 1.9) (Altintas 2011; Harvey 2014; Peterson 1988).
Single studies also reported data for nausea, bloating or cramps, and gastrointestinal bleeding (Adams 1986); gastric reflux, ileus, and small bowel ileus (Dunham 1994); stress ulcer (Fan 2016); jaundice, ischaemic bowel, and elevated liver enzymes (Harvey 2014); and anastomotic leak (Xi 2014). See Table 1.
Infective events
Seven studies comparing EN versus PN reported data for sepsis (Altintas 2011; Engel 1997; Justo Meirelles 2011; Kudsk 1992; Peterson 1988; Xi 2014; Young 1987). EN may reduce incidences of sepsis (RR 0.59, 95% CI 0.37 to 0.95; 361 participants; I² = 27%; low‐certainty evidence; Analysis 1.10). We used GRADE to downgrade by two levels; we were concerned by study limitations and indirectness. See summary of findings Table for the main comparison.
Seven studies comparing EN versus PN reported data for pneumonia, or aspiration pneumonia, or ventilator‐acquired pneumonia (Adams 1986; Altintas 2011; Borzotta 1994; Fan 2016; Justo Meirelles 2011; Kudsk 1992; Young 1987). One study reported data for pneumonia and aspiration pneumonia and we included only data for pneumonia in the analysis (Young 1987). One feeding regimen rather than another may make little or no difference to pneumonia (RR 1.10, 95% CI 0.82 to 1.48; 415 participants; I² = 55%; low‐certainty evidence; Analysis 1.11). We used GRADE and downgraded by two levels; we were concerned by study limitations and indirectness. See summary of findings Table for the main comparison.
Three studies comparing EN versus PN reported data for intra‐abdominal infection or intra‐abdominal abscess (Adams 1986; Gencer 2010; Kudsk 1992). We found fewer intra‐abdominal infections when EN was given (RR 0.26, 95% CI 0.07 to 0.89; 202 participants; I² = 0%; Analysis 1.12).
Three studies reported data for wound infection (Adams 1986; Borzotta 1994; Gencer 2010). We found little or no difference between groups in number of participants with a wound infection (RR 1.45, 95% CI 0.55 to 3.82; 155 participants; I² = 55%; Analysis 1.13).
Three studies reported data for urinary tract infection (Borzotta 1994; Gencer 2010; Young 1987). We found little or no difference between groups in number of participants with a urinary tract infection (RR 1.48, 95% CI 0.65 to 3.40; 160 participants; I² = 49%; Analysis 1.14).
Single studies also reported data for: persistent fever without obvious cause (Adams 1986); catheter infections (Altintas 2011); meningitis, sinusitis, bronchitis, Clostridium difficile, and peritonitis (Borzotta 1994); intracranial infection and pyaemia (Fan 2016); pulmonary infection (Gencer 2010); empyema (Kudsk 1992); and aspiration pneumonia and infection (type of infection not described) (Young 1987). See Table 1.
Bertolini 2003 reported that there were no severe adverse events related to the intervention or comparison and Radrizzani 2006 reported no severe adverse events related to the intervention. Hadfield 1995 did not report adverse events. Abdulmeguid 2007 collected data for nosocomial bloodstream infections and septic morbidity but these were not clearly reported in the abstract. Rapp 1983 reported data for some participants who had sepsis but this was not clearly reported.
Subgroup analysis
1. Early initiation of feeding (less than 48 hours) versus late initiation of feeding (48 hours or greater)
Eleven studies comparing EN versus PN initiated feeding within 48 hours (Adams 1986; Altintas 2011; Bertolini 2003; Dunham 1994; Engel 1997; Fan 2016; Harvey 2014; Justo Meirelles 2011; Kudsk 1992; Peterson 1988; Radrizzani 2006). No studies reported late initiation of EN and late initiation of PN, therefore we could not conduct subgroup analysis for this comparison.
2. Normocaloric intake (to match 80% to 100% of energy expenditure) versus hypocaloric intake (less than 70% of energy expenditure)
We considered possible subgroup analysis based on terms used by study authors to describe whether intake was formulated to be normocaloric or hypocaloric; we did not make judgements based on other information such as target rates (measured as kilocalories/kilogram). No studies described intake as normocaloric or hypocaloric, therefore, we did not conduct subgroup analysis.
3. 'Frail elderly' versus other participants
We identified no studies that specified inclusion of frail elderly participants, or subdivided participant characteristics by this description.
4. Gastrointestinal medical or surgical participants versus non‐gastrointestinal medical or surgical participants
Three studies comparing EN versus PN included participants with only abdominal injury or who had gastrointestinal surgery (Gencer 2010; Kudsk 1992; Peterson 1988). For the relevant outcomes, we compared these with studies in which participants did not have a primary diagnosis of gastrointestinal medical or surgical conditions. We could not be certain of primary diagnoses in Abdulmeguid 2007, and did not include this study in subgroup analysis.
Subgroup analysis showed little or no difference in rates of in‐hospital mortality (Chi² = 0.05, degrees of freedom (df) = 1 (P = 0.83), I² = 0%) based on whether participants were gastrointestinal surgical or medical participants (RR 0.88, 95% CI 0.06 to 13.74; 98 participants; 1 study), or participants who did not have a primary diagnosis of a gastrointestinal surgical or medical condition (RR 1.19, 95% CI 0.80 to 1.77; 361 participants; 6 studies; I² = 22%; Analysis 1.15).
Subgroup analysis showed no difference in rates of mortality at 30 days (Chi² = 0.25, df = 1 (P = 0.62), I² = 0%) based on whether participants were gastrointestinal surgical or medical participants (RR 0.67, 95% CI 0.12 to 3.71; 60 participants; 1 study), or participants who did not have a primary diagnosis of a gastrointestinal surgical or medical condition (RR 1.03, 95% CI 0.93 to 1.15; 3008 participants; 9 studies; I² = 41%; Analysis 1.16).
Sensitivity analysis
1. Selection bias
We assessed six studies as having low risk of selection bias for both sequence generation and allocation concealment (Bertolini 2003; Borzotta 1994; Harvey 2014; Kudsk 1992; Peterson 1988; Radrizzani 2006). In sensitivity analysis, we excluded studies that had high or unclear risk of both sequence generation and allocation concealment. For in‐hospital mortality, this altered the effect estimate with fewer deaths for participants given PN (RR 2.66, 95% CI 1.04 to 6.85; 196 participants; 3 studies; I² = 0%). There was no difference in effect estimates for mortality within 30 days, and within 90 days.
2. Attrition bias
We judged two studies to have unclear risk of attrition bias and performed sensitivity analysis by excluding them from appropriate analyses (Borzotta 1994; Young 1987). For the comparison EN versus PN, we noted no change in effect for in‐hospital mortality, mortality at 30 days, and mortality at 90 days.
3. Effects model
We reanalysed our mortality data using a random‐effects model; this did not change the effect.
Enteral nutrition versus enteral nutrition and parenteral nutrition
Primary outcome
1. Mortality
One study reported loss of randomized participants from analysis due to death (Dunham 1994), and we included these participants for our primary analysis.
In hospital
Five studies comparing EN versus EN and PN reported data for in‐hospital mortality (Abrishami 2010; Casaer 2011; Dunham 1994; Heidegger 2013; Wischmeyer 2017). One feeding regimen rather than the other may make little or no difference to in‐hospital mortality (RR 0.99, 95% CI 0.84 to 1.16; 5111 participants; I² = 0%; low‐certainty evidence; Analysis 2.1). We used GRADE to downgrade by two levels; we were concerned by study limitations and indirectness. See summary of findings Table 2.
Within 30 days
One study did not report the time point for mortality and we included this study in the analysis as mortality within 30 days (Fan 2016). We included three studies in the analysis comparing EN versus EN and PN (Chiarelli 1996; Fan 2016; Heidegger 2013). It is uncertain whether combined EN and PN reduced mortality at 30 days because the certainty of the evidence is very low (RR 1.64, 95% CI 1.06 to 2.54; 409 participants; I² = 0%; Analysis 2.2). We used GRADE to downgrade by three levels; we were concerned by study limitations, indirectness, and imprecision. See summary of findings Table 2.
Within 90 days
Two studies comparing EN versus EN and PN reported data for mortality within 90 days (Bauer 2000; Casaer 2011). One feeding regimen rather than the other may make little or no difference to mortality at 90 days (RR 1.00, 95% CI 0.86 to 1.18; 4760 participants; I² = 0%; low‐certainty evidence; Analysis 2.3). We used GRADE to downgrade the evidence by two levels; we were concerned by study limitations and indirectness. See summary of findings Table 2.
Within 180 days
One study (120 participants) comparing EN versus EN and PN reported mortality at two years; interpretation of a figure of cumulative survival over time reported by study authors showed that all deaths were within 180 days (Bauer 2000). Study authors reported 24 deaths in each group (60 participants per group). We used the Review Manager 5 calculator to obtain the effect estimate (RR 1.00, 95% CI 0.65 to 1.55) (Review Manager 2014). It is uncertain whether one feeding regimen rather than another reduces mortality within 180 days because the certainty of this evidence is very low. We used GRADE to downgrade by three levels; we were concerned by study limitations (one level) and imprecision (two levels). See summary of findings Table 2.
Secondary outcomes
1. Number of intensive care unit‐free days up to day 28
No studies reported data for number of ICU‐free days.
2. Number of ventilator‐free days up to day 28
No studies reported data for number of ventilator‐free days.
3. Adverse events as reported by study authors
Study authors did not always describe outcomes as 'adverse events.' We collected outcomes as described by study authors, which we categorized as mechanical events, metabolic events, gastrointestinal events, and infective events. We combined data when more than one study reported an event. We reported single study data of adverse events in Table 2. Abrishami 2010 did not report adverse event outcomes.
| Study ID | Description of event | EN group (n/N) | EN + PN group (n/N) |
| Mechanical events | |||
| CVC obstruction | 9/2328 | 15/2312 | |
| Nasal bleeding | 18/2328 | 14/2312 | |
| Pneumohaemothorax after CVC placement | 0/2328 | 2/2312 | |
| Subclavian artery puncture | 0/2328 | 2/2312 | |
| Withdrawal of tube | 1/12 | 0/10 | |
| Failure to intubate | 0/12 | 2/10 | |
| Metabolic events | |||
| Hypoproteinaemia | 22/40 | 7/40 | |
| Gastrointestinal events | |||
| Vomiting or aspiration | 284/2328 | 295/2312 | |
| Gastric reflux | 0/12 | 2/10 | |
| Stress ulcer | 7/40 | 9/40 | |
| infective events | |||
| Pyemia | 3/40 | 10/40 | |
| Intracranial infection | 7/40 | 5/40 | |
| Catheter bloodstream infection | 0/73 | 7/52 | |
| Intra‐abdominal infection | 0/73 | 4/52 | |
| Upper urinary tract infection | 0/73 | 1/52 | |
| Surgical deep infection | 0/73 | 1/52 | |
CVC: central venous catheter; EN: enteral nutrition; EN + PN: combined enteral and parenteral nutrition; n: number of participants with an event; N: total number randomized to group.
Mechanical events
Two studies comparing EN versus EN and PN reported data for feeding tube obstruction (Casaer 2011; Dunham 1994). There was little or no difference in events between groups (RR 0.96, 95% CI 0.70 to 1.32; 4662 participants; I² = 0%; Analysis 2.4).
One study reported data for failure to intubate, and withdrawal of tube by participant (Dunham 1994), and one study reported data for nasal bleeding, central venous catheter obstruction, pneumohaemothorax, and subclavian artery puncture (Casaer 2011). See Table 2.
Metabolic events
One study comparing EN versus EN and PN reported data for hypoproteinaemia (Fan 2016). See Table 2.
Gastrointestinal events
Four studies comparing EN versus EN and PN reported data for diarrhoea (Bauer 2000; Casaer 2011; Chiarelli 1996; Fan 2016). We noted substantial statistical heterogeneity between studies (I² = 88%) and did not pool data (Analysis 2.5).
Single studies reported data for vomiting or aspiration (Casaer 2011), gastric reflux (Dunham 1994), and stress ulcer (Fan 2016). See Table 2.
Infective events
Two studies reported pneumonia (aspirated pneumonia in Fan 2016; pneumonia in the ICU in Wischmeyer 2017). It is uncertain whether one feeding regimen rather than another reduced pneumonia because the certainty of this evidence is very low (RR 1.40, 95% CI 0.91 to 2.15; 205 participants; I² = 31%; Analysis 2.6). We used GRADE to downgrade the evidence by three levels; we were concerned by study limitations (one level) and imprecision (two levels). See summary of findings Table 2.
Two studies reported wound infections (Casaer 2011; Wischmeyer 2017); we used data for skin/soft tissue wounds in Wischmeyer 2017. We found little or no difference in events between groups (RR 0.67, 95% CI 0.50 to 0.92; 4765 participants; I² = 46%; Analysis 2.7).
Two studies reported bloodstream infections (Casaer 2011; Wischmeyer 2017); we used data for primary bloodstream infections in Wischmeyer 2017. We found little or no difference in events between groups (RR 0.81, 95% CI 0.66 to 1.01; 4765 participants; I² = 0%; Analysis 2.8).
Three studies reported urinary tract infections (Bauer 2000; Casaer 2011; Wischmeyer 2017); we used data for 'lower urinary tract infections' in Wischmeyer 2017. We found little or no difference in events between groups (RR 0.87, 95% CI 0.65 to 1.17; 4885 participants; I² = 52%; Analysis 2.9).
Three studies reported airway infections (Bauer 2000; Casaer 2011; Wischmeyer 2017); we used data for 'lower respiratory tract infection' in Wischmeyer 2017, and 'respiratory infection' in Bauer 2000. We noted substantial statistical heterogeneity between studies (I² = 78%) and did not pool data (Analysis 2.10).
Single studies reported data for pyaemia and intracranial infection (Fan 2016); and surgical deep infections, catheter bloodstream infections, upper urinary tract infections, and intra‐abdominal infections (Wischmeyer 2017). See Table 2. One study reported number of infections after day nine and reported this as number of events rather than by participant; we did not include these data because we could not be certain whether participants had more than one infection (Heidegger 2013).
Subgroup analysis
1. Early initiation of feeding (less than 48 hours) versus late initiation of feeding (48 hours or greater)
Four studies comparing EN versus EN and PN initiated feeding with 48 hours (Bauer 2000; Dunham 1994; Fan 2016; Wischmeyer 2017). One study comparing EN versus EN and PN initiated a late feeding protocol for the EN group after four days of all participants being given PN (Chiarelli 1996); PN was initiated early and weaning to EN was initiated late. Two studies comparing EN versus EN and PN initiated a late feeding protocol for the PN group after three days of all participants being given EN (Casaer 2011; Heidegger 2013); EN was initiated early and supplemental PN was initiated late. We did not conduct subgroup analysis for this comparison because there were few studies.
2. Normocaloric intake (to match 80% to 100% of energy expenditure) versus hypocaloric intake (less than 70% of energy expenditure)
We considered possible subgroup analysis based on terms used by study authors to describe whether intake was formulated to be normocaloric or hypocaloric; we did not make judgements based on other information such as target rates (measured as kilocalories/kilogram). No studies described intake as normocaloric or hypocaloric and we did not conduct a subgroup analysis.
3. 'Frail elderly' versus other participants
We identified no studies that specified inclusion of frail elderly participants, or subdivided participant characteristics by this description.
4. Gastrointestinal medical or surgical participants versus non‐gastrointestinal medical or surgical participants
Two studies comparing EN versus EN and PN included participants who were only non‐gastrointestinal surgical or medical participants (Abrishami 2010; Heidegger 2013). Two studies included participants with a mix of primary diagnoses which included gastrointestinal medical or surgical conditions (Casaer 2011; Wischmeyer 2017). One study did not report whether participants had gastrointestinal medical or surgical conditions (Fan 2016). We did not conduct a subgroup analysis because there were few studies.
Sensitivity analysis
1. Selection bias
We assessed five studies as having high or unclear risk of sequence generation (Abrishami 2010; Bauer 2000; Chiarelli 1996; Dunham 1994; Fan 2016). We excluded these studies from the analysis and found no difference in interpretation of effect estimates for in‐hospital mortality. It was not feasible to conduct sensitivity analysis for mortality at 30 days and mortality at 90 days because only one study remained.
2. Attrition bias
We judged one study to have unclear risk of attrition bias and performed sensitivity analyses by excluding it from appropriate analyses (Heidegger 2013). There was no difference in effect for mortality in hospital and at 30 days.
3. Effects model
We reanalysed our mortality data using a random‐effects model; this did not change the effect.
Discussion
Summary of main results
We included 25 studies comparing EN versus PN or versus EN and PN given to critically ill adults in the ICU. In addition, we identified nine studies awaiting classification (three completed or terminated studies without publication of full report, two studies published only as abstracts with insufficient information, three studies for which we were unable to access full reports, one study requires translation), and two ongoing studies.
We found low‐ and very low‐certainty evidence showing no difference between EN versus PN in mortality in hospital, within 30 days, within 90 days, and within 180 days. No studies reported number of ICU‐free days up to day 28. One study reported number of ventilator‐free days up to day 28 and it is uncertain whether one feeding route rather than another altered the number of ventilator‐free days because certainty of the evidence is very low. We found low‐ and very low‐certainty evidence showing no difference between EN versus combined EN and PN in mortality in hospital, within 90 days, and within 180 days. It is uncertain whether combined EN and PN reduces mortality at 30 days because certainty of the evidence is very low.
Studies reported adverse events, these were: mechanical (aspiration, pneumothorax, nasal bleeding, subclavian artery puncture, tube or line obstruction, line malfunctions, failure to intubate); metabolic (hyperglycaemia, hypoproteinaemia, and electrolyte disturbance); gastrointestinal (diarrhoea, vomiting, abdominal distension, nausea, bloating or cramps, jaundice, stress ulcer, elevated liver enzymes, and gastric reflux); and infective (sepsis, pneumonia, catheter infections, pulmonary infection, intracranial infection, primary bloodstream infections, wound infections, intra‐abdominal infection, urinary tract infections, surgical infections, airway infection, pyaemia, empyema, and line sepsis).
We found low‐ and very low‐certainty evidence showing no difference between EN versus PN in participants with aspiration or pneumonia. We found that EN may reduce sepsis (low‐certainty evidence) and it is uncertain whether PN reduces vomiting because certainty of the evidence is very low. In addition, we found no evidence of a difference between EN versus PN in: incidences of pneumothorax, abdominal distension, wound infections, and urinary tract infections. We found fewer people who were given EN had hyperglycaemia and had intra‐abdominal infections, and fewer people who were given PN had diarrhoea. We did not use GRADE to assess the certainty of the evidence for these additional adverse events, and noted that evidence was from few studies.
It is uncertain whether combined EN and PN compared to PN reduces pneumonia because the certainty of the evidence is very low. In addition, we found little or no difference between EN versus combined EN and PN in participants with wound infections, bloodstream infections, urinary tract infections, or feeding tube occlusion.
Overall completeness and applicability of evidence
We identified 25 studies including 8816 participants who were admitted to the ICU with a wide range of diagnoses. Whilst we noted limited statistical heterogeneity in most of the review outcome analyses, it is possible that the range of primary diagnoses may have introduced heterogeneity and reduced the applicability of these findings, and we used GRADE assessment to reduce our certainty in the estimates of effect. Despite the number of included studies, we were unable to conduct subgroup analyses on some of our proposed subgroups, and this limited exploration of differences between included studies. We also noted that studies ranged in date of publication from 1983 to 2017, and, whilst we did not assess the potential influence of date on our results, it is possible that changes in management of people in the ICU may mean that some study data may not be generalizable to the current ICU context.
Quality of the evidence
Enteral nutrition versus parenteral nutrition
We noted that all personnel were aware of the type of feeding regimen for each group of participants and for all outcomes; we believed that this introduced a high risk of performance bias. Using the GRADE approach, we downgraded the certainty of the evidence for mortality at each time point, for the number of ventilator‐free days up to day 28, and each adverse event (aspiration, sepsis, pneumonia, and vomiting) by one level for study limitations.
Studies included participants with varied primary diagnoses (e.g. gastrointestinal or non‐gastrointestinal medical or surgical patients, and whether participants were being mechanically ventilated). We believed that this reduced the directness of the evidence for some outcomes; it was possible that participants with some diagnoses may have responded differently to each feeding. Using the GRADE approach, we downgraded the certainty of evidence for in‐hospital mortality, mortality within 30 days and 90 days, and adverse events by one level for indirectness.
We noted that most studies included a small number of participants, and two studies included large sample sizes (Casaer 2011; Harvey 2014); these studies introduced a larger weighting to the effect estimates across some analyses, and was particularly noticeable in the analyses of aspiration and vomiting in which only two studies reported data for several adverse event outcomes. We considered the effect of these large studies on our results and, using the GRADE approach, we downgraded the certainty of the evidence of aspiration and vomiting by one level for imprecision. For mortality at 180 days, we found only one small study and we believed that this result alone gave an imprecise effect and we downgraded the certainty of the evidence for this outcome by one level for imprecision.
Enteral nutrition versus enteral nutrition and parenteral nutrition
We noted that all personnel were aware of the type of feeding regimen for each group of participants and for all outcomes, we believed that this introduced a high risk of performance bias. Using the GRADE approach, we downgraded the certainty of the evidence for mortality (at each time point) and for pneumonia by one level for study limitations.
Studies included participants with varied primary diagnoses (e.g. gastrointestinal or non‐gastrointestinal medical or surgical patients, and whether participants were being mechanically ventilated). We believed that this reduced the directness of the evidence for some outcomes; it is possible that participants with some diagnoses may have responded differently to each feeding. Using the GRADE approach, we downgraded the certainty of evidence for in‐hospital mortality, and mortality within 30 days and 90 days, by one level for indirectness.
For mortality at 180 days, we found only one small study, and for pneumonia we found two small studies. We believed that these results alone gave an imprecise effect and downgraded the certainty of evidence for these outcomes by one level for imprecision.
Potential biases in the review process
We conducted a thorough search and used two review authors to assess study eligibility, extract data, and assess risk of bias in included studies, and, therefore, we reduced potential bias in the review process. However, we reached some decisions on eligibility based on information presented only in study reports and we did not contact study authors for clarification; we excluded some studies that did not state clearly that participants were in the ICU. We followed a protocol decision to include outcome data reported as number of ICU‐free days, and number of ventilator‐free days, up to day 28 (Lewis 2016). Many of the included studies had reported length of stay in ICU, or duration of mechanical ventilation, and we did not include this outcome data in the review.
Agreements and disagreements with other studies or reviews
We noted that reviews by other review authors used different criteria for deciding whether participants were critically ill and, therefore, these reviews did not include all the same studies (Elke 2016; Simpson 2005). Simpson 2005 reported reduced mortality with PN, however this contradicted the more recent review by Elke 2016 whose findings were consistent with our review findings of no effect on mortality for EN versus PN.
We found no evidence of a difference in number of participants with adverse events. Reviews by Elke 2016 and Simpson 2005 reported reduced infectious complications when PN was given. Whilst these reviews included some different studies to our review, review authors presented composite data for number of infections as reported by study authors. We reported data for infections by the number of participants who had particular types of infection, rather than a composite figure, and therefore our review differed in the type of data reported for infections.
Flow diagram of search strategy.
Risk of bias graph: review authors' judgements about each risk of bias item presented as percentages across all included studies. Blank spaces in tables indicated that study authors did not report the review outcome.
Risk of bias summary: review authors' judgements about each risk of bias item for each included study. Blank spaces in tables indicate that study authors did not report the review outcome.
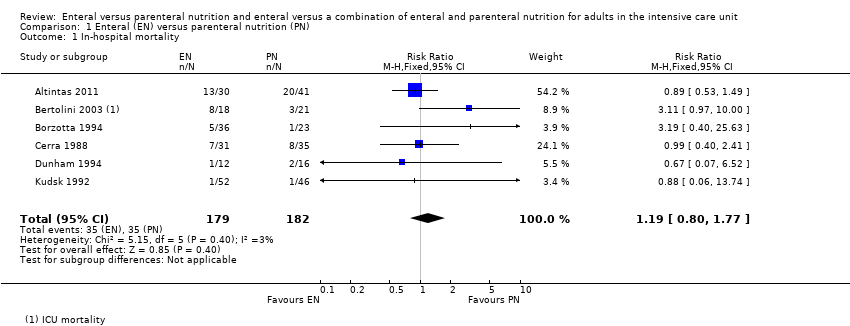
Comparison 1 Enteral (EN) versus parenteral nutrition (PN), Outcome 1 In‐hospital mortality.

Comparison 1 Enteral (EN) versus parenteral nutrition (PN), Outcome 2 Mortality at 30 days.

Comparison 1 Enteral (EN) versus parenteral nutrition (PN), Outcome 3 Mortality at 90 days.

Comparison 1 Enteral (EN) versus parenteral nutrition (PN), Outcome 4 Aspiration.

Comparison 1 Enteral (EN) versus parenteral nutrition (PN), Outcome 5 Pneumothorax.

Comparison 1 Enteral (EN) versus parenteral nutrition (PN), Outcome 6 Hyperglycaemia.
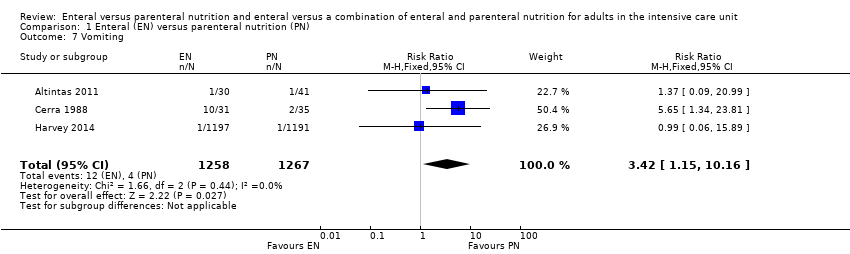
Comparison 1 Enteral (EN) versus parenteral nutrition (PN), Outcome 7 Vomiting.
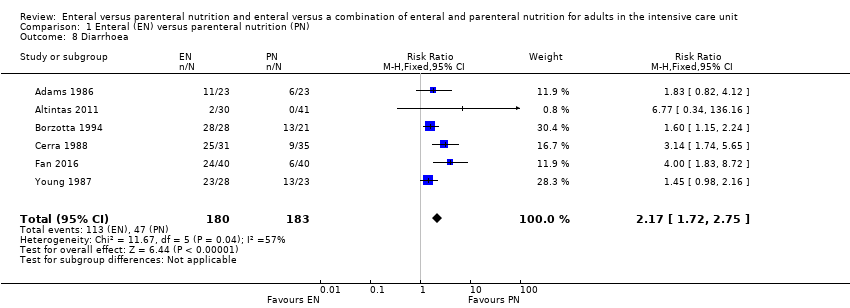
Comparison 1 Enteral (EN) versus parenteral nutrition (PN), Outcome 8 Diarrhoea.

Comparison 1 Enteral (EN) versus parenteral nutrition (PN), Outcome 9 Abdominal distension.

Comparison 1 Enteral (EN) versus parenteral nutrition (PN), Outcome 10 Sepsis.

Comparison 1 Enteral (EN) versus parenteral nutrition (PN), Outcome 11 Pneumonia.

Comparison 1 Enteral (EN) versus parenteral nutrition (PN), Outcome 12 Intra‐abdominal infection.

Comparison 1 Enteral (EN) versus parenteral nutrition (PN), Outcome 13 Wound infection.

Comparison 1 Enteral (EN) versus parenteral nutrition (PN), Outcome 14 Urinary tract infection.
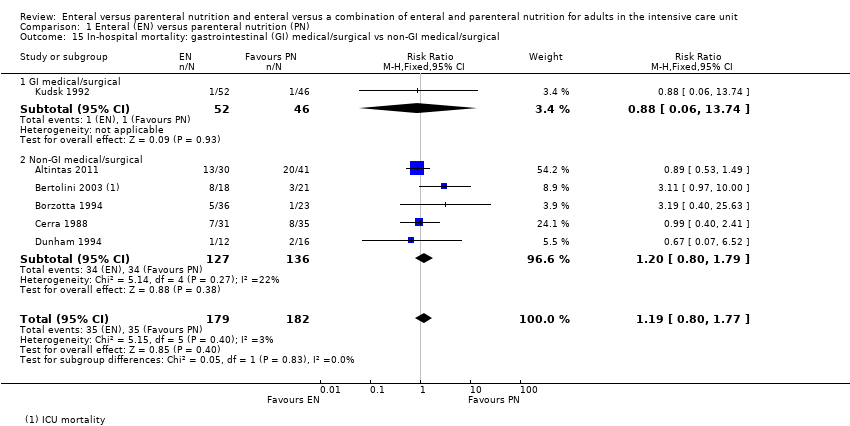
Comparison 1 Enteral (EN) versus parenteral nutrition (PN), Outcome 15 In‐hospital mortality: gastrointestinal (GI) medical/surgical vs non‐GI medical/surgical.

Comparison 1 Enteral (EN) versus parenteral nutrition (PN), Outcome 16 Mortality at 30 days: GI medical/surgical vs non‐GI medical/surgical.
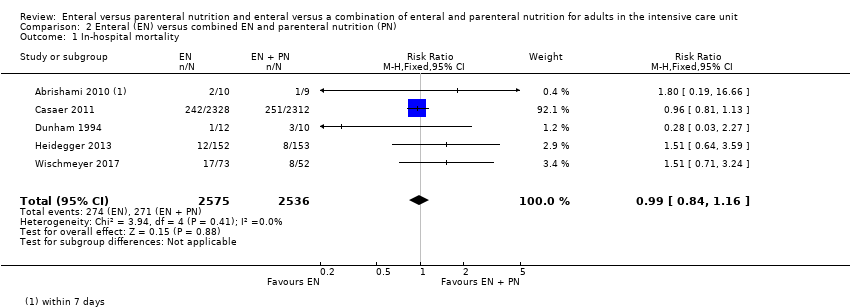
Comparison 2 Enteral (EN) versus combined EN and parenteral nutrition (PN), Outcome 1 In‐hospital mortality.

Comparison 2 Enteral (EN) versus combined EN and parenteral nutrition (PN), Outcome 2 Mortality at 30 days.

Comparison 2 Enteral (EN) versus combined EN and parenteral nutrition (PN), Outcome 3 Mortality at 90 days.
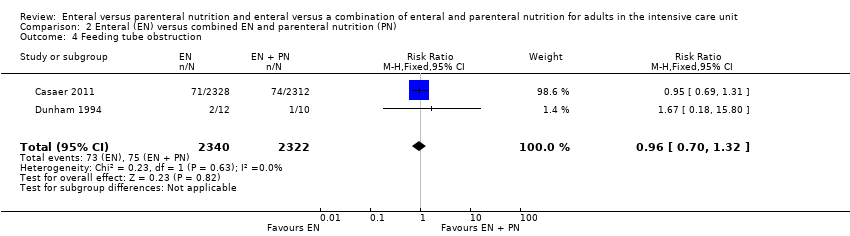
Comparison 2 Enteral (EN) versus combined EN and parenteral nutrition (PN), Outcome 4 Feeding tube obstruction.
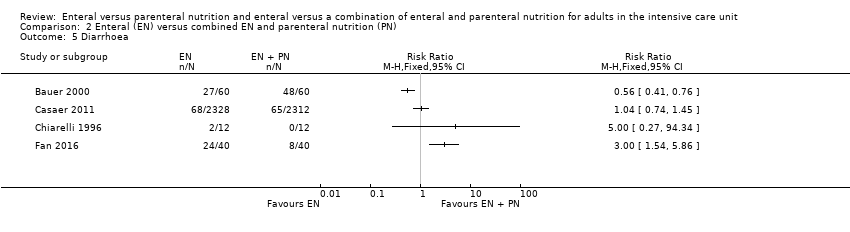
Comparison 2 Enteral (EN) versus combined EN and parenteral nutrition (PN), Outcome 5 Diarrhoea.

Comparison 2 Enteral (EN) versus combined EN and parenteral nutrition (PN), Outcome 6 Pneumonia.
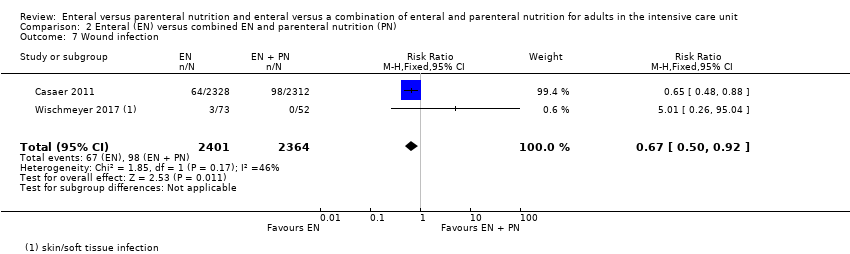
Comparison 2 Enteral (EN) versus combined EN and parenteral nutrition (PN), Outcome 7 Wound infection.

Comparison 2 Enteral (EN) versus combined EN and parenteral nutrition (PN), Outcome 8 Bloodstream infection.

Comparison 2 Enteral (EN) versus combined EN and parenteral nutrition (PN), Outcome 9 Urinary tract infection.
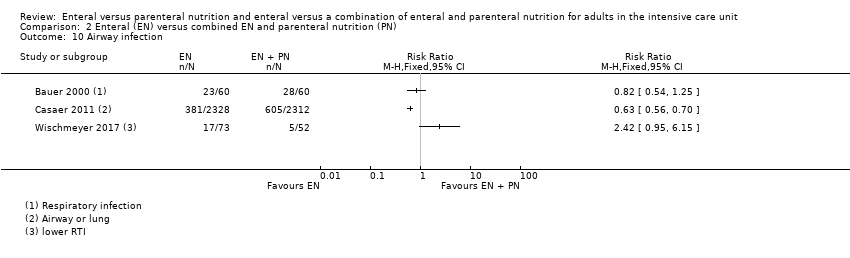
Comparison 2 Enteral (EN) versus combined EN and parenteral nutrition (PN), Outcome 10 Airway infection.
| Enteral versus parenteral nutrition for adults in the intensive care unit | |||||
| Patient or population: critically ill adults admitted to the ICU for trauma, emergency, or surgical care; population excluded people with acute pancreatitis | |||||
| Outcomes | Anticipated absolute effects* (95% CI) | Relative effect | Number of participants | Certainty of the evidence | |
| Risk with EN | Risk with PN | ||||
| Mortality | In‐hospital mortality | RR 1.19 | 361 | ⊕⊕⊝⊝ | |
| Study population | |||||
| 229 per 1000 | 192 per 1000 | ||||
| Mortality within 30 days | RR 1.02 (0.92 to 1.13) | 3148 | ⊕⊕⊝⊝ | ||
| Study population | |||||
| 304 per 1000 | 298 per 1000 | ||||
| Mortality within 90 days | RR 1.06 | 2461 | ⊕⊝⊝⊝ | ||
| Study population | |||||
| 393 per 1000 | 371 per 1000 | ||||
| Mortality within 180 days | RR 0.33 (0.04 to 2.97) | 46 | ⊕⊝⊝⊝ | ||
| Study population | |||||
| 130 per 1000 | 43 per 1000 (5 in 387) | ||||
| Number of ICU‐free days up to day 28 | – | – | – | – | Not measured |
| Number of ventilator‐free days up to day 28 | Mean number of ventilator‐free days: 14.2 (SD ± 12.2) | Mean difference 0 days (0.97 fewer to 0.97 more) | N/A | 2388 | ⊕⊝⊝⊝ |
| Adverse events: aspiration (as reported by study authors at end of study follow‐up period) | Study population | RR 1.53 | 2437 | ⊕⊝⊝⊝ | |
| 5 per 1000 | 3 per 1000 | ||||
| Adverse events: sepsis (as reported by study authors at end of study follow‐up period) | Study population | RR 0.59 (0.37 to 0.95) | 361 | ⊕⊕⊝⊝ | |
| 123 per 1000 | 209 per 1000 | ||||
| Adverse events: pneumonia (as reported by study authors at end of study follow‐up period) | Study population | RR 1.10 (0.82 to 1.48) | 415 | ⊕⊕⊝⊝ | |
| 314 per 1000 | 268 per 1000 | ||||
| Adverse events: vomiting (as reported by study authors at end of study follow‐up period) | Study population | RR 3.42 | 2525 | ⊕⊝⊝⊝ | |
| 11 per 1000 | 3 per 1000 | ||||
| *The risk in the intervention group (and its 95% confidence interval) is based on the assumed risk in the comparison group and the relative effect of the intervention (and its 95% CI). CI: confidence interval; EN: enteral nutrition; ICU: intensive care unit; N/A: not applicable; PN: parenteral nutrition; RR: risk ratio; SD: standard deviation. | |||||
| GRADE Working Group grades of evidence | |||||
| aAll studies had a high risk of performance bias; downgraded one level for study limitations. Studies included a variety of primary diagnoses and evidence was less direct; downgraded one level for indirectness. bAll studies had a high risk of performance bias; downgraded one level for study limitations. Studies included a variety of primary diagnoses and study designs and evidence were less direct; downgraded one level for indirectness. cAll studies had a high risk of performance bias; downgraded one level for study limitations. Studies included a variety of primary diagnoses and study designs and evidence were less direct; downgraded one level for indirectness. Few studies and one included study had a large number of participants relative to other included studies; downgraded one level for imprecision. dData from only one study that had a high risk of performance bias; downgraded one level for study limitations and two levels for imprecision. eAll studies had a high risk of performance bias; downgraded one level for study limitations. Studies included a variety of primary diagnoses and evidence was less direct; downgraded one level for indirectness. Few studies and one included study had a large number of participants relative to other included studies; downgraded one level for imprecision. fAll studies had a high risk of performance bias; downgraded one level for study limitations. Studies included a variety of primary diagnoses and evidence was less direct; downgraded one level for indirectness. gAll studies had a high risk of performance bias; downgraded one level for study limitations. Studies included a variety of primary diagnoses and study designs and evidence were less direct; downgraded one level for indirectness. Few studies, with very few events, and one included study had a large number of participants relative to other included studies; downgraded one level for imprecision. | |||||
| Enteral versus enteral and parenteral nutrition for adults in the intensive care unit | |||||
| Patient or population: critically ill adults admitted to the ICU for trauma, emergency, or post‐surgical care; population excludes participants with acute pancreatitis | |||||
| Outcomes | Anticipated absolute effects* (95% CI) | Relative effect | Number of participants | Certainty of the evidence | |
| Risk with EN | Risk with EN + PN | ||||
| Mortality | In‐hospital mortality | RR 0.99 (0.84 to 1.16) | 5111 | ⊕⊕⊝⊝ | |
| Study population | |||||
| 106 per 1000 | 107 per 1000 | ||||
| Mortality within 30 days | RR 1.64 (1.06 to 2.54) | 409 | ⊕⊝⊝⊝ | ||
| Study population | |||||
| 216 per 1000 | 132 per 1000 | ||||
| Mortality within 90 days | RR 1.00 (0.86 to 1.18) | 4760 (2 studies) | ⊕⊕⊝⊝ | ||
| Study population | |||||
| 115 per 1000 (99 to 135) | 115 per 1000 | ||||
| Mortality within 180 days | RR 1.00 | 120 (1 RCT) | ⊕⊝⊝⊝ | ||
| Study population | |||||
| 400 per 1000 (260 to 620) | 400 per 1000 | ||||
| Number of ICU‐free days up to day 28 | – | – | – | – | Not measured |
| Number of ventilator‐free days up to day 28 | – | – | – | – | Not measured |
| Adverse events: aspiration (as reported by study authors at end of study follow‐up period) | – | – | – | – | Not measured |
| Adverse events: sepsis (as reported by study authors at end of study follow‐up period) | – | – | – | – | Not measured |
| Adverse events: pneumonia (as reported by study authors at end of study follow‐up period) | 350 per 1000 (228 to 538) | 250 per 1000 | RR 1.40 (0.91 to 2.15) | 205 (2 studies) | ⊕⊝⊝⊝ Very lowd |
| Adverse events: vomiting (as reported by study authors at end of study follow‐up period) | – | – | – | – | Not measured |
| *The risk in the intervention group (and its 95% confidence interval) is based on the assumed risk in the comparison group and the relative effect of the intervention (and its 95% CI). CI: confidence interval; EN: enteral nutrition; ICU: intensive care unit; PN: parenteral nutrition; RCT: randomized controlled trial; RR: risk ratio. | |||||
| GRADE Working Group grades of evidence | |||||
| aAll studies had high risk of performance bias; downgraded one level for study limitations. Studies included a variety of primary diagnoses and evidence was less direct; downgraded one level for indirectness. bAll studies had high risk of performance bias; downgraded one level for study limitations. Studies included a variety of primary diagnoses and evidence was less direct; downgraded one level for indirectness. Few studies with increased risk of imprecision; downgraded one level. cBoth studies had high risk of performance bias; downgraded one level for study limitations. Studies included a variety of primary diagnoses and evidence was less direct; downgraded one level for indirectness. dData from only one study that had a high risk of performance bias; downgraded one level for study limitations and two levels for imprecision. | |||||
| Study ID | Description of event | EN group (n/N) | PN group (n/N) |
| Mechanical events | |||
| Clogged jejunostomy tube | 9/23 | N/A | |
| Disconnected line | N/A | 1/23 | |
| Line eroded into right upper lobe bronchus | N/A | 1/23 | |
| Malfunctioned line | N/A | 7/23 | |
| Transpyloric tube occlusion | 2/12 | 0/15 | |
| Failure to intubate | 0/12 | 0/15 | |
| Withdrawal of tube by participant | 1/12 | N/A | |
| Metabolic events | |||
| Hepatic failure | 1/23 | 1/23 | |
| Acute renal failure | 1/23 | 1/23 | |
| Pancreatitis | 2/23 | 1/23 | |
| Hypoproteinaemia | 22/40 | 32/40 | |
| Electrolyte disturbance | 5/1197 | 8/1191 | |
| Gastrointestinal events | |||
| Nausea, cramps, bloating | 19/23 | 16/23 | |
| Gastrointestinal bleeding | 0/23 | 0/23 | |
| Gastric reflux | 0/12 | 0/15 | |
| Ileus | 1/12 | 0/15 | |
| Small bowel ileus | 0/12 | 1/15 | |
| Stress ulcer | 7/40 | 19/40 | |
| Elevated liver enzymes | 7/1197 | 3/1191 | |
| Jaundice | 1/1197 | 1/1191 | |
| Ischaemic bowel | 0/1197 | 1/1191 | |
| Anastomotic leak | 2/22 | 6/23 | |
| Infective events | |||
| Persistent fever without obvious cause | 1/23 | 5/23 | |
| Catheter infection | 2/30 | 4/41 | |
| Meningitis | 2/28 | 0/21 | |
| Sinusitis | 3/28 | 6/21 | |
| Bronchitis | 6/28 | 6/28 | |
| Clostridium difficile | 2/28 | 4/21 | |
| Peritonitis | 0/28 | 1/21 | |
| Intracranial infection | 7/40 | 13/40 | |
| Pyaemia | 3/40 | 19/40 | |
| Pulmonary infection | 2/30 | 2/30 | |
| Empyema | 1/51 | 4/45 | |
| Aspiration pneumonia | 9/28 | 3/23 | |
| Infection (type of infection not described) | 5/28 | 4/23 | |
| EN: enteral nutrition; n: number of participants with an event; N: total number randomized to group; N/A: not applicable; PN: parenteral nutrition. | |||
| Study ID | Description of event | EN group (n/N) | EN + PN group (n/N) |
| Mechanical events | |||
| CVC obstruction | 9/2328 | 15/2312 | |
| Nasal bleeding | 18/2328 | 14/2312 | |
| Pneumohaemothorax after CVC placement | 0/2328 | 2/2312 | |
| Subclavian artery puncture | 0/2328 | 2/2312 | |
| Withdrawal of tube | 1/12 | 0/10 | |
| Failure to intubate | 0/12 | 2/10 | |
| Metabolic events | |||
| Hypoproteinaemia | 22/40 | 7/40 | |
| Gastrointestinal events | |||
| Vomiting or aspiration | 284/2328 | 295/2312 | |
| Gastric reflux | 0/12 | 2/10 | |
| Stress ulcer | 7/40 | 9/40 | |
| infective events | |||
| Pyemia | 3/40 | 10/40 | |
| Intracranial infection | 7/40 | 5/40 | |
| Catheter bloodstream infection | 0/73 | 7/52 | |
| Intra‐abdominal infection | 0/73 | 4/52 | |
| Upper urinary tract infection | 0/73 | 1/52 | |
| Surgical deep infection | 0/73 | 1/52 | |
| CVC: central venous catheter; EN: enteral nutrition; EN + PN: combined enteral and parenteral nutrition; n: number of participants with an event; N: total number randomized to group. | |||
| Outcome or subgroup title | No. of studies | No. of participants | Statistical method | Effect size |
| 1 In‐hospital mortality Show forest plot | 6 | 361 | Risk Ratio (M‐H, Fixed, 95% CI) | 1.19 [0.80, 1.77] |
| 2 Mortality at 30 days Show forest plot | 11 | 3148 | Risk Ratio (M‐H, Fixed, 95% CI) | 1.02 [0.92, 1.13] |
| 3 Mortality at 90 days Show forest plot | 3 | 2461 | Risk Ratio (M‐H, Fixed, 95% CI) | 1.06 [0.95, 1.17] |
| 4 Aspiration Show forest plot | 2 | 2437 | Risk Ratio (M‐H, Fixed, 95% CI) | 1.53 [0.46, 5.03] |
| 5 Pneumothorax Show forest plot | 2 | 2437 | Risk Ratio (M‐H, Fixed, 95% CI) | 1.46 [0.19, 11.22] |
| 6 Hyperglycaemia Show forest plot | 2 | 2437 | Risk Ratio (M‐H, Fixed, 95% CI) | 0.57 [0.35, 0.93] |
| 7 Vomiting Show forest plot | 3 | 2525 | Risk Ratio (M‐H, Fixed, 95% CI) | 3.42 [1.15, 10.16] |
| 8 Diarrhoea Show forest plot | 6 | 363 | Risk Ratio (M‐H, Fixed, 95% CI) | 2.17 [1.72, 2.75] |
| 9 Abdominal distension Show forest plot | 3 | 2505 | Risk Ratio (M‐H, Fixed, 95% CI) | 1.53 [0.34, 6.96] |
| 10 Sepsis Show forest plot | 7 | 361 | Risk Ratio (M‐H, Fixed, 95% CI) | 0.59 [0.37, 0.95] |
| 11 Pneumonia Show forest plot | 7 | 415 | Risk Ratio (M‐H, Fixed, 95% CI) | 1.10 [0.82, 1.48] |
| 12 Intra‐abdominal infection Show forest plot | 3 | 202 | Risk Ratio (M‐H, Fixed, 95% CI) | 0.26 [0.07, 0.89] |
| 13 Wound infection Show forest plot | 3 | 155 | Risk Ratio (M‐H, Fixed, 95% CI) | 1.45 [0.55, 3.82] |
| 14 Urinary tract infection Show forest plot | 3 | 160 | Risk Ratio (M‐H, Fixed, 95% CI) | 1.48 [0.65, 3.40] |
| 15 In‐hospital mortality: gastrointestinal (GI) medical/surgical vs non‐GI medical/surgical Show forest plot | 6 | 361 | Risk Ratio (M‐H, Fixed, 95% CI) | 1.19 [0.80, 1.77] |
| 15.1 GI medical/surgical | 1 | 98 | Risk Ratio (M‐H, Fixed, 95% CI) | 0.88 [0.06, 13.74] |
| 15.2 Non‐GI medical/surgical | 5 | 263 | Risk Ratio (M‐H, Fixed, 95% CI) | 1.20 [0.80, 1.79] |
| 16 Mortality at 30 days: GI medical/surgical vs non‐GI medical/surgical Show forest plot | 10 | 3068 | Risk Ratio (M‐H, Fixed, 95% CI) | 1.03 [0.93, 1.14] |
| 16.1 GI medical/surgical | 1 | 60 | Risk Ratio (M‐H, Fixed, 95% CI) | 0.67 [0.12, 3.71] |
| 16.2 Non‐GI medical/surgical | 9 | 3008 | Risk Ratio (M‐H, Fixed, 95% CI) | 1.03 [0.93, 1.15] |
| Outcome or subgroup title | No. of studies | No. of participants | Statistical method | Effect size |
| 1 In‐hospital mortality Show forest plot | 5 | 5111 | Risk Ratio (M‐H, Fixed, 95% CI) | 0.99 [0.84, 1.16] |
| 2 Mortality at 30 days Show forest plot | 3 | 409 | Risk Ratio (M‐H, Fixed, 95% CI) | 1.64 [1.06, 2.54] |
| 3 Mortality at 90 days Show forest plot | 2 | 4760 | Risk Ratio (M‐H, Fixed, 95% CI) | 1.00 [0.86, 1.18] |
| 4 Feeding tube obstruction Show forest plot | 2 | 4662 | Risk Ratio (M‐H, Fixed, 95% CI) | 0.96 [0.70, 1.32] |
| 5 Diarrhoea Show forest plot | 4 | Risk Ratio (M‐H, Fixed, 95% CI) | Totals not selected | |
| 6 Pneumonia Show forest plot | 2 | 205 | Risk Ratio (M‐H, Fixed, 95% CI) | 1.40 [0.91, 2.15] |
| 7 Wound infection Show forest plot | 2 | 4765 | Risk Ratio (M‐H, Fixed, 95% CI) | 0.67 [0.50, 0.92] |
| 8 Bloodstream infection Show forest plot | 2 | 4765 | Risk Ratio (M‐H, Fixed, 95% CI) | 0.81 [0.66, 1.01] |
| 9 Urinary tract infection Show forest plot | 3 | 4885 | Risk Ratio (M‐H, Fixed, 95% CI) | 0.87 [0.65, 1.17] |
| 10 Airway infection Show forest plot | 3 | Risk Ratio (M‐H, Fixed, 95% CI) | Totals not selected | |