Nutrición enteral versus nutrición parenteral y enteral versus una combinación de nutrición enteral y parenteral para adultos en la unidad de cuidados intensivos
Information
- DOI:
- https://doi.org/10.1002/14651858.CD012276.pub2Copy DOI

- Database:
-
- Cochrane Database of Systematic Reviews
- Version published:
-
- 08 June 2018see what's new
- Type:
-
- Intervention
- Stage:
-
- Review
- Cochrane Editorial Group:
-
Cochrane Emergency and Critical Care Group
- Copyright:
-
- Copyright © 2019 The Cochrane Collaboration. Published by John Wiley & Sons, Ltd.
Article metrics
Altmetric:
Cited by:
Authors
Contributions of authors
Conceiving the review: ARB, SL.
Co‐ordinating the review: SL.
Undertaking manual searches: SL, OSR.
Screening search results: SL, OSR.
Organizing retrieval of papers: OSR.
Screening retrieved papers against inclusion criteria: SL, OSR.
Appraising quality of papers: SL, OSR.
Abstracting data from papers: SL, OSR.
Managing data for the review: SL.
Entering data into Review Manager 5 (Review Manager 2014): SL, OSR.
Analysing Review Manager 5 statistical data: SL, OSR.
Interpreting data: all review authors.
Writing the review: SL, OSR.
Securing funding for the review: PA, AS.
Serving as guarantor for the review (one author): AS.
Taking responsibility for reading and checking the review before submission: SL.
Sources of support
Internal sources
-
No sources of support supplied
External sources
-
NIHR Cochrane Collaboration Programme Grant, UK.
'Back to normal': speed and quality of recovery after surgery, major injury and critical care. Project ref. 13/89/16
Declarations of interest
SL's institution receives the National Institute for Health Research (NIHR) Cochrane Collaboration Programme Grant for programme of reviews in perioperative care, which supported her work on this review (see Sources of support).
OSR's institution receives the NIHR Cochrane Collaboration Programme Grant for programme of reviews in perioperative care, which supported his work on this review (see Sources of support).
PA's institution receives the NIHR Cochrane Collaboration Programme Grant for programme of reviews in perioperative care, which supported his work on this review (see Sources of support). Dr Alderson is employed by NICE, which has published a clinical guideline relevant to this topic (NICE 2006).
AS's institution receives the NIHR Cochrane Collaboration Programme Grant for programme of reviews in perioperative care, which supported his work on this review (see Sources of support).
Acknowledgements
We would like to thank Anna Lee (Content Editor), Jing Xie (Statistical Editor), Michael Casaer, Ronald L Koretz, Paul Marik (Peer Reviewers), Brian Stafford (Consumer Referee) for their help and editorial advice during the preparation of this systematic review.
We would like to thank Anna Lee (Content Editor); Asieh Golozar (Statistical Editor); and Carol Braunschweig, Michael P Casaer, Paul Marik, and Todd Rice (Peer Reviewers) for help and editorial advice provided during preparation of the protocol (Lewis 2016), for the systematic review.
We would like to thank Andrew Butler who contributed to the protocol for this review. We would like to thank Dr Rachel Markham (Consultant Anaesthetist, Intensive Care) for advice during preparation of the 'Summary of findings' tables.
The following editors screened the protocol (Lewis 2016): Marialena Trivella, Anna Lee, Arash Afshari, Bronagh Blackwood, Asieh Golozar, Nathan Pace, Jane Cracknell, and Nuala Livingstone (CEU Editor).
Version history
| Published | Title | Stage | Authors | Version |
| 2018 Jun 08 | Enteral versus parenteral nutrition and enteral versus a combination of enteral and parenteral nutrition for adults in the intensive care unit | Review | Sharon R Lewis, Oliver J Schofield‐Robinson, Phil Alderson, Andrew F Smith | |
| 2016 Jul 06 | Enteral versus parenteral nutrition for adults in the intensive care unit | Protocol | Sharon R Lewis, Andrew R Butler, Phil Alderson, Andrew F Smith | |
Differences between protocol and review
We made the following changes to the published protocol (Lewis 2016).
-
We changed the title to: Enteral versus parenteral nutrition and enteral versus a combination of enteral and parenteral nutrition for adults in the intensive care unit.
-
We added a new author, Oliver Schofield‐Robinson, who independently carried out screening of search results and data collection. Andrew Butler did not contribute to completion of the review and was removed from the review author list.
-
We edited the criteria for considering studies in the review: we intended to include only participants who were in the ICU. We edited the criteria to only include studies of mixed population if more than 75% of participants were in the ICU; at protocol stage we had not anticipated that studies may have a mixed participant population.
-
Objectives: we noted a difference between the objectives and the outcomes in our published protocol. The list of review outcomes did not include a measure of length of hospital stay. We edited the objectives to state that we compared the effect of nutrition on the number of ICU‐free stays up to day 28.
-
Unit of analysis: in the protocol, we stated "If multi‐arm studies compare more than one relevant intervention (e.g. EN vs PN and EN vs EN and PN), we will include both comparison groups but will split the data for the intervention group ‐ EN in this example ‐ by using a ‘halving’ method to avoid double‐counting, as recommended by Higgins 2011." In the review, we analysed outcome data as two separate comparisons (i.e. EN versus PN and EN versus EN and PN) and therefore we did not split data in multi‐arm studies.
-
Summary of findings: we outlined in the published protocol (Lewis 2016), that we would include the following outcomes in the 'Summary of findings' table: mortality (in hospital, at 30 days, at 90 days, at 180 days); number of ICU‐free days; number of ventilator‐free days; and adverse events (as reported by study authors). We limited number the number of adverse events in the 'Summary of findings' table to four outcomes for each comparison group (aspiration, sepsis, pneumonia, and vomiting); we had not specified these in the protocol. Selection of appropriate adverse events was taken following discussion with a Consultant Anaesthetist in Intensive Care.
Keywords
MeSH
Medical Subject Headings (MeSH) Keywords
- *Critical Illness;
- *Intensive Care Units;
- Cause of Death;
- Combined Modality Therapy [methods];
- Enteral Nutrition [*methods];
- Hospital Mortality;
- Malnutrition [*prevention & control];
- Parenteral Nutrition [*methods];
- Pneumonia [epidemiology];
- Randomized Controlled Trials as Topic;
- Time Factors;
- Vomiting [epidemiology];
Medical Subject Headings Check Words
Adult; Humans;
PICOs
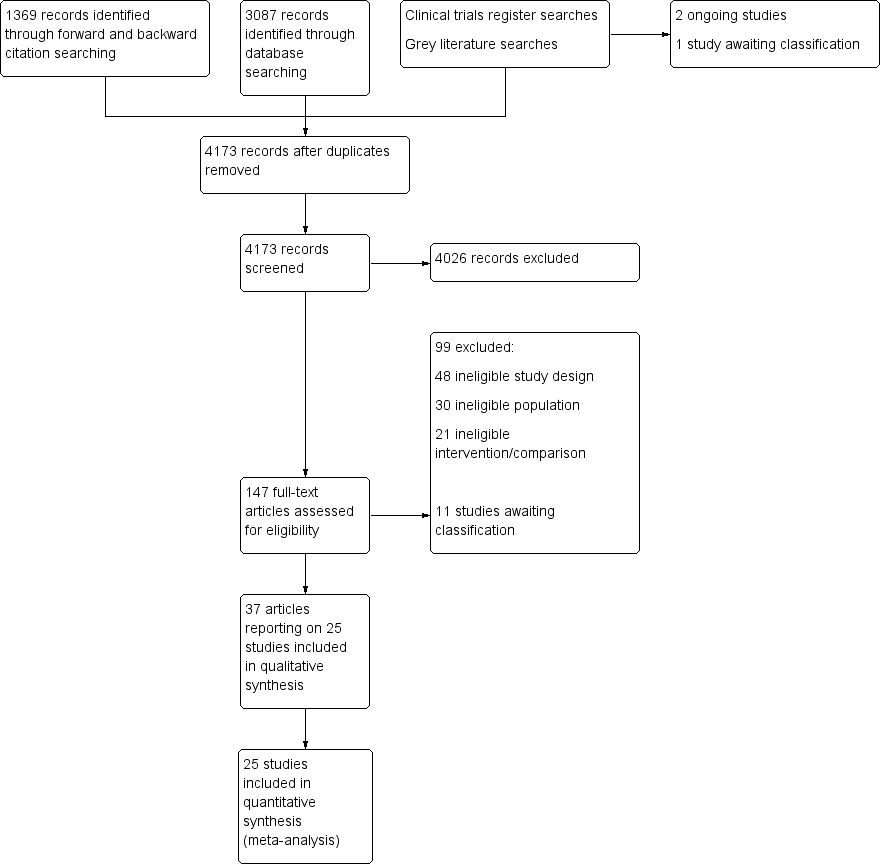
Flow diagram of search strategy.
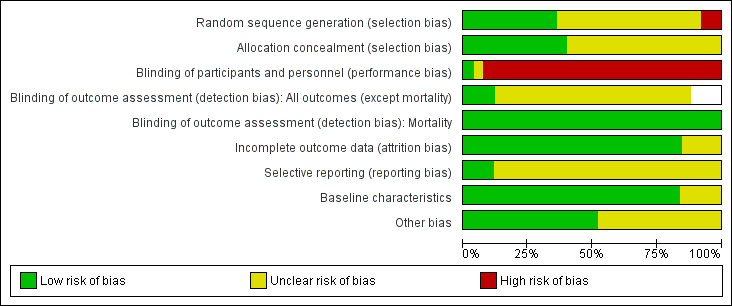
Risk of bias graph: review authors' judgements about each risk of bias item presented as percentages across all included studies. Blank spaces in tables indicated that study authors did not report the review outcome.
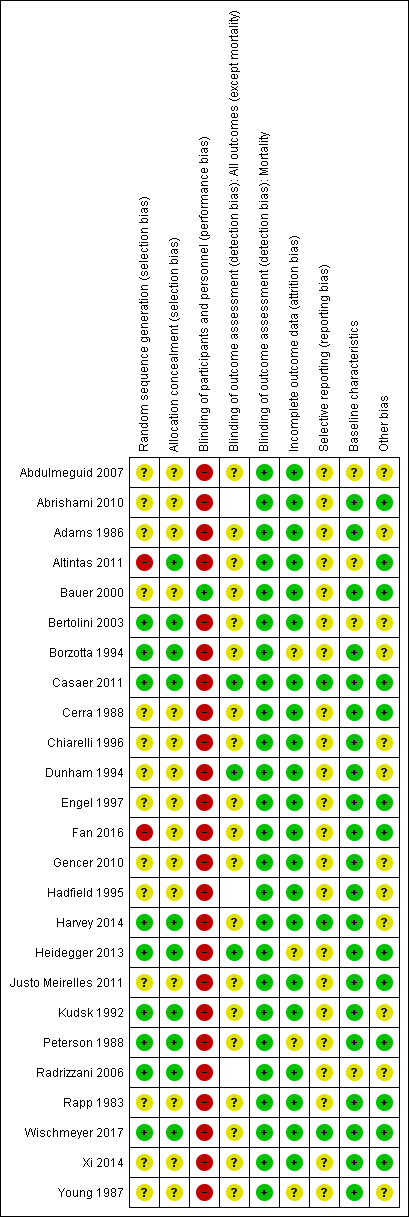
Risk of bias summary: review authors' judgements about each risk of bias item for each included study. Blank spaces in tables indicate that study authors did not report the review outcome.
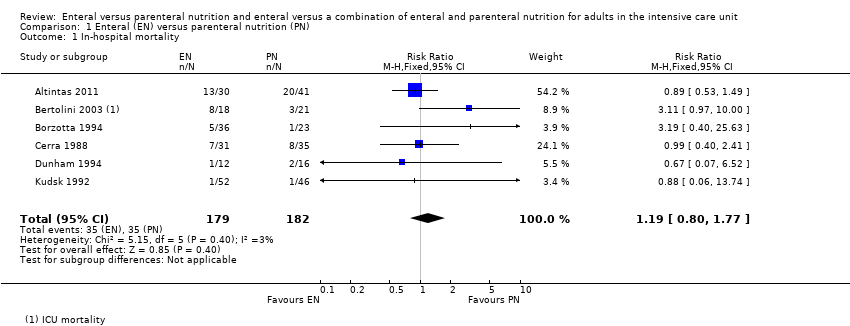
Comparison 1 Enteral (EN) versus parenteral nutrition (PN), Outcome 1 In‐hospital mortality.

Comparison 1 Enteral (EN) versus parenteral nutrition (PN), Outcome 2 Mortality at 30 days.

Comparison 1 Enteral (EN) versus parenteral nutrition (PN), Outcome 3 Mortality at 90 days.

Comparison 1 Enteral (EN) versus parenteral nutrition (PN), Outcome 4 Aspiration.

Comparison 1 Enteral (EN) versus parenteral nutrition (PN), Outcome 5 Pneumothorax.

Comparison 1 Enteral (EN) versus parenteral nutrition (PN), Outcome 6 Hyperglycaemia.
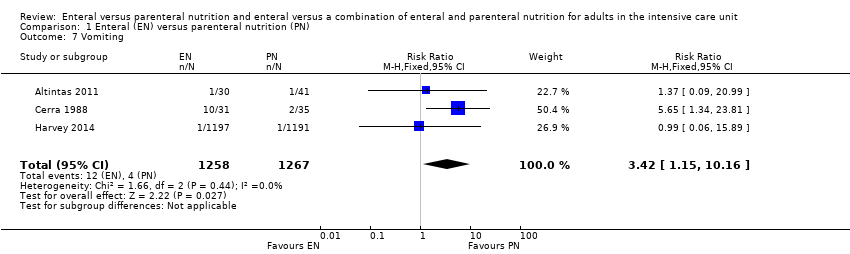
Comparison 1 Enteral (EN) versus parenteral nutrition (PN), Outcome 7 Vomiting.
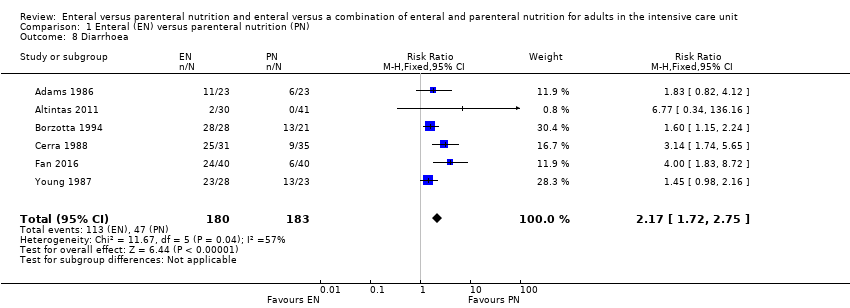
Comparison 1 Enteral (EN) versus parenteral nutrition (PN), Outcome 8 Diarrhoea.

Comparison 1 Enteral (EN) versus parenteral nutrition (PN), Outcome 9 Abdominal distension.

Comparison 1 Enteral (EN) versus parenteral nutrition (PN), Outcome 10 Sepsis.

Comparison 1 Enteral (EN) versus parenteral nutrition (PN), Outcome 11 Pneumonia.

Comparison 1 Enteral (EN) versus parenteral nutrition (PN), Outcome 12 Intra‐abdominal infection.

Comparison 1 Enteral (EN) versus parenteral nutrition (PN), Outcome 13 Wound infection.

Comparison 1 Enteral (EN) versus parenteral nutrition (PN), Outcome 14 Urinary tract infection.
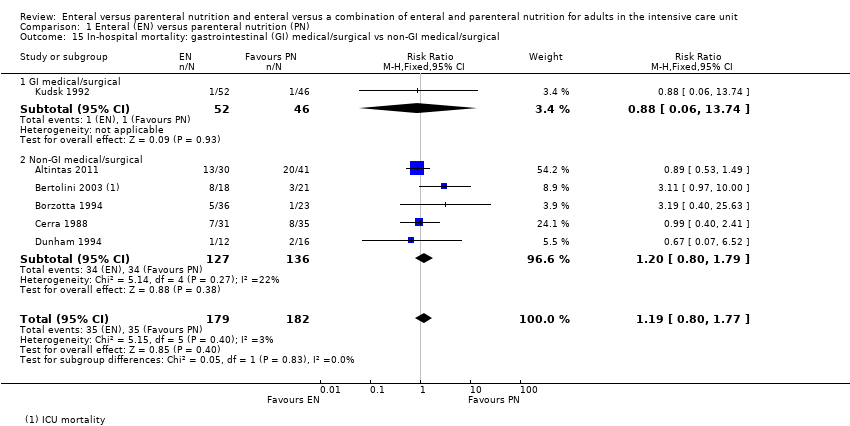
Comparison 1 Enteral (EN) versus parenteral nutrition (PN), Outcome 15 In‐hospital mortality: gastrointestinal (GI) medical/surgical vs non‐GI medical/surgical.

Comparison 1 Enteral (EN) versus parenteral nutrition (PN), Outcome 16 Mortality at 30 days: GI medical/surgical vs non‐GI medical/surgical.
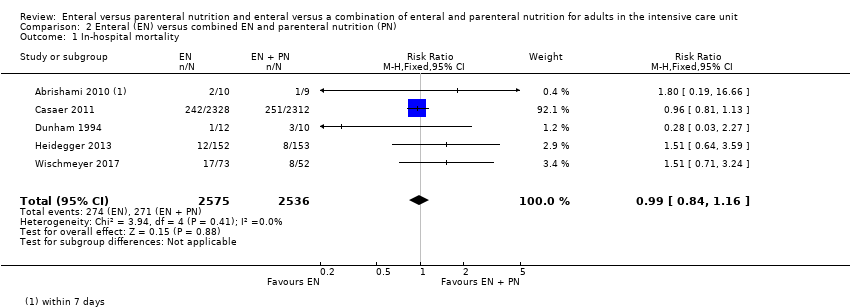
Comparison 2 Enteral (EN) versus combined EN and parenteral nutrition (PN), Outcome 1 In‐hospital mortality.

Comparison 2 Enteral (EN) versus combined EN and parenteral nutrition (PN), Outcome 2 Mortality at 30 days.

Comparison 2 Enteral (EN) versus combined EN and parenteral nutrition (PN), Outcome 3 Mortality at 90 days.
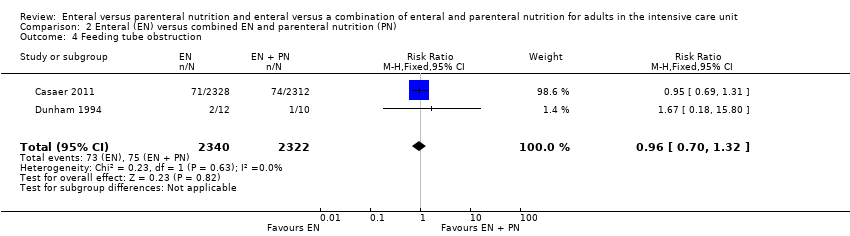
Comparison 2 Enteral (EN) versus combined EN and parenteral nutrition (PN), Outcome 4 Feeding tube obstruction.
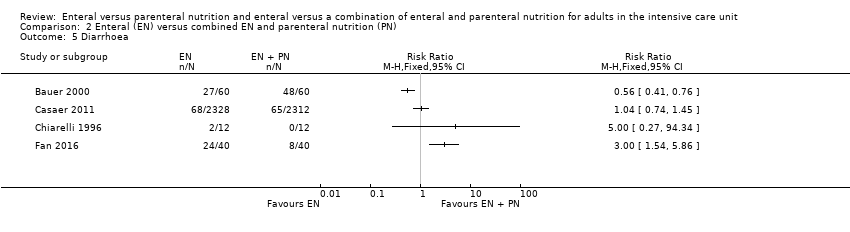
Comparison 2 Enteral (EN) versus combined EN and parenteral nutrition (PN), Outcome 5 Diarrhoea.

Comparison 2 Enteral (EN) versus combined EN and parenteral nutrition (PN), Outcome 6 Pneumonia.
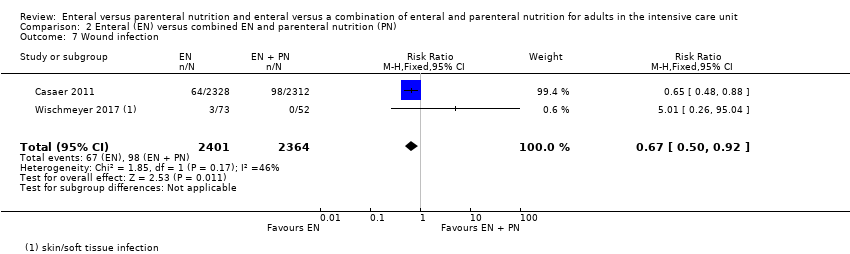
Comparison 2 Enteral (EN) versus combined EN and parenteral nutrition (PN), Outcome 7 Wound infection.

Comparison 2 Enteral (EN) versus combined EN and parenteral nutrition (PN), Outcome 8 Bloodstream infection.

Comparison 2 Enteral (EN) versus combined EN and parenteral nutrition (PN), Outcome 9 Urinary tract infection.
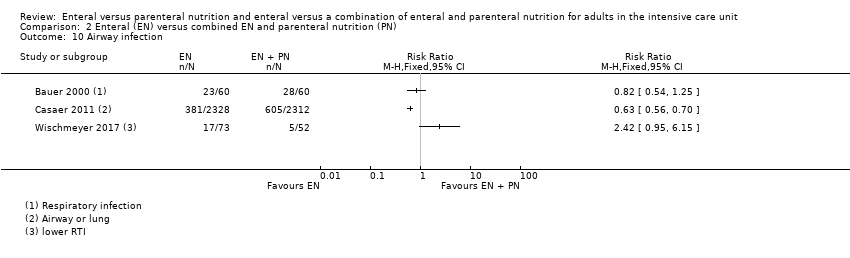
Comparison 2 Enteral (EN) versus combined EN and parenteral nutrition (PN), Outcome 10 Airway infection.
| Enteral versus parenteral nutrition for adults in the intensive care unit | |||||
| Patient or population: critically ill adults admitted to the ICU for trauma, emergency, or surgical care; population excluded people with acute pancreatitis | |||||
| Outcomes | Anticipated absolute effects* (95% CI) | Relative effect | Number of participants | Certainty of the evidence | |
| Risk with EN | Risk with PN | ||||
| Mortality | In‐hospital mortality | RR 1.19 | 361 | ⊕⊕⊝⊝ | |
| Study population | |||||
| 229 per 1000 | 192 per 1000 | ||||
| Mortality within 30 days | RR 1.02 (0.92 to 1.13) | 3148 | ⊕⊕⊝⊝ | ||
| Study population | |||||
| 304 per 1000 | 298 per 1000 | ||||
| Mortality within 90 days | RR 1.06 | 2461 | ⊕⊝⊝⊝ | ||
| Study population | |||||
| 393 per 1000 | 371 per 1000 | ||||
| Mortality within 180 days | RR 0.33 (0.04 to 2.97) | 46 | ⊕⊝⊝⊝ | ||
| Study population | |||||
| 130 per 1000 | 43 per 1000 (5 in 387) | ||||
| Number of ICU‐free days up to day 28 | – | – | – | – | Not measured |
| Number of ventilator‐free days up to day 28 | Mean number of ventilator‐free days: 14.2 (SD ± 12.2) | Mean difference 0 days (0.97 fewer to 0.97 more) | N/A | 2388 | ⊕⊝⊝⊝ |
| Adverse events: aspiration (as reported by study authors at end of study follow‐up period) | Study population | RR 1.53 | 2437 | ⊕⊝⊝⊝ | |
| 5 per 1000 | 3 per 1000 | ||||
| Adverse events: sepsis (as reported by study authors at end of study follow‐up period) | Study population | RR 0.59 (0.37 to 0.95) | 361 | ⊕⊕⊝⊝ | |
| 123 per 1000 | 209 per 1000 | ||||
| Adverse events: pneumonia (as reported by study authors at end of study follow‐up period) | Study population | RR 1.10 (0.82 to 1.48) | 415 | ⊕⊕⊝⊝ | |
| 314 per 1000 | 268 per 1000 | ||||
| Adverse events: vomiting (as reported by study authors at end of study follow‐up period) | Study population | RR 3.42 | 2525 | ⊕⊝⊝⊝ | |
| 11 per 1000 | 3 per 1000 | ||||
| *The risk in the intervention group (and its 95% confidence interval) is based on the assumed risk in the comparison group and the relative effect of the intervention (and its 95% CI). CI: confidence interval; EN: enteral nutrition; ICU: intensive care unit; N/A: not applicable; PN: parenteral nutrition; RR: risk ratio; SD: standard deviation. | |||||
| GRADE Working Group grades of evidence | |||||
| aAll studies had a high risk of performance bias; downgraded one level for study limitations. Studies included a variety of primary diagnoses and evidence was less direct; downgraded one level for indirectness. bAll studies had a high risk of performance bias; downgraded one level for study limitations. Studies included a variety of primary diagnoses and study designs and evidence were less direct; downgraded one level for indirectness. cAll studies had a high risk of performance bias; downgraded one level for study limitations. Studies included a variety of primary diagnoses and study designs and evidence were less direct; downgraded one level for indirectness. Few studies and one included study had a large number of participants relative to other included studies; downgraded one level for imprecision. dData from only one study that had a high risk of performance bias; downgraded one level for study limitations and two levels for imprecision. eAll studies had a high risk of performance bias; downgraded one level for study limitations. Studies included a variety of primary diagnoses and evidence was less direct; downgraded one level for indirectness. Few studies and one included study had a large number of participants relative to other included studies; downgraded one level for imprecision. fAll studies had a high risk of performance bias; downgraded one level for study limitations. Studies included a variety of primary diagnoses and evidence was less direct; downgraded one level for indirectness. gAll studies had a high risk of performance bias; downgraded one level for study limitations. Studies included a variety of primary diagnoses and study designs and evidence were less direct; downgraded one level for indirectness. Few studies, with very few events, and one included study had a large number of participants relative to other included studies; downgraded one level for imprecision. | |||||
| Enteral versus enteral and parenteral nutrition for adults in the intensive care unit | |||||
| Patient or population: critically ill adults admitted to the ICU for trauma, emergency, or post‐surgical care; population excludes participants with acute pancreatitis | |||||
| Outcomes | Anticipated absolute effects* (95% CI) | Relative effect | Number of participants | Certainty of the evidence | |
| Risk with EN | Risk with EN + PN | ||||
| Mortality | In‐hospital mortality | RR 0.99 (0.84 to 1.16) | 5111 | ⊕⊕⊝⊝ | |
| Study population | |||||
| 106 per 1000 | 107 per 1000 | ||||
| Mortality within 30 days | RR 1.64 (1.06 to 2.54) | 409 | ⊕⊝⊝⊝ | ||
| Study population | |||||
| 216 per 1000 | 132 per 1000 | ||||
| Mortality within 90 days | RR 1.00 (0.86 to 1.18) | 4760 (2 studies) | ⊕⊕⊝⊝ | ||
| Study population | |||||
| 115 per 1000 (99 to 135) | 115 per 1000 | ||||
| Mortality within 180 days | RR 1.00 | 120 (1 RCT) | ⊕⊝⊝⊝ | ||
| Study population | |||||
| 400 per 1000 (260 to 620) | 400 per 1000 | ||||
| Number of ICU‐free days up to day 28 | – | – | – | – | Not measured |
| Number of ventilator‐free days up to day 28 | – | – | – | – | Not measured |
| Adverse events: aspiration (as reported by study authors at end of study follow‐up period) | – | – | – | – | Not measured |
| Adverse events: sepsis (as reported by study authors at end of study follow‐up period) | – | – | – | – | Not measured |
| Adverse events: pneumonia (as reported by study authors at end of study follow‐up period) | 350 per 1000 (228 to 538) | 250 per 1000 | RR 1.40 (0.91 to 2.15) | 205 (2 studies) | ⊕⊝⊝⊝ Very lowd |
| Adverse events: vomiting (as reported by study authors at end of study follow‐up period) | – | – | – | – | Not measured |
| *The risk in the intervention group (and its 95% confidence interval) is based on the assumed risk in the comparison group and the relative effect of the intervention (and its 95% CI). CI: confidence interval; EN: enteral nutrition; ICU: intensive care unit; PN: parenteral nutrition; RCT: randomized controlled trial; RR: risk ratio. | |||||
| GRADE Working Group grades of evidence | |||||
| aAll studies had high risk of performance bias; downgraded one level for study limitations. Studies included a variety of primary diagnoses and evidence was less direct; downgraded one level for indirectness. bAll studies had high risk of performance bias; downgraded one level for study limitations. Studies included a variety of primary diagnoses and evidence was less direct; downgraded one level for indirectness. Few studies with increased risk of imprecision; downgraded one level. cBoth studies had high risk of performance bias; downgraded one level for study limitations. Studies included a variety of primary diagnoses and evidence was less direct; downgraded one level for indirectness. dData from only one study that had a high risk of performance bias; downgraded one level for study limitations and two levels for imprecision. | |||||
| Study ID | Description of event | EN group (n/N) | PN group (n/N) |
| Mechanical events | |||
| Clogged jejunostomy tube | 9/23 | N/A | |
| Disconnected line | N/A | 1/23 | |
| Line eroded into right upper lobe bronchus | N/A | 1/23 | |
| Malfunctioned line | N/A | 7/23 | |
| Transpyloric tube occlusion | 2/12 | 0/15 | |
| Failure to intubate | 0/12 | 0/15 | |
| Withdrawal of tube by participant | 1/12 | N/A | |
| Metabolic events | |||
| Hepatic failure | 1/23 | 1/23 | |
| Acute renal failure | 1/23 | 1/23 | |
| Pancreatitis | 2/23 | 1/23 | |
| Hypoproteinaemia | 22/40 | 32/40 | |
| Electrolyte disturbance | 5/1197 | 8/1191 | |
| Gastrointestinal events | |||
| Nausea, cramps, bloating | 19/23 | 16/23 | |
| Gastrointestinal bleeding | 0/23 | 0/23 | |
| Gastric reflux | 0/12 | 0/15 | |
| Ileus | 1/12 | 0/15 | |
| Small bowel ileus | 0/12 | 1/15 | |
| Stress ulcer | 7/40 | 19/40 | |
| Elevated liver enzymes | 7/1197 | 3/1191 | |
| Jaundice | 1/1197 | 1/1191 | |
| Ischaemic bowel | 0/1197 | 1/1191 | |
| Anastomotic leak | 2/22 | 6/23 | |
| Infective events | |||
| Persistent fever without obvious cause | 1/23 | 5/23 | |
| Catheter infection | 2/30 | 4/41 | |
| Meningitis | 2/28 | 0/21 | |
| Sinusitis | 3/28 | 6/21 | |
| Bronchitis | 6/28 | 6/28 | |
| Clostridium difficile | 2/28 | 4/21 | |
| Peritonitis | 0/28 | 1/21 | |
| Intracranial infection | 7/40 | 13/40 | |
| Pyaemia | 3/40 | 19/40 | |
| Pulmonary infection | 2/30 | 2/30 | |
| Empyema | 1/51 | 4/45 | |
| Aspiration pneumonia | 9/28 | 3/23 | |
| Infection (type of infection not described) | 5/28 | 4/23 | |
| EN: enteral nutrition; n: number of participants with an event; N: total number randomized to group; N/A: not applicable; PN: parenteral nutrition. | |||
| Study ID | Description of event | EN group (n/N) | EN + PN group (n/N) |
| Mechanical events | |||
| CVC obstruction | 9/2328 | 15/2312 | |
| Nasal bleeding | 18/2328 | 14/2312 | |
| Pneumohaemothorax after CVC placement | 0/2328 | 2/2312 | |
| Subclavian artery puncture | 0/2328 | 2/2312 | |
| Withdrawal of tube | 1/12 | 0/10 | |
| Failure to intubate | 0/12 | 2/10 | |
| Metabolic events | |||
| Hypoproteinaemia | 22/40 | 7/40 | |
| Gastrointestinal events | |||
| Vomiting or aspiration | 284/2328 | 295/2312 | |
| Gastric reflux | 0/12 | 2/10 | |
| Stress ulcer | 7/40 | 9/40 | |
| infective events | |||
| Pyemia | 3/40 | 10/40 | |
| Intracranial infection | 7/40 | 5/40 | |
| Catheter bloodstream infection | 0/73 | 7/52 | |
| Intra‐abdominal infection | 0/73 | 4/52 | |
| Upper urinary tract infection | 0/73 | 1/52 | |
| Surgical deep infection | 0/73 | 1/52 | |
| CVC: central venous catheter; EN: enteral nutrition; EN + PN: combined enteral and parenteral nutrition; n: number of participants with an event; N: total number randomized to group. | |||
| Outcome or subgroup title | No. of studies | No. of participants | Statistical method | Effect size |
| 1 In‐hospital mortality Show forest plot | 6 | 361 | Risk Ratio (M‐H, Fixed, 95% CI) | 1.19 [0.80, 1.77] |
| 2 Mortality at 30 days Show forest plot | 11 | 3148 | Risk Ratio (M‐H, Fixed, 95% CI) | 1.02 [0.92, 1.13] |
| 3 Mortality at 90 days Show forest plot | 3 | 2461 | Risk Ratio (M‐H, Fixed, 95% CI) | 1.06 [0.95, 1.17] |
| 4 Aspiration Show forest plot | 2 | 2437 | Risk Ratio (M‐H, Fixed, 95% CI) | 1.53 [0.46, 5.03] |
| 5 Pneumothorax Show forest plot | 2 | 2437 | Risk Ratio (M‐H, Fixed, 95% CI) | 1.46 [0.19, 11.22] |
| 6 Hyperglycaemia Show forest plot | 2 | 2437 | Risk Ratio (M‐H, Fixed, 95% CI) | 0.57 [0.35, 0.93] |
| 7 Vomiting Show forest plot | 3 | 2525 | Risk Ratio (M‐H, Fixed, 95% CI) | 3.42 [1.15, 10.16] |
| 8 Diarrhoea Show forest plot | 6 | 363 | Risk Ratio (M‐H, Fixed, 95% CI) | 2.17 [1.72, 2.75] |
| 9 Abdominal distension Show forest plot | 3 | 2505 | Risk Ratio (M‐H, Fixed, 95% CI) | 1.53 [0.34, 6.96] |
| 10 Sepsis Show forest plot | 7 | 361 | Risk Ratio (M‐H, Fixed, 95% CI) | 0.59 [0.37, 0.95] |
| 11 Pneumonia Show forest plot | 7 | 415 | Risk Ratio (M‐H, Fixed, 95% CI) | 1.10 [0.82, 1.48] |
| 12 Intra‐abdominal infection Show forest plot | 3 | 202 | Risk Ratio (M‐H, Fixed, 95% CI) | 0.26 [0.07, 0.89] |
| 13 Wound infection Show forest plot | 3 | 155 | Risk Ratio (M‐H, Fixed, 95% CI) | 1.45 [0.55, 3.82] |
| 14 Urinary tract infection Show forest plot | 3 | 160 | Risk Ratio (M‐H, Fixed, 95% CI) | 1.48 [0.65, 3.40] |
| 15 In‐hospital mortality: gastrointestinal (GI) medical/surgical vs non‐GI medical/surgical Show forest plot | 6 | 361 | Risk Ratio (M‐H, Fixed, 95% CI) | 1.19 [0.80, 1.77] |
| 15.1 GI medical/surgical | 1 | 98 | Risk Ratio (M‐H, Fixed, 95% CI) | 0.88 [0.06, 13.74] |
| 15.2 Non‐GI medical/surgical | 5 | 263 | Risk Ratio (M‐H, Fixed, 95% CI) | 1.20 [0.80, 1.79] |
| 16 Mortality at 30 days: GI medical/surgical vs non‐GI medical/surgical Show forest plot | 10 | 3068 | Risk Ratio (M‐H, Fixed, 95% CI) | 1.03 [0.93, 1.14] |
| 16.1 GI medical/surgical | 1 | 60 | Risk Ratio (M‐H, Fixed, 95% CI) | 0.67 [0.12, 3.71] |
| 16.2 Non‐GI medical/surgical | 9 | 3008 | Risk Ratio (M‐H, Fixed, 95% CI) | 1.03 [0.93, 1.15] |
| Outcome or subgroup title | No. of studies | No. of participants | Statistical method | Effect size |
| 1 In‐hospital mortality Show forest plot | 5 | 5111 | Risk Ratio (M‐H, Fixed, 95% CI) | 0.99 [0.84, 1.16] |
| 2 Mortality at 30 days Show forest plot | 3 | 409 | Risk Ratio (M‐H, Fixed, 95% CI) | 1.64 [1.06, 2.54] |
| 3 Mortality at 90 days Show forest plot | 2 | 4760 | Risk Ratio (M‐H, Fixed, 95% CI) | 1.00 [0.86, 1.18] |
| 4 Feeding tube obstruction Show forest plot | 2 | 4662 | Risk Ratio (M‐H, Fixed, 95% CI) | 0.96 [0.70, 1.32] |
| 5 Diarrhoea Show forest plot | 4 | Risk Ratio (M‐H, Fixed, 95% CI) | Totals not selected | |
| 6 Pneumonia Show forest plot | 2 | 205 | Risk Ratio (M‐H, Fixed, 95% CI) | 1.40 [0.91, 2.15] |
| 7 Wound infection Show forest plot | 2 | 4765 | Risk Ratio (M‐H, Fixed, 95% CI) | 0.67 [0.50, 0.92] |
| 8 Bloodstream infection Show forest plot | 2 | 4765 | Risk Ratio (M‐H, Fixed, 95% CI) | 0.81 [0.66, 1.01] |
| 9 Urinary tract infection Show forest plot | 3 | 4885 | Risk Ratio (M‐H, Fixed, 95% CI) | 0.87 [0.65, 1.17] |
| 10 Airway infection Show forest plot | 3 | Risk Ratio (M‐H, Fixed, 95% CI) | Totals not selected | |