Audífonos para la hipoacusia leve a moderada en adultos
References
References to studies included in this review
References to studies excluded from this review
References to ongoing studies
Additional references
References to other published versions of this review
Characteristics of studies
Characteristics of included studies [ordered by study ID]
Jump to:
| Methods | 2‐arm, double‐blinded, multi‐centre, with 6 months duration of treatment and follow‐up | |
| Participants | Location: France, multi‐centre sites Setting of recruitment and treatment: hospital setting Sample size:
Participant (baseline) characteristics:
Inclusion criteria: probable diagnosis of AD according to DSM‐IV and NINCDS‐ADRDA, aged >= 65 years, Mini‐Mental State Examination score between 10 and 28, bilateral SNHL (between 21 and 80 dB HL), not worn hearing aids for previous 2 years, tolerates hearing aids for at least 1 hour per day, living with an informal, motivated caregiver. Exclusion criteria: non‐AD dementia (medical history, clinical elements, biological/medical imaging data examples given), recent introduction of cognitive‐behavioural treatment, change in dosage of treatments prior to the study (cholinergic and memantine (< 6 m), psychotropic medication (< 2 m)), recent change in dosage of treatments (cholinergic and memantine (< 2 m), (cholinergic and memantine (< 1 m)), break or loss of hearing aids 2 or more times during study. | |
| Interventions | Intervention group (n = 18): active hearing aids (SAVIA and VALEO (Phonak), behind‐the‐ear, fully digital, bilateral fits. Fitted according to Phonak Digital (proprietary fitting algorithm derived from NAL‐NL1). Comparator group (n = 20): placebo hearing aids, programmed to minimal amplification so patients could just hear 25 dB SL white noise (30 dB on average), to compensate for the occlusion effect. Use of additional interventions (common to both treatment arms): at 6 months, placebo hearing aids were activated; both groups used active hearing aids for 12 months study endpoint. | |
| Outcomes | Primary outcome: Neuropsychiatric Inventory None of these outcome measures were relevant or appropriate to the outcome domains of interest specified in this review. | |
| Funding sources | French Ministry of Health (Clinical Research Hospital Program 2005, PHRC 2005‐APN) and the Fondation Mederic Alzheimer, Paris | |
| Declarations of interest | Nothing to disclose | |
| Notes | All participants had a probable diagnosis of Alzheimer's disease and so this was a distinctly different clinical population from typical first‐time hearing aid users. Hearing aids provided by Phonak at no cost to the participant. | |
| Risk of bias | ||
| Bias | Authors' judgement | Support for judgement |
| Random sequence generation (selection bias) | Low risk | Randomisation used a pre‐established and well‐balanced list based on chronological order of inclusion. Used blocks of 6 patients. |
| Allocation concealment (selection bias) | Low risk | Randomisation procedure was centralised at a clinical research unit remote from the study setting and conducted by research methodologists independent of the study team. |
| Blinding of participants and personnel (performance bias) | Low risk | Placebo hearing aids used so participants were blinded. Only the hearing aid specialist fitting the devices knew the randomisation group of the participants (required to apply the appropriate gain prescription). Unlikely that blinding could be broken. |
| Blinding of outcome assessment (detection bias) | Low risk | Outcome assessor and participants were blinded. |
| Incomplete outcome data (attrition bias) | Unclear risk | Dropouts and withdrawals were documented but unclear why some data from the remaining participants on some outcomes were not reported. |
| Selective reporting (reporting bias) | Low risk | Data on all outcomes in the published study protocol (NCT01788423) were reported. |
| Other bias | Low risk | Study appears to be free of other sources of bias. |
| Methods | 3‐arm, double‐blinded, single‐centre, parallel‐arm RCT, with 6 and 10 weeks duration of treatment and follow‐up | |
| Participants | Location: USA (Indiana) Setting of recruitment and treatment: university research clinic Sample size:
Participant (baseline) characteristics: Age: mean 69.1 years (SD 6.1) Gender: 92 male, 72 female Main diagnosis: hearing loss (PTA averaged across 0.5, 1.0, 2.0 kHz = 28.1 dB HL (SD 8.0); high frequency PTA averaged across 1.0, 2.0, 4.0 kHz = 38.8 dB HL (SD 7.9) Other important effect modifiers: none Inclusion criteria: age 55 to 79 years, English as native language, MMSE score > 25, no prior hearing aid experience, pure‐tone audiometry (air) consistent with age‐related hearing loss within the fitting guidelines of this study, bilaterally symmetrical hearing loss. Exclusion criteria: presence of a medically treatable ear condition, bilateral, flat tympanograms, known fluctuating or progressive HL, presence of cognitive, medical or language‐based conditions that limit ability to complete all test procedures, currently or recently taking platinum‐based cancer drugs or mycin‐family antibiotics, previously diagnosed with either multiple sclerosis or Ménière's disease, failure to seek or waive medical evaluation and clearance following hearing evaluation, unwillingness to be randomly assigned to a treatment group. | |
| Interventions | Intervention group, AB and CD (n = 108): active hearing aids (ReSound Alera Mini), behind‐the‐ear, fully digital. Bilateral fits. Fixed directional microphones, dynamic feedback suppression and noise reduction unclear if enabled. AB: fitted using real‐ear measurements according to the NAL‐NL2 target, with adjustments as necessary. Verified via real ear measurements using Audioscan Verifit system. CD: 3 possible prescriptions based on NAL‐NL2 fit to the 3 most common patterns of hearing loss among older adults in the US. Different programmes applying different constant gains across all frequencies (gain values based on chosen typical prescription). Comparator group (n = 51): placebo hearing aids (ReSound Alera Mini), behind‐the‐ear, fully digital. Bilateral fits. Fixed directional microphones (n = 20), omni‐directional microphones (n = 23), dynamic feedback suppression and noise reduction enabled. Programmed to achieve 0 dB insertion gain to control for any occlusion effect. Verified via real ear measurements using Audioscan Verifit system. Use of additional interventions (common to both treatment arms): none up to 6 weeks post‐baseline, then the CD group was offered AB‐delivered hearing aids for a further 4 to 5 weeks trial. | |
| Outcomes | Primary outcome: Profile of Hearing Aid Benefit | |
| Funding sources | National Institute on Deafness and Other Communication Disorders R01 DC011771 | |
| Declarations of interest | None reported | |
| Notes | AB and CD were combined into the intervention group as hearing aids not service delivery models were of interest. The 6‐week follow‐up measured the primary and secondary outcome measures. Participants paid for their hearing aids. | |
| Risk of bias | ||
| Bias | Authors' judgement | Support for judgement |
| Random sequence generation (selection bias) | Low risk | Based on random number generation prior to study initiation, blocked by unaided Connected Speech Test performance (low, medium, high). |
| Allocation concealment (selection bias) | High risk | The clinical trial co‐ordinator (CTC) allocating patients had access to the randomisation lists and allocation was not concealed. |
| Blinding of participants and personnel (performance bias) | Unclear risk | All markings and materials revealing manufacturer or model of the devices were obscured. The CTC was not blinded to patient allocation and there were several opportunities where there was potential for participants to be unblinded. |
| Blinding of outcome assessment (detection bias) | Unclear risk | Outcome assessor (audiologist 4) was blinded to allocation of intervention group. However, it is unclear whether all the participants remained effectively blinded. |
| Incomplete outcome data (attrition bias) | Low risk | All dropouts and loss to follow‐up described and reasonable. |
| Selective reporting (reporting bias) | Low risk | Data on all outcomes in the published study protocol (NCT01788423) were reported. The study authors provided the full data set for this review upon request. |
| Other bias | Low risk | Study appears to be free of other sources of bias. |
| Methods | 2‐arm, non‐blinded, multi‐centre, parallel‐group RCT, with 2 months duration of treatment and follow‐up | |
| Participants | Location: USA, 4 sites (Tennessee n = 2, Pittsburgh, Florida) Setting of recruitment and treatment: US veterans awaiting hearing aids for the first time at Veteran Affairs Medical Centres Sample size:
Participant (baseline) characteristics:
Inclusion criteria: PTA at 2.0, 3.0, 4.0 kHz >= 30 dB HL in better hearing ear, Mini‐Mental State Examination pass, eligible for hearing aids, no prior hearing aid experience. Exclusion criteria: conduction or retrocochlear pathology, asymmetry (not defined), speech recognition in quiet (not defined). | |
| Interventions | Intervention group (n = 189): hearing aids (manufacturer not specified), in‐the‐ear, analogue or fully digital, fitted 2 weeks post‐baseline. Bilateral fits routine. Fitted using real‐ear measurements according to the NAL‐R target, with adjustments as necessary. Fitted 2 weeks post‐baseline. Comparator group (n = 191): waiting list controls; no hearing aids up to 10 weeks post‐baseline. Use of additional interventions (common to both treatment arms): none up to 10 weeks post‐baseline, then both groups had hearing aids. | |
| Outcomes | Primary outcomes: none specified Reported outcomes: baseline and 2 months post‐fitting: WHO‐DAS II total (WHO‐DAS II subscales: Communication, Participation), HHIE, APHAB Global | |
| Funding sources | Veterans Association | |
| Declarations of interest | None noted | |
| Notes | 10 weeks after baseline, hearing aids were fitted to the control group and the study continued to 12 months follow‐up. Hearing aids provided at no cost. | |
| Risk of bias | ||
| Bias | Authors' judgement | Support for judgement |
| Random sequence generation (selection bias) | Low risk | Although no information was reported in the published manuscript, inspection of the study protocol provided by the authors showed that stratified randomisation had been used. Participants were recruited in a pairs design and coin tossing decided which group the participant was allocated too (e.g. heads, Participant A is in the treatment group). |
| Allocation concealment (selection bias) | Unclear risk | No information reported. |
| Blinding of participants and personnel (performance bias) | High risk | No blinding, therefore patients and personnel were aware of the intervention. Possible that the hearing aid group were treated differently compared to the waiting list group in other aspects. |
| Blinding of outcome assessment (detection bias) | High risk | No blinding and outcomes were likely to have been influenced by the lack of blinding. |
| Incomplete outcome data (attrition bias) | Low risk | Detailed information provided on attrition (see Table 2) with reasons, where known. Missing data were imputed using appropriate methods. |
| Selective reporting (reporting bias) | Low risk | No published study protocol. However, inspection of the protocol provided by the authors indicates that the published reports include all expected outcomes. |
| Other bias | Unclear risk | Waiting list controls have a risk of overestimating the benefit of an intervention. However, all participants in the waiting lists were to receive the active intervention at the end of the randomised phase (eligibility to receive active intervention was not conditional on severity or outcomes reported during the study). |
| Methods | 2‐arm, non‐blinded, multi‐centre, parallel‐group RCT, with a 6 weeks follow‐up | |
| Participants | Location: Sweden, 1 site Setting of recruitment and treatment: hearing clinic at a Swedish university hospital Sample size:
Participant (baseline) characteristics:
Inclusion criteria: hearing loss to a degree that hearing aids were needed, no prior hearing aid experience, tinnitus duration for more than 6 months Exclusion criteria: none noted | |
| Interventions | Intervention group (n = 20): hearing aids (manufacturer: Widex, Rexton, Oticon, Siemens, Philips, Danavox), unilateral fits (95%) 6 weeks post‐baseline. Fitting not specified. Comparator group (n = 19): waiting list controls, no hearing aids up to 6 weeks post‐baseline Use of additional interventions (common to both treatment arms): none up to 6 weeks post‐baseline, then both groups had hearing aids | |
| Outcomes | Primary outcomes: Hearing Scaling (easy, fairly easy, fairly difficult, difficult), 6 weeks post‐fitting Reported outcomes: as for primary outcomes Hearing Scaling assessment was not included in the analysis of listening abilities because not all of the data required were available in the paper and were no longer available. | |
| Funding sources | Bank of Sweden Tercentenary Foundation (grant No. 83/16) and grants from Stifrelsen, Stockholm and Oticon Foundation, Copenhagen | |
| Declarations of interest | None noted | |
| Notes | 6 weeks after baseline, hearing aids were fitted to the control group and the study continued to 10 weeks follow‐up for each group. Hearing aids were provided at no cost. | |
| Risk of bias | ||
| Bias | Authors' judgement | Support for judgement |
| Random sequence generation (selection bias) | Low risk | Insufficient information was provided in the paper. Quote: "To prevent bias, the random allocations of the subjects were done after their first interview according to a randomisation plan". However, contact with the authors revealed randomisation was most likely done in blocks of 10 (5 participants experimental group, 5 participants control group) to recruit groups of the same size. |
| Allocation concealment (selection bias) | Low risk | Insufficient information was provided in the paper. Quote: "To prevent bias, the random allocations of the subjects were done after their first interview according to a randomisation plan". However, contact with the authors revealed that the allocation to group was concealed by using pre‐prepared opaque envelopes. |
| Blinding of participants and personnel (performance bias) | High risk | No blinding, therefore patients and personnel were aware of the intervention. Possible that the hearing aid group were treated differently compared to the waiting list group in other aspects. |
| Blinding of outcome assessment (detection bias) | High risk | No blinding and outcomes were likely to have been influenced by the lack of blinding. |
| Incomplete outcome data (attrition bias) | Unclear risk | No participant dropouts, but insufficient reporting of whether all data points from the hearing scale were completed by group. Historic records not available. |
| Selective reporting (reporting bias) | Low risk | Study protocol not available but the authors indicated that no measures other than the listening scaling task were included in the study. |
| Other bias | Unclear risk | Waiting list controls have a risk of overestimating the benefit of an intervention. However, all participants in the waiting lists were to receive the active intervention at the end of the experimental phase (not conditional on severity at the end of the study). |
| Methods | 2‐arm, non‐blinded, single‐centre, parallel‐group RCT, with 16 weeks duration of treatment and follow‐up at 6 and 16 weeks | |
| Participants | Location: USA, 1 site Setting of recruitment and treatment: US veterans undergoing hearing assessment tests at the Audie L. Murphy Memorial Veterans Hospital and associated primary care clinics Sample size:
Participant (baseline) characteristics:
Inclusion criteria: PTA at 2 kHz better ear >= 40 dB HL in better hearing ear, over 64 years Exclusion criteria: severely disabling comorbid disease, current hearing aid users, live more than 100 miles from the clinic, existing hearing aid users | |
| Interventions | Intervention group (n = 95): hearing aids (manufacturer not specified), in‐the‐ear (98%), unilateral fits (97%), typically to the worst hearing ear Comparator group (n = 99): waiting list controls, no hearing aids Use of additional interventions (common to both treatment arms): none | |
| Outcomes | Primary outcomes: none specified Reported outcomes: baseline and 16 weeks post‐fitting. Hearing Handicap Inventory for the Elderly, Quantified Denver Scale, Short Portable Mental Status Questionnaire, Geriatric Depression Scale, Self Evaluation and Life Function. HHIE and QDS also measured at 6 weeks. HHIE results at 16 weeks used in meta‐analyses. | |
| Funding sources | Robert Wood Johnson Foundation, a Milbank Scholar Program Award and an American College of Physicians' Teaching and Research Scholar Award | |
| Declarations of interest | None noted | |
| Notes | Hearing aids provided at no cost | |
| Risk of bias | ||
| Bias | Authors' judgement | Support for judgement |
| Random sequence generation (selection bias) | Low risk | Sequence generated using block randomisation with a block size of 6 (3 x 2 treatments). |
| Allocation concealment (selection bias) | Low risk | Use of blocked randomisation could have created situations in which allocations at the end of a block can be guessed. However, a block size of 6 (3 x 2 treatments) would have created sufficient uncertainty. Concealment was facilitated through use of a remote telephone allocation service. |
| Blinding of participants and personnel (performance bias) | High risk | No blinding, therefore patients and personnel were aware of the intervention. Possible that the hearing aid group were treated differently compared to the waiting list group in other aspects. |
| Blinding of outcome assessment (detection bias) | High risk | No blinding, and outcomes were likely to have been influenced by the lack of blinding Quote: "All scales were self‐administered, except the SPMSQ which was administered by a trained interviewer". |
| Incomplete outcome data (attrition bias) | Low risk | Missing outcome data due to dropouts that were even across treatment and control groups and for which reasons were reported and unlikely to be related to the true outcome. |
| Selective reporting (reporting bias) | Low risk | No published study protocol. However, no evidence to support the suggestion that the published reports did not include all the expected outcomes including those that were pre‐specified. |
| Other bias | Unclear risk | Waiting list controls have a risk of overestimating the benefit of an intervention. However, all participants in the waiting list group were to receive the active intervention at the end (not conditional on severity at the end of the study). |
AD: Alzheimer's disease
APHAB: Abbreviated Profile of Hearing Aid Benefit
CTC: clinical trial co‐ordinator
dB: decibel
DSM‐IV: Diagnostic and Statistical Manual of Mental Disorders ‐ IV
HHIE: Hearing Handicap Inventory for the Elderly
HL: hearing level
MMSE: Mini‐Mental State Examination
NAL: National Acoustic Laboratories
NL1: non‐linear, version 1
NL2: non‐linear, version 2
NINCDS‐ADRDA: National Institute of Neurological and Communicative Disorders and Stroke and the Alzheimer's Disease and Related Disorders Association
PTA: pure‐tone average
QDS: Quantified Denver Scale of Communication
R: revised
RCT: randomised controlled trial
SD: standard deviation
SNHL: sensorineural hearing loss
SPMSQ: Short Portable Mental Status Questionnaire
WHO‐DAS: World Health Organization Disability Assessment Schedule
Characteristics of excluded studies [ordered by study ID]
Jump to:
| Study | Reason for exclusion |
| ALLOCATION: not true randomisation, as patients were allocated by eligibility for VA funded hearing aids: those eligible for funding through the VA received hearing aids; those not eligible for hearing aids acted as controls. | |
| ALLOCATION: non‐randomised controlled trial | |
| ALLOCATION: non‐randomised controlled trial | |
| ALLOCATION: randomised controlled trial | |
| ALLOCATION: not true randomisation, as patients were allocated by eligibility for VA funded hearing aids: those eligible for funding through the VA received hearing aids; those not eligible for hearing aids acted as controls. |
VA: Veterans Association
Characteristics of ongoing studies [ordered by study ID]
Jump to:
| Trial name or title | Auditory Rehabilitation and Cognition in Alzheimer Patients (RACO‐MA) |
| Methods | Randomised controlled trial, double‐blind design |
| Participants | Adults with Alzheimer's disease and hearing loss |
| Interventions | Hearing aids and placebo |
| Outcomes | Alzheimer's Disease Assessment Scale ‐ cognitive scale (primary), pure‐tone and speech audiometry, Mini‐Mental State Examination, Hearing Handicap Inventory for the Elderly (HHIE), Hearing Loss Impact Scale in Adults (HLSiA), Quality of life ‐ Alzheimer's disease scale, Zarit scale for caregiver burden, Geriatric Depression Scale, Trail Making Test for executive function, Wechsler Adult Intelligence Scale, Beauregard test for speech comprehension, Glasgow Hearing Aid Benefit Profile (GHABP). Outcomes of interest to this review are the HHIE, HLISiA and GHABP. |
| Starting date | December 2016 |
| Contact information | None supplied |
| Notes | University Hospital, Tours, France |
Data and analyses
| Outcome or subgroup title | No. of studies | No. of participants | Statistical method | Effect size |
| 1 Hearing‐specific health‐related quality of life Show forest plot | 3 | 722 | Mean Difference (IV, Random, 95% CI) | ‐26.47 [‐42.16, ‐10.77] |
| Analysis 1.1  Comparison 1 Hearing aids versus no/placebo hearing aids, Outcome 1 Hearing‐specific health‐related quality of life. | ||||
| 1.1 Subgroup A (community setting, male‐female balance, behind‐the‐ear hearing aids, placebo control) | 1 | 154 | Mean Difference (IV, Random, 95% CI) | ‐10.54 [‐15.26, ‐5.82] |
| 1.2 Subgroup B (Veterans Association setting, mostly male, in‐the‐ear hearing aids, waiting list control) | 2 | 568 | Mean Difference (IV, Random, 95% CI) | ‐33.48 [‐36.72, ‐30.23] |
| 2 Health‐related quality of life Show forest plot | 2 | 568 | Std. Mean Difference (IV, Random, 95% CI) | ‐0.38 [‐0.55, ‐0.21] |
| Analysis 1.2 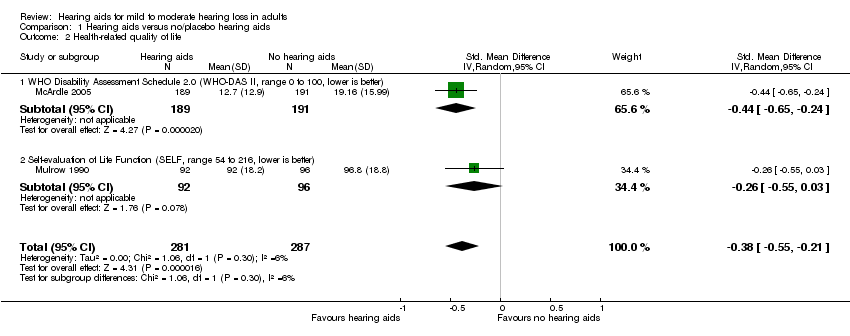 Comparison 1 Hearing aids versus no/placebo hearing aids, Outcome 2 Health‐related quality of life. | ||||
| 2.1 WHO Disability Assessment Schedule 2.0 (WHO‐DAS II, range 0 to 100, lower is better) | 1 | 380 | Std. Mean Difference (IV, Random, 95% CI) | ‐0.44 [‐0.65, ‐0.24] |
| 2.2 Self‐evaluation of Life Function (SELF, range 54 to 216, lower is better) | 1 | 188 | Std. Mean Difference (IV, Random, 95% CI) | ‐0.26 [‐0.55, 0.03] |
| 3 Listening ability Show forest plot | 2 | 534 | Std. Mean Difference (IV, Random, 95% CI) | ‐1.88 [‐3.24, ‐0.52] |
| Analysis 1.3  Comparison 1 Hearing aids versus no/placebo hearing aids, Outcome 3 Listening ability. | ||||
| 3.1 Profile of Hearing Aid Performance (PHAP, range 0 to 1, lower is better) | 1 | 154 | Std. Mean Difference (IV, Random, 95% CI) | ‐1.18 [‐1.54, ‐0.81] |
| 3.2 Abbreviated Profile of Hearing Aid Benefit (APHAB, range 0 to 100, lower is better) | 1 | 380 | Std. Mean Difference (IV, Random, 95% CI) | ‐2.57 [‐2.84, ‐2.30] |


'Risk of bias' summary: review authors' judgements about each risk of bias item for each included study.

'Risk of bias' graph: review authors' judgements about each risk of bias item presented as percentages across all included studies.

Forest plot of comparison: 1 Hearing aids versus no/placebo hearing aids, outcome: 1.1 Hearing‐specific health‐related quality of life. Assessed using Hearing Handicap Inventory for the Elderly (HHIE) in all studies.

Forest plot of comparison: 1 Hearing aids versus no/placebo hearing aids, outcome: 1.2 Health‐related quality of life.

Forest plot of comparison: 1 Hearing aids versus no/placebo hearing aids, outcome: 1.3 Listening ability.
Comparison 1 Hearing aids versus no/placebo hearing aids, Outcome 1 Hearing‐specific health‐related quality of life.
Comparison 1 Hearing aids versus no/placebo hearing aids, Outcome 2 Health‐related quality of life.
Comparison 1 Hearing aids versus no/placebo hearing aids, Outcome 3 Listening ability.
| Hearing aids versus no hearing aids for mild to moderate hearing loss in adults | |||||
| Patient or population: adults with mild to moderate hearing loss | |||||
| Outcomes No. of participants | Anticipated absolute effects (95% CI) | Quality | What happens* | ||
| Without hearing aids | With hearing aids | Difference | |||
| Hearing‐specific HRQoL assessed with: HHIE (range 0 to 100) Follow‐up: range 6 to 16 weeks No. of participants: 722 (3 RCTs) | The mean hearing‐specific HRQoL score was 39 | — | Mean 26 lower (42 to 11 lower) | ⊕⊕⊕⊝ | Lower score indicates better hearing‐specific HRQoL. The mean difference corresponds to a large effect size (SMD ‐1.38, 95% CI ‐2.02 to ‐0.75) favouring hearing aids. |
| Health‐related QoL assessed with: WHO‐DAS II (range 0 to 100) and the SELF (range 54 to 216) Follow‐up: range 2 months to 16 weeks No. of participants: 568 (2 RCTs) | — | — | SMD 0.38 lower (0.55 lower to 0.21 lower) | ⊕⊕⊕⊝ | Lower score indicates better HRQoL. The SMD corresponds to a small effect size favouring hearing aids, which is equivalent to a 6‐point decrease (9‐ to 3‐point decrease) on the 0 to 100 scale of the WHO‐DAS II5. |
| Listening ability assessed with: PHAP (range 0 to 1) and APHAB (range 0 to 100) Follow‐up: 6 weeks to 2 months No. of participants: 534 (2 RCTs) | — | — | SMD 1.88 lower (3.24 lower to 0.52 lower) | ⊕⊕⊕⊝ | Lower score indicates improved listening ability. The SMD corresponds to a large effect size favouring hearing aids, which is equivalent to a 29‐point decrease (50‐ to 8‐point decrease) on the 0 to 100 scale of the APHAB6. |
| Adverse effect ‐ pain No. of participants: 48 (1 RCT) | Adverse effects related to pain were measured in 1 study: none were reported. | ⊕⊝⊝⊝ VERY LOW7 | There was too little information to estimate the risk of pain. | ||
| Adverse effect ‐ noise‐induced hearing loss No. of participants: 48 (1 RCT) | Adverse effects related to noise‐induced hearing loss were measured in 1 study: none were reported. | ⊕⊝⊝⊝ VERY LOW7 | There was too little information to estimate the risk of noise‐induced hearing loss. | ||
| *The equivalent change in the intervention group (and its 95% confidence interval) is based on the standard deviation in the comparison group from a representative study (see footnotes for each outcome) and the relative effect of the intervention (and its 95% CI). | |||||
| GRADE Working Group grades of evidence | |||||
| 1Quality of evidence downgraded by one level because all studies have either a rating of unclear and/or high risk bias in at least one of these domains: selection bias, performance and/or detection bias. | |||||
| Outcome or subgroup title | No. of studies | No. of participants | Statistical method | Effect size |
| 1 Hearing‐specific health‐related quality of life Show forest plot | 3 | 722 | Mean Difference (IV, Random, 95% CI) | ‐26.47 [‐42.16, ‐10.77] |
| 1.1 Subgroup A (community setting, male‐female balance, behind‐the‐ear hearing aids, placebo control) | 1 | 154 | Mean Difference (IV, Random, 95% CI) | ‐10.54 [‐15.26, ‐5.82] |
| 1.2 Subgroup B (Veterans Association setting, mostly male, in‐the‐ear hearing aids, waiting list control) | 2 | 568 | Mean Difference (IV, Random, 95% CI) | ‐33.48 [‐36.72, ‐30.23] |
| 2 Health‐related quality of life Show forest plot | 2 | 568 | Std. Mean Difference (IV, Random, 95% CI) | ‐0.38 [‐0.55, ‐0.21] |
| 2.1 WHO Disability Assessment Schedule 2.0 (WHO‐DAS II, range 0 to 100, lower is better) | 1 | 380 | Std. Mean Difference (IV, Random, 95% CI) | ‐0.44 [‐0.65, ‐0.24] |
| 2.2 Self‐evaluation of Life Function (SELF, range 54 to 216, lower is better) | 1 | 188 | Std. Mean Difference (IV, Random, 95% CI) | ‐0.26 [‐0.55, 0.03] |
| 3 Listening ability Show forest plot | 2 | 534 | Std. Mean Difference (IV, Random, 95% CI) | ‐1.88 [‐3.24, ‐0.52] |
| 3.1 Profile of Hearing Aid Performance (PHAP, range 0 to 1, lower is better) | 1 | 154 | Std. Mean Difference (IV, Random, 95% CI) | ‐1.18 [‐1.54, ‐0.81] |
| 3.2 Abbreviated Profile of Hearing Aid Benefit (APHAB, range 0 to 100, lower is better) | 1 | 380 | Std. Mean Difference (IV, Random, 95% CI) | ‐2.57 [‐2.84, ‐2.30] |