Systemic treatments for metastatic cutaneous melanoma
Information
- DOI:
- https://doi.org/10.1002/14651858.CD011123.pub2Copy DOI

- Database:
-
- Cochrane Database of Systematic Reviews
- Version published:
-
- 06 February 2018see what's new
- Type:
-
- Intervention
- Stage:
-
- Review
- Cochrane Editorial Group:
-
Cochrane Skin Group
- Copyright:
-
- Copyright © 2018 The Cochrane Collaboration. Published by John Wiley & Sons, Ltd.
Article metrics
Altmetric:
Cited by:
Authors
Contributions of authors
Simone Mocellin was the review contact person.
Sandro Pasquali and SImone Mocellin co‐ordinated contributions from co‐authors and wrote the final draft of the review.
Sandro Pasquali, Andreas V Hadjinicolaou and SImone Mocellin screened studies against eligibility criteria.
Sandro Pasquali obtained data on ongoing and unpublished studies.
Sandro Pasquali, Andreas V Hadjinicolaou and SImone Mocellin and appraised study quality.
Sandro Pasquali, Andreas V Hadjinicolaou and SImone Mocellin extracted data and sought additional information from trial authors.
Sandro Pasquali and Simone Mocellin entered data into RevMan.
Sandro Pasquali and Simone Mocellin analysed and interpreted data.
Sandro Pasquali and Simone Mocellin worked on the methods section.
Vanna Chiarion Sileni and Carlo Riccardo Rossi contributed to the writing of the review and critical revision.
Sandro Pasquali and Simone Mocellin drafted the clinical sections of the Background and responded to the clinical comments of the referees.
Sandro Pasquali and Simone Mocellin responded to methodology and statistics comments from external peer referees.
Simone Mocellin is the guarantor of the update.
Sources of support
Internal sources
-
University of Padova, Italy
External sources
-
The National Institute for Health Research (NIHR), UK
The NIHR, UK, is the largest single funder of the Cochrane Skin Group.
Declarations of interest
Sandro Pasquali: nothing to declare.
Andreas V Hadjinicolaou: nothing to declare.
Vanna Chiarion Sileni: nothing to declare.
Carlo Riccardo Rossi: nothing to declare.
Simone Mocellin: nothing to declare.
Acknowledgements
We thank Cochrane Skin, and in particular Professor Hywel Williams, Miss Laura Prescott, and Dr Finola Delamere for their assistance.
The authors also thank Dr Mauro Apostolico for his help in retrieving articles and Dr Alessandra Costa for her assistance with uploading articles into RevMan.
The Cochrane Skin editorial base wishes to thank Bob Boyle, Cochrane Dermatology Editor for this review; Ben Carter, Statistical Editor; Ching‐Chi Chi, Methods Editor; the clinical referees, Laurence Le Cleach and Emilie Sbidian; the consumer referee, Kathie Godfrey; and Ann Jones, who copy‐edited the review.
Disclaimer
This project was supported by the National Institute for Health Research, via Cochrane Infrastructure funding to the Cochrane Skin Group. The views and opinions expressed therein are those of the authors and do not necessarily reflect those of the Systematic Reviews Programme, NIHR, NHS or the Department of Health. This project was supported by the Complex Reviews Support Unit, also funded by the National Institute for Health Research (project number 14/178/29).
Version history
| Published | Title | Stage | Authors | Version |
| 2018 Feb 06 | Systemic treatments for metastatic cutaneous melanoma | Review | Sandro Pasquali, Andreas V Hadjinicolaou, Vanna Chiarion Sileni, Carlo Riccardo Rossi, Simone Mocellin | |
| 2014 May 29 | Systemic treatments for metastatic cutaneous melanoma | Protocol | Sandro Pasquali, Richard Kefford, Vanna Chiarion Sileni, Donato Nitti, Carlo Riccardo Rossi, Pierluigi Pilati, Simone Mocellin | |
Differences between protocol and review
Network meta‐analysis
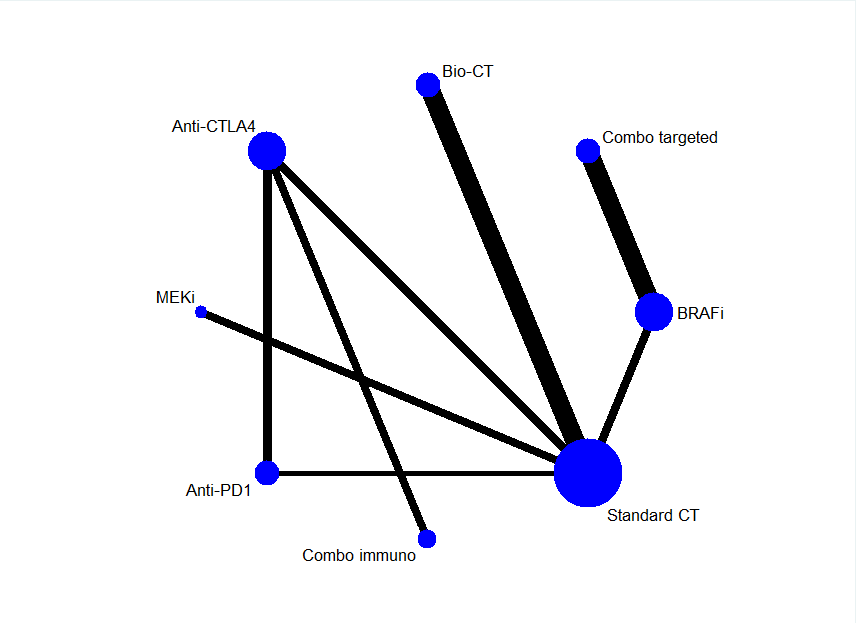
Given that direct comparisons between key therapies were unavailable (e.g. immune checkpoint inhibitors versus small‐molecule targeted drugs), we conducted a network meta‐analysis to compute estimates of indirect comparisons and to generate treatment rankings (Cipriani 2013; Mills 2013).
Study selection
We used the following criteria to assess randomised controlled trials (RCTs) for inclusion:
-
studies reporting on the outcomes of interest, that is, progression‐free survival (as an efficacy outcome) and severe toxicity (as a harm outcome); and
-
studies reporting on treatments for which high quality evidence of efficacy was available from direct comparisons and for which interventions are approved for routine use in clinical practice.
Further details on outcomes and treatments included in the network meta‐analysis are reported in the Effects of interventions section (see Network meta‐analysis findings).
We chose to include phase III and earlier phase studies because early phase trials were more likely to report on tumour response (which was a review secondary outcomes). Furthermore, early phase trials sometimes also describe survival findings (which was a review primary outcome). However, phase II trials are not designed to detect survival differences but rather tumour response differences.
We included trials with mixed disease stages if outcomes for metastatic disease were reported separately.
Evidence grading
We used the GRADE system adapted for network meta‐analysis to assess evidence quality according to four levels: high‐, moderate‐, low‐, and very low‐quality (Salanti 2014).
Quality was downgraded by one level (serious concern) or two levels (very serious concern) for study limitations (risk of bias), evidence for publication bias (assessed by inspecting a funnel plot dedicated to network meta‐analysis (Chaimani 2013)), indirectness (indirect population, intervention, control, outcomes; lack of transitivity assumption), inconsistency (between‐study statistical heterogeneity, as suggested by network meta‐analysis estimate of prediction interval crossing the null value), and imprecision (as suggested by wide confidence intervals estimated by network meta‐analysis).
Statistical analysis
Review primary outcomes were progression‐free survival and high‐grade toxicity. The outcome measure for survival data was hazard ratio (HR) and 95% confidence interval (CI). The outcome measure for toxicity was relative risk (RR) and 95% CI.
Random‐effects network meta‐analysis was carried out within a frequentist setting (Hong 2013). A common heterogeneity parameter (Tau²) was assumed across all comparisons, allowing the inclusion of comparisons based on a single RCT. Summary effects are presented with 95% CIs and predictive interval. Predictive intervals were calculated using between‐study variance (Tau²) and represents the interval where the results of future studies are expected to be, thus providing information on the magnitude of heterogeneity. They are calculated as μ ± (tαdf) x √ (τ² + SE(μ)², where tαdf is the 100 x (1 ‐ α/2)% percentile of the t‐distribution with df degrees of freedom and μ is the meta‐analysis effect estimate (Chaimani 2013).
The key assumption of network meta‐analysis is transitivity (Donegan 2013). If information about comparisons A versus B and A versus C is available, then network meta‐analysis can derive information regarding the BC comparison based on the transitivity equation (A versus B – A versus C = B versus C). Transitivity holds assuming that:
-
the common treatment, in this case conventional chemotherapy (used to compare different drug schedules indirectly), was similar when it appeared in different trials;
-
pair‐wise comparisons did not differ substantially with respect to the distribution of effect modifiers; and
-
in principle, participants could be randomised to any of the treatments compared in the network.
Lack of transitivity can manifest as inconsistency between direct and indirect estimates ('loop inconsistency') or between estimates deriving from different study designs ('design inconsistency', which can occur when the relative effectiveness of treatment A versus B is different when estimated in studies with different designs, such as A versus B and A versus B versus C). We investigated inconsistency using a design‐by‐treatment interaction model, which addresses both loop and design inconsistency (Higgins 2012; White 2012).
Inconsistencies of single loops can be assessed with an inconsistency plot, where a ratio of ratio can be calculated as the ratio between the relative risk estimated by the conventional pair‐wise meta‐analysis and that estimated by the network meta‐analysis. A ratio of ratio value close to the unit indicates that the results of the two techniques are in agreement; in general, values greater than 2 suggest high inconsistency (Chaimani 2013).
Network meta‐analysis also provides a ranking probability curve of each treatment (rankogram) by calculating the probability of each treatment to achieve the best rank amongst all treatments. The surface under the cumulative ranking (SUCRA) line for each treatment, which equals one when a treatment is certain to be the best and zero when a treatment is certain to be the worst, was used for treatment ranking (Chaimani 2013; Salanti 2011). We also generated a bivariate ranking plot including both efficacy (progression‐free survival) and acceptability (the inverse of toxicity: low toxicity rates are associated with high SUCRA values): an ideal treatment should be characterised by both high efficacy and high acceptability so should appear in the right upper corner of the ranking plot.
A dedicated funnel plot (comparison‐adjusted funnel plot) can be used to assess small‐study effects (which includes publication bias) (Chaimani 2013). This plot takes into consideration that included studies estimate effects for different comparisons: therefore, there cannot be a single reference line against which symmetry can be assessed. In the absence of small‐study effect the comparison‐adjusted funnel plot should be symmetrical around the zero line.
All statistical tests were two‐sided. Statistical analysis and graph generation was performed with Stata 11.2 (Stata 2017).
Notes
Small amendment to wording of background in PLS after a query via Cochrane Library feedback in consulation with lead author.
Keywords
MeSH
Medical Subject Headings (MeSH) Keywords
- Angiogenesis Inhibitors [adverse effects, therapeutic use];
- Antibodies, Monoclonal [adverse effects, therapeutic use];
- Antineoplastic Agents [adverse effects, therapeutic use];
- Brain Neoplasms [secondary];
- CTLA-4 Antigen [antagonists & inhibitors];
- Disease-Free Survival;
- Drug Therapy, Combination [adverse effects];
- Immunotherapy [methods];
- Interferon-alpha [therapeutic use];
- Interleukin-2 [therapeutic use];
- Melanoma [mortality, secondary, *therapy];
- Programmed Cell Death 1 Receptor [antagonists & inhibitors];
- Proto-Oncogene Proteins B-raf [antagonists & inhibitors];
- Randomized Controlled Trials as Topic;
- Skin Neoplasms [mortality, *therapy];
Medical Subject Headings Check Words
Female; Humans; Male; Middle Aged;
PICOs

RAS‐RAF‐MEK‐ERK pathway. Copyright © 2018 Claire Gorry: reproduced with permission.


Risk of bias graph: review authors' judgements about each risk of bias item presented as percentages across all included studies.

Risk of bias summary: review authors' judgements about each risk of bias item for each included study.
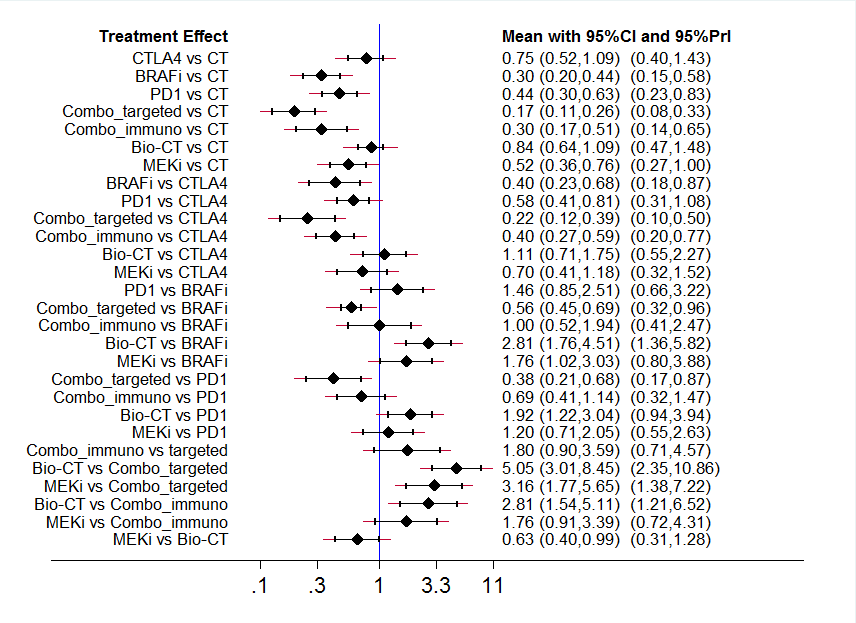
Interval plot: network meta‐analysis results for progression‐free survival. The network included eight treatment modalities. The effect measure is reported as hazard ratio (HR). CI: confidence interval; PrI: predictive interval.
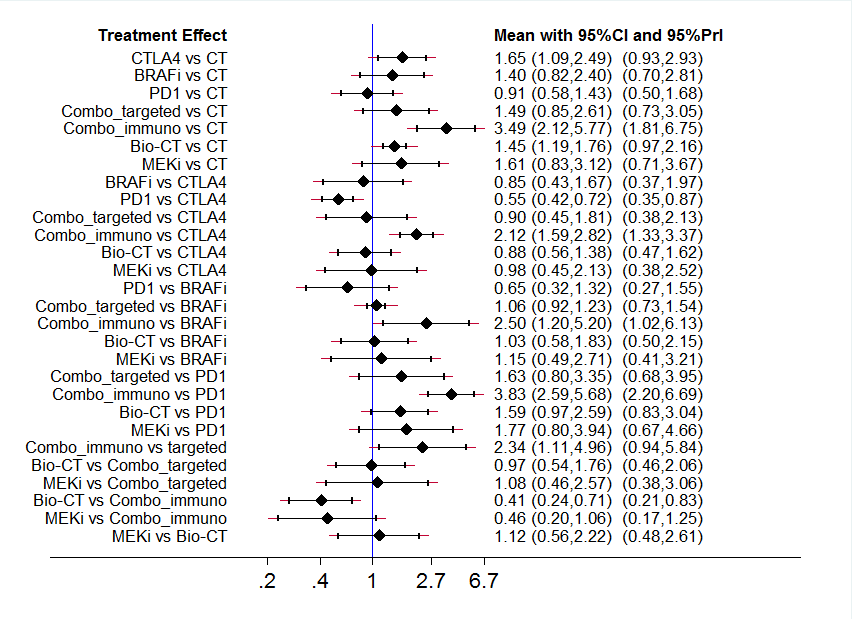
Interval plot: network meta‐analysis results for high grade toxicity. The network included eight treatment modalities. The effect measure is reported as relative risk (RR). CI: confidence interval; PrI: predictive interval.

Ranking plot. Ranking plot representing simultaneously the efficacy (progression‐free survival) on the X axis and the acceptability (the inverse of toxicity) on the Y axis. The network included eight treatments for patients with metastatic melanoma. Optimal treatment should be characterised by both high efficacy and acceptability and should be in the right upper corner of this graph.

Comparison adjusted funnel plot for network meta‐analysis of progression‐free survival

Comparison 1: Polychemotherapy versus single agent chemotherapy, Outcome 1: Overall survival

Comparison 1: Polychemotherapy versus single agent chemotherapy, Outcome 2: Progression‐free survival

Comparison 1: Polychemotherapy versus single agent chemotherapy, Outcome 3: Tumour response

Comparison 1: Polychemotherapy versus single agent chemotherapy, Outcome 4: Toxicity (≥ G3)

Comparison 2: Chemotherapy ± tamoxifen, Outcome 1: Overall survival

Comparison 2: Chemotherapy ± tamoxifen, Outcome 2: Progression‐free survival

Comparison 2: Chemotherapy ± tamoxifen, Outcome 3: Tumour response

Comparison 2: Chemotherapy ± tamoxifen, Outcome 4: Toxicity (≥ G3)

Comparison 3: Temozolomide versus dacarbazine, Outcome 1: Overall survival

Comparison 3: Temozolomide versus dacarbazine, Outcome 2: Progression‐free survival

Comparison 3: Temozolomide versus dacarbazine, Outcome 3: Tumour response

Comparison 3: Temozolomide versus dacarbazine, Outcome 4: Toxicity (≥ G3)

Comparison 4: Chemotherapy ± interferon‐alpha, Outcome 1: Overall survival

Comparison 4: Chemotherapy ± interferon‐alpha, Outcome 2: Progression‐free survival

Comparison 4: Chemotherapy ± interferon‐alpha, Outcome 3: Tumour response

Comparison 4: Chemotherapy ± interferon‐alpha, Outcome 4: Toxicity (≥ G3)

Comparison 5: Chemotherapy ± interleukin‐2, Outcome 1: Overall survival

Comparison 5: Chemotherapy ± interleukin‐2, Outcome 2: Progression‐free survival

Comparison 5: Chemotherapy ± interleukin‐2, Outcome 3: Tumour response

Comparison 6: Chemotherapy ± interferon‐alpha and interleukin‐2, Outcome 1: Overall survival

Comparison 6: Chemotherapy ± interferon‐alpha and interleukin‐2, Outcome 2: Progression‐free survival

Comparison 6: Chemotherapy ± interferon‐alpha and interleukin‐2, Outcome 3: Tumour response

Comparison 6: Chemotherapy ± interferon‐alpha and interleukin‐2, Outcome 4: Toxicity (≥ G3)

Comparison 7: Chemotherapy ± interferon‐alpha and interleukin‐2 (first line), Outcome 1: Overall survival

Comparison 7: Chemotherapy ± interferon‐alpha and interleukin‐2 (first line), Outcome 2: Progression‐free survival

Comparison 7: Chemotherapy ± interferon‐alpha and interleukin‐2 (first line), Outcome 3: Tumour response

Comparison 7: Chemotherapy ± interferon‐alpha and interleukin‐2 (first line), Outcome 4: Toxicity (≥ G3)

Comparison 8: Chemotherapy ± Bacille Calmette‐Guérin (BCG), Outcome 1: Overall survival

Comparison 8: Chemotherapy ± Bacille Calmette‐Guérin (BCG), Outcome 2: Tumour response

Comparison 9: Chemotherapy ± Corynebacterium parvum, Outcome 1: Overall survival

Comparison 9: Chemotherapy ± Corynebacterium parvum, Outcome 2: Tumour response

Comparison 10: Anti‐CTLA4 monoclonal antibodies (first line), Outcome 1: Overall survival

Comparison 10: Anti‐CTLA4 monoclonal antibodies (first line), Outcome 2: Progression‐free survival

Comparison 10: Anti‐CTLA4 monoclonal antibodies (first line), Outcome 3: Tumour response

Comparison 10: Anti‐CTLA4 monoclonal antibodies (first line), Outcome 4: Toxicity (≥ G3)

Comparison 11: Anti‐CTLA4 monoclonal antibodies ± other immunostimulating agents (second line), Outcome 1: Overall survival

Comparison 11: Anti‐CTLA4 monoclonal antibodies ± other immunostimulating agents (second line), Outcome 2: Progression‐free survival

Comparison 11: Anti‐CTLA4 monoclonal antibodies ± other immunostimulating agents (second line), Outcome 3: Tumour response

Comparison 11: Anti‐CTLA4 monoclonal antibodies ± other immunostimulating agents (second line), Outcome 4: Toxicity (≥ G3)

Comparison 12: Anti‐PD1 monoclonal antibodies versus chemotherapy, Outcome 1: Overall survival

Comparison 12: Anti‐PD1 monoclonal antibodies versus chemotherapy, Outcome 2: Progression‐free survival

Comparison 12: Anti‐PD1 monoclonal antibodies versus chemotherapy, Outcome 3: Tumour response

Comparison 12: Anti‐PD1 monoclonal antibodies versus chemotherapy, Outcome 4: Toxicity (≥ G3)

Comparison 13: Anti‐PD1 monoclonal antibodies versus anti‐CTLA4 monoclonal antibodies, Outcome 1: Overall survival

Comparison 13: Anti‐PD1 monoclonal antibodies versus anti‐CTLA4 monoclonal antibodies, Outcome 2: Progression‐free survival

Comparison 13: Anti‐PD1 monoclonal antibodies versus anti‐CTLA4 monoclonal antibodies, Outcome 3: Tumour response

Comparison 13: Anti‐PD1 monoclonal antibodies versus anti‐CTLA4 monoclonal antibodies, Outcome 4: Toxicity (≥ G3)

Comparison 14: Anti‐PD1 monoclonal antibodies and anti‐CTLA4 monoclonal antibodies versus anti‐CTLA4 monoclonal antibodies alone, Outcome 1: Progression‐free survival

Comparison 14: Anti‐PD1 monoclonal antibodies and anti‐CTLA4 monoclonal antibodies versus anti‐CTLA4 monoclonal antibodies alone, Outcome 2: Tumour response

Comparison 14: Anti‐PD1 monoclonal antibodies and anti‐CTLA4 monoclonal antibodies versus anti‐CTLA4 monoclonal antibodies alone, Outcome 3: Toxicity (≥ G3)

Comparison 15: Chemotherapy ± sorafenib, Outcome 1: Overall survival

Comparison 15: Chemotherapy ± sorafenib, Outcome 2: Progression‐free survival

Comparison 15: Chemotherapy ± sorafenib, Outcome 3: Tumour response

Comparison 15: Chemotherapy ± sorafenib, Outcome 4: Toxicity (≥ G3)

Comparison 16: Chemotherapy ± elesclomol, Outcome 1: Overall survival

Comparison 16: Chemotherapy ± elesclomol, Outcome 2: Progression‐free survival

Comparison 16: Chemotherapy ± elesclomol, Outcome 3: Tumour response

Comparison 16: Chemotherapy ± elesclomol, Outcome 4: Toxicity (≥ G3)

Comparison 17: Chemotherapy ± anti‐angiogenic drugs, Outcome 1: Overall survival

Comparison 17: Chemotherapy ± anti‐angiogenic drugs, Outcome 2: Progression‐free survival

Comparison 17: Chemotherapy ± anti‐angiogenic drugs, Outcome 3: Tumour response

Comparison 17: Chemotherapy ± anti‐angiogenic drugs, Outcome 4: Toxicity (≥ G3)

Comparison 18: Single agent BRAF inhibitor, Outcome 1: Overall survival

Comparison 18: Single agent BRAF inhibitor, Outcome 2: Progression‐free survival

Comparison 18: Single agent BRAF inhibitor, Outcome 3: Tumour response

Comparison 18: Single agent BRAF inhibitor, Outcome 4: Toxicity (≥ G3)

Comparison 19: Single agent MEK inhibitor, Outcome 1: Overall survival

Comparison 19: Single agent MEK inhibitor, Outcome 2: Progression‐free survival

Comparison 19: Single agent MEK inhibitor, Outcome 3: Tumour response

Comparison 19: Single agent MEK inhibitor, Outcome 4: Toxicity (≥ G3)

Comparison 20: Combination of BRAF and MEK inhibitors versus single agent BRAF inhibitor, Outcome 1: Overall survival

Comparison 20: Combination of BRAF and MEK inhibitors versus single agent BRAF inhibitor, Outcome 2: Progression‐free survival

Comparison 20: Combination of BRAF and MEK inhibitors versus single agent BRAF inhibitor, Outcome 3: Tumour response

Comparison 20: Combination of BRAF and MEK inhibitors versus single agent BRAF inhibitor, Outcome 4: Toxicity (≥ G3)

Comparison 21: Immunostimulating agents, Outcome 1: Overall survival

Comparison 21: Immunostimulating agents, Outcome 2: Progression‐free survival

Comparison 21: Immunostimulating agents, Outcome 3: Tumour response

Comparison 21: Immunostimulating agents, Outcome 4: Toxicity (≥ G3)
| Anti‐PD1 monoclonal antibodies compared with chemotherapy for the treatment of metastatic melanoma | ||||||
| Patient or population: people with cutaneous melanoma Settings: hospital (metastatic disease) Intervention: anti‐PD1 monoclonal antibodies Comparison: chemotherapy | ||||||
| Outcomes | Illustrative comparative risks* (95% CI) | Relative effect | No of Participants | Quality of the evidence | Comments | |
|---|---|---|---|---|---|---|
| Assumed risk | Corresponding risk | |||||
| Chemotherapy | Anti‐PD1 | |||||
| Overall survival† | 600 per 1000† | 320 per 1000† | HR 0.42 (0.37 to 0.48) | N = 418 | ⊕⊕⊕⊕ | ‐ |
| Progression‐free survival† | 850 per 1000† | 610 per 1000† | HR 0.49 (0.39 to 0.61) | N = 957 | ⊕⊕⊕⊝ | ‐ |
| Tumour response | 81 per 1000 | 277 per 1000 | RR 3.42 (2.38 to 4.92) | N = 1367 | ⊕⊕⊕⊕ | ‐ |
| Toxicity (≥ G3) | 300 per 1000 | 165 per 1000 | RR0.55 (0.31 to 0.97) | N = 1360 | ⊕⊕⊝⊝ | ‐ |
| * The basis for the assumed risk (e.g. the median control group risk across studies) is provided in footnotes. The corresponding risk (and its 95% confidence interval) is based on the assumed risk in the comparison group and the relative effect of the intervention (and its 95% CI). † Numbers presented refer to event rates (i.e. death rates and progression rates). CI: confidence interval; HR: hazard ratio | ||||||
| GRADE Working Group grades of evidence | ||||||
| Assumed risk in the control population: 1‐year overall survival rate = 40%. Assumed risk in the control population: 1‐year progression‐free survival rate = 15%. Assumed risk in the control population: tumour response rate across control arms of included trials. Assumed risk in the control population: toxicity rate across control arms of included trials. a Not downgraded: high‐quality evidence. b Downgraded by one level: inconsistency (between‐study heterogeneity). c Downgraded by two levels: inconsistency (between‐study heterogeneity) and imprecision (CI includes both a meaningful benefit (relative risk reduction > 25%) and a small/null benefit (relative risk reduction < 10%)). | ||||||
| Anti‐PD1 monoclonal antibodies compared with anti‐CTLA4 monoclonal antibodies for the treatment of metastatic melanoma | ||||||
| Patient or population: people with cutaneous melanoma Settings: hospital (metastatic disease) Intervention: anti‐PD1 monoclonal antibodies Comparison: anti‐CTLA4 monoclonal antibodies | ||||||
| Outcomes | Illustrative comparative risks* (95% CI) | Relative effect | No of Participants | Quality of the evidence | Comments | |
|---|---|---|---|---|---|---|
| Assumed risk | Corresponding risk | |||||
| Anti‐CTLA4 | Anti‐PD1 | |||||
| Overall survival† | 600 per 1000† | 438 per 1000† | HR 0.63 (0.60 to 0.66) | N = 764 | ⊕⊕⊕⊕ | ‐ |
| Progression‐free survival† | 850 per 1000† | 641 per 1000† | HR 0.54 (0.50 to 0.60) | n = 1465 | ⊕⊕⊕⊕ | ‐ |
| Tumour response | 157 per 1000 | 388 per 1000 | RR 2.47 (2.01 to 3.04) | N = 1465 | ⊕⊕⊕⊕ | ‐ |
| Toxicity (≥ G3) | 398 per 1000 | 278 per 1000 | RR 0.70 (0.54 to 0.91) | N = 1465 | ⊕⊕⊝⊝ | ‐ |
| *The basis for the assumed risk (e.g. the median control group risk across studies) is provided in footnotes. The corresponding risk (and its 95% confidence interval) is based on the assumed risk in the comparison group and the relative effect of the intervention (and its 95% CI). † Numbers presented refer to event rates (i.e. death rates and progression rates). CI: confidence interval; RR: risk ratio; HR: hazard ratio. | ||||||
| GRADE Working Group grades of evidence | ||||||
| Assumed risk in the control population: 1‐year overall survival rate = 40%. Assumed risk in the control population: 1‐year progression‐free survival rate = 15%. Assumed risk in the control population: tumour response rate across control arms of included trials. Assumed risk in the control population: toxicity rate across control arms of included trials. a Not downgraded: high‐quality evidence. b Downgraded by two levels: inconsistency (between‐study heterogeneity) and imprecision (CI includes both a meaningful benefit (relative risk reduction > 25%) and a small/null benefit (relative risk reduction < 10%). | ||||||
| Anti‐CTLA4 monoclonal antibodies plus chemotherapy compared with chemotherapy for the treatment of metastatic melanoma | ||||||
| Patient or population: people with cutaneous melanoma Settings: hospital (metastatic disease) Intervention: anti‐CTLA4 monoclonal antibodies plus chemotherapy (combo) Comparison: chemotherapy | ||||||
| Outcomes | Illustrative comparative risks* (95% CI) | Relative Effect | No of Participants | Quality of the evidence | Comments | |
|---|---|---|---|---|---|---|
| Assumed risk | Corresponding risk | |||||
| Chemotherapy | Combo | |||||
| Overall survival† | 600 per 1000† | 524 per 1000† | HR 0.81 (0.65 to 1.01) | N = 1157 | ⊕⊕⊝⊝ | ‐ |
| Progression‐free survival† | 850 per 1000† | 763 per 1000† | HR 0.76 (0.63 to 0.92) | N = 502 | ⊕⊕⊕⊝ | ‐ |
| Tumour response | 100 per 1000 | 128 per 1000 | RR 1.28 (0.92 to 1.77) | N = 1157 | ⊕⊕⊕⊝ | ‐ |
| Toxicity (≥ G3) | 352 per 1000 | 595 per 1000 | RR 1.69 (1.19 to 2.42) | N = 1142 | ⊕⊕⊕⊝ | ‐ |
| * The basis for the assumed risk (e.g. the median control group risk across studies) is provided in footnotes. The corresponding risk (and its 95% confidence interval) is based on the assumed risk in the comparison group and the relative effect of the intervention (and its 95% CI). † Numbers presented refer to event rates (i.e. death rates and progression rates). CI: confidence interval; HR: hazard ratio. | ||||||
| GRADE Working Group grades of evidence | ||||||
| Assumed risk in the control population: 1‐year overall survival rate = 40%. Assumed risk in the control population: 1‐year progression‐free survival rate = 15%. Assumed risk in the control population: tumour response rate across control arms of included trials. Assumed risk in the control population: toxicity rate across control arms of included trials. a Downgraded by two levels: inconsistency (between‐study heterogeneity) and imprecision (CI includes both a meaningful benefit (relative risk reduction > 25%) and a harmful effect). b Downgraded by one level: imprecision (CI includes both a meaningful benefit (relative risk reduction > 25%) and a small/null benefit (relative risk reduction < 10%)). c Downgraded by one level: imprecision (CI includes both a meaningful benefit (relative risk increase > 25%) and a harmful effect). d Downgraded by one level: inconsistency (between‐study heterogeneity). | ||||||
| Anti‐CTLA4 plus anti‐PD1 monoclonal antibodies compared with anti‐CTLA4 monoclonal antibodies for the treatment of metastatic melanoma | ||||||
| Patient or population: people with cutaneous melanoma Settings: hospital (metastatic disease) Intervention: Anti‐CTLA4 plus Anti‐PD1 monoclonal antibodies (combo) Comparison: Anti‐CTLA4 monoclonal antibodies | ||||||
| Outcomes | Illustrative comparative risks* (95% CI) | Relative effect | No of Participants | Quality of the evidence | Comments | |
|---|---|---|---|---|---|---|
| Assumed risk | Corresponding risk | |||||
| Anti‐CTLA4 | Combo | |||||
| Overall survival | See comment | See comment | See comment | See comment | See comment | Outcome not measured |
| Progression‐free survival† | 750 per 1000† | 425 per 1000† | HR 0.40 (0.35 to 0.46) | N = 738 | ⊕⊕⊕⊕ | ‐ |
| Tumour response | 182 per 1000 | 636 per 1000 | RR 3.50 (2.07 to 5.92) | N = 738 | ⊕⊕⊕⊕ | ‐ |
| Toxicity (≥ G3) | 521 per 1000 | 818 per 1000 | RR 1.57 (0.85 to 2.92) | N = 764 | ⊕⊕⊝⊝ | ‐ |
| * The basis for the assumed risk (e.g. the median control group risk across studies) is provided in footnotes. The corresponding risk (and its 95% confidence interval) is based on the assumed risk in the comparison group and the relative effect of the intervention (and its 95% CI). † Numbers presented refer to event rates (i.e. progression rates). CI: confidence interval | ||||||
| GRADE Working Group grades of evidence | ||||||
| Assumed risk in the control population: 1‐year progression‐free survival rate = 25%. Assumed risk in the control population: tumour response rate across control arms of included trials. Assumed risk in the control population: toxicity rate across control arms of included trials. a Not downgraded: high‐quality evidence. b Downgraded by two levels: inconsistency (between‐study heterogeneity) and imprecision (CI includes both a meaningful harm (relative risk increase > 25%) and a beneficial effect) | ||||||
| BRAF inhibitors compared with chemotherapy for the treatment of metastatic melanoma | ||||||
| Patient or population: people with cutaneous melanoma Settings: hospital (metastatic disease) Intervention: BRAF inhibitors Comparison: chemotherapy | ||||||
| Outcomes | Illustrative comparative risks* (95% CI) | Relative effect | No of Participants | Quality of the evidence | Comments | |
|---|---|---|---|---|---|---|
| Assumed risk | Corresponding risk | |||||
| Chemotherapy | BRAF inhibitors | |||||
| Overall survival† | 600 per 1000† | 307 per 1000† | HR 0.40 (0.28 to 0.57) | N = 925 | ⊕⊕⊕⊕ | ‐ |
| Progression‐free survival† | 850 per 1000† | 401 per 1000† | HR 0.27 (0.21 to 0.34) | N = 925 | ⊕⊕⊕⊕ | ‐ |
| Tumour response | 82 per 1000 | 556 per 1000 | RR 6.78 (4.84 to 9.49) | N = 925 | ⊕⊕⊕⊕ | ‐ |
| Toxicity (≥ G3) | 341 per 1000 | 433 per 1000 | RR 1.27 (0.48 to 3.33) | N = 408 | ⊕⊕⊝⊝ | ‐ |
| * The basis for the assumed risk (e.g. the median control group risk across studies) is provided in footnotes. The corresponding risk (and its 95% confidence interval) is based on the assumed risk in the comparison group and the relative effect of the intervention (and its 95% CI). † Numbers presented refer to event rates (i.e. death rates and progression rates). | ||||||
| GRADE Working Group grades of evidence | ||||||
| Assumed risk in the control population: 1‐year overall survival rate = 40%. Assumed risk in the control population: 1‐year progression‐free survival rate = 15%. Assumed risk in the control population: tumour response rate across control arms of included trials. Assumed risk in the control population: toxicity rate across control arms of included trials. a Not downgraded: high‐quality evidence. b Downgraded by two levels: inconsistency (between‐study heterogeneity) and imprecision (CI includes both a meaningful harm (relative risk increase > 25%) and a meaningful benefit (relative risk reduction > 25%)). | ||||||
| MEK inhibitors compared with chemotherapy for the treatment of metastatic melanoma | ||||||
| Patient or population: people with cutaneous melanoma Settings: hospital (metastatic disease) Intervention: MEK inhibitors Comparison: chemotherapy | ||||||
| Outcomes | Illustrative comparative risks* (95% CI) | Relative effect | No of Participants | Quality of the evidence | Comments | |
|---|---|---|---|---|---|---|
| Assumed risk | Corresponding risk | |||||
| Chemotherapy | MEK inhibitors | |||||
| Overall survival† | 600 per 1000† | 541 per 1000† | HR 0.85 (0.58 to 1.25) | N = 496 | ⊕⊕⊝⊝ | ‐ |
| Progression‐free survival† | 850 per 1000† | 667 per 1000† | HR 0.58 (0.42 to 0.80) | N = 496 | ⊕⊕⊕⊝ | ‐ |
| Tumour response | 138 per 1000 | 277 per 1000 | RR 2.01 (1.35 to 2.99) | N = 496 | ⊕⊕⊕⊕ | ‐ |
| Toxicity (≥ G3) | 413 per 1000 | 665 per 1000 | RR 1.61 (1.08 to 2.41) | N = 91 | ⊕⊕⊕⊝ | ‐ |
| *The basis for the assumed risk (e.g. the median control group risk across studies) is provided in footnotes. The corresponding risk (and its 95% confidence interval) is based on the assumed risk in the comparison group and the relative effect of the intervention (and its 95% CI). † Numbers presented refer to event rates (i.e. death rates and progression rates). | ||||||
| GRADE Working Group grades of evidence | ||||||
| Assumed risk in the control population: 1‐year overall survival rate = 40%. Assumed risk in the control population: 1‐year progression‐free survival rate = 15%. Assumed risk in the control population: tumour response rate across control arms of included trials. Assumed risk in the control population: toxicity rate across control arms of included trials. a Downgraded by two levels: inconsistency (between‐study heterogeneity) and imprecision (CI includes both a meaningful benefit (relative risk reduction > 25%) and a harmful effect). b Downgraded by one level: inconsistency (between‐study heterogeneity). c Not downgraded: high‐quality evidence. d Downgraded by one level: imprecision (sample size lower than optimal information size, calculated to be equal to 400 participants). | ||||||
| BRAF plus MEK inhibitors compared with BRAF inhibitors for the treatment of metastatic melanoma | ||||||
| Patient or population: people cutaneous melanoma Settings: hospital (metastatic disease) Intervention: BRAF inhibitor plus MEK inhibitor (combo) Comparison: BRAF inhibitor | ||||||
| Outcomes | Illustrative comparative risks* (95% CI) | Relative effect | No of Participants | Quality of the evidence | Comments | |
|---|---|---|---|---|---|---|
| Assumed risk | Corresponding risk | |||||
| BRAF inhibitor | Combo | |||||
| Overall survival† | 350 per 1000† | 260 per 1000† | HR 0.70 (0.59 to 0.82) | N = 1784 | ⊕⊕⊕⊕ | ‐ |
| Progression‐free survival† | 700 per 1000† | 490 per 1000† | HR 0.56 (0.44 to 0.71) | N = 1784 | ⊕⊕⊕⊝ | ‐ |
| Tumour response | 494 per 1000 | 652 per 1000 | RR 1.32 (1.20 to 1.46) | N = 1784 | ⊕⊕⊕⊕ | ‐ |
| Toxicity (≥ G3) | 495 per 1000 | 500 per 1000 | RR 1.01 (0.85 to 1.20) | N = 1774 | ⊕⊕⊕⊝ | ‐ |
| * The basis for the assumed risk (e.g. the median control group risk across studies) is provided in footnotes. The corresponding risk (and its 95% confidence interval) is based on the assumed risk in the comparison group and the relative effect of the intervention (and its 95% CI). † Numbers presented refer to event rates (i.e. death rates and progression rates). CI confidence interval; HR: hazard ratio | ||||||
| GRADE Working Group grades of evidence | ||||||
| Assumed risk in the control population: 1‐year overall survival rate = 65%. Assumed risk in the control population: 1‐year progression‐free survival rate = 30%. Assumed risk in the control population: tumour response rate across control arms of included trials. Assumed risk in the control population: toxicity rate across control arms of included trials. a Not downgraded: high‐quality evidence. b Downgraded by one level: inconsistency (between‐study heterogeneity). | ||||||
| Anti‐angiogenic drugs plus chemotherapy compared with chemotherapy for the treatment of metastatic melanoma | ||||||
| Patient or population: people with cutaneous melanoma Settings: hospital (metastatic disease) Intervention: Anti‐angiogenic drug plus chemotherapy (combo) Comparison: chemotherapy | ||||||
| Outcomes | Illustrative comparative risks* (95% CI) | Relative effect | No of Participants | Quality of the evidence | Comments | |
|---|---|---|---|---|---|---|
| Assumed risk | Corresponding risk | |||||
| Chemotherapy | Combo | |||||
| Overall survival† | 600 per 1000† | 423 per 1000† | HR 0.60 (0.45 to 0.81) | N = 324 | ⊕⊕⊕⊝ | ‐ |
| Progression‐free survival† | 850 per 1000† | 730 per 1000† | HR 0.69 (0.52 to 0.92) | N = 324 | ⊕⊕⊕⊝ | ‐ |
| Tumour response | 104 per 1000 | 178 per 1000 | RR 1.71 (0.96 to 3.03) | N = 324 | ⊕⊕⊕⊝ | ‐ |
| Toxicity (≥ G3) | 272 per 1000 | 185 per 1000 | RR 0.68 (0.09 to 5.32) | N = 324 | ⊕⊕⊝⊝ | ‐ |
| * The basis for the assumed risk (e.g. the median control group risk across studies) is provided in footnotes. The corresponding risk (and its 95% confidence interval) is based on the assumed risk in the comparison group and the relative effect of the intervention (and its 95% CI). † Numbers presented refer to event rates (i.e. death rates and progression rates). | ||||||
| GRADE Working Group grades of evidence | ||||||
| Assumed risk in the control population: 1‐year overall survival rate = 40%. Assumed risk in the control population: 1‐year progression‐free survival rate = 15%. Assumed risk in the control population: tumour response rate across control arms of included trials. Assumed risk in the control population: toxicity rate across control arms of included trials. a Downgraded by one level: imprecision (sample size lower than optimal information size, calculated to be equal to 400 participants). b Downgraded by two levels: inconsistency (between‐study heterogeneity) and imprecision (sample size lower than optimal information size, calculated to be equal to 400 participants). | ||||||
| Biochemotherapy compared with chemotherapy for the treatment of metastatic melanoma | ||||||
| Patient or population: people with cutaneous melanoma Settings: hospital (metastatic disease) Intervention: biochemotherapy (chemotherapy combined with both interferon‐alpha and interleukin‐2) Comparison: chemotherapy | ||||||
| Outcomes | Illustrative comparative risks* (95% CI) | Relative effect | No of Participants | Quality of the evidence | Comments | |
|---|---|---|---|---|---|---|
| Assumed risk | Corresponding risk | |||||
| Chemotherapy | Biochemotherapy | |||||
| Overall survival† | 600 per 1000† | 577 per 1000† | HR 0.94 (0.84 to 1.06) | N = 1317 | ⊕⊕⊕⊕ | ‐ |
| Progression‐free survival† | 850 per 1000 ° | 818 per 1000† | HR 0.90 (0.83 to 0.99) | N = 964 | ⊕⊕⊕⊕ | ‐ |
| Tumour response | 192 per 1000 | 262 per 1000 | RR 1.36 (1.12 to 1.66) | N = 770 | ⊕⊕⊕⊕ | ‐ |
| Toxicity (≥ G3) | 631 per 1000 | 852 per 1000 | RR 1.35 (1.14 to 1.61) | N = 631 | ⊕⊕⊕⊕ | ‐ |
| *The basis for the assumed risk (e.g. the median control group risk across studies) is provided in footnotes. The corresponding risk (and its 95% confidence interval) is based on the assumed risk in the comparison group and the relative effect of the intervention (and its 95% CI). † Numbers presented refer to event rates (i.e. death rates and progression rates). | ||||||
| GRADE Working Group grades of evidence | ||||||
| Assumed risk in the control population: 1‐year overall survival rate = 40%. Assumed risk in the control population: 1‐year progression‐free survival rate = 15%. Assumed risk in the control population: tumour response rate across control arms of included trials. Assumed risk in the control population: toxicity rate across control arms of included trials. a Not downgraded: high‐quality evidence. | ||||||
| Polychemotherapy compared with chemotherapy for the treatment of metastatic melanoma | ||||||
| Patient or population: people with cutaneous melanoma Settings: hospital (metastatic disease) Intervention: polychemotherapy Comparison: chemotherapy | ||||||
| Outcomes | Illustrative comparative risks* (95% CI) | Relative effect | No of Participants | Quality of the evidence | Comments | |
|---|---|---|---|---|---|---|
| Assumed risk | Corresponding risk | |||||
| Chemotherapy | Polychemotherapy | |||||
| Overall survival† | 600 per 1000† | 596 per 1000† | HR 0.99 (0.85 to 1.16) | N = 594 | ⊕⊕⊕⊕ | ‐ |
| Progression‐freesurvival† | 850 per 1000† | 869 per 1000† (822 to 907) | HR 1.07 (0.91 to 1.25) | N = 398 (n = 5) | ⊕⊕⊕⊕ | ‐ |
| Tumour response | 143 per 1000 | 182 per 1000 | RR 1.27 (1.02 to 1.58) | N = 1885 | ⊕⊕⊕⊝ | ‐ |
| Toxicity (≥ G3) | 189 per 1000 | 372 per 1000 | RR 1.97 (1.44 to 2.71) | N = 390 | ⊕⊕⊕⊝ | ‐ |
| *The basis for the assumed risk (e.g. the median control group risk across studies) is provided in footnotes. The corresponding risk (and its 95% confidence interval) is based on the assumed risk in the comparison group and the relative effect of the intervention (and its 95% CI). † Numbers presented refer to event rates (i.e. death rates and progression rates). | ||||||
| GRADE Working Group grades of evidence | ||||||
| Assumed risk in the control population: 1‐year overall survival rate = 40%. Assumed risk in the control population: 1‐year progression‐free survival rate = 15%. Assumed risk in the control population: tumour response rate across control arms of included trials. Assumed risk in the control population: toxicity rate across control arms of included trials. a Not downgraded: high‐quality evidence. b Downgraded by one level: imprecision (CI includes both a meaningful benefit (relative risk increase > 25%) and a small/null benefit (relative risk increase < 10%)). c Downgraded by one level: imprecision (sample size lower than optimal information size, calculated to be equal to 400 participants). | ||||||
| Term | Explanation |
|---|---|
| Actinomycin‐D | A polypeptide used as an antibiotic and antineoplastic agent as a result of its ability to inhibit transcription |
| AJCC TNM staging | This is the most widely used tumour staging classification system, which has been developed and constantly updated by the American Joint Committee on Cancer (AJCC) for describing the extent of disease progression in people with cancer. It uses in part the TNM scoring system: tumour size, lymph nodes affected, metastases. Individuals affected by specific tumour type are assigned to categories describing risk of death |
| AJCC TNM stage III | People at this disease stage have melanoma metastasis in their regional lymph node (i.e. the first lymph nodes draining the skin area affected by the melanoma) |
| AJCC TNM stage IIIC | Stage IIIC is a higher risk subgroup among people with lymph node metastasis. The category includes people with all primary tumour stages (T stages) and those with clinically positive lymph nodes, or 4 or more positive lymph nodes |
| AJCC TNM stage IV | People with this disease stage have melanoma metastasis to distant sites (e.g. lung, liver, brain, bone) |
| Anti‐angiogenic agents | Drugs aimed to disrupt tumour vascularisation and reduce blood supply to malignant cells; examples include bevacizumab and endostar |
| Antigen | A substance that invokes the body's immune response |
| Aranoza | An alkylating agent that is used as a chemotherapy drug for various cancers including melanoma as part of combination chemotherapy regimens |
| Bacille Calmette‐Guérin (BCG) | BCG is a vaccine used in the prevention of tuberculosis. However, it is also a form of cancer immunotherapy with established effects in superficial (non‐muscle invading) bladder cancer |
| Bevacizumab | Bevacizumab (Avastin) is an angiogenesis inhibitor approved for use for people with various metastatic cancers. Bevacizumab acts through blockade of vascular endothelial growth factor A (VEGF‐A) that prevents development of new vessels necessary for tumours to grow |
| Bleomycin | An antineoplastic agent used in chemotherapy regimens for various tumours. Belomycin acts through cleavage of DNA within cells |
| Biochemotherapy | A combination of chemotherapy plus immunostimulating cytokines, such as interleukin‐2 and interferon‐alpha |
| Bosentan | An endothelin receptor inhibitor that causes reduced DNA synthesis and promotes apoptosis through competitive antagonism with the anti‐apoptotic factor endothelin‐1, often secreted by cancer cells in an autocrine or paracrine manner |
| BRAF | A gene that makes a protein called B‐Raf. BRAF is involved in sending signals within cells that direct their growth. In some cancers, this gene has mutated (Melanoma Institute Australia 2017) |
| Carmustine | An alkylating agent that prevents DNA replication and cell proliferation used in chemotherapy for various cancers |
| Cobimetinib | An inhibitor of MAPK kinase (MEK) approved for use in metastatic melanoma with BRAF V600E/K mutation usually in combination with a BRAF inhibitor |
| Corynebacterium parvum | C parvum is an aerobic, gram positive bacterium that has been reported to have antineoplastic potential |
| Cyclophosphamide | An alkylating agent used in auto‐immune diseases and various tumours as a chemotherapy drug |
| Cytokine | Small proteins produced by a broad range of cells that are important in cell signalling; they are immunostimulating agents |
| Cytotoxic | Cell killing |
| CTLA4 (cytotoxic T‐cell lymphocyte‐associated antigen‐4) | CTLA4 is a receptor located on the surface of T‐cells that down regulates the immune system (an immune checkpoint). The inhibition of this receptor with monoclonal antibodies, such as ipilimumab and tremelimumab, 'unleashes' the immune response to fight against malignant cells |
| Dabrafenib | An inhibitor of the BRAF kinase that has been approved for people with advanced melanoma carrying the BRAF V600E mutation |
| Dacarbazine | A chemotherapy drug that belongs to the family of alkylating agents that is used in the treatment of various cancers, including melanoma |
| Dendritic cell | These are antigen‐presenting cells that link the innate to the adaptive immune systems via processing antigens and presenting them to T‐lymphocytes. Their role is crucial for proper functioning of vaccines, including cancer vaccines |
| Elesclomol | A drug that causes the accumulation of reactive oxygen species to trigger apoptosis in cancer cells via oxidative stress. It is approved for use for people with metastatic melanoma |
| Endostar | A modified recombinant human endostatin that acts as an anti‐angiogenic agent to prevent the formation of new blood vessels that are necessary for tumour growth and survival |
| Fotemustine | A chemotherapy drug that belongs to the family of alkylating agents and has been approved for the treatment of metastatic melanoma |
| G3 and G4 | G3 (grade 3) and G4 (grade 4) toxicity refers to the highest degree of adverse events due to a systemic treatment. This system grades the toxicity related to a given system or organ (e.g. hepatic, cardiac, haematologic) |
| gp100 | A known melanoma antigen that can be applied to develop a cancer vaccine through processing and presentation by dendritic cells to lymphocytes |
| Granulocyte macrophage ‐ colony‐stimulating factor (GM‐CSF) | A cytokine that stimulates stem cells to give rise to granulocytes and monocytes and boosts the immune system |
| Hydroxyurea | A chemotherapy agent that acts through reducing the generation of deoxyribonucleotides, the building blocks of DNA, to inhibit adequate synthesis of DNA. It is used as a chemotherapy drug for people with myeloproliferative disorders |
| Immune checkpoints | Signalling proteins that protect against auto‐immunity and regulate the immune response; these checkpoints can be hijacked by cancer cells to evade T‐cell‐mediated death, i.e. stopping an immune response to the tumour. CTLA4 and PD1 are both immune checkpoints |
| Immune checkpoint inhibitors | Drugs that override the signalling/activation of immune checkpoints to encourage cytotoxic T‐cell recognition of cancer (i.e. an immune response). These are monoclonal antibodies blocking either CTLA4 or PD1 (two immune checkpoints), known as anti‐CTLA4 and anti‐PD1 monoclonal antibodies |
| Immunomodulating | Stimulates or suppresses the immune system |
| Immunostimulating | Stimulates an immune response |
| Interferon‐alpha | Interferon‐alpha is used for the postoperative treatment of people with AJCC TNM stages II (primary tumour at high risk of disease progression with negative lymph nodes) and III (positive lymph nodes) and to enhance the efficacy of chemotherapy in those who have metastatic melanoma |
| Interleukin‐2 | Interleukin‐2 is a protein that regulates the activities of leucocytes (particularly lymphocytes) that are responsible for immunity. The receptor for interleukin‐2 is expressed by lymphocytes. A recombinant form of human interleukin‐2 has been approved by the FDA for the treatment of melanoma and renal cell cancer |
| Lomustine | An oral alkylating chemotherapeutic agent used mainly to treat brain tumours because it crosses the blood‐brain barrier |
| MEK | Mitogen‐activated protein kinase (MEK) is part of the MAPK signalling pathway (see 'RAS‐RAF‐MEK‐ERK pathway' below), which is activated in melanoma |
| Monoclonal antibodies | Monoclonal antibodies are a type of targeted drug therapy; they work by recognising and finding specific proteins on cancer cells (they work in different ways depending on the protein they are targeting) (Cancer Research UK 2017) |
| Oblimersen | A bcl‐2 antisense oligodeoxynucleotide that reduces cancer cell survival and proliferation by blocking the generation of the anti‐apoptotic protein bcl‐2 thus promoting programmed cell death in cancer cells |
| Oncogene | A gene thats activation or over expression favours cancer growth |
| Paclitaxel | A chemotherapy agent targeting the protein tubulin. The drug interferes with the dynamics of microtubule formation and breakdown leading to problems during cell division and triggering of apoptosis. DHA‐ and nab‐paclitaxel are modified forms of the drug |
| PD1 (programmed cell death protein‐1) | PD1 is a receptor located on the surface of the T‐cells that down regulates the immune system (an immune checkpoint). The inhibition of this receptor with monoclonal antibodies, such as nivolumab and pembrolizumab, 'unleashes' immune response to fight against malignant cells |
| PF‐3512676 | An synthetic oligonucleotide that acts as a Toll‐like receptor‐9 (TLR‐9) agonist. It is used as an immunomodulatory agent alone, or in combination with chemotherapy, to boost anti‐tumour effects by enhancing B‐cell proliferation and antigen‐specific antibody production and cytokine secretion |
| Polychemotherapy | A combination of multiple chemotherapeutic agents |
| Procarbazine | An alkylating agent used as an antineoplastic chemotherapy drug in various tumours such as glioblastoma multiforme and Hodgkin's lymphoma |
| Programmed death‐1 (PD‐1) | PD‐1 is an inhibitory receptor located on the surface of the T‐cells that down regulates the immune system when bound by its ligands (PD‐L1 and PD‐L2, often found on cancer cells). The inhibition of this receptor with monoclonal antibodies, such as pembrolizumab and nivolumab, releases the brake on immune cells thus allowing them to freely fight malignant cells |
| Ramucirumab | A human monoclonal antibody that targets the vascular endothelial growth factor receptor 2 (VEGFR2) to block VEGF binding and thus inhibit angiogenesis. It is approved for use in advanced gastric adenocarcinoma and metastatic non‐small cell lung carcinoma |
| RAS‐RAF‐MEK‐ERK pathway | This is also known as 'MAPK/ERK pathway', which is a chain of proteins in the cell that communicates a signal from a receptor on the surface of the cell to the nucleus of the cell (where DNA is located). When one of the proteins in the pathway is mutated, it can be stuck in the 'on' or 'off' position, which is a necessary step in the development of many cancers, including melanoma. Drugs, such as BRAF and MEK inhibitors, can reverse this switch |
| Small‐molecule inhibitors | Low molecular weight drugs targeting molecules mutated or overexpressed in tumours; examples include BRAF inhibitors (which block the BRAF protein) or MEK inhibitors (which block the MEK protein) |
| Sorafenib | An inhibitor of various tyrosine protein kinases including RAF |
| Selumetinib | An inhibitor of the MAPK kinase (MEK) downstream of BRAF |
| T‐cell | A white blood cell type, which plays a key role in immunity |
| Tasisulam | A small‐molecule agent that induces apoptosis through the intrinsic mitochondrial pathway |
| Tamoxifen | A cytostatic hormonal therapeutic agent used mainly as a treatment for oestrogen receptor positive breast cancer. Tamoxifen acts through competing with oestrogen for its receptor thus reducing oestrogen‐related effects in breast tissue such as DNA synthesis and cell proliferation |
| Temozolomide | An oral alkylating agent that can be used in chemotherapy regimens for various cancers such as glioblastoma multiforme |
| Trametinib | An inhibitor of MAPK kinase (MEK) 1 and 2 approved for use in people with V600E‐mutated metastatic melanoma |
| Vemurafenib | A small‐molecule inhibitor of mutated BRAF, an oncogene involved in cell survival or proliferation |
| Vincristine | An anti‐mitotic agent that binds tubulin thus preventing cell proliferation and triggering apoptosis |
| Vindesine | An anti‐mitotic agent that acts by targeting microtubules and preventing cell division thus useful as a chemotherapy drug in various cancers |
| Vitespen | A tumour‐derived heat shock protein that is used as an adjuvant in cancer immunotherapy |
| Study ID | Reason for exclusion from meta‐analysis |
|---|---|
| Single study investigating tasisulam | |
| Single study investigating bosentan | |
| Single study comparing dacarbazine and best supportive care | |
| Single study investigating dendritic cells therapy | |
| Single study investigating histamine with interleukin‐2 | |
| Different polychemotherapy regimens not compared in other studies | |
| Different polychemotherapy regimens not compared in other studies | |
| Different polychemotherapy regimens not compared in other studies | |
| Different PEG‐interferon schedules tested | |
| Inpatient and outpatient interleukin‐2‐based regimens not compared in other studies | |
| Different lenalidomide schedules not compared in other studies | |
| Different polychemotherapy regimens not compared in other studies | |
| Study comparing biochemotherapy versus biotherapy | |
| Study comparing alternating and sequential biochemotherapy and chemotherapy | |
| Single study investigating Indomethacine with interferon | |
| Different single‐agent chemotherapy regimens not compared in other studies | |
| Different polychemotherapy regimens not compared in other studies | |
| Different temozolomide and interferon schedules tested | |
| Different polychemotherapy regimens not compared in other studies | |
| Different interferon‐based regimens not compared in other studies | |
| Different biochemotherapy regimens not compared in other studies | |
| Single study investigating chemotherapy and COX‐2 inhibitor | |
| Single study comparing interleukin‐2 with versus without interferon‐alpha | |
| Different ipilimumab schedules tested | |
| Single study comparing fotemustine and dacarbazine | |
| Single study testing Intetumumab | |
| Single study testing lomeguatrib | |
| Single study testing nab‐paclitaxel | |
| Single study testing oblimersen | |
| Single study testing DHA‐paclitaxel | |
| Single study testing PF‐3512676 | |
| Single study testing ramucirumab | |
| Single study testing dacarbazine and C parvum after surgery | |
| Single study testing vindesine after surgery | |
| Single study testing GM‐CSF and a polypeptide vaccination after surgery | |
| Single study testing lenalidomide | |
| Single study testing veliparib | |
| Single study testing vetaspen |
| Comparison | Experimental (class of) drug | Study ID |
|---|---|---|
| Polychemotherapy versus single agent chemotherapy | Polychemotherapy | |
| Biochemotherapy versus chemotherapy | Interferon‐alpha | |
| Interleukin‐2 | ||
| Interleukin‐2 plus interferon‐alpha | ||
| Immune checkpoint inhibitors versus chemotherapy (or other immune checkpoint inhibitors) | Anti‐CTLA4 monoclonal antibodies | |
| Anti‐PD1 monoclonal antibodies | ||
| Anti‐CTLA4 plus anti‐PD1 monoclonal antibodies | ||
| Small‐molecule targeted drugs versus chemotherapy (or other small‐molecule targeted drugs) | BRAF inhibitors | |
| MEK inhibitors | ||
| BRAF plus MEK inhibitors | ||
| Chemotherapy with versus without other agents | Bacille Calmette‐Guérin (BCG) | |
| Corynebacterium parvum | ||
| Tamoxifen | ||
| Anti‐angiogenic drugs | ||
| Sorafenib | ||
| Elesclomol | ||
| Single agent chemotherapy versus other single agent chemotherapy | Temozolomide | |
| Hodi 2010a; Hodi 2014; Maio 2010; Schwartzentruber 2011a were included in a meta‐analysis of immunostimulating agents. | ||
| Outcome or subgroup title | No. of studies | No. of participants | Statistical method | Effect size |
| 1.1 Overall survival Show forest plot | 6 | 594 | Hazard Ratio (IV, Random, 95% CI) | 0.99 [0.85, 1.16] |
| 1.2 Progression‐free survival Show forest plot | 5 | 398 | Hazard Ratio (IV, Random, 95% CI) | 1.07 [0.91, 1.25] |
| 1.3 Tumour response Show forest plot | 14 | 1885 | Risk Ratio (M‐H, Random, 95% CI) | 1.27 [1.02, 1.58] |
| 1.4 Toxicity (≥ G3) Show forest plot | 3 | 514 | Risk Ratio (M‐H, Fixed, 95% CI) | 1.97 [1.44, 2.71] |
| Outcome or subgroup title | No. of studies | No. of participants | Statistical method | Effect size |
| 2.1 Overall survival Show forest plot | 4 | 643 | Hazard Ratio (IV, Random, 95% CI) | 1.03 [0.80, 1.33] |
| 2.2 Progression‐free survival Show forest plot | 2 | 475 | Hazard Ratio (IV, Random, 95% CI) | 1.06 [0.93, 1.22] |
| 2.3 Tumour response Show forest plot | 4 | 643 | Risk Ratio (M‐H, Random, 95% CI) | 1.33 [0.94, 1.89] |
| 2.4 Toxicity (≥ G3) Show forest plot | 1 | 271 | Risk Ratio (M‐H, Random, 95% CI) | 0.70 [0.38, 1.28] |
| Outcome or subgroup title | No. of studies | No. of participants | Statistical method | Effect size |
| 3.1 Overall survival Show forest plot | 3 | 1313 | Hazard Ratio (IV, Random, 95% CI) | 0.98 [0.85, 1.12] |
| 3.2 Progression‐free survival Show forest plot | 3 | 1313 | Hazard Ratio (IV, Random, 95% CI) | 0.87 [0.74, 1.03] |
| 3.3 Tumour response Show forest plot | 3 | 1313 | Risk Ratio (M‐H, Random, 95% CI) | 1.21 [0.85, 1.73] |
| 3.4 Toxicity (≥ G3) Show forest plot | 2 | 1164 | Risk Ratio (M‐H, Random, 95% CI) | 1.15 [0.98, 1.35] |
| Outcome or subgroup title | No. of studies | No. of participants | Statistical method | Effect size |
| 4.1 Overall survival Show forest plot | 11 | 1785 | Hazard Ratio (IV, Random, 95% CI) | 0.87 [0.73, 1.04] |
| 4.2 Progression‐free survival Show forest plot | 6 | 1272 | Hazard Ratio (IV, Random, 95% CI) | 0.87 [0.74, 1.01] |
| 4.3 Tumour response Show forest plot | 15 | 2419 | Risk Ratio (M‐H, Random, 95% CI) | 1.36 [1.12, 1.66] |
| 4.4 Toxicity (≥ G3) Show forest plot | 3 | 791 | Risk Ratio (M‐H, Random, 95% CI) | 1.72 [0.37, 7.95] |
| Outcome or subgroup title | No. of studies | No. of participants | Statistical method | Effect size |
| 5.1 Overall survival Show forest plot | 2 | 644 | Hazard Ratio (IV, Random, 95% CI) | 0.95 [0.82, 1.11] |
| 5.2 Progression‐free survival Show forest plot | 1 | 363 | Hazard Ratio (IV, Random, 95% CI) | 0.87 [0.70, 1.08] |
| 5.3 Tumour response Show forest plot | 3 | 735 | Risk Ratio (M‐H, Random, 95% CI) | 0.85 [0.64, 1.13] |
| Outcome or subgroup title | No. of studies | No. of participants | Statistical method | Effect size |
| 6.1 Overall survival Show forest plot | 7 | 1307 | Hazard Ratio (IV, Random, 95% CI) | 0.94 [0.84, 1.06] |
| 6.2 Progression‐free survival Show forest plot | 6 | 964 | Hazard Ratio (IV, Random, 95% CI) | 0.90 [0.83, 0.99] |
| 6.3 Tumour response Show forest plot | 7 | 1307 | Risk Ratio (M‐H, Random, 95% CI) | 1.36 [1.11, 1.67] |
| 6.4 Toxicity (≥ G3) Show forest plot | 2 | 657 | Risk Ratio (M‐H, Random, 95% CI) | 1.35 [1.14, 1.61] |
| Outcome or subgroup title | No. of studies | No. of participants | Statistical method | Effect size |
| 7.1 Overall survival Show forest plot | 5 | 1118 | Hazard Ratio (IV, Random, 95% CI) | 0.96 [0.83, 1.10] |
| 7.2 Progression‐free survival Show forest plot | 4 | 775 | Hazard Ratio (IV, Random, 95% CI) | 0.86 [0.76, 0.99] |
| 7.3 Tumour response Show forest plot | 5 | 1118 | Risk Ratio (M‐H, Random, 95% CI) | 1.45 [1.15, 1.83] |
| 7.4 Toxicity (≥ G3) Show forest plot | 1 | 241 | Risk Ratio (M‐H, Random, 95% CI) | 1.45 [1.12, 1.87] |
| Outcome or subgroup title | No. of studies | No. of participants | Statistical method | Effect size |
| 8.1 Overall survival Show forest plot | 2 | 154 | Hazard Ratio (IV, Random, 95% CI) | 0.87 [0.61, 1.25] |
| 8.2 Tumour response Show forest plot | 6 | 770 | Risk Ratio (M‐H, Random, 95% CI) | 0.85 [0.65, 1.12] |
| Outcome or subgroup title | No. of studies | No. of participants | Statistical method | Effect size |
| 9.1 Overall survival Show forest plot | 4 | 242 | Hazard Ratio (IV, Random, 95% CI) | 0.95 [0.74, 1.22] |
| 9.2 Tumour response Show forest plot | 7 | 537 | Risk Ratio (M‐H, Random, 95% CI) | 1.03 [0.77, 1.38] |
| Outcome or subgroup title | No. of studies | No. of participants | Statistical method | Effect size |
| 10.1 Overall survival Show forest plot | 2 | 1157 | Hazard Ratio (IV, Random, 95% CI) | 0.81 [0.65, 1.01] |
| 10.2 Progression‐free survival Show forest plot | 1 | 502 | Hazard Ratio (IV, Random, 95% CI) | 0.76 [0.63, 0.92] |
| 10.3 Tumour response Show forest plot | 2 | 1157 | Risk Ratio (M‐H, Random, 95% CI) | 1.28 [0.92, 1.77] |
| 10.4 Toxicity (≥ G3) Show forest plot | 2 | 1142 | Risk Ratio (M‐H, Random, 95% CI) | 1.69 [1.19, 2.42] |
| Outcome or subgroup title | No. of studies | No. of participants | Statistical method | Effect size |
| 11.1 Overall survival Show forest plot | 2 | 784 | Hazard Ratio (IV, Random, 95% CI) | 0.83 [0.52, 1.33] |
| 11.2 Progression‐free survival Show forest plot | 2 | 785 | Hazard Ratio (IV, Random, 95% CI) | 1.06 [0.75, 1.51] |
| 11.3 Tumour response Show forest plot | 2 | 785 | Risk Ratio (M‐H, Random, 95% CI) | 0.74 [0.38, 1.47] |
| 11.4 Toxicity (≥ G3) Show forest plot | 2 | 785 | Risk Ratio (M‐H, Random, 95% CI) | 0.87 [0.69, 1.11] |
| Outcome or subgroup title | No. of studies | No. of participants | Statistical method | Effect size |
| 12.1 Overall survival Show forest plot | 1 | 418 | Hazard Ratio (IV, Random, 95% CI) | 0.42 [0.37, 0.48] |
| 12.2 Progression‐free survival Show forest plot | 2 | 957 | Hazard Ratio (IV, Random, 95% CI) | 0.49 [0.39, 0.61] |
| 12.3 Tumour response Show forest plot | 3 | 1367 | Risk Ratio (M‐H, Random, 95% CI) | 3.42 [2.38, 4.92] |
| 12.4 Toxicity (≥ G3) Show forest plot | 3 | 1360 | Risk Ratio (M‐H, Random, 95% CI) | 0.55 [0.31, 0.97] |
| Outcome or subgroup title | No. of studies | No. of participants | Statistical method | Effect size |
| 13.1 Overall survival Show forest plot | 1 | 834 | Hazard Ratio (IV, Random, 95% CI) | 0.63 [0.60, 0.66] |
| 13.2 Progression‐free survival Show forest plot | 2 | 1465 | Hazard Ratio (IV, Random, 95% CI) | 0.54 [0.50, 0.60] |
| 13.3 Tumour response Show forest plot | 2 | 1465 | Risk Ratio (M‐H, Random, 95% CI) | 2.47 [2.01, 3.04] |
| 13.4 Toxicity (≥ G3) Show forest plot | 2 | 1435 | Risk Ratio (M‐H, Random, 95% CI) | 0.70 [0.54, 0.91] |
| Outcome or subgroup title | No. of studies | No. of participants | Statistical method | Effect size |
| 14.1 Progression‐free survival Show forest plot | 2 | 738 | Hazard Ratio (IV, Random, 95% CI) | 0.40 [0.35, 0.46] |
| 14.2 Tumour response Show forest plot | 2 | 738 | Risk Ratio (M‐H, Random, 95% CI) | 3.50 [2.07, 5.92] |
| 14.3 Toxicity (≥ G3) Show forest plot | 2 | 764 | Risk Ratio (M‐H, Random, 95% CI) | 1.57 [0.85, 2.92] |
| Outcome or subgroup title | No. of studies | No. of participants | Statistical method | Effect size |
| 15.1 Overall survival Show forest plot | 3 | 1194 | Hazard Ratio (IV, Random, 95% CI) | 1.00 [0.88, 1.14] |
| 15.2 Progression‐free survival Show forest plot | 3 | 1194 | Hazard Ratio (IV, Random, 95% CI) | 0.89 [0.73, 1.09] |
| 15.3 Tumour response Show forest plot | 3 | 1194 | Risk Ratio (M‐H, Random, 95% CI) | 1.17 [0.91, 1.50] |
| 15.4 Toxicity (≥ G3) Show forest plot | 3 | 1194 | Risk Ratio (M‐H, Random, 95% CI) | 1.08 [0.93, 1.26] |
| Outcome or subgroup title | No. of studies | No. of participants | Statistical method | Effect size |
| 16.1 Overall survival Show forest plot | 1 | 651 | Hazard Ratio (IV, Random, 95% CI) | 1.10 [0.92, 1.32] |
| 16.2 Progression‐free survival Show forest plot | 2 | 732 | Hazard Ratio (IV, Random, 95% CI) | 0.75 [0.50, 1.13] |
| 16.3 Tumour response Show forest plot | 2 | 732 | Risk Ratio (M‐H, Random, 95% CI) | 1.86 [0.98, 3.50] |
| 16.4 Toxicity (≥ G3) Show forest plot | 1 | 651 | Risk Ratio (M‐H, Random, 95% CI) | 1.22 [1.00, 1.50] |
| Outcome or subgroup title | No. of studies | No. of participants | Statistical method | Effect size |
| 17.1 Overall survival Show forest plot | 2 | 324 | Hazard Ratio (IV, Random, 95% CI) | 0.60 [0.45, 0.81] |
| 17.2 Progression‐free survival Show forest plot | 2 | 324 | Hazard Ratio (IV, Random, 95% CI) | 0.69 [0.52, 0.92] |
| 17.3 Tumour response Show forest plot | 2 | 324 | Risk Ratio (M‐H, Random, 95% CI) | 1.71 [0.96, 3.03] |
| 17.4 Toxicity (≥ G3) Show forest plot | 2 | 324 | Risk Ratio (M‐H, Random, 95% CI) | 0.68 [0.09, 5.32] |
| Outcome or subgroup title | No. of studies | No. of participants | Statistical method | Effect size |
| 18.1 Overall survival Show forest plot | 2 | 925 | Hazard Ratio (IV, Random, 95% CI) | 0.40 [0.28, 0.57] |
| 18.2 Progression‐free survival Show forest plot | 2 | 925 | Hazard Ratio (IV, Random, 95% CI) | 0.27 [0.21, 0.34] |
| 18.3 Tumour response Show forest plot | 2 | 925 | Risk Ratio (M‐H, Random, 95% CI) | 6.78 [4.84, 9.49] |
| 18.4 Toxicity (≥ G3) Show forest plot | 2 | 925 | Risk Ratio (M‐H, Random, 95% CI) | 1.27 [0.48, 3.33] |
| Outcome or subgroup title | No. of studies | No. of participants | Statistical method | Effect size |
| 19.1 Overall survival Show forest plot | 3 | 496 | Hazard Ratio (IV, Random, 95% CI) | 0.85 [0.58, 1.25] |
| 19.2 Progression‐free survival Show forest plot | 3 | 496 | Hazard Ratio (IV, Random, 95% CI) | 0.58 [0.42, 0.80] |
| 19.3 Tumour response Show forest plot | 3 | 496 | Risk Ratio (M‐H, Random, 95% CI) | 2.01 [1.35, 2.99] |
| 19.4 Toxicity (≥ G3) Show forest plot | 1 | 91 | Risk Ratio (M‐H, Fixed, 95% CI) | 1.61 [1.08, 2.41] |
| Outcome or subgroup title | No. of studies | No. of participants | Statistical method | Effect size |
| 20.1 Overall survival Show forest plot | 4 | 1784 | Hazard Ratio (IV, Random, 95% CI) | 0.70 [0.59, 0.82] |
| 20.2 Progression‐free survival Show forest plot | 4 | 1784 | Hazard Ratio (IV, Random, 95% CI) | 0.56 [0.44, 0.71] |
| 20.3 Tumour response Show forest plot | 4 | 1784 | Risk Ratio (M‐H, Random, 95% CI) | 1.32 [1.20, 1.46] |
| 20.4 Toxicity (≥ G3) Show forest plot | 4 | 1774 | Risk Ratio (M‐H, Random, 95% CI) | 1.01 [0.85, 1.20] |
| Outcome or subgroup title | No. of studies | No. of participants | Statistical method | Effect size |
| 21.1 Overall survival Show forest plot | 4 | 1458 | Hazard Ratio (IV, Random, 95% CI) | 0.82 [0.67, 0.99] |
| 21.2 Progression‐free survival Show forest plot | 4 | 1458 | Hazard Ratio (IV, Random, 95% CI) | 0.92 [0.74, 1.14] |
| 21.3 Tumour response Show forest plot | 4 | 1451 | Risk Ratio (M‐H, Random, 95% CI) | 1.23 [0.60, 2.50] |
| 21.4 Toxicity (≥ G3) Show forest plot | 4 | 1458 | Risk Ratio (M‐H, Random, 95% CI) | 0.92 [0.77, 1.08] |