Tratamientos sistémicos para el melanoma cutáneo metastásico
Resumen
Antecedentes
En general, el pronóstico de los pacientes con melanoma cutáneo metastásico, un cáncer de la piel, es deficiente. En fechas recientes, nuevas clases de fármacos (p.ej., fármacos inhibidores del puesto de control inmune y fármacos dirigidos a moléculas pequeñas) han mejorado significativamente el pronóstico de los pacientes, lo que ha cambiado drásticamente el panorama del tratamiento terapéutico del melanoma. Ésta es una actualización de una revisión Cochrane publicada en 2000.
Objetivos
Evaluar los efectos beneficiosos y perjudiciales de los tratamientos sistémicos para el melanoma cutáneo metastásico.
Métodos de búsqueda
Se hicieron búsquedas en las siguientes bases de datos hasta octubre 2017: registro especializado del Grupo Cochrane de Piel (Cochrane Skin Group Specialised Register), CENTRAL, MEDLINE, Embase y LILACS. También se realizaron búsquedas en cinco registros de ensayos y en la base de datos ASCO en febrero de 2017, y se verificaron las listas de referencias de los estudios incluidos para obtener referencias adicionales de ensayos controlados aleatorizados (ECA) relevantes.
Criterios de selección
Se consideraron los ECA de tratamientos sistémicos en pacientes con metástasis inoperable de los ganglios linfáticos y melanoma cutáneo metastásico distante en comparación con cualquier otro tratamiento. Se revisaron las listas de referencias de los artículos seleccionados para identificar otras referencias a ensayos relevantes.
Obtención y análisis de los datos
Dos autores de la revisión extrajeron los datos y un tercer autor de la revisión verificó de forma independiente los datos extraídos. Se implementó un enfoque de metanálisis en red para realizar comparaciones indirectas y calificar los tratamientos según su efectividad (medida según la repercusión sobre la supervivencia) y efectos perjudiciales (medidos según la aparición de toxicidad de grado alto). Los mismos dos autores de la revisión evaluaron de forma independiente el riesgo de sesgo de los estudios elegibles según las normas Cochrane y la calidad de la evidencia se evaluó según los criterios GRADE.
Resultados principales
Se incluyeron 122 ECA (28 561 participantes). De estos ensayos, se incluyeron en los metanálisis 83 ECA que abarcaron 21 comparaciones diferentes. Los participantes incluidos fueron hombres y mujeres con una media de la edad de 57,5 años que se reclutaron en contextos hospitalarios. Veintinueve estudios incluyeron pacientes con cáncer que se había diseminado al cerebro. Las intervenciones se clasificaron en cinco grupos: quimioterapia convencional (que incluye agente único y poliquimioterapia), bioquimioterapia (quimioterapia de combinación con citoquinas como interleucina‐2 e interferón‐alfa), inhibidores del puesto de control inmune (como los anticuerpos monoclonales anti‐CTLA4 y anti‐PD1), fármacos dirigidos a moléculas pequeñas utilizados para los melanomas con cambios en genes específicos (como los inhibidores del BRAF y del MEK) y otros agentes (como los fármacos antiangiogénicos). La mayoría de las intervenciones se compararon con la quimioterapia. En muchos casos, los ensayos fueron patrocinados por las empresas farmacéuticas que producían el fármaco ensayado: esto fue especialmente cierto en el caso de las nuevas clases de fármacos, como los inhibidores del punto de control inmunológico y los fármacos dirigidos a las moléculas pequeñas.
En comparación con la quimioterapia con agente único, la combinación de agentes quimioterapéuticos múltiples (poliquimioterapia) no se tradujo en una supervivencia significativamente mejor (supervivencia general: CRI 0,99, IC del 95%: 0,85 a 1,16, seis estudios, 594 participantes; evidencia de alta calidad; supervivencia sin progresión: CRI 1,07, IC del 95%: 0,91 a 1,25, cinco estudios, 398 participantes; evidencia de alta calidad. Los que recibieron el tratamiento combinado probablemente se ven agobiados por tasas de toxicidad más altas (RR 1,97; IC del 95%: 1,44 a 2,71; tres estudios, 390 participantes; evidencia de calidad moderada). (La toxicidad se definió como la aparición de eventos adversos grado 3 [G3] o mayor según la escala de la Organización Mundial de la Salud.)
En comparación con la quimioterapia, la bioquimioterapia (quimioterapia combinada tanto con interferón alfa como con interleucina‐2) mejoró la supervivencia libre de progresión (CRI 0,90; IC del 95%: 0,83 a 0,99; seis estudios, 964 participantes; evidencia de alta calidad), pero no mejoró significativamente la supervivencia general (CRI 0,94; IC del 95%: 0,84 a 1,06; siete estudios, 1317 participantes; evidencia de alta calidad). La bioquimioterapia tuvo tasas de toxicidad más altas (RR 1,35; IC del 95%: 1,14 a 1,61, dos estudios, 631 participantes; evidencia de alta calidad).
Con respecto a los inhibidores de los puntos de control inmunológicos, los anticuerpos monoclonales anti‐CTLA4 más la quimioterapia probablemente aumentaron la probabilidad de supervivencia libre de progresión en comparación con la quimioterapia sola (CRI 0,76; IC del 95%: 0,63 a 0,92; un estudio, 502 participantes; evidencia de calidad moderada), pero es posible que no mejoren significativamente la supervivencia general (CRI 0,81; IC del 95%: 0,65 a 1,01; dos estudios, 1157 participantes; evidencia de baja calidad). En comparación con la quimioterapia sola, es probable que los anticuerpos monoclonales anti‐CTLA4 se asocien con tasas mayores de toxicidad (RR 1,69; IC del 95%: 1,19 a 2,42; dos estudios, 1142 participantes; evidencia de calidad moderada).
En comparación con la quimioterapia, los anticuerpos monoclonales anti‐PD1 (inhibidores de los puntos de control inmunológicos) mejoraron la supervivencia general (CRI 0,42; IC del 95%: 0,37 a 0,48; un estudio, 418 participantes; evidencia de alta calidad) y probablemente mejoraron la supervivencia sin progresión (CRI 0,49; IC del 95%: 0,39 a 0,61; dos estudios, 957 participantes; evidencia de calidad moderada). Los anticuerpos monoclonales anti‐PD1 también pueden dar lugar a menos toxicidad que la quimioterapia (RR 0,55; IC del 95%: 0,31 a 0,97; tres estudios, 1360 participantes; evidencia de baja calidad).
Los anticuerpos monoclonales anti‐PD1 tuvieron un mejor rendimiento que los anticuerpos monoclonales anti‐CTLA4 en cuanto a la supervivencia general (CRI 0,63, IC del 95%: 0,60 a 0,66, un estudio, 764 participantes; evidencia de alta calidad) y la supervivencia sin progresión (CRI 0,54, IC del 95%: 0,50 a 0,60, dos estudios, 1465 participantes; evidencia de alta calidad). Los anticuerpos monoclonales anti‐PD1 pueden dar lugar a mejores resultados de toxicidad que los anticuerpos monoclonales anti‐CTLA4 (RR 0,70; IC del 95%: 0,54 a 0,91; dos estudios, 1465 participantes; evidencia de baja calidad).
En comparación con los anticuerpos monoclonales anti‐CTLA4 solos, la combinación de anti‐CTLA4 más anticuerpos monoclonales anti‐PD1 se asoció con una mejor supervivencia libre de progresión (CRI 0,40; IC del 95%: 0,35 a 0,46; dos estudios, 738 participantes; evidencia de alta calidad). Es posible que no haya diferencias significativas en los resultados de toxicidad (RR 1,57; IC del 95%: 0,85 a 2,92; dos estudios, 764 participantes; evidencia de baja calidad) (no se disponía de datos sobre la supervivencia general).
La clase de fármacos dirigidos a las moléculas pequeñas, los inhibidores de los BRAF (que son activos exclusivamente contra el melanoma con mutación de BRAF), tuvieron un mejor rendimiento que la quimioterapia en cuanto a la supervivencia general (CRI 0,40; IC del 95%: 0,28 a 0,57; dos estudios, 925 participantes; evidencia de alta calidad) y la supervivencia sin progresión (CRI 0,27, IC del 95% 0,21 a 0,34, dos estudios, 925 participantes; evidencia de alta calidad), y puede no haber diferencias significativas en la toxicidad (RR 1,27, IC del 95% 0,48 a 3,33, dos estudios, 408 participantes; evidencia de baja calidad).
En comparación con la quimioterapia, los inhibidores del MEK (que son activos exclusivamente contra el melanoma con mutación de BRAF) pueden no mejorar significativamente la supervivencia general (CRI 0,85; IC del 95%: 0,58 a 1,25, tres estudios, 496 participantes; evidencia de baja calidad), pero probablemente dan lugar a una mejor supervivencia sin progresión (CRI 0,58; IC del 95%: 0,42 a 0,80, tres estudios, 496 participantes; evidencia de calidad moderada). Sin embargo, los inhibidores del MEK probablemente tienen tasas de toxicidad más altas (RR 1,61; IC del 95%: 1,08 a 2,41; un estudio, 91 participantes; evidencia de calidad moderada).
En comparación con los inhibidores del BRAF, la combinación de inhibidores del BRAF más inhibidores del MEK se asoció con una mejor supervivencia general (CRI 0,70; IC del 95%: 0,59 a 0,82; cuatro estudios, 1784 participantes; evidencia de alta calidad). Los inhibidores de BRAF más MEK también fueron probablemente mejores en cuanto a la supervivencia sin progresión (CRI 0,56; IC del 95%: 0,44 a 0,71; cuatro estudios, 1784 participantes; evidencia de calidad moderada), y parece probable que no haya diferencias significativas en cuanto a la toxicidad (RR 1,01; IC del 95%: 0,85 a 1,20; cuatro estudios, 1774 participantes; evidencia de calidad moderada).
En comparación con la quimioterapia, la combinación de quimioterapia más fármacos antiangiogénicos probablemente se asoció con una mejor supervivencia general (CRI 0,60; IC del 95%: 0,45 a 0,81; evidencia de calidad moderada) y una supervivencia sin progresión (CRI 0,69; IC del 95%: 0,52 a 0,92; evidencia de calidad moderada). Puede no haber diferencias en cuanto a la toxicidad (RR 0,68; IC del 95%: 0,09 a 5,32; evidencia de baja calidad). Todos los resultados para esta comparación se basaron en 324 participantes de dos estudios.
El metanálisis de la red se centró en la quimioterapia como comparador común y en los tratamientos actualmente aprobados para los que se disponía de evidencia de eficacia de calidad alta a moderada (representadas por el efecto del tratamiento en la supervivencia sin progresión), basadas en los resultados anteriores: bioquímica (tanto con interferón‐alfa como con interleucina‐2); anticuerpos monoclonales anti‐CTLA4; anticuerpos monoclonales anti‐PD1; anti‐CTLA4 más anticuerpos monoclonales anti‐PD1; inhibidores de BRAF; inhibidores de MEK, y BRAF más inhibidores de MEK. El análisis (que incluyó 19 ECA y 7632 participantes) generó 21 comparaciones indirectas.
La mejor evidencia (evidencia de calidad moderada) para la supervivencia libre de progresión se encontró en las comparaciones indirectas siguientes:
• las combinaciones de los inhibidores del puesto de control inmune (CRI 0,30; IC del 95%: 0,17 a 0,51) y los fármacos dirigidos a moléculas pequeñas (CRI 0,17; IC del 95%: 0,11 a 0,26) probablemente mejoraron la supervivencia libre de progresión en comparación con la quimioterapia;
• los inhibidores del BRAF (CRI 0,40; IC del 95%: 0,23 a 0,68) y las combinaciones de fármacos dirigidos a moléculas pequeñas (CRI 0,22; IC del 95%: 0,12 a 0,39) probablemente se asociaron con mejor supervivencia libre de progresión en comparación con los anticuerpos monoclonales anti‐CTLA4;
• la bioquimioterapia (CRI 2,81; IC del 95%: 1,76 a 4,51) probablemente da lugar a una peor supervivencia libre de progresión en comparación con los inhibidores del BRAF;
• la combinación de los fármacos dirigidos a moléculas pequeñas probablemente mejora la supervivencia libre de progresión (CRI 0,38; IC del 95%: 0,21 a 0,68) en comparación con los anticuerpos monoclonales anti‐PD1;
• la bioquimioterapia (CRI 5,05; IC del 95%: 3,01 a 8,45) y los inhibidores del MEK (CRI 3,16; IC del 95%: 1,77 a 5,65) probablemente se asociaron con peor supervivencia libre de progresión en comparación con la combinación de los fármacos dirigidos a moléculas pequeñas; y
• la bioquimioterapia probablemente se asoció con peor supervivencia libre de progresión (CRI 2,81; IC del 95%: 1,54 a 5,11) en comparación con la combinación de los inhibidores del puesto de control inmune.
La mejor evidencia (evidencia de calidad moderada) para la toxicidad se encontró en las comparaciones indirectas siguientes:
• la combinación de los inhibidores del puesto de control inmune (RR 3,49; IC del 95%: 2,12 a 5,77) probablemente aumentó la toxicidad en comparación con la quimioterapia;
• la combinación de los inhibidores del puesto de control inmune probablemente aumentó la toxicidad (RR 2,50; IC del 95%: 1,20 a 5,20) en comparación con los inhibidores del BRAF;
• la combinación de los inhibidores del puesto de control inmune probablemente aumentó la toxicidad (RR 3,83; IC del 95%: 2,59 a 5,68) en comparación con los anticuerpos monoclonales anti‐PD1; y
• la bioquimioterapia probablemente se asoció con menor toxicidad (RR 0,41; IC del 95%: 0,24 a 0,71) en comparación con la combinación de los inhibidores del puesto de control inmune.
La calificación según el metanálisis en red indicó que la combinación de inhibidores del BRAF más inhibidores del MEK es la estrategia más efectiva con respecto a la supervivencia libre de progresión, mientras que los anticuerpos monoclonales anti‐PD1 se asocian con la toxicidad más baja.
En general, el riesgo de sesgo de los ensayos incluidos se puede considerar limitado. Cuando se consideraron los 122 ensayos incluidos en esta revisión y los siete tipos de sesgo que se evaluaron, se realizaron 854 evaluaciones, y solamente siete (< 1%) asignaron un riesgo alto a seis ensayos.
Conclusiones de los autores
Se encontró evidencia de alta calidad de que muchos tratamientos ofrecen mejor eficacia que la quimioterapia, en especial en el caso de los tratamientos implementados de forma reciente, como los fármacos dirigidos a moléculas inhibidores del MEK, que se utilizan para tratar el melanoma con mutaciones en genes específicos. En comparación con la quimioterapia, la bioquimioterapia (en este caso, la quimioterapia combinada con interferón‐alfa e interleucina‐2) y los inhibidores del BRAF mejoraron la supervivencia libre de progresión; los inhibidores BRAF (para el melanoma con mutación BRAF) y los anticuerpos monoclonales anti‐PD1 mejoraron la supervivencia general. Sin embargo, no hubo diferencias entre la poliquimioterapia y la monoquimioterapia en cuanto al logro de la supervivencia libre de progresión y la supervivencia general. La bioquimioterapia no mejora significativamente la supervivencia general y tiene tasas mayores de toxicidad en comparación con la quimioterapia.
Hubo alguna evidencia de que los tratamientos combinados funcionaban mejor que los tratamientos individuales: los anticuerpos monoclonales anti‐PD1, solos o con anti‐CTLA4, mejoraron la supervivencia libre de progresión en comparación con los anticuerpos monoclonales anti‐CTLA4 solos. Los anticuerpos monoclonales anti‐PD1 funcionaron mejor que los anticuerpos monoclonales anti‐CTLA4 en cuanto a la supervivencia general y la combinación de inhibidores del BRAF más inhibidores del MEK se asoció con una mejor supervivencia general para el melanoma con mutación del BRAF, en comparación con los inhibidores del BRAF solos.
La combinación de inhibidores del BRAF más inhibidores del MEK (que solo se puede administrar a pacientes con melanoma con mutación del BRAF) pareció ser el tratamiento más efectivo (según los resultados de la supervivencia libre de progresión), mientras que los anticuerpos monoclonales anti‐PD1 parecieron ser el tratamiento menos tóxico y más aceptable.
La calidad de evidencia se redujo debido a imprecisión, heterogeneidad entre los estudios y el informe no óptimo de los ensayos. Los estudios de investigación futuros deben asegurar que se aborden estas influencias que menoscaban la calidad. Las áreas clínicas de los estudios de investigación futuros deben incluir el efecto a más largo plazo de los nuevos agentes terapéuticos (es decir, los inhibidores del puesto de control inmune y los tratamientos dirigidos) sobre la supervivencia general, así como la combinación de los fármacos utilizados en el tratamiento del melanoma; en las investigaciones también se debería estudiar la posible influencia de los biomarcadores.
PICOs
Resumen en términos sencillos
Tratamientos sistémicos (comprimidos o inyecciones) administrados para el melanoma metastásico (que se ha extendido del sitio inicial a otras partes del cuerpo)
Antecedentes
El melanoma es el cáncer de piel común más peligroso. El diagnóstico temprano ofrece las mejores probabilidades de curación. Los pacientes afectados por un melanoma en estadio inicial representan cerca del 70% al 80% de todos los pacientes con melanoma y se pueden tratar mediante la extracción quirúrgica del tumor original (conocido como tumor primario). Sin embargo, cuando un melanoma primario se detecta en un estadio posterior, hay un riesgo de diseminación de la enfermedad a los ganglios linfáticos más cercanos (glándulas que forman parte del sistema inmunológico del cuerpo) y a sitios distantes como los pulmones, el hígado, los huesos y el cerebro. En este caso, la quimioterapia sistémica (administración de fármacos que matan las células en todo el cuerpo) y la bioquimioterapia (quimioterapia combinada con sustancias que pueden mejorar la respuesta inmunitaria, conocidas como citoquinas inmunoestimulantes, como la interleucina‐2 y el interferón‐alfa) han sido los tratamientos principales durante más de tres décadas. Sin embargo, sólo unas pocas personas experimentan una regresión espontánea (es decir, no resultante de la terapia) del tumor primario.
Durante los últimos años, nuevas clases de fármacos se han utilizado con resultados alentadores. Se intentó comparar los tratamientos sistémicos nuevos con los tratamientos más antiguos, y también entre sí, con respecto a la supervivencia, la aceptabilidad, la respuesta tumoral y la calidad de vida. Estos resultados se evaluaron en pacientes con melanoma metastásico (TNM estadio IV de la AJCC).
Pregunta de la revisión
Se intentó evaluar los efectos de los tratamientos sistémicos en pacientes con melanoma cutáneo metastásico (melanoma del tejido de la piel). Se buscaron ensayos relevantes hasta octubre de 2017 y se incluyeron 122 estudios.
Se resumieron los resultados de los tratamientos del melanoma (administrados de forma sistémica) como la quimioterapia convencional, la bioquimioterapia, así como clases de fármacos más nuevas, como los inhibidores del puesto de control inmune (anticuerpos monoclonales anti‐CTLA4 y anti‐PD1, que aumentan la actividad antitumoral del sistema inmunológico), los fármacos dirigidos a moléculas pequeñas (inhibidores del BRAF, que se utilizan solamente en los melanomas que contienen mutaciones específicas del gen BRAF que promueve la progresión tumoral, y los inhibidores del MEK, que funcionan a través de la misma vía molecular) y los fármacos antiangiogénicos (que reducen la irrigación de sangre a las células cancerígenas). Se compararon estos tratamientos con la quimioterapia convencional.
Características de los estudios
Los 122 estudios fueron ensayos controlados aleatorizados que reclutaron a pacientes con melanoma cutáneo metastásico y compararon tratamientos sistémicos diferentes (28 561 participantes). Los participantes de los estudios fueron pacientes adultos de cualquier sexo, con una media de edad de 57,5 años. Hubo 29 estudios que incluyeron pacientes con cáncer que se había diseminado al cerebro, lo cual es importante porque la detección y el tratamiento de las metástasis cerebrales a menudo plantean desafíos únicos. La mayoría de los tratamientos se compararon con la quimioterapia, y todos los estudios se realizaron en hospitales. Con frecuencia, la compañía farmacéutica que fabricó un fármaco probado también patrocinó el estudio en el cual se evaluó, especialmente en el caso de las nuevas clases de fármacos como los inhibidores del puesto de control inmune y los fármacos dirigidos a moléculas pequeñas.
Resultados clave
En comparación con la quimioterapia convencional, varios tratamientos pueden mejorar la supervivencia libre de progresión de los pacientes con melanoma metastásico. Estos incluyen bioquimioterapia (evidencia de alta calidad), anticuerpos monoclonales anti‐CTLA4 más quimioterapia (evidencia de calidad moderada), anticuerpos monoclonales anti‐PD1 (evidencia de calidad moderada), inhibidores del BRAF (evidencia de alta calidad), inhibidores del MEK (evidencia de calidad moderada) y fármacos antiangiogénicos (evidencia de calidad moderada). Sin embargo, no se encontraron diferencias con el uso de una combinación de varios agentes de quimioterapia (poliquimioterapia) (evidencia de alta calidad). Además, la combinación de los inhibidores del puesto de control inmune (anticuerpos monoclonales anti‐PD1 más anti‐CTLA4) funcionó mejor que los anticuerpos monoclonales anti‐CTLA4 solos (evidencia de alta calidad), pero los anticuerpos monoclonales anti‐PD1 funcionaron mejor que los anticuerpos monoclonales anti‐CTLA4 (evidencia de alta calidad). La combinación de los inhibidores de moléculas pequeñas (inhibidores del BRAF más inhibidores del MEK) dio lugar a mejores resultados que los inhibidores del BRAF solos (evidencia de calidad moderada), en los pacientes con melanoma que tiene un cambio en el gen BRAF.
Los anticuerpos monoclonales anti‐PD1 mejoraron la supervivencia general de los pacientes en comparación con la quimioterapia estándar (evidencia de alta calidad) o los anticuerpos monoclonales anti‐CTLA4 (evidencia de alta calidad). En comparación con la quimioterapia sola, los inhibidores del BRAF (evidencia de alta calidad) y los agentes antiangiogénicos combinados con quimioterapia (evidencia de calidad moderada) también prolongaron la supervivencia general, pero los anticuerpos monoclonales anti‐CTLA4 más quimioterapia (evidencia de baja calidad), los inhibidores del MEK (evidencia de baja calidad), los agentes quimioterapéuticos múltiples combinados (poliquimioterapia) (evidencia de alta calidad) o la bioquimioterapia (evidencia de alta calidad) no dieron lugar a una mejoría significativa en la supervivencia general. También se encontró que la combinación de los inhibidores de moléculas pequeñas funcionaron mejor que los inhibidores del BRAF solos (evidencia de alta calidad). Con respecto a la supervivencia general, no hubo datos disponibles sobre de los anticuerpos monoclonales anti‐CTLA4 solos en comparación con la combinación de los anticuerpos monoclonales anti‐CTLA4 más anti‐PD1.
En cuanto a la toxicidad (definida como la aparición de efectos secundarios de grado alto), la bioquimioterapia (evidencia de alta calidad), los anticuerpos monoclonales anti‐CTLA4 (evidencia de calidad moderada), la poliquimioterapia (evidencia de calidad moderada) y los inhibidores del MEK (evidencia de calidad moderada) se asociaron con una toxicidad peor en comparación con la quimioterapia. Por el contrario, los anticuerpos monoclonales anti‐PD1 parecen ser mejor tolerados que la quimioterapia sola. Los anticuerpos monoclonales anti‐PD1 también parecieron ser mejor tolerados que los anticuerpos monoclonales anti‐CTLA4. Sin embargo, la calidad de la evidencia que apoya estos resultados se consideró baja. Además, la frecuencia de los efectos secundarios no difirió significativamente entre los anticuerpos monoclonales anti‐PD1 más los anticuerpos monoclonales anti‐CTLA4 versus los anticuerpos monoclonales anti‐CTLA4 solos (evidencia de baja calidad), los fármacos antiangiogénicos combinados con quimioterapia versus quimioterapia (evidencia de baja calidad), los inhibidores del BRAF versus la quimioterapia (evidencia de baja calidad) y la combinación de inhibidores del BRAF más inhibidores del MEK versus inhibidores del BRAF solos (evidencia de calidad moderada).
También se realizó un análisis que comparó tratamientos que no se habían comparado directamente en un estudio. Este análisis se conoce como un metanálisis en red. Para el resultado supervivencia libre de progresión, al analizar solamente la mejor evidencia disponible, se encontraron los siguientes resultados (por favor, adviértase que debido a que el nivel más alto de calidad fue moderado, los siguientes resultados solo se pueden considerar probables):
• la combinación de los inhibidores del puesto de control inmune y la combinación de los fármacos dirigidos a moléculas pequeñas fueron más favorables en comparación con la quimioterapia;
• los inhibidores del BRAF y la combinación de los fármacos dirigidos a moléculas pequeñas fueron más favorables en comparación con los anticuerpos monoclonales anti‐CTLA4;
• la bioquimioterapia dio lugar a resultados menos favorables que los inhibidores del BRAF;
• la combinación de los fármacos dirigidos a moléculas pequeñas fue más favorable en comparación con los anticuerpos monoclonales anti‐PD1;
• la bioquimioterapia y los inhibidores del MEK dieron lugar a resultados menos favorables que la combinación de los fármacos dirigidos a moléculas pequeñas; y
• la bioquimioterapia dio lugar a resultados menos favorables que la combinación de los inhibidores del puesto de control inmune
Para el resultado toxicidad, al analizar solamente la mejor evidencia disponible, se encontraron los siguientes resultados (nuevamente, la calidad de la evidencia no fue mayor que moderada):
• la combinación de los inhibidores del puesto de control inmune dio lugar a resultados menos favorables que la quimioterapia;
• la combinación de los inhibidores del puesto de control inmune dio lugar a resultados menos favorables que los inhibidores del BRAF;
• la combinación de los inhibidores del puesto de control inmune dio lugar a resultados menos favorables que los anticuerpos monoclonales anti‐PD1; y
• la bioquimioterapia fue más favorable en comparación con la combinación de los inhibidores del puesto de control inmune.
Los resultados sugieren que la combinación de fármacos dirigidos a moléculas pequeñas (BRAF más inhibidores del MEK) es la estrategia de tratamiento más efectiva para los pacientes con melanoma que tienen un cambio en el gen BRAF, al menos en lo que respecta a la supervivencia sin progresión; sin embargo, esta terapia de combinación tiene una tasa más alta de toxicidad grave en comparación con los efectos observados entre los pacientes tratados con anticuerpos monoclonales anti‐PD1, que pueden utilizarse en todos los tipos de melanoma y ocupan el primer lugar en cuanto a la tolerabilidad.
Estos resultados se deben confirmar mediante un análisis a largo plazo de los ensayos aleatorizados, con atención especial a los efectos sobre la supervivencia general de los pacientes.
Calidad de la evidencia
Los hallazgos con GRADE mostraron que la mayoría de la evidencia fue de calidad alta a moderada en tres (supervivencia general, supervivencia libre de progresión y respuesta tumoral) de cuatro resultados (toxicidad). La calidad de la evidencia se redujo debido al escaso número de participantes en algunas comparaciones, las diferencias entre los estudios y al informe deficiente de los ensayos.
Authors' conclusions
Summary of findings
| Anti‐PD1 monoclonal antibodies compared with chemotherapy for the treatment of metastatic melanoma | ||||||
| Patient or population: people with cutaneous melanoma Settings: hospital (metastatic disease) Intervention: anti‐PD1 monoclonal antibodies Comparison: chemotherapy | ||||||
| Outcomes | Illustrative comparative risks* (95% CI) | Relative effect | No of Participants | Quality of the evidence | Comments | |
|---|---|---|---|---|---|---|
| Assumed risk | Corresponding risk | |||||
| Chemotherapy | Anti‐PD1 | |||||
| Overall survival† | 600 per 1000† | 320 per 1000† | HR 0.42 (0.37 to 0.48) | N = 418 | ⊕⊕⊕⊕ | ‐ |
| Progression‐free survival† | 850 per 1000† | 610 per 1000† | HR 0.49 (0.39 to 0.61) | N = 957 | ⊕⊕⊕⊝ | ‐ |
| Tumour response | 81 per 1000 | 277 per 1000 | RR 3.42 (2.38 to 4.92) | N = 1367 | ⊕⊕⊕⊕ | ‐ |
| Toxicity (≥ G3) | 300 per 1000 | 165 per 1000 | RR0.55 (0.31 to 0.97) | N = 1360 | ⊕⊕⊝⊝ | ‐ |
| * The basis for the assumed risk (e.g. the median control group risk across studies) is provided in footnotes. The corresponding risk (and its 95% confidence interval) is based on the assumed risk in the comparison group and the relative effect of the intervention (and its 95% CI). † Numbers presented refer to event rates (i.e. death rates and progression rates). CI: confidence interval; HR: hazard ratio | ||||||
| GRADE Working Group grades of evidence | ||||||
| Assumed risk in the control population: 1‐year overall survival rate = 40%. Assumed risk in the control population: 1‐year progression‐free survival rate = 15%. Assumed risk in the control population: tumour response rate across control arms of included trials. Assumed risk in the control population: toxicity rate across control arms of included trials. a Not downgraded: high‐quality evidence. b Downgraded by one level: inconsistency (between‐study heterogeneity). c Downgraded by two levels: inconsistency (between‐study heterogeneity) and imprecision (CI includes both a meaningful benefit (relative risk reduction > 25%) and a small/null benefit (relative risk reduction < 10%)). | ||||||
| Anti‐PD1 monoclonal antibodies compared with anti‐CTLA4 monoclonal antibodies for the treatment of metastatic melanoma | ||||||
| Patient or population: people with cutaneous melanoma Settings: hospital (metastatic disease) Intervention: anti‐PD1 monoclonal antibodies Comparison: anti‐CTLA4 monoclonal antibodies | ||||||
| Outcomes | Illustrative comparative risks* (95% CI) | Relative effect | No of Participants | Quality of the evidence | Comments | |
|---|---|---|---|---|---|---|
| Assumed risk | Corresponding risk | |||||
| Anti‐CTLA4 | Anti‐PD1 | |||||
| Overall survival† | 600 per 1000† | 438 per 1000† | HR 0.63 (0.60 to 0.66) | N = 764 | ⊕⊕⊕⊕ | ‐ |
| Progression‐free survival† | 850 per 1000† | 641 per 1000† | HR 0.54 (0.50 to 0.60) | n = 1465 | ⊕⊕⊕⊕ | ‐ |
| Tumour response | 157 per 1000 | 388 per 1000 | RR 2.47 (2.01 to 3.04) | N = 1465 | ⊕⊕⊕⊕ | ‐ |
| Toxicity (≥ G3) | 398 per 1000 | 278 per 1000 | RR 0.70 (0.54 to 0.91) | N = 1465 | ⊕⊕⊝⊝ | ‐ |
| *The basis for the assumed risk (e.g. the median control group risk across studies) is provided in footnotes. The corresponding risk (and its 95% confidence interval) is based on the assumed risk in the comparison group and the relative effect of the intervention (and its 95% CI). † Numbers presented refer to event rates (i.e. death rates and progression rates). CI: confidence interval; RR: risk ratio; HR: hazard ratio. | ||||||
| GRADE Working Group grades of evidence | ||||||
| Assumed risk in the control population: 1‐year overall survival rate = 40%. Assumed risk in the control population: 1‐year progression‐free survival rate = 15%. Assumed risk in the control population: tumour response rate across control arms of included trials. Assumed risk in the control population: toxicity rate across control arms of included trials. a Not downgraded: high‐quality evidence. b Downgraded by two levels: inconsistency (between‐study heterogeneity) and imprecision (CI includes both a meaningful benefit (relative risk reduction > 25%) and a small/null benefit (relative risk reduction < 10%). | ||||||
| Anti‐CTLA4 monoclonal antibodies plus chemotherapy compared with chemotherapy for the treatment of metastatic melanoma | ||||||
| Patient or population: people with cutaneous melanoma Settings: hospital (metastatic disease) Intervention: anti‐CTLA4 monoclonal antibodies plus chemotherapy (combo) Comparison: chemotherapy | ||||||
| Outcomes | Illustrative comparative risks* (95% CI) | Relative Effect | No of Participants | Quality of the evidence | Comments | |
|---|---|---|---|---|---|---|
| Assumed risk | Corresponding risk | |||||
| Chemotherapy | Combo | |||||
| Overall survival† | 600 per 1000† | 524 per 1000† | HR 0.81 (0.65 to 1.01) | N = 1157 | ⊕⊕⊝⊝ | ‐ |
| Progression‐free survival† | 850 per 1000† | 763 per 1000† | HR 0.76 (0.63 to 0.92) | N = 502 | ⊕⊕⊕⊝ | ‐ |
| Tumour response | 100 per 1000 | 128 per 1000 | RR 1.28 (0.92 to 1.77) | N = 1157 | ⊕⊕⊕⊝ | ‐ |
| Toxicity (≥ G3) | 352 per 1000 | 595 per 1000 | RR 1.69 (1.19 to 2.42) | N = 1142 | ⊕⊕⊕⊝ | ‐ |
| * The basis for the assumed risk (e.g. the median control group risk across studies) is provided in footnotes. The corresponding risk (and its 95% confidence interval) is based on the assumed risk in the comparison group and the relative effect of the intervention (and its 95% CI). † Numbers presented refer to event rates (i.e. death rates and progression rates). CI: confidence interval; HR: hazard ratio. | ||||||
| GRADE Working Group grades of evidence | ||||||
| Assumed risk in the control population: 1‐year overall survival rate = 40%. Assumed risk in the control population: 1‐year progression‐free survival rate = 15%. Assumed risk in the control population: tumour response rate across control arms of included trials. Assumed risk in the control population: toxicity rate across control arms of included trials. a Downgraded by two levels: inconsistency (between‐study heterogeneity) and imprecision (CI includes both a meaningful benefit (relative risk reduction > 25%) and a harmful effect). b Downgraded by one level: imprecision (CI includes both a meaningful benefit (relative risk reduction > 25%) and a small/null benefit (relative risk reduction < 10%)). c Downgraded by one level: imprecision (CI includes both a meaningful benefit (relative risk increase > 25%) and a harmful effect). d Downgraded by one level: inconsistency (between‐study heterogeneity). | ||||||
| Anti‐CTLA4 plus anti‐PD1 monoclonal antibodies compared with anti‐CTLA4 monoclonal antibodies for the treatment of metastatic melanoma | ||||||
| Patient or population: people with cutaneous melanoma Settings: hospital (metastatic disease) Intervention: Anti‐CTLA4 plus Anti‐PD1 monoclonal antibodies (combo) Comparison: Anti‐CTLA4 monoclonal antibodies | ||||||
| Outcomes | Illustrative comparative risks* (95% CI) | Relative effect | No of Participants | Quality of the evidence | Comments | |
|---|---|---|---|---|---|---|
| Assumed risk | Corresponding risk | |||||
| Anti‐CTLA4 | Combo | |||||
| Overall survival | See comment | See comment | See comment | See comment | See comment | Outcome not measured |
| Progression‐free survival† | 750 per 1000† | 425 per 1000† | HR 0.40 (0.35 to 0.46) | N = 738 | ⊕⊕⊕⊕ | ‐ |
| Tumour response | 182 per 1000 | 636 per 1000 | RR 3.50 (2.07 to 5.92) | N = 738 | ⊕⊕⊕⊕ | ‐ |
| Toxicity (≥ G3) | 521 per 1000 | 818 per 1000 | RR 1.57 (0.85 to 2.92) | N = 764 | ⊕⊕⊝⊝ | ‐ |
| * The basis for the assumed risk (e.g. the median control group risk across studies) is provided in footnotes. The corresponding risk (and its 95% confidence interval) is based on the assumed risk in the comparison group and the relative effect of the intervention (and its 95% CI). † Numbers presented refer to event rates (i.e. progression rates). CI: confidence interval | ||||||
| GRADE Working Group grades of evidence | ||||||
| Assumed risk in the control population: 1‐year progression‐free survival rate = 25%. Assumed risk in the control population: tumour response rate across control arms of included trials. Assumed risk in the control population: toxicity rate across control arms of included trials. a Not downgraded: high‐quality evidence. b Downgraded by two levels: inconsistency (between‐study heterogeneity) and imprecision (CI includes both a meaningful harm (relative risk increase > 25%) and a beneficial effect) | ||||||
| BRAF inhibitors compared with chemotherapy for the treatment of metastatic melanoma | ||||||
| Patient or population: people with cutaneous melanoma Settings: hospital (metastatic disease) Intervention: BRAF inhibitors Comparison: chemotherapy | ||||||
| Outcomes | Illustrative comparative risks* (95% CI) | Relative effect | No of Participants | Quality of the evidence | Comments | |
|---|---|---|---|---|---|---|
| Assumed risk | Corresponding risk | |||||
| Chemotherapy | BRAF inhibitors | |||||
| Overall survival† | 600 per 1000† | 307 per 1000† | HR 0.40 (0.28 to 0.57) | N = 925 | ⊕⊕⊕⊕ | ‐ |
| Progression‐free survival† | 850 per 1000† | 401 per 1000† | HR 0.27 (0.21 to 0.34) | N = 925 | ⊕⊕⊕⊕ | ‐ |
| Tumour response | 82 per 1000 | 556 per 1000 | RR 6.78 (4.84 to 9.49) | N = 925 | ⊕⊕⊕⊕ | ‐ |
| Toxicity (≥ G3) | 341 per 1000 | 433 per 1000 | RR 1.27 (0.48 to 3.33) | N = 408 | ⊕⊕⊝⊝ | ‐ |
| * The basis for the assumed risk (e.g. the median control group risk across studies) is provided in footnotes. The corresponding risk (and its 95% confidence interval) is based on the assumed risk in the comparison group and the relative effect of the intervention (and its 95% CI). † Numbers presented refer to event rates (i.e. death rates and progression rates). | ||||||
| GRADE Working Group grades of evidence | ||||||
| Assumed risk in the control population: 1‐year overall survival rate = 40%. Assumed risk in the control population: 1‐year progression‐free survival rate = 15%. Assumed risk in the control population: tumour response rate across control arms of included trials. Assumed risk in the control population: toxicity rate across control arms of included trials. a Not downgraded: high‐quality evidence. b Downgraded by two levels: inconsistency (between‐study heterogeneity) and imprecision (CI includes both a meaningful harm (relative risk increase > 25%) and a meaningful benefit (relative risk reduction > 25%)). | ||||||
| MEK inhibitors compared with chemotherapy for the treatment of metastatic melanoma | ||||||
| Patient or population: people with cutaneous melanoma Settings: hospital (metastatic disease) Intervention: MEK inhibitors Comparison: chemotherapy | ||||||
| Outcomes | Illustrative comparative risks* (95% CI) | Relative effect | No of Participants | Quality of the evidence | Comments | |
|---|---|---|---|---|---|---|
| Assumed risk | Corresponding risk | |||||
| Chemotherapy | MEK inhibitors | |||||
| Overall survival† | 600 per 1000† | 541 per 1000† | HR 0.85 (0.58 to 1.25) | N = 496 | ⊕⊕⊝⊝ | ‐ |
| Progression‐free survival† | 850 per 1000† | 667 per 1000† | HR 0.58 (0.42 to 0.80) | N = 496 | ⊕⊕⊕⊝ | ‐ |
| Tumour response | 138 per 1000 | 277 per 1000 | RR 2.01 (1.35 to 2.99) | N = 496 | ⊕⊕⊕⊕ | ‐ |
| Toxicity (≥ G3) | 413 per 1000 | 665 per 1000 | RR 1.61 (1.08 to 2.41) | N = 91 | ⊕⊕⊕⊝ | ‐ |
| *The basis for the assumed risk (e.g. the median control group risk across studies) is provided in footnotes. The corresponding risk (and its 95% confidence interval) is based on the assumed risk in the comparison group and the relative effect of the intervention (and its 95% CI). † Numbers presented refer to event rates (i.e. death rates and progression rates). | ||||||
| GRADE Working Group grades of evidence | ||||||
| Assumed risk in the control population: 1‐year overall survival rate = 40%. Assumed risk in the control population: 1‐year progression‐free survival rate = 15%. Assumed risk in the control population: tumour response rate across control arms of included trials. Assumed risk in the control population: toxicity rate across control arms of included trials. a Downgraded by two levels: inconsistency (between‐study heterogeneity) and imprecision (CI includes both a meaningful benefit (relative risk reduction > 25%) and a harmful effect). b Downgraded by one level: inconsistency (between‐study heterogeneity). c Not downgraded: high‐quality evidence. d Downgraded by one level: imprecision (sample size lower than optimal information size, calculated to be equal to 400 participants). | ||||||
| BRAF plus MEK inhibitors compared with BRAF inhibitors for the treatment of metastatic melanoma | ||||||
| Patient or population: people cutaneous melanoma Settings: hospital (metastatic disease) Intervention: BRAF inhibitor plus MEK inhibitor (combo) Comparison: BRAF inhibitor | ||||||
| Outcomes | Illustrative comparative risks* (95% CI) | Relative effect | No of Participants | Quality of the evidence | Comments | |
|---|---|---|---|---|---|---|
| Assumed risk | Corresponding risk | |||||
| BRAF inhibitor | Combo | |||||
| Overall survival† | 350 per 1000† | 260 per 1000† | HR 0.70 (0.59 to 0.82) | N = 1784 | ⊕⊕⊕⊕ | ‐ |
| Progression‐free survival† | 700 per 1000† | 490 per 1000† | HR 0.56 (0.44 to 0.71) | N = 1784 | ⊕⊕⊕⊝ | ‐ |
| Tumour response | 494 per 1000 | 652 per 1000 | RR 1.32 (1.20 to 1.46) | N = 1784 | ⊕⊕⊕⊕ | ‐ |
| Toxicity (≥ G3) | 495 per 1000 | 500 per 1000 | RR 1.01 (0.85 to 1.20) | N = 1774 | ⊕⊕⊕⊝ | ‐ |
| * The basis for the assumed risk (e.g. the median control group risk across studies) is provided in footnotes. The corresponding risk (and its 95% confidence interval) is based on the assumed risk in the comparison group and the relative effect of the intervention (and its 95% CI). † Numbers presented refer to event rates (i.e. death rates and progression rates). CI confidence interval; HR: hazard ratio | ||||||
| GRADE Working Group grades of evidence | ||||||
| Assumed risk in the control population: 1‐year overall survival rate = 65%. Assumed risk in the control population: 1‐year progression‐free survival rate = 30%. Assumed risk in the control population: tumour response rate across control arms of included trials. Assumed risk in the control population: toxicity rate across control arms of included trials. a Not downgraded: high‐quality evidence. b Downgraded by one level: inconsistency (between‐study heterogeneity). | ||||||
| Anti‐angiogenic drugs plus chemotherapy compared with chemotherapy for the treatment of metastatic melanoma | ||||||
| Patient or population: people with cutaneous melanoma Settings: hospital (metastatic disease) Intervention: Anti‐angiogenic drug plus chemotherapy (combo) Comparison: chemotherapy | ||||||
| Outcomes | Illustrative comparative risks* (95% CI) | Relative effect | No of Participants | Quality of the evidence | Comments | |
|---|---|---|---|---|---|---|
| Assumed risk | Corresponding risk | |||||
| Chemotherapy | Combo | |||||
| Overall survival† | 600 per 1000† | 423 per 1000† | HR 0.60 (0.45 to 0.81) | N = 324 | ⊕⊕⊕⊝ | ‐ |
| Progression‐free survival† | 850 per 1000† | 730 per 1000† | HR 0.69 (0.52 to 0.92) | N = 324 | ⊕⊕⊕⊝ | ‐ |
| Tumour response | 104 per 1000 | 178 per 1000 | RR 1.71 (0.96 to 3.03) | N = 324 | ⊕⊕⊕⊝ | ‐ |
| Toxicity (≥ G3) | 272 per 1000 | 185 per 1000 | RR 0.68 (0.09 to 5.32) | N = 324 | ⊕⊕⊝⊝ | ‐ |
| * The basis for the assumed risk (e.g. the median control group risk across studies) is provided in footnotes. The corresponding risk (and its 95% confidence interval) is based on the assumed risk in the comparison group and the relative effect of the intervention (and its 95% CI). † Numbers presented refer to event rates (i.e. death rates and progression rates). | ||||||
| GRADE Working Group grades of evidence | ||||||
| Assumed risk in the control population: 1‐year overall survival rate = 40%. Assumed risk in the control population: 1‐year progression‐free survival rate = 15%. Assumed risk in the control population: tumour response rate across control arms of included trials. Assumed risk in the control population: toxicity rate across control arms of included trials. a Downgraded by one level: imprecision (sample size lower than optimal information size, calculated to be equal to 400 participants). b Downgraded by two levels: inconsistency (between‐study heterogeneity) and imprecision (sample size lower than optimal information size, calculated to be equal to 400 participants). | ||||||
| Biochemotherapy compared with chemotherapy for the treatment of metastatic melanoma | ||||||
| Patient or population: people with cutaneous melanoma Settings: hospital (metastatic disease) Intervention: biochemotherapy (chemotherapy combined with both interferon‐alpha and interleukin‐2) Comparison: chemotherapy | ||||||
| Outcomes | Illustrative comparative risks* (95% CI) | Relative effect | No of Participants | Quality of the evidence | Comments | |
|---|---|---|---|---|---|---|
| Assumed risk | Corresponding risk | |||||
| Chemotherapy | Biochemotherapy | |||||
| Overall survival† | 600 per 1000† | 577 per 1000† | HR 0.94 (0.84 to 1.06) | N = 1317 | ⊕⊕⊕⊕ | ‐ |
| Progression‐free survival† | 850 per 1000 ° | 818 per 1000† | HR 0.90 (0.83 to 0.99) | N = 964 | ⊕⊕⊕⊕ | ‐ |
| Tumour response | 192 per 1000 | 262 per 1000 | RR 1.36 (1.12 to 1.66) | N = 770 | ⊕⊕⊕⊕ | ‐ |
| Toxicity (≥ G3) | 631 per 1000 | 852 per 1000 | RR 1.35 (1.14 to 1.61) | N = 631 | ⊕⊕⊕⊕ | ‐ |
| *The basis for the assumed risk (e.g. the median control group risk across studies) is provided in footnotes. The corresponding risk (and its 95% confidence interval) is based on the assumed risk in the comparison group and the relative effect of the intervention (and its 95% CI). † Numbers presented refer to event rates (i.e. death rates and progression rates). | ||||||
| GRADE Working Group grades of evidence | ||||||
| Assumed risk in the control population: 1‐year overall survival rate = 40%. Assumed risk in the control population: 1‐year progression‐free survival rate = 15%. Assumed risk in the control population: tumour response rate across control arms of included trials. Assumed risk in the control population: toxicity rate across control arms of included trials. a Not downgraded: high‐quality evidence. | ||||||
| Polychemotherapy compared with chemotherapy for the treatment of metastatic melanoma | ||||||
| Patient or population: people with cutaneous melanoma Settings: hospital (metastatic disease) Intervention: polychemotherapy Comparison: chemotherapy | ||||||
| Outcomes | Illustrative comparative risks* (95% CI) | Relative effect | No of Participants | Quality of the evidence | Comments | |
|---|---|---|---|---|---|---|
| Assumed risk | Corresponding risk | |||||
| Chemotherapy | Polychemotherapy | |||||
| Overall survival† | 600 per 1000† | 596 per 1000† | HR 0.99 (0.85 to 1.16) | N = 594 | ⊕⊕⊕⊕ | ‐ |
| Progression‐freesurvival† | 850 per 1000† | 869 per 1000† (822 to 907) | HR 1.07 (0.91 to 1.25) | N = 398 (n = 5) | ⊕⊕⊕⊕ | ‐ |
| Tumour response | 143 per 1000 | 182 per 1000 | RR 1.27 (1.02 to 1.58) | N = 1885 | ⊕⊕⊕⊝ | ‐ |
| Toxicity (≥ G3) | 189 per 1000 | 372 per 1000 | RR 1.97 (1.44 to 2.71) | N = 390 | ⊕⊕⊕⊝ | ‐ |
| *The basis for the assumed risk (e.g. the median control group risk across studies) is provided in footnotes. The corresponding risk (and its 95% confidence interval) is based on the assumed risk in the comparison group and the relative effect of the intervention (and its 95% CI). † Numbers presented refer to event rates (i.e. death rates and progression rates). | ||||||
| GRADE Working Group grades of evidence | ||||||
| Assumed risk in the control population: 1‐year overall survival rate = 40%. Assumed risk in the control population: 1‐year progression‐free survival rate = 15%. Assumed risk in the control population: tumour response rate across control arms of included trials. Assumed risk in the control population: toxicity rate across control arms of included trials. a Not downgraded: high‐quality evidence. b Downgraded by one level: imprecision (CI includes both a meaningful benefit (relative risk increase > 25%) and a small/null benefit (relative risk increase < 10%)). c Downgraded by one level: imprecision (sample size lower than optimal information size, calculated to be equal to 400 participants). | ||||||
Background
A glossary of terms used is provided in Table 1.
| Term | Explanation |
|---|---|
| Actinomycin‐D | A polypeptide used as an antibiotic and antineoplastic agent as a result of its ability to inhibit transcription |
| AJCC TNM staging | This is the most widely used tumour staging classification system, which has been developed and constantly updated by the American Joint Committee on Cancer (AJCC) for describing the extent of disease progression in people with cancer. It uses in part the TNM scoring system: tumour size, lymph nodes affected, metastases. Individuals affected by specific tumour type are assigned to categories describing risk of death |
| AJCC TNM stage III | People at this disease stage have melanoma metastasis in their regional lymph node (i.e. the first lymph nodes draining the skin area affected by the melanoma) |
| AJCC TNM stage IIIC | Stage IIIC is a higher risk subgroup among people with lymph node metastasis. The category includes people with all primary tumour stages (T stages) and those with clinically positive lymph nodes, or 4 or more positive lymph nodes |
| AJCC TNM stage IV | People with this disease stage have melanoma metastasis to distant sites (e.g. lung, liver, brain, bone) |
| Anti‐angiogenic agents | Drugs aimed to disrupt tumour vascularisation and reduce blood supply to malignant cells; examples include bevacizumab and endostar |
| Antigen | A substance that invokes the body's immune response |
| Aranoza | An alkylating agent that is used as a chemotherapy drug for various cancers including melanoma as part of combination chemotherapy regimens |
| Bacille Calmette‐Guérin (BCG) | BCG is a vaccine used in the prevention of tuberculosis. However, it is also a form of cancer immunotherapy with established effects in superficial (non‐muscle invading) bladder cancer |
| Bevacizumab | Bevacizumab (Avastin) is an angiogenesis inhibitor approved for use for people with various metastatic cancers. Bevacizumab acts through blockade of vascular endothelial growth factor A (VEGF‐A) that prevents development of new vessels necessary for tumours to grow |
| Bleomycin | An antineoplastic agent used in chemotherapy regimens for various tumours. Belomycin acts through cleavage of DNA within cells |
| Biochemotherapy | A combination of chemotherapy plus immunostimulating cytokines, such as interleukin‐2 and interferon‐alpha |
| Bosentan | An endothelin receptor inhibitor that causes reduced DNA synthesis and promotes apoptosis through competitive antagonism with the anti‐apoptotic factor endothelin‐1, often secreted by cancer cells in an autocrine or paracrine manner |
| BRAF | A gene that makes a protein called B‐Raf. BRAF is involved in sending signals within cells that direct their growth. In some cancers, this gene has mutated (Melanoma Institute Australia 2017) |
| Carmustine | An alkylating agent that prevents DNA replication and cell proliferation used in chemotherapy for various cancers |
| Cobimetinib | An inhibitor of MAPK kinase (MEK) approved for use in metastatic melanoma with BRAF V600E/K mutation usually in combination with a BRAF inhibitor |
| Corynebacterium parvum | C parvum is an aerobic, gram positive bacterium that has been reported to have antineoplastic potential |
| Cyclophosphamide | An alkylating agent used in auto‐immune diseases and various tumours as a chemotherapy drug |
| Cytokine | Small proteins produced by a broad range of cells that are important in cell signalling; they are immunostimulating agents |
| Cytotoxic | Cell killing |
| CTLA4 (cytotoxic T‐cell lymphocyte‐associated antigen‐4) | CTLA4 is a receptor located on the surface of T‐cells that down regulates the immune system (an immune checkpoint). The inhibition of this receptor with monoclonal antibodies, such as ipilimumab and tremelimumab, 'unleashes' the immune response to fight against malignant cells |
| Dabrafenib | An inhibitor of the BRAF kinase that has been approved for people with advanced melanoma carrying the BRAF V600E mutation |
| Dacarbazine | A chemotherapy drug that belongs to the family of alkylating agents that is used in the treatment of various cancers, including melanoma |
| Dendritic cell | These are antigen‐presenting cells that link the innate to the adaptive immune systems via processing antigens and presenting them to T‐lymphocytes. Their role is crucial for proper functioning of vaccines, including cancer vaccines |
| Elesclomol | A drug that causes the accumulation of reactive oxygen species to trigger apoptosis in cancer cells via oxidative stress. It is approved for use for people with metastatic melanoma |
| Endostar | A modified recombinant human endostatin that acts as an anti‐angiogenic agent to prevent the formation of new blood vessels that are necessary for tumour growth and survival |
| Fotemustine | A chemotherapy drug that belongs to the family of alkylating agents and has been approved for the treatment of metastatic melanoma |
| G3 and G4 | G3 (grade 3) and G4 (grade 4) toxicity refers to the highest degree of adverse events due to a systemic treatment. This system grades the toxicity related to a given system or organ (e.g. hepatic, cardiac, haematologic) |
| gp100 | A known melanoma antigen that can be applied to develop a cancer vaccine through processing and presentation by dendritic cells to lymphocytes |
| Granulocyte macrophage ‐ colony‐stimulating factor (GM‐CSF) | A cytokine that stimulates stem cells to give rise to granulocytes and monocytes and boosts the immune system |
| Hydroxyurea | A chemotherapy agent that acts through reducing the generation of deoxyribonucleotides, the building blocks of DNA, to inhibit adequate synthesis of DNA. It is used as a chemotherapy drug for people with myeloproliferative disorders |
| Immune checkpoints | Signalling proteins that protect against auto‐immunity and regulate the immune response; these checkpoints can be hijacked by cancer cells to evade T‐cell‐mediated death, i.e. stopping an immune response to the tumour. CTLA4 and PD1 are both immune checkpoints |
| Immune checkpoint inhibitors | Drugs that override the signalling/activation of immune checkpoints to encourage cytotoxic T‐cell recognition of cancer (i.e. an immune response). These are monoclonal antibodies blocking either CTLA4 or PD1 (two immune checkpoints), known as anti‐CTLA4 and anti‐PD1 monoclonal antibodies |
| Immunomodulating | Stimulates or suppresses the immune system |
| Immunostimulating | Stimulates an immune response |
| Interferon‐alpha | Interferon‐alpha is used for the postoperative treatment of people with AJCC TNM stages II (primary tumour at high risk of disease progression with negative lymph nodes) and III (positive lymph nodes) and to enhance the efficacy of chemotherapy in those who have metastatic melanoma |
| Interleukin‐2 | Interleukin‐2 is a protein that regulates the activities of leucocytes (particularly lymphocytes) that are responsible for immunity. The receptor for interleukin‐2 is expressed by lymphocytes. A recombinant form of human interleukin‐2 has been approved by the FDA for the treatment of melanoma and renal cell cancer |
| Lomustine | An oral alkylating chemotherapeutic agent used mainly to treat brain tumours because it crosses the blood‐brain barrier |
| MEK | Mitogen‐activated protein kinase (MEK) is part of the MAPK signalling pathway (see 'RAS‐RAF‐MEK‐ERK pathway' below), which is activated in melanoma |
| Monoclonal antibodies | Monoclonal antibodies are a type of targeted drug therapy; they work by recognising and finding specific proteins on cancer cells (they work in different ways depending on the protein they are targeting) (Cancer Research UK 2017) |
| Oblimersen | A bcl‐2 antisense oligodeoxynucleotide that reduces cancer cell survival and proliferation by blocking the generation of the anti‐apoptotic protein bcl‐2 thus promoting programmed cell death in cancer cells |
| Oncogene | A gene thats activation or over expression favours cancer growth |
| Paclitaxel | A chemotherapy agent targeting the protein tubulin. The drug interferes with the dynamics of microtubule formation and breakdown leading to problems during cell division and triggering of apoptosis. DHA‐ and nab‐paclitaxel are modified forms of the drug |
| PD1 (programmed cell death protein‐1) | PD1 is a receptor located on the surface of the T‐cells that down regulates the immune system (an immune checkpoint). The inhibition of this receptor with monoclonal antibodies, such as nivolumab and pembrolizumab, 'unleashes' immune response to fight against malignant cells |
| PF‐3512676 | An synthetic oligonucleotide that acts as a Toll‐like receptor‐9 (TLR‐9) agonist. It is used as an immunomodulatory agent alone, or in combination with chemotherapy, to boost anti‐tumour effects by enhancing B‐cell proliferation and antigen‐specific antibody production and cytokine secretion |
| Polychemotherapy | A combination of multiple chemotherapeutic agents |
| Procarbazine | An alkylating agent used as an antineoplastic chemotherapy drug in various tumours such as glioblastoma multiforme and Hodgkin's lymphoma |
| Programmed death‐1 (PD‐1) | PD‐1 is an inhibitory receptor located on the surface of the T‐cells that down regulates the immune system when bound by its ligands (PD‐L1 and PD‐L2, often found on cancer cells). The inhibition of this receptor with monoclonal antibodies, such as pembrolizumab and nivolumab, releases the brake on immune cells thus allowing them to freely fight malignant cells |
| Ramucirumab | A human monoclonal antibody that targets the vascular endothelial growth factor receptor 2 (VEGFR2) to block VEGF binding and thus inhibit angiogenesis. It is approved for use in advanced gastric adenocarcinoma and metastatic non‐small cell lung carcinoma |
| RAS‐RAF‐MEK‐ERK pathway | This is also known as 'MAPK/ERK pathway', which is a chain of proteins in the cell that communicates a signal from a receptor on the surface of the cell to the nucleus of the cell (where DNA is located). When one of the proteins in the pathway is mutated, it can be stuck in the 'on' or 'off' position, which is a necessary step in the development of many cancers, including melanoma. Drugs, such as BRAF and MEK inhibitors, can reverse this switch |
| Small‐molecule inhibitors | Low molecular weight drugs targeting molecules mutated or overexpressed in tumours; examples include BRAF inhibitors (which block the BRAF protein) or MEK inhibitors (which block the MEK protein) |
| Sorafenib | An inhibitor of various tyrosine protein kinases including RAF |
| Selumetinib | An inhibitor of the MAPK kinase (MEK) downstream of BRAF |
| T‐cell | A white blood cell type, which plays a key role in immunity |
| Tasisulam | A small‐molecule agent that induces apoptosis through the intrinsic mitochondrial pathway |
| Tamoxifen | A cytostatic hormonal therapeutic agent used mainly as a treatment for oestrogen receptor positive breast cancer. Tamoxifen acts through competing with oestrogen for its receptor thus reducing oestrogen‐related effects in breast tissue such as DNA synthesis and cell proliferation |
| Temozolomide | An oral alkylating agent that can be used in chemotherapy regimens for various cancers such as glioblastoma multiforme |
| Trametinib | An inhibitor of MAPK kinase (MEK) 1 and 2 approved for use in people with V600E‐mutated metastatic melanoma |
| Vemurafenib | A small‐molecule inhibitor of mutated BRAF, an oncogene involved in cell survival or proliferation |
| Vincristine | An anti‐mitotic agent that binds tubulin thus preventing cell proliferation and triggering apoptosis |
| Vindesine | An anti‐mitotic agent that acts by targeting microtubules and preventing cell division thus useful as a chemotherapy drug in various cancers |
| Vitespen | A tumour‐derived heat shock protein that is used as an adjuvant in cancer immunotherapy |
Description of the condition
Cutaneous melanoma is one of the deadliest forms of skin cancer. According to epidemiological data provided by the International Agency for Research on Cancer (IARC), its worldwide incidence in 2008 was estimated to be 199,627 new cases, with 46,372 deaths (Ferlay 2010). In the USA, cutaneous melanoma ranked fifth in men (44,250 new cases per year, representing 5% of all cancers) and sixth in women (32,000 new cases per year, representing 4% of all cancers) among all tumour histotypes (Siegel 2012). The highest incidence is observed in Australia and New Zealand where melanoma is the fourth most commonly diagnosed cancer (Australian and New Zealand 2008).
Melanoma incidence differs widely across Europe, ranging from 19.2/100,000 persons per year in Switzerland to 2.2/100,000 persons per year in Greece (Forsea 2012). As well as geographical differences, melanoma incidence has been increasing worldwide over the past 30 years at a greater pace than any other malignancy (Little 2012; Siegel 2012), which makes its management a key issue for national healthcare systems. Melanoma is potentially curable in the early stages with the surgical removal of the primary tumour (McKinnon 2005; Mocellin 2011; Pasquali 2013; Sladden 2009).
Once melanoma metastasises (i.e. spreads to lymph nodes, distant organs or both) due to its intrinsic biological aggressiveness and its typical resistance to medical therapy (both chemotherapy and radiotherapy) (Serrone 1999), survival is poor or very poor, with a median overall survival of 24 months for those with American Joint Committee on Cancer (AJCC) TNM stage IIIC disease (unresectable lymph node metastasis), and nine months for people with AJCC TNM stage IV disease (distant metastasis) (Balch 2001; Balch 2009). Overall, fewer than 35% (AJCC TNM stage IIIC) and 12% (AJCC TNM stage IV) of these people are still alive five years after their diagnosis (Balch 2001; Balch 2009).
Metastatic cutaneous melanoma (unresectable AJCC TNM stage IIIC and stage IV) is usually treated with systemic medical therapy (Garbe 2011), and is characterised by a dismal prognosis (median overall survival usually ranges between 10 and 16 months, Balch 2009). Surgery is feasible only in very few select cases showing a very limited tumour burden (Gyorki 2013; Wevers 2013), and radiotherapy is considered only for symptom palliation (Stevens 2006; Testori 2009).
New insights into the prognosis of people with metastatic melanoma come from molecular profiling of primary tumour and distant metastases. Recently, molecular studies have identified aberrant activation of the mitogen‐activated protein kinase (MAPK) pathway and mutations in proteins along the RAS‐RAF‐MEK‐ERK pathway (Figure 1) in cutaneous (50% BRAF‐mutated, 15% NRAS‐mutated, and up to 17% c‐Kit‐mutated in chronically sun damaged people) and mucosal melanoma (11% BRAF‐mutated, 5% NRAS‐mutated, 21% c‐Kit‐mutated) (Scolyer 2011). Determination of the mutational status of a melanoma enables identification of those who may be suitable for new treatments, such as BRAF and c‐Kit inhibitors.

RAS‐RAF‐MEK‐ERK pathway. Copyright © 2018 Claire Gorry: reproduced with permission.
Description of the intervention
Until 2011, conventional treatment for those who have metastatic melanoma included the chemotherapeutic alkylating agent dacarbazine (and its orally available derivative, temozolomide) and the immunostimulatory cytokine, interleukin‐2 (approved for metastatic melanoma treatment only in the USA). However, neither drug has been shown to provide any significant survival benefit in a randomised controlled trial (RCT) (Garbe 2011). When dacarbazine was associated with other chemotherapeutic agents (polychemotherapy) or immunostimulatory cytokines such as interferon‐alpha or interleukin‐2 (biochemotherapy), only some improvement in tumour response without any survival advantage was reported (Ives 2007).
Different immunotherapy regimens (including biotherapy and vaccination regimens) can lead to tumour shrinkage and confer a durable and complete response in some people who have this condition. This prompted investigators to test newer immunomodulating agents including the immune checkpoint inhibitor ipilimumab, a monoclonal antibody blocking the T‐cell lymphocyte‐associated antigen‐4 (i.e. CTLA4, a co‐inhibitory molecule involved in the control of immune responses mediated by T‐lymphocytes) (Kirkwood 2008; Kirkwood 2012; Mocellin 2013b). In 2010, the anti‐CTLA4 strategy was the first treatment demonstrated to be associated with a survival advantage for people with metastatic melanoma (Hodi 2010).
The breakthrough results obtained with anti‐CTLA4 monoclonal antibodies have changed the perspective of melanoma therapy along with another pivotal discovery, which is the impressive tumour response rates (up to 90%) observed with vemurafenib (a small‐molecule inhibitor of mutated BRAF, an oncogene involved in cell survival or proliferation) (Arkenau 2011) in participants with metastatic melanoma harbouring BRAF activating mutations (Flaherty 2012; Long 2012; Sosman 2012).
Agents that have been tested in RCTs for the systemic treatment of metastatic melanoma can be categorised into five main groups based on their predominant mechanism of action (Garbe 2011; Ives 2007; Kirkwood 2012; Arkenau 2011):
-
conventional chemotherapy (which act mainly through DNA damage);
-
biochemotherapy (combination of chemotherapy plus immunostimulating cytokines);
-
immune checkpoint inhibitors (which override the signalling/activation of immune checkpoints, which have been hijacked by cancer cells to evade T‐cell‐mediated death, thus stimulating the immune system against malignant cells);
-
small‐molecule targeted drugs (which inhibit the protein products of oncogenes specifically activated in malignant cells); and
-
a miscellany of other treatments (such as anti‐angiogenic drugs, which inhibit cancer vascularisation).
Conventional chemotherapy
Dacarbazine has been the mainstay of metastatic melanoma therapy (and thus the reference drug for this disease) for over three decades. Dacarbazine was approved for the treatment of metastatic melanoma by the USA Food and Drug Administration (FDA) in 1975, although its efficacy in terms of survival has never been proven in a RCT (Crosby 2000; Huncharek 2001). Dacarbazine is an alkylating agent that produces DNA damage by adding a methyl group to the guanine base in the O6 position. Ultimately, the DNA damage caused by dacarbazine is believed to prompt programmed cell death (apoptosis) (National Toxicology Program 2011). Several trials have tested the hypothesis that dacarbazine‐based polychemotherapy regimens might be more effective than dacarbazine alone; however, these trials showed only some improvement in tumour response rates without showing any convincing survival benefit (Bajetta 2006; Ridolfi 2002). These disappointing results led people to consider cutaneous melanoma as one of the most chemoresistant tumours in humans (La Porta 2007; La Porta 2009).
Biochemotherapy
In the oncology field, the term 'biotherapy' generally refers to the use of cytokines to treat cancer. We focused on two cytokines that have been extensively tested for the treatment of people with melanoma: interferon‐alpha and interleukin‐2.
Interferon‐alpha was the first cytokine that demonstrated activity in metastatic melanoma, with 10% to 20% tumour response being observed (Belardelli 2002; Schadendorf 2009). The main mechanism of action of interferon‐alpha is immunostimulation, although other mechanisms have been hypothesised (antiproliferative, differentiation‐inducing, pro‐apoptotic, and anti‐angiogenic) (Pasquali 2010). Interferon‐alpha is the only drug currently approved for the adjuvant (i.e. postoperative) treatment of melanoma after radical removal of regional lymph‐node metastasis by surgery (AJCC TNM stage III) (Eggermont 2009; Garbe 2011; Mocellin 2010; Mocellin 2013).
Interleukin‐2 is an immunostimulant cytokine mainly involved in T‐cell proliferation (Kirkwood 2012). When tested in people with metastatic melanoma, interleukin‐2 showed a 15% to 20% response rate (4% of long‐term responses) (Schwartzentruber 2011; Tarhini 2005). Interleukin‐2 treatment is burdened by a remarkable (although reversible) toxicity usually requiring hospitalisation (and sometimes admission to an intensive care unit) for management.
Biotherapy agents have been coupled with chemotherapy agents (a combination called biochemotherapy) and compared to chemotherapy alone (Ives 2007). Generally, biochemotherapy has shown higher tumour response rates compared to chemotherapy, but significant improvement in survival of people with metastatic melanoma does not appear to be achievable with this approach (Hamm 2008; Keilholz 2002).
Immune checkpoint inhibitors
Melanoma is considered to be a form of immunogenic tumour (able to produce an immune response) on the basis of some spontaneously occurring melanoma regressions and some durable tumour responses observed after treatment with a variety of immunostimulating agents (Kirkwood 2008; Kirkwood 2012). The higher mutation rate observed in primary and metastatic melanoma compared with other tumour types has been suggested as the mechanism behind melanoma immunogenicity (Mocellin 2003). In particular, mutated proteins might represent tumour‐specific antigens (a substance that invokes the body's immune response) that can be selectively recognised by the immune system on melanoma cells. Moreover, melanoma cells often express epitopes derived from proteins involved in melanin synthesis, which makes them suitable for tumour‐selective immune treatment (Mocellin 2009).
Several attempts have been made to activate the immune system against cancer cells. However, it appears evident that tumours can easily elude both naturally occurring and vaccine‐elicited immune surveillance (Mocellin 2008) and metastasise to distant sites. Therefore, investigators have turned their attention to these mechanisms of tumour‐immune escape. It has been found that malignant cells can evade the body's natural immune response through immunosuppressive circuits whose activity is mediated by specific molecules (such as CTLA4 and PD1) collectively named immune checkpoints (Hamid 2013; Mocellin 2013a; Ribas 2013).
Therefore, a new paradigm in cancer treatment emerged when investigators found that anti‐CTLA4 monoclonal antibodies (e.g. ipilimumab) can improve the survival of people with metastatic melanoma by inhibiting the CTLA4 checkpoint and ultimately unleashing the immune response against malignant cells (Hodi 2010). Since then, several RCTs have been conducted or are under way out to test the efficacy of this new strategy in melanoma (Robert 2011) as well as in non‐melanoma cancers (Kirkwood 2012).
Small‐molecule targeted drugs
Although the expression 'targeted therapy' usually refers to a variety of therapeutic strategies selectively targeting cancer‐specific molecular derangements, for the sake of clarity regarding treatment classification, we exclusively referred to the use of small‐molecule inhibitors of oncogenes specifically activated in malignant melanoma cells (Mocellin 2010a; Thompson 2009).
Molecular biological studies have demonstrated that melanoma cells harbour a range of gene or protein alterations that can be targeted to develop tumour‐specific therapies (Thompson 2009). For instance, about 65% of melanomas harbour mutations affecting the RAS‐RAF‐MEK‐ERK pathway (Davies 2002; Long 2011). The drugs (small‐molecule inhibitors) targeting this pathway, such as sorafenib (a RAF inhibitor) and selumetinib (a MEK inhibitor), showed limited antitumour activity in participants with metastatic melanoma (Flaherty 2013; Hauschild 2009; Kirkwood 2012a). In contrast, high tumour response rates (up to 90%) were observed when BRAF inhibitors (with or without MEK inhibitors) were tested in people with metastatic melanoma harbouring activating mutations of the BRAF gene (the most common is known as V600E because the amino acid valine (V) is substituted by glutamic acid (E) at position 600 of the protein BRAF) (Hauschild 2012; McArthur 2014). These mutations constitutionally activate the BRAF kinase, which ultimately stimulates cell proliferation and opposes apoptosis (therefore, mutated BRAF acts as an oncogene). Although complete responses are uncommon (< 5%), these drugs prolong the survival of those who have BRAF‐mutated metastatic melanoma (compared to traditional dacarbazine treatment) (Sosman 2012). After this breakthrough discovery, several RCTs have been completed and others are under way to test the efficacy of this new strategy in melanoma as well as in non‐melanoma cancers harbouring the mutated version of BRAF as well as other molecular derangements (Klein 2013; Menzies 2013). Similarly, c‐Kit inhibitors have been tested in people with metastatic melanoma harbouring activating mutations of the c‐Kit protein kinase (Guo 2011; Scolyer 2011).
Other treatments (including anti‐angiogenic drugs)
Other strategies have been investigated to treat metastatic melanoma, which cannot be classified to the nominated five drug classes. For instance, as in the field of infectious diseases, vaccines (such as those targeting gp100, a melanoma associated antigen) can be used to manipulate the host immune system to elicit a tumour‐specific immune response against malignant tumours (Mocellin 2005). This strategy, known as active‐specific immunotherapy because it chiefly involves the adaptive immune response, has long been tested in oncology, mainly in people with cutaneous melanoma (Mocellin 2004). Despite the promising preclinical evidence and the variety of vaccination regimens tested so far, no vaccine formulation has been proven to significantly change the natural history of metastatic melanoma (Chi 2011). However, in 2011, a RCT showed that the combination of a gp100‐based vaccine with interleukin‐2 provided a survival advantage for people who have metastatic melanoma (Schwartzentruber 2011). Other immunostimulating agents, such as naturally occurring growth factors (e.g. granulocyte and macrophage colony stimulating factor (GM‐CSF)) and bioproducts from bacteria (e.g. Bacillus Calmette‐Guérin (BCG) and Corynebacterium parvum), have been tested in clinical trials, usually in combination with other agents, but results have generally been unsatisfactory (Mocellin 2008).
Promising results have been recently reported with anti‐angiogenic agents, a class of drugs aimed to reduce blood supply to malignant cells (Ashour 2017). This approach has been proven to be effective against a variety of tumour types, such as colorectal cancer (Jayson 2016), but investigation in those with melanoma is still in its infancy (Cui 2013; Kim 2012).
A miscellany of anticancer agents have also been tested in association with chemotherapy to increase the efficacy of conventional cytotoxic drugs. Among these agents there are anti‐oestrogenic drugs (e.g. tamoxifen, a medication widely used against breast cancer) (Jager 2015), multi‐kinase inhibitors (e.g. sorafenib, a small‐molecule inhibitor approved for the treatment of different solid tumours such as kidney carcinoma) (Gentile 2017), and drugs with pro‐apoptotic properties (e.g. elesclomol, a compound supposed to increase the activity of chemotherapy by generating reactive oxygen species) (Caino 2016).
Why it is important to do this review
Many systemic treatments have been and continue to be tested for the management of metastatic cutaneous melanoma, although only recent results appear to provide affected people with new hope to improve life expectancy. No systematic reviews or meta‐analyses have been performed on all systemic therapies tested so far for the treatment of metastatic skin melanoma. Two previous Cochrane Reviews (Crosby 2000; Sasse 2007) partially covered the chemotherapy (chemotherapy versus best supportive care) and the biochemotherapy (biochemotherapy versus chemotherapy) fields, respectively. This review updates both previous Cochrane Reviews and broadened the scope. Since the reviews were published, many trials have been conducted to test new chemotherapeutic regimens based on conventional cytotoxic chemotherapeutics; traditional immunotherapy (e.g. interleukin‐2, interferon‐alpha); and most of all, new agents, including co‐inhibitory molecular inhibitors (such as the anti‐CTLA4 or anti‐PD1 monoclonal antibodies) and small molecular inhibitors (such as BRAF and MEK inhibitors).
Therefore, it is of utmost importance to provide physicians (especially oncologists and dermatologists) and investigators involved in melanoma treatment and research with a systematic assessment, and where feasible, meta‐analysis of the available evidence regarding the therapeutic regimens tested in RCTs to date. We planned to descriptively and quantitatively summarise the evidence in this field and provide readers with coverage of the therapeutic efficacy as well as toxicity, quality of life, and economic burden issues.
A protocol for this review has been published (Pasquali 2014). Gorry 2018 (currently at protocol stage) will assess neoadjuvant treatment for malignant and metastatic cutaneous melanoma.
Objectives
To assess the beneficial and harmful effects of systemic treatments for metastatic cutaneous melanoma.
Methods
Criteria for considering studies for this review
Types of studies
Randomised controlled trials (RCTs) testing systemic therapies for the treatment of metastatic cutaneous melanoma.
Types of participants
People with unresectable lymph node metastasis (AJCC TNM stage IIIC) and distant metastatic (AJCC TNM stage IV) cutaneous melanoma. No restrictions in terms of age, sex, drug dosage, radiologic examination, or treatment duration were applied.
Types of interventions
We considered all comparisons of systemic therapies for the treatment of metastatic cutaneous melanoma, including:
-
polychemotherapy (experimental arm) versus single‐agent chemotherapy (comparator arm);
-
biochemotherapy (experimental arm) versus chemotherapy (comparator arm);
-
immune checkpoint inhibitors (experimental arm) versus any other agent (comparator arm);
-
small‐molecule targeted drugs (experimental arm) versus any other agent (comparator arm);
-
chemotherapy plus other agents (e.g. anti‐angiogenic drugs) (experimental arm) versus chemotherapy alone (comparator arm); and
-
other comparisons (e.g. single agent chemotherapy verus other single agent chemotherapy).
Types of outcome measures
Primary outcomes
-
Overall survival: defined as time from randomisation until death from any cause (effect measure: hazard ratio (HR)).
-
Progression‐free survival: defined as time from randomisation until diagnosis of disease recurrence (local or distant/metastatic) (effect measure: HR).
-
Toxicity: defined as the occurrence of grade 3 (G3) or higher adverse events according to the World Health Organization (WHO) scale (Brundage 1993) (effect measure: relative risk (RR)).
Secondary outcomes
-
Tumour response: defined as incidence of complete plus partial tumour response according to WHO or Response Evaluation Criteria In Solid Tumors (RECIST) criteria (Therasse 2002) (effect measure: RR).
-
Quality of life (since there are no standardised disease‐specific scales and questionnaires to assess the quality of life of people with cutaneous melanoma, we described findings from studies).
-
Economic evaluation (expressed as cost‐utility analysis with the quality‐adjusted life years (QALYs)).
Search methods for identification of studies
We aimed to identify all relevant RCTs regardless of language or publication status (published, unpublished, in press, or in progress).
Electronic searches
We searched the following databases up to 4 October 2017:
-
the Cochrane Skin Group Specialised Register using the search strategy 'melanoma and (metastatic or metastas* or "stage iv" or "stage 4")';
-
the Cochrane Central Register of Controlled Trials (CENTRAL) 2017, Issue 9, in the Cochrane Library using the strategy in Appendix 1;
-
MEDLINE via Ovid (from 1946) using the strategy in Appendix 2;
-
Embase via Ovid (from 1974) using the strategy in Appendix 3; and
-
LILACS (Latin American and Caribbean Health Science Information database, from 1982) using the strategy 'melanoma and metasta$'.
We also searched the American Society of Clinical Oncology (ASCO) database up to February 2017 using the terms "melanoma", "randomised" and "metastatic".
Trials registers
We searched the following trials registers up to February 2017 using the key words "melanoma" and "randomised":
-
ISRCTN registry (www.isrctn.com);
-
ClinicalTrials.gov (www.clinicaltrials.gov);
-
Australian New Zealand Clinical Trials Registry (www.anzctr.org.au);
-
World Health Organization International Clinical Trials Registry Platform (ICTRP) (apps.who.int/trialsearch/); and
-
EU Clinical Trials Register (www.clinicaltrialsregister.eu).
Searching other resources
References from included studies
We checked the references of included studies for further references to relevant trials.
Adverse effects
We did not perform a separate search for adverse effects of the target interventions. However, we examined data on adverse effects from the included studies we identified.
Data collection and analysis
Selection of studies
Two review authors (SM and SP) selected trials independently by checking the titles and abstracts identified using the search methods described. The same two review authors retrieved the full text of all possibly relevant studies and assessed the eligibility of each study. We resolved discordant evaluations by discussion to reach consensus. We included trials with mixed disease stages if they reported outcomes separately for metastatic disease.
Data extraction and management
Two review authors (SM and SP) independently compared similarity among studies eligible for inclusion in terms of interventions and outcomes. The same two review authors also extracted relevant data for colation in a database. Review authors extracted the following details were extracted using a data extraction form that had been piloted previously:
-
Trial methods, sequence generation, method of concealment of allocation, masking of participants, trialists, and outcome assessors, exclusion of participants after randomisation, proportion and reasons for losses at follow up.
-
Participants' country of origin and study setting, sample size, tumour stage, inclusion and exclusion criteria.
-
Intervention group, type of treatment, dose and frequency, duration of intervention and follow up.
-
Control group, type of treatment, dose and frequency, duration of intervention and follow up.
-
Outcomes: primary and secondary outcomes as specified in Types of outcome measures.
A third review author (AH) independently verified the extracted data. We resolved discordant evaluations on all data necessary for the final analysis by discussion and final consensus. The review authors were not blinded to the names of trial authors, journals where the trial results were published, or institutions where the trials were conducted. In case of multiple publications reporting on the same RCT, we chose the most recent and complete publication.
Assessment of risk of bias in included studies
Two review authors (SM and SP) independently assessed the included studies in accordance with the Cochrane Handbook for Systematic Reviews of Interventions (Higgins 2011). The review authors compared their evaluations and resolve possible inconsistencies.
We assessed the risk of bias in included trials by considering the following aspects:
-
the method of generation of the randomisation sequence;
-
the method of allocation concealment;
-
the blinding of participants, clinicians, and outcome assessors;
-
the presence of incomplete outcome data; and
-
selective outcome reporting.
This information is recorded in a 'Risk of bias' table, which is part of the Characteristics of included studies table for each study.
We reported the risk of bias for each study in accordance with the Cochrane Handbook for Systematic Reviews of Interventions:
-
low risk of bias (plausible bias unlikely to seriously alter the results) if all criteria were met;
-
unclear risk of bias (plausible bias that raises some doubt about the results) if one or more criteria were assessed as unclear; or
-
high risk of bias (plausible bias that seriously weakens confidence in the results) if one or more criteria were not met.
Measures of treatment effect
Overall survival and progression‐free survival
We measured the treatment effect on participant survival as hazard ratios (HR), which is defined as the ratio between the risk of event in the experimental arm and the same risk in the comparator arm participants. We reported each HR along with its 95% confidence interval (CI). HR values lower or greater than one indicate a favourable or unfavourable effect of the experimental versus the comparator treatment, respectively.
We extracted all available summary statistics from all reports of the included trials for the outcome measures considered. We extracted HRs directly from original studies when reported; if unreported, we calculated HRs from Kaplan‐Meier survival curves using dedicated methods (Parmar 1998; Tierney 2007). Whenever feasible, unadjusted HRs were used.
As well as HRs (which is a relative measure of treatment effect), we also provided readers with an absolute measure of treatment effect. To achieve this aim, we used the calculated summary HRs (obtained from meta‐analysis of eligible trials) and the one‐year overall (or progression‐free) survival rate in the control population of participants with metastatic cutaneous melanoma; we then calculated the mortality (or progression) rates in the experimental and control groups (reported in 'Summary of findings' tables) using methods described by Altman (Altman 1999; Altman 2002). Briefly, if at some specified time (t) the survival probability in the control group is Sc(t), then the survival probability in the active group is [Sc(t)]h, where h is the meta‐analysis HR comparing the treatment groups: mortality rates are then simply calculated as 1‐S. These absolute risks (events rates) can be used to simply calculate the absolute risk reduction (ARR = event rate for experimental treatment minus event rate for comparison treatment), which can be in turn used to calculate the number needed to treat for an additional beneficial outcome (NNTB = 1/ARR) (Higgins 2011).
In the event that some studies presented their findings as odds ratios (OR) for death at different time points (rather than reporting the preferred measure HR) (Case 2002), we considered the reported OR as surrogate measure of treatment effect on the survival outcome of interest; we then used sensitivity analysis to investigate the potential influence of this suboptimal measure of treatment effect on the results of meta‐analysis of time‐to‐event (survival) data.
Tumour response
We measured the treatment effect on tumour response as risk ratio (RR), that is, the ratio between the overall response rate in the experimental arm and that in the comparator arm. According to this definition, the RR corresponds to the rate of complete or partial responses in the experimental treatment compared to the comparator. We reported each RR along with its 95% CI. RR values higher or lower than one indicate a favourable or unfavourable effect of the experimental versus the comparator treatment, respectively.
Toxicity
We measured the treatment effect on treatment‐related side‐effects (toxicity) as RR, that is, the ratio between the toxicity rate in the experimental arm and that in the comparator arm. We reported each RR along with its 95% CI. RR values lower or higher than one indicate a favourable or unfavourable effect of the experimental versus the comparator treatment, respectively.
Quality of life and economic analysis
We expected that no homogeneous data would be available from the literature for quality of life because of the lack of a melanoma‐specific questionnaire. Lack of homogeneity may prevent pooling of data; in this case, we descriptively reported data.
When dealing with economic analysis, we considered cost‐utility analysis with quality‐adjusted life years.
Unit of analysis issues
Cross‐over and cluster‐design trials
Because cross‐over trials (where each participant is allocated not to a single intervention ‐ as happens in parallel group trials ‐ but to a sequence of treatments) are typically used to assess treatments with a temporary effect in the management of stable (i.e. chronic) disease, we did not expect to find cross‐over trials dedicated to the treatment of metastatic melanoma, usually (and unfortunately) a rapidly evolving condition. However, we did not want to exclude these types of studies a priori, should any have been found. Such trials would require special methods to be included in a meta‐analysis (e.g. considering the findings specific for the first treatment, if available) to avoid the 'carry over' effect (i.e. the impact of the second treatment may be affected by a the effect of the first treatment), as recommended by the Cochrane Handbook for Systematic Reviews of Interventions (Higgins 2011). Moreover, sensitivity analysis to asses the impact of such design trials on summary effects would be performed.
Similarly, although we were unaware of cluster design trials, we did not want to exclude these types of studies a priori, should any have been found. In this case, sensitivity analysis to asses the impact of such design trials on summary effects would have been performed.
Studies with multiple treatment groups
For multiple‐arm trials that compared two (or more) experimental arms with the same control arm, we took within‐study correlation into consideration as suggested in the Cochrane Handbook for Systematic Reviews of Interventions (Higgins 2011). We computed a composite effect size for the comparison of each experimental arm versus the control arm; we then calculated the correlation factor (r) based on the number of cases in each arm, which enabled us to compute the variance (V) of the composite effect size, as suggested by Borenstein and Higgins (Borenstein 2009). Using this variance, we computed the standard error and then the 95% CI of the composite effect.
Network meta‐analysis
Given that direct comparisons between key therapies had not been published (e.g. immune checkpoint inhibitors versus small‐molecule targeted drugs), we used the network meta‐analysis methodology to compute estimates of indirect comparisons and generate treatment ranking (Cipriani 2013; Mills 2013). To perform this network meta‐analysis, studies need to satisfy the principle of transitivity. For instance, indirect comparisons can be performed when different trials share the same participant population in terms of first‐ or second‐line treatment and presence or absence of severe clinical conditions, such as brain metastasis. We then evaluated consistency (i.e. heterogeneity) within loops (e.g. for a comparison between therapies A and B, the included study must have directly compared A and B and both treatments with a third common comparator, C) using the methods for assessing heterogeneity as described. We used a random‐effects model to estimate HR (progression‐free survival and overall survival) and RR (tumour response and toxicity). We also used multivariate random‐effects meta‐regression to estimate consistency and inconsistency. We performed analyses using the 'mvmeta' package (Chaimani 2013; White 2011) for Stata (Stata 2017).
Dealing with missing data
We contacted trial authors for clarification where data were missing or unclear.
We extracted results for intention‐to‐treat analysis whenever provided. In studies reporting per‐protocol analysis results only, we performed an available‐case analysis.
Assessment of heterogeneity
We assessed the consistency of results (effect sizes) among studies using the two standard heterogeneity tests: the Chi² based Cochran Q‐test and the I² statistic (Higgins 2011). To be more conservative, we considered that heterogeneity was statistically substantial when the Cochran Q‐test P value was less than 0.1 (i.e. the alpha level of significance for this test was set at 10%). In addition, we considered inconsistency across studies as low, moderate, and high for I² statistic values lower than 25%, between 25% and 50%, and greater than 50%, respectively. We considered heterogeneity as significant when the I² statistic was greater than 50%, the Q‐test P value was less than 0.1, or both. We applied the random‐effects model to calculate the overall effect (which assumes that studies do not share the same common effect and assigns a weight to each study taking into account both within‐study and between‐study variance), using the inverse‐variance method.
Assessment of reporting biases
We planned to construct funnel plots to detect publication and small study effect biases if we included at least 10 studies in meta‐analysis (Borenstein 2009; Higgins 2011). We planned to investigate funnel plot asymmetry with the Egger linear regression approach and the Begg rank correlation test (these tests will be considered statistically significant for P values less than 0.1). To avoid duplicate study bias, we only considered the study with the longest follow‐up length when multiple reports for the same trial were available.
Data synthesis
Two review authors (SM and SP) performed all meta‐analyses according to the guidelines reported in Chapter 9 of the Cochrane Handbook for Systematic Reviews of Interventions (Higgins 2011).
For time‐to‐event (i.e. survival) outcomes, we used RevMan 5.3 (RevMan 2014) to estimate pooled HRs and 95% CIs using the random effects model (Borenstein 2009; Higgins 2011).
For binary outcomes, we used RevMan 5.3 to estimate pooled RRs and 95% CIs using the random effects model.
For the network meta‐analysis we used the 'mvmeta' package (Chaimani 2013; White 2011) for Stata (Stata 2017).
We planned to include at least one 'Summary of findings' table for the primary outcomes for the most important comparison. We also planned inclusion of further 'Summary of findings' tables where there were several major comparisons or need to summarise findings for different populations. We used the GRADE approach to assess the quality of evidence for all primary and key secondary outcomes for all main comparisons. We considered downgrading evidence based on five domains: risk of bias, inconsistency, imprecision, indirectness; and publication bias. Overall quality of evidence could be assessed as high, moderate, low or very low (Guyatt 2008; Higgins 2011).
Subgroup analysis and investigation of heterogeneity
We performed subgroup analysis and meta‐regression to investigate potential sources of between‐study heterogeneity. Planned subgroups or covariates included: year of publication, untreated or previously treated distant metastasis, inclusion or exclusion of brain metastasis, and duration of follow‐up. Further details of investigation of heterogeneity are presented in Assessment of heterogeneity.
Sensitivity analysis
We investigated potential sources of between‐study heterogeneity by excluding trials at high risk of bias and each single trial to ascertain their role in affecting summary statistics.
Results
Description of studies
Results of the search
The database searches (see Electronic searches) retrieved 4303 records. We also identified 19 ongoing studies (see Characteristics of ongoing studies). We excluded 4157 references based on titles and abstracts. We obtained the full text of the remaining 146 studies. We excluded 24 studies (see Characteristics of excluded studies), and included 122 studies (Characteristics of included studies). See the study flow diagram for a full description of our screening process (Figure 2).

Study flow diagram.
Included studies
Review findings were based on data reported in the full‐text reports of the 122 included randomised controlled trials (RCTs). Descriptions of studies are presented in Characteristics of included studies.
Design
Most included studies were phase III RCTs (n = 76, 62%) or phase II RCTs (n = 41, 34%). We also included one phase I RCT and RCTs with mixed designs (n = 4, 3%). All trials were designed as parallel‐group studies (neither cross‐over trials nor cluster design trials were found for inclusion).
Double‐blinding design was employed in 23 trials (19%) (Cui 2013; Eisen 2010; Flaherty 2013a; Glaspy 2009; Gupta 2014; Hauschild 2009a; Hodi 2010a; Kefford 2010; Kim 2012; Larkin 2015; Lawson 2015; Long 2015; McDermott 2008; Middleton 2015; O'Day 2009; O'Day 2011; O'Day 2013; Postow 2015; Robert 2011; Robert 2013; Robert 2015a; Rusthoven 1996; Wolchok 2010). The remaining 99 studies (81%) were open label design.
In many cases, trials were sponsored by pharmaceutical companies producing the tested drug: this was especially true for new classes of drugs, such as immune checkpoint inhibitors and small‐molecule targeted drugs.
Sample sizes
There was significant variation in sample size among the included RCTs, ranging from 30 (Gorbonova 2000) to 945 (Larkin 2015) participants.
Participants
Overall, the 122 RCTs randomised 28,561 participants. Eighty‐nine trials (73%) were conducted in untreated participants (N = 20,737). Previously treated participants (N = 3450) were enrolled in 30 trials (25%): in 20 of these RCTs both untreated and previously treated participants were enrolled. In three trials systemic treatments were administered after surgery for distant metastasis (2%). Included studies were conducted in adults with no restriction for enrolling both men and women (mean men:women ratio = 1.38). Mean age was 57.5 years (range: 18 to 87 years). Participants with brain metastasis (N = 741) were included in 29 studies (24%), although definitions for allowing inclusion of this condition differed across trials (Characteristics of included studies). All trials enrolled participants from a hospital, with unresectable locoregional disease (AJCC TNM stage IIIC) or metastatic cutaneous melanoma (AJCC TNM stage IV). Many reports stated “metastatic or locoregionally advanced disease”, but then did not report data separately.
Interventions
All studies investigated systemic treatments as per eligibility criteria. Several drugs and schedules were tested. Description of drugs and scheduled for each study are reported in Characteristics of included studies tables. Overall, dacarbazine was the most used drug across the trials (n = 50, 46%). The following treatment comparisons were investigated:
-
polychemotherapy (experimental arm) versus single‐agent chemotherapy (comparator arm): 21 RCTs;
-
biochemotherapy (experimental arm) versus chemotherapy (comparator arm): 34 RCTs;
-
immune checkpoint inhibitors (experimental arm) versus any other agent (comparator arm): 11 RCTs;
-
small‐molecule targeted drugs (experimental arm) versus any other agent (comparator arm): 9 RCTs;
-
chemotherapy plus other agents (e.g. anti‐angiogenic drugs, tamoxifen, elesclomol) (experimental arm) versus chemotherapy alone (comparator arm): 34 RCTs; and
-
other comparisons (e.g. single agent chemotherapy versus other single agent chemotherapy): 13 RCTs.
Outcomes
We evaluated the following outcomes for each study:
-
progression‐free survival: 89 RCTs (73%);
-
overall survival: 105 RCTs (94%);
-
tumour response: 117 RCTs (96%);
-
toxicity: 118 RCTs (97%);
-
participants' quality of life: 12 RCTs (11%); and
-
cost analysis: 1 RCT (< 1%).
Excluded studies
We reported the reasons for exclusion of 24 studies in the Characteristics of excluded studies. The reasons for exclusion were that the study: was not a randomised trial (n = 11); investigated mechanisms of action of a drug (or drug interaction with other drugs) (n = 2); investigated early stage melanoma (not advanced/metastatic melanoma) (n = 2); investigated either local or loco‐regional therapies (n = 4); investigated subgroups of participants of particular interest from RCTs already included in this review (n = 2); investigated both melanoma and other tumour types, but melanoma‐specific data could not be extracted (n = 1); gathered data from three RCTs already included in this review (n = 1); and reported the preliminary results of a RCT already included in this review (n = 1).
Ongoing studies
We searched for phase III RCTs, either open to recruitment or following up participants, investigating participants with metastatic melanoma. We identified open studies in 'recruiting and 'not yet recruiting' phases and active studies not yet recruiting.
We identified 19 phase III RCTs (see Characteristics of ongoing studies). These studies will investigate two new classes of anticancer drugs for melanoma (i.e. immune checkpoint inhibitors ipilimumab, nivolumab, and pembrolizumab; and the targeted drugs dabrafenib, vemurafenib, and trametinib) in tumours harbouring mutations in proteins other than BRAF, such as NRAS, which is also believed to play a role in melanoma progression. Studies also investigate combinations of these drugs and in association with other agents, such as interferon‐alpha and interleukin‐2.
Studies awaiting classification
There are no studies awaiting classification.
Risk of bias in included studies
Figure 3 and Figure 4 summarise the risk of bias for included studies.

Risk of bias graph: review authors' judgements about each risk of bias item presented as percentages across all included studies.

Risk of bias summary: review authors' judgements about each risk of bias item for each included study.
Overall, the risk of bias of included studies can be considered as limited. Considering the 122 included studies and the seven bias domains assessed, we performed 854 evaluations (Figure 4): only seven evaluations (< 1%) assigned high risk of bias for six trials (Beretta 1976; Carvajal 2014; Hamid 2014; Hofmann 2011; Ranson 2007; Richtig 2004). We assessed that only 21 studies (17%) were at low risk of bias for all domains (Bedikian 2006; Cui 2013; Eisen 2010; Flaherty 2012b; Flaherty 2013a; Glaspy 2009; Hauschild 2009a; Hersh 2015; Hodi 2010a; Larkin 2015; Lawson 2015; Long 2015; McDermott 2008; O'Day 2013; Ribas 2015; Robert 2013; Robert 2015a; Schadendorf 2006; Schwartzentruber 2011a; Weber 2015; Wolchok 2010). We assessed a further 22 trials (18%) at low risk of bias for four domains and one domain at unclear risk of bias (Atkins 2008; Bajetta 2006a; Bedikian 2011; Chiarion‐Sileni 2011; Eigentler 2008; Gupta 2014; Hauschild 2001; Hauschild 2012; Hodi 2014; Kaufmann 2005; Keilholz 2005; Larkin 2014; Maio 2010; McArthur 2014; Middleton 2007; Middleton 2015; O'Day 2009; Patel 2011; Ribas 2013; Robert 2015; Robert 2015b; Testori 2008). Most included studies (n = 73, 60%) were assessed at unclear risk of bias for two or more domains.
Allocation
Random sequence generation
In most included RCTs (n = 62, 51%), the risk of selection bias due to issues linked to random sequence generation was judged to be low. Information regarding random sequence generation was lacking so the risk was assessed as unclear in 59 studies (48%). One study (Hofmann 2011) that compared dacarbazine to best supportive care in pre‐treated participants with metastatic melanoma was assessed at high risk of bias: initially enrolled participants were randomly assigned to either chemotherapy or best supportive care, but enrolment was slow and allocation appeared to be based on physician's choice.
Allocation concealment
In most included RCTs (n = 69, 56%) the risk of selection bias due to issues linked to allocation concealment was judged to be unclear, which was mainly due to the lack of information reported in published study reports. In 52 studies (43%), we judged this domain at low risk of bias. One study (Hofmann 2011) was assessed at high risk of selection bias due to lack of allocation concealment (see 'Random sequence generation' risk of bias assessment).
Blinding
Performance bias
All included RCTs were deemed at low risk of performance bias. In particular, 23 studies (19%) (Cui 2013; Eisen 2010; Flaherty 2013a; Glaspy 2009; Gupta 2014; Hauschild 2009a; Hodi 2010a; Kefford 2010; Kim 2012; Larkin 2015; Lawson 2015; Long 2015; McDermott 2008; Middleton 2015; O'Day 2009; O'Day 2011; O'Day 2013; Postow 2015; Robert 2011; Robert 2013; Robert 2015a; Rusthoven 1996; Wolchok 2010) were designed as double‐blinded trials, and were assessed at low risk of bias for this domain. The remaining 99 trials (81%) were designed as open label studies, with no blinding of participants or personnel. However, we judged that in this setting (metastatic melanoma), with the treatments tested and the outcomes assessed, the knowledge of which intervention was received or administered (rather than the intervention itself), could not affect the outcomes under investigation. Therefore, we judge the risk of performance bias as low for these RCTs.
No studies were assessed at high risk of performance bias.
Detection bias
The risk of detection bias was found to be low in 31 RCTs (25%). There was insufficient information reported in the remaining 91 studies (75%) to permit judgement and were assessed at unclear risk of bias for this domain.
No studies were assessed at high risk of detection bias.
Incomplete outcome data
Most included RCTs (n = 99, 81%) were judged to be at low risk of attrition bias. There was insufficient information reported in the remaining 23 (19%) studies to permit judgement and were assessed at unclear risk of bias for this domain.
No studies were assessed at high risk of bias of attrition detected.
Selective reporting
Most included RCTs (n = 62, 51%) were found to be at low risk of reporting bias. There was insufficient information reported in 59 studies (48%) to permit judgement and were assessed at unclear risk of selective reporting bias. One study (Beretta 1976) was assessed at high risk of reporting bias because data from one of the four trial arms were not analysed for unclear reasons.
Other potential sources of bias
We did not find any other sources of bias in most included RCTs (n = 111, 91%). There was insufficient available information to permit judgement for seven studies (6%). We detected a high risk of bias in four trials (3%); Carvajal 2014 and Hamid 2014 showed a potential conflict of interest between some authors and the funding body; drug dosage was amended in Ranson 2007; and Richtig 2004 was stopped when approximately 50% of planned participants were enrolled.
Effects of interventions
See: Summary of findings 1 Anti‐PD1 monoclonal antibodies versus chemotherapy; Summary of findings 2 Anti‐PD1 monoclonal antibodies versus anti‐CTLA4 monoclonal antibodies; Summary of findings 3 Anti‐CTLA4 monoclonal antibodies plus chemotherapy versus chemotherapy; Summary of findings 4 Anti‐CTLA4 monoclonal antibodies with versus without anti‐PD1 monoclonal antibodies; Summary of findings 5 BRAF inhibitors versus chemotherapy; Summary of findings 6 MEK inhibitors versus chemotherapy; Summary of findings 7 BRAF plus MEK inhibitors versus BRAF inhibitors; Summary of findings 8 Anti‐angiogenic drugs plus chemotherapy versus chemotherapy; Summary of findings 9 Biochemotherapy versus chemotherapy; Summary of findings 10 Polychemotherapy versus chemotherapy
We analysed outcomes according to descriptions in Types of outcome measures. Each outcome was investigated for the pre‐established interventions described in Types of interventions. Findings from included studies were meta‐analysed when a drug (or a drug regimen) was tested in at least two studies. Accordingly, 39 studies were not included in the meta‐analyses. (Table 2 presents reasons for exclusion from meta‐analysis). Quantitative analysis was performed with findings from 83 studies for five different types of interventions: conventional chemotherapy, biochemotherapy, immune checkpoint inhibitors, small‐molecule targeted drugs, and other agents (including anti‐angiogenic drugs) (Table 3).
| Study ID | Reason for exclusion from meta‐analysis |
|---|---|
| Single study investigating tasisulam | |
| Single study investigating bosentan | |
| Single study comparing dacarbazine and best supportive care | |
| Single study investigating dendritic cells therapy | |
| Single study investigating histamine with interleukin‐2 | |
| Different polychemotherapy regimens not compared in other studies | |
| Different polychemotherapy regimens not compared in other studies | |
| Different polychemotherapy regimens not compared in other studies | |
| Different PEG‐interferon schedules tested | |
| Inpatient and outpatient interleukin‐2‐based regimens not compared in other studies | |
| Different lenalidomide schedules not compared in other studies | |
| Different polychemotherapy regimens not compared in other studies | |
| Study comparing biochemotherapy versus biotherapy | |
| Study comparing alternating and sequential biochemotherapy and chemotherapy | |
| Single study investigating Indomethacine with interferon | |
| Different single‐agent chemotherapy regimens not compared in other studies | |
| Different polychemotherapy regimens not compared in other studies | |
| Different temozolomide and interferon schedules tested | |
| Different polychemotherapy regimens not compared in other studies | |
| Different interferon‐based regimens not compared in other studies | |
| Different biochemotherapy regimens not compared in other studies | |
| Single study investigating chemotherapy and COX‐2 inhibitor | |
| Single study comparing interleukin‐2 with versus without interferon‐alpha | |
| Different ipilimumab schedules tested | |
| Single study comparing fotemustine and dacarbazine | |
| Single study testing Intetumumab | |
| Single study testing lomeguatrib | |
| Single study testing nab‐paclitaxel | |
| Single study testing oblimersen | |
| Single study testing DHA‐paclitaxel | |
| Single study testing PF‐3512676 | |
| Single study testing ramucirumab | |
| Single study testing dacarbazine and C parvum after surgery | |
| Single study testing vindesine after surgery | |
| Single study testing GM‐CSF and a polypeptide vaccination after surgery | |
| Single study testing lenalidomide | |
| Single study testing veliparib | |
| Single study testing vetaspen |
| Comparison | Experimental (class of) drug | Study ID |
|---|---|---|
| Polychemotherapy versus single agent chemotherapy | Polychemotherapy | |
| Biochemotherapy versus chemotherapy | Interferon‐alpha | |
| Interleukin‐2 | ||
| Interleukin‐2 plus interferon‐alpha | ||
| Immune checkpoint inhibitors versus chemotherapy (or other immune checkpoint inhibitors) | Anti‐CTLA4 monoclonal antibodies | |
| Anti‐PD1 monoclonal antibodies | ||
| Anti‐CTLA4 plus anti‐PD1 monoclonal antibodies | ||
| Small‐molecule targeted drugs versus chemotherapy (or other small‐molecule targeted drugs) | BRAF inhibitors | |
| MEK inhibitors | ||
| BRAF plus MEK inhibitors | ||
| Chemotherapy with versus without other agents | Bacille Calmette‐Guérin (BCG) | |
| Corynebacterium parvum | ||
| Tamoxifen | ||
| Anti‐angiogenic drugs | ||
| Sorafenib | ||
| Elesclomol | ||
| Single agent chemotherapy versus other single agent chemotherapy | Temozolomide | |
Hodi 2010a; Hodi 2014; Maio 2010; Schwartzentruber 2011a were included in a meta‐analysis of immunostimulating agents.
We presented 10 comparisons in relation to overall survival, progression‐free survival, tumour response, and toxicity (≥ G3) in 'Summary of findings' tables:
-
anti‐PD1 monoclonal antibodies compared with chemotherapy (summary of findings Table 1);
-
anti‐PD1 monoclonal antibodies compared with anti‐CTLA4 monoclonal antibodies (summary of findings Table 2);
-
anti‐CTLA4 monoclonal antibodies plus chemotherapy compared with chemotherapy alone (summary of findings Table 3);
-
anti‐PD1 plus Anti‐CTLA4 monoclonal antibodies compared with anti‐CTLA4 monoclonal antibodies (summary of findings Table 4);
-
BRAF inhibitors compared with chemotherapy (summary of findings Table 5);
-
MEK inhibitors compared with chemotherapy (summary of findings Table 6);
-
BRAF plus MEK inhibitors compared with BRAF inhibitors alone (summary of findings Table 7);
-
anti‐angiogenic drugs plus chemotherapy compared with chemotherapy alone (summary of findings Table 8);
-
biochemotherapy compared with chemotherapy alone (summary of findings Table 9); and
-
polychemotherapy compared with chemotherapy alone (summary of findings Table 10).
Overall survival
Polychemotherapy versus single agent chemotherapy
We included 14 studies that compared cytotoxic polychemotherapy and single agent chemotherapy (Bafaloukos 2005; Bellett 1976; Carter 1975; Chapman 1999; Chauvergne 1982; Chiarion Sileni 2001; Costanza 1972; Costanza 1977; Glover 2003; Kogoniia 1981; Lopez 1984; Luikart 1984; Zimpfer‐Rechner 2003). Hazard ratios (HRs) were directly available or could be extrapolated for six studies (Bafaloukos 2005; Chapman 1999; Chauvergne 1982; Chiarion Sileni 2001; Luikart 1984; Zimpfer‐Rechner 2003). Polychemotherapy and single agent chemotherapy was administered to 312 and 282 participants, respectively. Meta‐analysis suggested a similar risk of death between polychemotherapy and single agent chemotherapy (Analysis 1.1, HR 0.99, 95% CI 0.85 to 1.16; heterogeneity: Tau² = 0.00; Chi² = 3.86, df = 5, P = 0.57; I² = 0%; high‐quality evidence).
Biochemotherapy versus chemotherapy
Chemotherapy with interferon‐alpha versus without interferon‐alpha
This comparison included 15 studies (Bajetta 1994; Bajetta 2006a; Danson 2003; Daponte 2013; Dorval 1999; Falkson 1991; Falkson 1995; Falkson 1998; Gorbonova 2000; Kaufmann 2005; Kirkwood 1990; Maio 2010; Thomson 1993; Vorobiof 1994; Young 2001). Hazard ratios (HRs) were directly available from or could be extrapolated for 11 studies (Bajetta 1994; Bajetta 2006a; Danson 2003; Daponte 2013; Dorval 1999; Falkson 1991; Falkson 1998; Kaufmann 2005; Thomson 1993; Vorobiof 1994; Young 2001). Overall, 942 participants were allocated to chemotherapy with interferon‐alpha and 843 to chemotherapy alone. Meta‐analysis suggested a lower risk of death for the combination of chemotherapy and interferon‐alpha, although this difference was not statistically significant (Analysis 4.1, HR 0.87, 95% CI 0.73 to 1.04) and between‐study heterogeneity was remarkable (heterogeneity: Tau² = 0.06; Chi² = 37.19, df = 10, P < 0.0001; I² = 73%; low‐quality evidence). We did not identify any particular study driving heterogeneity results in a sensitivity analysis. All participants were previously untreated and without brain metastases. Heterogeneity dropped remarkably (I² = 9%) when only studies published after 2000 were considered (HR 0.95, 95% CI 0.84 to 1.08), but increased (I² = 85%) when only studies published before 2000 were included (HR 0.75, 95% CI 0.52 to 1.07). Heterogeneity also dropped when Vorobiof 1994 was excluded from analysis (heterogeneity: Tau² = 0.02; Chi² = 16.45, df = 9, P = 0.06; I² = 45%), without changing the effect estimate (HR 0.94, 95% CI 0.83 to 1.07).
Chemotherapy with interleukin‐2 versus without interleukin‐2
Two studies provided data for this comparison (Hauschild 2001; Keilholz 2005); it was not possible to extract HR data from Sertoli 1999. Overall, 320 participants were allocated to chemotherapy plus interleukin‐2 and 324 participants to chemotherapy alone. Analysis suggested a small and statistically non‐significant benefit for combination therapy of chemotherapy and interleukin‐2 (Analysis 5.1, HR 0.95, 95% CI 0.82 to 1.11; heterogeneity: Tau² = 0.00; Chi² = 0.45, df = 1, P = 0.50; I² = 0%; high‐quality evidence).
Chemotherapy with interferon‐alpha and interleukin‐2 versus without interferon‐alpha and interleukin‐2
Data for this comparison were available from seven studies (Atkins 2008; Atzpodien 2002; Eton 2002; Johnston 1998; Middleton 2007; Ridolfi 2002a; Rosenberg 1999). Overall, 659 participants were allocated to chemotherapy with both interferon‐alpha and interleukin‐2 and 658 participants to chemotherapy alone. Analysis suggested a slightly lower risk of death associated with combination therapy of chemotherapy plus interleukin‐2 and interferon‐alpha, although this difference was not statistically significant (Analysis 6.1, HR 0.94, 95% CI 0.84 to 1.06; heterogeneity: Tau² = 0.01; Chi² = 7.61, df = 6, P = 0.27; I² = 21%; high‐quality evidence). We also analysed those trials enrolling only previously untreated patients with metastatic melanoma (biochemotherapy used as first‐line treatment) (Atkins 2008; Eton 2002; Middleton 2007; Ridolfi 2002a; Rosenberg 1999) and found a similar effect size with higher heterogeneity (Analysis 7.1, HR 0.96, 95% CI 0.83 to 1.10; heterogeneity: Tau² = 0.01; Chi² = 6.64, df = 4, P = 0.16; I² = 40%). The leave‐one‐out procedure suggested Rosenberg 1999 to be the study driving heterogeneity (HR 0.92, 95% CI 0.83 to 1.04; heterogeneity: Tau² = 0.00; Chi² = 1.42, df = 3, P = 0.70; I² = 0%); however, we could not explain why this trial caused heterogeneity.
Immune checkpoint inhibitors
Anti‐CTLA4 monoclonal antibodies plus chemotherapy versus chemotherapy alone (first line)
Two studies provided data for this comparison (Ribas 2013; Robert 2011): in Ribas 2013 the anti‐CTLA4 monoclonal antibody tremelimumab did not add any significant advantage to chemotherapy; and in Robert 2011 the anti‐CTLA4 monoclonal antibody ipilimumab significantly increased the efficacy of chemotherapy (HR 0.72, 95% CI 0.59 to 0.88). Overall, 578 participants were allocated to anti‐CTLA4 monoclonal antibodies and chemotherapy and 579 to chemotherapy alone. Meta‐analysis suggested a lower risk of death for combination therapy of anti‐CTLA and chemotherapy, although this difference was not statistically significant (Analysis 10.1, HR 0.81, 95% CI 0.65 to 1.01; heterogeneity: Tau² = 0.02; Chi² = 2.99, df = 1, P = 0.08; I² = 67%; low‐quality evidence). High level heterogeneity detected in this analysis was likely to be linked to the effects caused by participants in Ribas 2013 who failed chemotherapy subsequently being treated with tremelimumab, which potentially nullified the difference between the study arms due to this anti‐CTLA4 monoclonal antibody.
Anti‐CTLA4 monoclonal antibodies with immune stimulating agents versus without immune stimulating agents (second line)
This comparison included two studies (Hodi 2010a; Hodi 2014). Overall, 526 participants were allocated to anti‐CTLA4 monoclonal antibodies with immune stimulating agents: melanoma antigen gp100 (Hodi 2010a) and granulocyte‐macrophage colony‐stimulating factor (GM‐CSF) (Hodi 2014), and 259 participants were allocated to anti‐CTLA4 monoclonal antibodies alone. Data from the meta‐analysis suggested a lower risk of death for combination therapy of anti‐CTLA and immune stimulating agents, although this difference was not statistically significant (Analysis 11.1 HR 0.83, 95% CI 0.52 to 1.33; heterogeneity: Tau² = 0.10; Chi² = 5.42, df = 1, P = 0.02; I² = 82%; low‐quality evidence). High level heterogeneity was likely due to a different effect of association between ipilimumab with either gp100 (Hodi 2010a, HR 1.04, 95% CI 0.83 to 1.30) or GM‐CSF (HR 0.64, 95% CI 0.46 to 0.90).
Anti‐PD1 monoclonal antibodies versus chemotherapy
This comparison included three studies (Ribas 2015; Robert 2015a; Weber 2015). Overall survival was a study endpoint only for Robert 2015a so meta‐analysis could be performed. In Robert 2015a, 210 participants were allocated to anti‐PD1 monoclonal antibodies and 208 participants to chemotherapy alone. Results from Robert 2015a showed that anti‐PD1 monoclonal antibodies significantly reduced the risk of death from any cause (Analysis 12.1, HR 0.42, 95% CI 0.37 to 0.48; high‐quality evidence).
Anti‐PD1 monoclonal antibodies versus anti‐CTLA4 monoclonal antibodies
This comparison included two studies (Larkin 2015; Robert 2015b). Overall survival was a study endpoint only for Robert 2015b so meta‐analysis could not be performed. In Robert 2015b, 556 participants were allocated to anti‐PD1 monoclonal antibodies and 208 to chemotherapy alone. Results from Robert 2015b suggested a statistically significant lower risk of death for anti‐PD1 monoclonal antibodies (Analysis 13.1; HR 0.63, 95% CI 0.60 to 0.66; high‐quality evidence).
Anti‐CTLA4 monoclonal antibodies with anti‐PD1 monoclonal antibodies versus without anti‐PD1 monoclonal antibodies
This comparison included two studies (Larkin 2015; Postow 2015) which did not investigate overall survival.
Small‐molecule targeted drugs
BRAF inhibitors versus chemotherapy
This comparison included two studies (Hauschild 2012; McArthur 2014). Overall, 524 participants were allocated to single agent BRAF inhibitor and 401 participants to chemotherapy alone. Data from the meta‐analysis suggested a statistically significant lower risk of death for single agent BRAF inhibitor (Analysis 18.1, HR 0.40, 95% CI 0.28 to 0.57; heterogeneity: Tau² = 0.01; Chi² = 1.04, df = 1, P = 0.31; I² = 4%; high‐quality evidence).
MEK inhibitors versus chemotherapy
This comparison included three studies (Flaherty 2012b; Gupta 2014; Robert 2013). Overall, 300 participants were allocated to single agent MEK inhibitor treatment and 196 participants to chemotherapy alone. Data from the meta‐analysis suggested a lower risk of death for single agent MEK inhibitor, although the difference was not statistically significant (Analysis 19.1, HR 0.85, 95% CI 0.58 to 1.25; heterogeneity: Tau² = 0.07; Chi² = 4.63, df = 2, P = 0.10; I² = 57%; low‐quality evidence; downgraded due to inconsistency and imprecision).
BRAF inhibitors with MEK inhibitors versus without MEK inhibitors
This comparison included four studies (Flaherty 2012a; Larkin 2014; Long 2015; Robert 2015). Overall, 918 participants were allocated to combination therapy of BRAF plus MEK inhibitors and 866 participants to single agent BRAF inhibitor. Data from the meta‐analysis suggested a statistically significant lower risk of death for combination therapy (Analysis 20.1, HR 0.70, 95% CI 0.59 to 0.82, heterogeneity: Tau² = 0.00; Chi² = 0.15, df = 3, P = 0.98; I² = 0%; high‐quality evidence).
Chemotherapy with versus without other agents
Chemotherapy with Bacillus Calmette‐Guérin (BCG) versus without BCG
This comparison included six studies (Costanzi 1982; Mastrangelo 1979; Newlands 1976; Ramseur 1978; Veronesi 1984; Verschraegen 1993). HRs were available or extractable for two studies (Newlands 1976; Verschraegen 1993). Overall, 74 participants were allocated to chemotherapy with BCG and 80 to chemotherapy alone. Analysis suggested a lower risk of death for combination of chemotherapy and BCG, although the difference was not statistically significant (Analysis 8.1, HR 0.87, 95% CI 0.61 to 1.25; heterogeneity: Tau² = 0.00; Chi² = 0.50, df = 1, P = 0.48; I² = 0%; moderate‐quality evidence; downgraded due to imprecision).
Chemotherapy with Corynebacterium parvum versus without C parvum
This comparison included seven studies (Clunie 1980; Gough 1978; Kokoschka 1978; Presant 1979; Robidoux 1982; Thatcher 1986; Veronesi 1984). HRs were directly available or could be extrapolated for four RCTs (Clunie 1980; Kokoschka 1978; Presant 1979; Robidoux 1982). Overall, 114 participants were allocated to chemotherapy with C parvum and 128 participants to chemotherapy alone. Analysis suggested a slightly lower risk of death for combination of chemotherapy and C parvum, although this difference was not statistically significant (Analysis 9.1, HR 0.95, 95% CI 0.74 to 1.22; heterogeneity: Tau² = 0.00; Chi² = 0.79, df = 3, P = 0.85; I² = 0%; moderate‐quality evidence; downgraded due to imprecision).
Chemotherapy with tamoxifen versus without tamoxifen
We included four trials for this comparison (Agarwala 1999; Cocconi 1992; Falkson 1998; Rusthoven 1996). HRs were either directly reported or could be extrapolated. Tamoxifen‐based polychemotherapy was administered to 326 participants and 317 participants received cytotoxic chemotherapy alone. Tamoxifen was associated with a non‐statistically significant slightly higher risk of death (Analysis 2.1, HR 1.03, 95% CI 0.80 to 1.33; heterogeneity: Tau² = 0.04; Chi² = 7.58, df = 3, P = 0.06; I² = 60%; low‐quality evidence; downgraded due to inconsistency and imprecision). Leave‐one‐out analysis suggested that heterogeneity was mainly related to Cocconi 1992 (HR 1.13, 95% CI 0.96 to 1.33, heterogeneity: Tau² = 0.00; Chi² = 1.52, df = 2, P = 0.47; I² = 0%): however, we could not explain why this trial caused heterogeneity.
Chemotherapy with anti‐angiogenic drugs versus without anti‐angiogenic drugs
This comparison included two studies (Cui 2013; Kim 2012). Overall, 199 participants were allocated to standard chemotherapy plus anti‐angiogenic therapies and 125 participants to chemotherapy alone. Data from the meta‐analysis suggested a statistically significant lower risk of death for combination of chemotherapy and anti‐angiogenic agents (Analysis 17.1, HR 0.60, 95% CI 0.45 to 0.81; heterogeneity: Tau² = 0.00; Chi² = 0.71, df = 1, P = 0.40; I² = 0%; moderate‐quality evidence; downgraded due to imprecision ‐ there were fewer than 400 participants, so the sample size was smaller than optimal information size).
Chemotherapy with sorafenib versus without sorafenib
This comparison included three studies (Flaherty 2013a; Hauschild 2009a; McDermott 2008). Overall, 596 participants were allocated to standard chemotherapy plus sorafenib and 598 participants to chemotherapy alone. Analysis suggested a similar risk of death for combination of chemotherapy and sorafenib (Analysis 15.1, HR 1.00, 95% CI 0.88 to 1.14; heterogeneity: Tau² = 0.00; Chi² = 0.03, df = 2, P = 0.99; I² = 0%; high‐quality evidence).
Chemotherapy with elesclomol versus without elesclomol
This comparison included two studies (O'Day 2011; O'Day 2013). Overall survival was a study endpoint only for O'Day 2013 so meta‐analysis could not be performed. In O'Day 2013, 325 participants were allocated to chemotherapy plus elesclomol and 326 participants to chemotherapy alone. Results from O'Day 2013 suggested a statistically significant lower risk of death for chemotherapy alone, although the difference was not statistically significant (Analysis 16.1, HR 1.10, 95% CI 0.92 to 1.32; moderate‐quality evidence; downgraded due to imprecision).
Other comparisons
Single agent chemotherapy versus another single agent chemotherapy
Meta‐analysis was feasible for two different single agent drug regimens: dacarbazine and temozolomide. Three trials were included (Chiarion‐Sileni 2011; Middleton 2000; Patel 2011). Overall, 659 and 654 participants were allocated to temozolomide and dacarbazine, respectively. Temozolomide was associated with a small and non statistically significant survival improvement compared to single agent dacarbazine (Analysis 3.1, HR 0.98, 95% CI 0.85 to 1.12; heterogeneity: Tau² = 0.00; Chi² = 2.33, df = 2, P = 0.31; I² = 14%; high‐quality evidence).
Progression‐free survival
Polychemotherapy versus single agent chemotherapy
We included 14 studies that compared cytotoxic polychemotherapy to single agent chemotherapy (Bafaloukos 2005; Bellett 1976; Carter 1975; Chapman 1999; Chauvergne 1982; Chiarion Sileni 2001; Costanza 1972; Costanza 1977; Glover 2003; Kogoniia 1981; Lopez 1984; Luikart 1984; Zimpfer‐Rechner 2003). HRs were either available or extractable for five studies (Bafaloukos 2005; Glover 2003; Chiarion Sileni 2001; Luikart 1984; Zimpfer‐Rechner 2003). Cytotoxic polychemotherapy and single agent chemotherapy were administered for 219 and 179 participants, respectively. Data from the meta‐analysis suggested a slightly higher risk of melanoma progression for polychemotherapy, although this difference did not reach statistical significance (Analysis 1.2, HR 1.07, 95% CI 0.91 to 1.25; heterogeneity: Tau² = 0.00; Chi² = 0.87, df = 4, P = 0.93; I² = 0%; high‐quality evidence).
Biochemotherapy versus chemotherapy
Chemotherapy with interferon‐alpha versus without interferon‐alpha
This comparison included 15 studies (Bajetta 1994; Bajetta 2006a; Danson 2003; Daponte 2013; Dorval 1999; Falkson 1991; Falkson 1995; Falkson 1998; Gorbonova 2000; Kaufmann 2005; Kirkwood 1990; Maio 2010; Thomson 1993; Vorobiof 1994; Young 2001). HRs were directly available or could be extrapolated from six studies (Bajetta 1994; Bajetta 2006a; Daponte 2013; Falkson 1991; Falkson 1998; Kaufmann 2005). Overall, 671 participants were allocated to chemotherapy with interferon‐alpha and 610 participants to chemotherapy alone. Data from the meta‐analysis suggested a lower risk of death for combination of chemotherapy and interferon‐alpha, although this difference was not statistically significant (Analysis 4.2, HR 0.87, 95% CI 0.74 to 1.01; heterogeneity: Tau² = 0.02; Chi² = 13.32, df = 5, P = 0.02; I² = 62%; low‐quality evidence; downgraded due to inconsistency and imprecision). High heterogeneity appeared to result from inclusion of Falkson 1991: when this trial was omitted from analysis, heterogeneity dropped to 0% (in this sensitivity analysis the effect size was also reduced: HR 0.92, 95% CI 0.84 to 1.00). However, we could not explain why Falkson 1991 caused heterogeneity.
Chemotherapy with interleukin‐2 versus without interleukin‐2
This comparison included two studies (Hauschild 2001; Keilholz 2005). Progression‐free survival was a study endpoint only for Keilholz 2005 so meta‐analysis could not be performed. Keilholz 2005 randomised 183 participants to receive chemotherapy plus interleukin‐2 and 180 participants to receive chemotherapy alone. Findings reported by Keilholz 2005 suggested a statistically significant lower risk of melanoma progression for chemotherapy alone, although the difference was not statistically significant (Analysis 5.2, HR 0.87, 95% CI 0.70 to 1.08; moderate‐quality evidence; downgraded due to imprecision).
Chemotherapy with interferon‐alpha and interleukin‐2 versus without interferon‐alpha and interleukin‐2
This comparison included seven studies (Atkins 2008; Atzpodien 2002; Eton 2002; Johnston 1998; Middleton 2007; Ridolfi 2002a; Rosenberg 1999). HRs either were directly available or could be extrapolated for six studies (Atkins 2008; Atzpodien 2002; Eton 2002; Johnston 1998; Middleton 2007; Ridolfi 2002a). Overall, 488 participants were allocated to chemotherapy with both interferon‐alpha and interleukin‐2 and 476 to chemotherapy alone. Meta‐analysis suggested a statistically significant better progression‐free survival for biochemotherapy (Analysis 6.2, HR 0.90, 95% CI 0.83 to 0.99; heterogeneity: Tau² = 0.00; Chi² = 5.22, df = 5, P = 0.39; I² = 4%; high‐quality evidence). This result was also confirmed when studies investigating first‐line treatment were considered (Analysis 7.2, HR 0.86, 95% CI 0.76 to 0.99).
Immune checkpoint inhibitors
Anti‐CTLA4 monoclonal antibodies plus chemotherapy versus chemotherapy alone (first line)
Two studies reported this comparison (Ribas 2013; Robert 2011) but HR data were not extractable from Ribas 2013. Robert 2011 randomised 250 participants to receive anti‐CTLA4 monoclonal antibodies plus chemotherapy and 252 participants to receive chemotherapy alone. Findings suggested a statistically significant better progression‐free survival for combination of anti‐CTLA plus chemotherapy (Analysis 10.2, HR 0.76, 95% CI 0.63 to 0.92; moderate‐quality evidence; downgraded due to imprecision).
Anti‐CTLA4 monoclonal antibodies with immunostimulating agents versus without immunostimulating agents (second line)
This comparison included two studies (Hodi 2010a; Hodi 2014). Overall, 526 participants were allocated to anti‐CTLA4 monoclonal antibodies combined with immunostimulating agents (gp100 in Hodi 2010a and GM‐CSF in Hodi 2014), and 259 to anti‐CTLA4 monoclonal antibodies alone. Meta‐analysis suggested a better progression‐free survival for anti‐CTLA monoclonal antibodies alone, although the difference was not statistically significant (Analysis 11.2, HR 1.06, 95% CI 0.75 to 1.51; heterogeneity: Tau² = 0.05; Chi² = 3.61, df = 1, P = 0.06; I² = 72%; low‐quality evidence; downgraded due to inconsistency and imprecision). The inclusion of trials testing two different immunostimulating agents may explain high between‐study heterogeneity.
Anti‐PD1 monoclonal antibodies versus chemotherapy
This comparison included three studies (Ribas 2015; Robert 2015a; Weber 2015). HRs were either available or extractable for Ribas 2015 and Robert 2015a. Overall, 570 participants were allocated to anti‐PD1 monoclonal antibodies and 387 to chemotherapy alone. Meta‐analysis suggested a statistically significant better progression‐free survival for participants allocated to anti‐PD1 monoclonal antibodies (Analysis 12.2, HR 0.49, 95% CI 0.39 to 0.61; heterogeneity: Tau² = 0.01; Chi² = 2.26, df = 1, P = 0.13; I² = 56%; moderate‐quality evidence; downgraded due to inconsistency).
Anti‐PD1 monoclonal antibodies versus anti‐CTLA4 monoclonal antibodies
This comparison included two studies (Larkin 2015; Robert 2015b). Overall, 872 participants were allocated to anti‐PD1 monoclonal antibodies and 593 to anti‐CTLA4 monoclonal antibodies. Meta‐analysis suggested a statistically significant better progression‐free survival for participants treated with anti‐PD1 monoclonal antibodies (Analysis 13.2, HR 0.54, 95% CI 0.50 to 0.60; heterogeneity: Tau² = 0.00; Chi² = 0.13, df = 1, P = 0.72; I² = 0%; high‐quality evidence).
Anti‐CTLA4 monoclonal antibodies with anti‐PD1 monoclonal antibodies versus without anti‐PD1 monoclonal antibodies
This comparison included two studies (Larkin 2015; Postow 2015). Overall, 386 participants were allocated to combination therapy with anti‐PD1 plus anti‐CTLA4 monoclonal antibodies and 352 to anti‐CTLA4 monoclonal antibodies alone. Meta‐analysis suggested a statistically significant better progression‐free survival for participants treated with combination treatment (Analysis 14.1, HR 0.40, 95% CI 0.35 to 0.46; heterogeneity: Tau² = 0.00; Chi² = 0.08, df = 1, P = 0.78; I² = 0%; high‐quality evidence).
Small‐molecule targeted drugs
BRAF inhibitors versus chemotherapy
This comparison included two studies (Hauschild 2012; McArthur 2014). Overall, 524 participants were allocated to single agent BRAF inhibitor and 401 to chemotherapy alone. Meta‐analysis showed that single agent BRAF inhibitor was associated with a statistically significant better progression‐free survival (Analysis 18.2, HR 0.27, 95% CI 0.21 to 0.34, heterogeneity: Tau² = 0.00; Chi² = 0.24, df = 1, P = 0.63; I² = 0%; high‐quality evidence).
MEK inhibitors versus chemotherapy
This comparison included three studies (Flaherty 2012b; Gupta 2014; Robert 2013). Overall, 300 participants were allocated to single agent MEK inhibitor and 196 to chemotherapy alone. Meta‐analysis suggested a statistically significantly better progression‐free survival for single agent MEK inhibitor (Analysis 19.2, HR 0.58, 95% CI 0.42 to 0.80; heterogeneity: Tau² = 0.05; Chi² = 4.75, df = 2, P = 0.09; I² = 58%; moderate‐quality evidence; downgraded due to inconsistency). The three studies included different participants populations and this may explain high between‐study heterogeneity. Gupta 2014 enrolled participants with wild‐type BRAF melanomas and Flaherty 2012b tested a MEK inhibitor in both pre‐treated and untreated participants. When Flaherty 2012b was excluded from the meta‐analysis, heterogeneity was reduced to 0%, and effect size decreased (HR 0.67, 95% CI 0.53 to 0.85).
BRAF inhibitors with versus without MEK inhibitors
This comparison was reported in four studies (Flaherty 2012a; Larkin 2014; Long 2015; Robert 2015). Overall, 918 participants were allocated to combination of BRAF and MEK inhibitors and 866 to single agent BRAF inhibitor. Meta‐analysis suggested a statistically significant better progression‐free survival for combination therapy (Analysis 20.2, HR 0.56, 95% CI 0.44 to 0.71); however, despite studies sharing similar designs, between‐study heterogeneity was high (Tau² = 0.04; Chi² = 9.82, df = 3, P = 0.02; I² = 69%; moderate‐quality evidence; downgraded due to inconsistency). Sensitivity analysis showed that Long 2015 determined heterogeneity; the I² value dropped to 9% when this study was excluded from analysis, with only minimal change in effect size (HR 0.52, 95% CI 0.44, 0.61).
Chemotherapy with versus without other agents
Chemotherapy with Bacillus Calmette‐Guérin (BCG) versus without BCG
Six studies investigated this comparison (Costanzi 1982; Mastrangelo 1979; Newlands 1976; Ramseur 1978; Veronesi 1984; Verschraegen 1993). However, the studies did not investigate progression‐free survival, nor were HRs available or extractable.
Chemotherapy with Corynebacterium parvum versus without C parvum
Seven studies investigated this comparison (Clunie 1980; Gough 1978; Kokoschka 1978; Presant 1979; Robidoux 1982; Thatcher 1986; Veronesi 1984). However, the studies did not investigate progression‐free survival, nor were HRs available or extractable.
Chemotherapy with versus without tamoxifen
Four studies investigated this comparison (Agarwala 1999; Cocconi 1992; Falkson 1998; Rusthoven 1996). HRs were either available or extractable for Falkson 1998 and Rusthoven 1996. Tamoxifen‐based polychemotherapy was administered to 238 participants and 237 participants received chemotherapy alone. Tamoxifen was associated with a non statistically significant slightly higher risk of melanoma progression (Analysis 2.2, HR 1.06, 95% CI 0.93 to 1.22; heterogeneity: Tau² = 0.00; Chi² = 0.29, df = 1, P = 0.59; I² = 0%; high‐quality evidence).
Chemotherapy with sorafenib versus without sorafenib
This comparison included three studies (Flaherty 2013a; Hauschild 2009a; McDermott 2008). Overall, 596 participants were allocated to standard chemotherapy plus sorafenib and 598 to chemotherapy alone. Meta‐analysis suggested better progression‐free survival for participants undergoing chemotherapy plus sorafenib, although the difference was not statistically significant (Analysis 15.2, HR 0.89, 95% CI 0.73 to 1.09; heterogeneity: Tau² = 0.01; Chi² = 2.94, df = 2, P = 0.23; I² = 32%; moderate‐quality evidence; downgraded due to imprecision).
Chemotherapy with elesclomol versus without elesclomol
This comparison was reported by two studies (O'Day 2011; O'Day 2013). Overall, 378 participants were allocated to standard chemotherapy plus elesclomol and 354 to chemotherapy alone. Meta‐analysis suggested better progression‐free survival for participants undergoing chemotherapy plus elesclomol, although the difference was not statistically significant (Analysis 16.2, HR 0.75, 95% CI 0.50 to 1.13; heterogeneity: Tau² = 0.06; Chi² = 3.23, df = 1, P = 0.07; I² = 69%; low‐quality evidence; downgraded due to inconsistency and imprecision).
Chemotherapy with anti‐angiogenic drugs versus without anti‐angiogenic drugs
This comparison was reported by two studies (Cui 2013; Kim 2012). Overall, 199 participants were allocated to standard chemotherapy plus anti‐angiogenic therapies and 125 to chemotherapy alone. Meta‐analysis suggested a statistically significant progression‐free survival benefit for combination of chemotherapy and anti‐angiogenic agents (Analysis 17.2, HR 0.69, 95% CI 0.52 to 0.92; heterogeneity: Tau² = 0.01; Chi² = 1.17, df = 1, P = 0.28; I² = 14%; moderate‐quality evidence; downgraded due imprecision ‐ sample size was smaller than optimal information size).
Other comparisons
Single agent chemotherapy versus other single agent chemotherapy
Meta‐analysis was feasible for two different single agent drug regimens: dacarbazine and temozolomide. Three trials were included (Chiarion‐Sileni 2011; Middleton 2000; Patel 2011). Overall, 659 and 654 participants were allocated to temozolomide and dacarbazine, respectively. Temozolomide was associated with a statistically non‐significant progression‐free survival improvement compared to single agent dacarbazine (Analysis 3.2, HR 0.87, 95% CI 0.74 to 1.03; heterogeneity: Tau² = 0.01; Chi² = 3.08, df = 2, P = 0.21; I² = 35%; moderate‐quality evidence; downgraded due to imprecision).
Toxicity
Polychemotherapy versus single agent chemotherapy
This comparison included 15 studies (Bajetta 1994; Bajetta 2006a; Danson 2003; Daponte 2013; Dorval 1999; Falkson 1991; Falkson 1995; Falkson 1998; Gorbonova 2000; Kaufmann 2005; Kirkwood 1990; Maio 2010; Thomson 1993; Vorobiof 1994; Young 2001). Description of ≥ G3 toxicity, expressed as the number of participants experiencing toxicity, was available from three studies (Costanza 1977; Chauvergne 1982; Glover 2003). Cytotoxic polychemotherapy and single agent chemotherapy were administered in 241 and 149 participants, respectively, with a statistically significant higher rate of high‐grade toxicity among those undergoing polychemotherapy (Analysis 1.4, RR 1.97, 95% CI 1.44 to 2.71; I² = 42%; moderate‐quality evidence).
Biochemotherapy versus chemotherapy
Chemotherapy with interferon‐alpha versus without interferon‐alpha
This comparison included 13 studies (Bajetta 1994; Bajetta 2006a; Danson 2003; Daponte 2013; Dorval 1999; Falkson 1991; Falkson 1995; Falkson 1998; Gorbonova 2000; Kaufmann 2005; Thomson 1993; Vorobiof 1994; Young 2001). Description of ≥ G3 toxicity, expressed as number of participants experiencing toxicity, was available from three studies (Bajetta 1994; Falkson 1991; Maio 2010). Overall, 579 participants were allocated to chemotherapy plus interferon‐alpha and 212 to chemotherapy alone. Meta‐analysis suggested a non statistically significant higher rate of ≥ G3 toxicity for the combined regimen (Analysis 4.4, RR 1.72, 95% CI 0.37 to 7.95; heterogeneity: Tau² = 1.16; Chi² = 5.51, df = 2, P = 0.06; I² = 64%; low‐quality evidence; downgraded due to inconsistency and imprecision).
Chemotherapy with interleukin‐2 versus without interleukin‐2
This comparison included two studies (Hauschild 2001; Keilholz 2005). Overall, 320 participants were allocated to chemotherapy plus interleukin‐2 and 324 to chemotherapy alone. Description of ≥ G3 toxicity, expressed as number of participants experiencing toxicity, was unavailable from the studies.
Chemotherapy with interferon‐alpha plus interleukin‐2 versus without interferon‐alpha plus interleukin‐2
This comparison included seven studies (Atkins 2008; Atzpodien 2002; Eton 2002; Johnston 1998; Middleton 2007; Ridolfi 2002a; Rosenberg 1999). Description of ≥ G3 toxicity, expressed as number of participants experiencing toxicity, was available from Johnston 1998 and Middleton 2007. Analysis suggested a statistically significant higher ≥ G3 toxicity for combined chemotherapy, interferon‐alpha and interleukin‐2 (Analysis 6.4, RR 1.35, 95% CI 1.14 to 1.61; heterogeneity: Tau²: 0.00, Chi² = 0.50, df = 1, P = 0.48; I² = 0%; high‐quality evidence). When the analysis was restricted to the first‐line setting, results (based on a single study ‐ Middleton 2007) were similar (Analysis 7.4, RR 1.45, 95% CI 1.12 to 1.87).
Immune checkpoint inhibitors
Anti‐CTLA4 monoclonal antibodies plus chemotherapy versus chemotherapy alone (first line)
This comparison included two studies (Ribas 2013; Robert 2011). Overall, 578 participants were allocated to anti‐CTLA4 monoclonal antibodies plus chemotherapy and 579 to chemotherapy alone. Meta‐analysis suggested a statistically significant higher rate of ≥ G3 toxicity for combined anti‐CTLA and chemotherapy (Analysis 10.4, RR 1.69, 95% CI 1.19 to 2.42; heterogeneity: Tau² = 0.06; Chi² = 6.51, df = 1, P = 0.01; I² = 85%; moderate‐quality evidence; downgraded due to inconsistency).
Anti‐CTLA4 monoclonal antibodies with immune stimulating agents versus without immune stimulating agents (second line)
This comparison included two studies (Hodi 2010a; Hodi 2014) Overall, 526 participants were allocated to anti‐CTLA4 monoclonal antibodies plus immune stimulating agents (gp100 in Hodi 2010a and GM‐CSF in Hodi 2014), and 259 to anti‐CTLA4 monoclonal antibodies alone. Meta‐analysis suggested higher rates of ≥ G3 toxicity for the combined regimen, although the difference was not statistically significant (Analysis 11.4, RR 0.87, 95% CI 0.69 to 1.11; heterogeneity: Tau² = 0.02; Chi² = 2.08, df = 1, P = 0.15; I² = 52%; low‐quality evidence; downgraded due to inconsistency and imprecision).
Anti‐PD1 monoclonal antibodies versus chemotherapy
This comparison included three studies (Ribas 2015; Robert 2015a; Weber 2015). Overall, 847 participants were allocated to anti‐PD1 monoclonal antibodies and 520 to chemotherapy alone. Meta‐analysis showed a statistically significant lower ≥ G3 toxicity rate for anti‐PD1 monoclonal antibodies (Analysis 12.4, RR 0.55, 95% CI 0.31 to 0.97; heterogeneity: Tau² = 0.21; Chi² = 14.24, df = 2, P = 0.0008; I² = 86%; low‐quality evidence; downgraded due to inconsistency and imprecision).
Anti‐PD1 monoclonal antibodies versus anti‐CTLA4 monoclonal antibodies
This comparison included two studies (Larkin 2015; Robert 2015b). Overall, 872 participants were allocated to anti‐PD1 monoclonal antibodies and 593 to anti‐CTLA4 monoclonal antibodies. Meta‐analysis showed a statistically significant lower ≥ G3 toxicity rate for anti‐PD1 monoclonal antibodies (Analysis 13.4, RR 0.70, 95% CI 0.54 to 0.91; heterogeneity: Tau² = 0.02; Chi² = 2.14, df = 1, P = 0.14; I² = 53%; low‐quality evidence; downgraded due to inconsistency and imprecision).
Anti‐CTLA4 monoclonal antibodies with anti‐PD1 monoclonal antibodies versus without anti‐PD1 monoclonal antibodies
This comparison included two studies (Larkin 2015; Postow 2015). Overall, 386 participants were allocated to combination therapy with anti‐PD1 and anti‐CTLA4 monoclonal antibodies and 352 to anti‐CTLA4 monoclonal antibodies alone. Meta‐analysis suggested a higher ≥ G3 toxicity rate for anti‐CTLA4 monoclonal antibodies, although the difference was not statistically significant (Analysis 14.3, RR 1.57, 95% CI 0.85 to 2.92; heterogeneity: Tau² = 0.16; Chi² = 5.00, df = 1, P = 0.03; I² = 80%; low‐quality evidence; downgraded due to inconsistency and imprecision).
Small‐molecule targeted drugs
BRAF inhibitors versus chemotherapy
This comparison included two studies (Hauschild 2012; McArthur 2014). Overall, 524 participants were allocated to single agent BRAF inhibitor and 401 to chemotherapy alone. Meta‐analysis suggested a higher ≥ G3 toxicity rate for single agent BRAF inhibitor, although the difference was not statistically significant (Analysis 18.4, RR 1.27, 95% CI 0.48 to 3.33; heterogeneity: Tau² = 0.43; Chi² = 8.35, df = 1, P = 0.004; I² = 88%; low‐quality evidence; downgraded due to inconsistency and imprecision).
MEK inhibitors versus chemotherapy
This comparison included three studies (Flaherty 2012b; Gupta 2014; Robert 2013). Description of ≥ G3 toxicity, expressed as number of participants experiencing toxicity, was available only from Robert 2013. There was a statistically significant higher ≥ G3 toxicity rate reported for MEK inhibitor (Analysis 19.4, RR 1.61, 95% CI 1.08 to 2.41; moderate‐quality evidence; downgraded due to imprecision).
BRAF inhibitors with versus without MEK inhibitors
This comparison included four studies (Flaherty 2012a; Larkin 2014; Long 2015; Robert 2015). Overall, 918 participants were allocated to combination of BRAF and MEK inhibitors and 866 to single agent BRAF inhibitor. Meta‐analysis suggested a lower ≥ G3 toxicity rate for combination therapy, although the difference was not statistically significant (Analysis 20.4, RR 1.01, 95% CI 0.85 to 1.20; heterogeneity: Tau² = 0.02; Chi² = 8.24, df = 3, P = 0.04; I² = 64%; moderate‐quality evidence; downgraded due to inconsistency).
Chemotherapy with versus without other agents
Chemotherapy with Bacillus Calmette‐Guérin (BCG) versus without BCG
Six studies investigated this comparison (Costanzi 1982; Mastrangelo 1979; Newlands 1976; Ramseur 1978; Veronesi 1984; Verschraegen 1993). Description of ≥ G3 toxicity, expressed as number of participants experiencing toxicity, was unavailable from these studies.
Chemotherapy with Corynebacterium parvum versus without C parvum
Seven studies investigated this comparison (Clunie 1980; Gough 1978; Kokoschka 1978; Presant 1979; Robidoux 1982; Thatcher 1986; Veronesi 1984). Description of ≥ G3 toxicity, expressed as number of participants experiencing toxicity, was unavailable from these studies.
Chemotherapy with tamoxifen versus without tamoxifen
Four studies investigated this comparison; all had either available or extractable HRs (Agarwala 1999; Cocconi 1992; Falkson 1998; Rusthoven 1996). Description of ≥ G3 toxicity, expressed as number of participants experiencing toxicity, was available in only from Falkson 1998. Falkson 1998 administered tamoxifen‐based polychemotherapy and single agent chemotherapy to 134 and 137 participants, respectively. There was a non statistically significant lower rate of ≥ G3 toxicity among participants undergoing tamoxifen‐based polychemotherapy (Analysis 2.4, RR 0.70, 95% CI 0.38 to 1.28; moderate‐quality evidence; downgraded due to imprecision).
Chemotherapy with sorafenib versus without sorafenib
This comparison included three studies (Flaherty 2013a; Hauschild 2009a; McDermott 2008). Overall, 596 participants were allocated to standard chemotherapy plus sorafenib and 598 to chemotherapy alone. Meta‐analysis suggested a higher ≥ G3 toxicity rate for chemotherapy plus sorafenib, although the difference was not statistically significant (Analysis 15.4, RR 1.08, 95% CI 0.93 to 1.26; heterogeneity: Tau² = 0.01; Chi² = 3.40, df = 2, P = 0.18; I² = 41%; moderate‐quality evidence; downgraded due to imprecision).
Chemotherapy with elesclomol versus without elesclomol
This comparison included two studies (O'Day 2011; O'Day 2013). Overall, 378 participants were allocated to standard chemotherapy plus elesclomol and 354 to chemotherapy alone. Description of ≥ G3 toxicity, expressed as number of participants experiencing toxicity, was available in only from O'Day 2013. O'Day 2013 reported a marginally statistically significant higher toxicity for chemotherapy plus elesclomol (Analysis 16.4, RR 1.22, 95% CI 1.00 to 1.50; moderate‐quality evidence; downgraded due to imprecision).
Chemotherapy with anti‐angiogenic drugs versus without anti‐angiogenic drugs
This comparison included two studies (Cui 2013; Kim 2012). Overall, 199 participants were allocated to standard chemotherapy plus anti‐angiogenic drugs bevacizumab (Kim 2012) and endostar (Cui 2013) and 125 to chemotherapy alone. Meta‐analysis suggested a higher ≥ G3 toxicity rate for chemotherapy alone, although the difference was not statistically significant (Analysis 17.4, RR 0.68, 95% CI 0.09 to 5.32; heterogeneity: Tau² = 1.53; Chi² = 2.34, df = 1, P = 0.13; I² = 57%; low‐quality evidence; downgraded due to inconsistency and imprecision).
Other comparisons
Single agent chemotherapy versus other single agent chemotherapy
Meta‐analysis was feasible for the comparison between dacarbazine and temozolomide. Three trials were included (Chiarion‐Sileni 2011; Middleton 2000; Patel 2011). Description of ≥ G3 toxicity, expressed as number of participants experiencing toxicity, was available from two studies (Middleton 2000; Patel 2011). Overall, 585 and 579 participants were allocated to temozolomide and dacarbazine, respectively. Temozolomide was found to be less toxic than dacarbazine, which had higher incidence of ≥ G3 toxicity, although the difference was not statistically significant (Analysis 3.4, RR 1.15, 95% CI 0.98 to 1.35; heterogeneity: Tau²: 0.00, Chi² = 0.62, df = 1, P = 0.43; I² = 0%; moderate‐quality evidence; downgraded due to imprecision).
Objective tumour response
Polychemotherapy versus single agent chemotherapy
This comparison included 15 studies (Bajetta 1994; Bajetta 2006a; Danson 2003; Daponte 2013; Dorval 1999; Falkson 1991; Falkson 1995; Falkson 1998; Gorbonova 2000; Kaufmann 2005; Kirkwood 1990; Maio 2010; Thomson 1993; Vorobiof 1994; Young 2001). Cytotoxic polychemotherapy and single agent chemotherapy was administered in 1124 and 761 participants, respectively. Meta‐analysis showed a statistically significant higher response rate for polychemotherapy (Analysis 1.3, RR 1.27, 95% CI 1.02 to 1.58; heterogeneity: Tau² = 0.00; Chi² = 5.43, df = 7, P = 0.61; I² = 0%; moderate‐quality evidence; downgraded due to imprecision).
Biochemotherapy versus chemotherapy
Chemotherapy with interferon‐alpha versus without interferon‐alpha
This comparison included 15 studies (Bajetta 1994; Bajetta 2006a; Danson 2003; Daponte 2013; Dorval 1999; Falkson 1991; Falkson 1995; Falkson 1998; Gorbonova 2000; Kirkwood 1990; Kaufmann 2005; Maio 2010; Thomson 1993; Vorobiof 1994; Young 2001). Overall, 1403 participants were allocated to chemotherapy with interferon‐alpha and 1061 to chemotherapy alone. Meta‐analysis suggested a statistically significant higher objective response for combination of chemotherapy and interferon (Analysis 4.3, RR 1.36, 95% CI 1.12 to 1.66; heterogeneity: Tau² = 0.03; Chi² = 16.93, df = 14, P = 0.26; I² = 17%; high‐quality evidence).
Chemotherapy with interleukin‐2 versus without interleukin‐2
This comparison included three studies (Hauschild 2001; Keilholz 2005; Sertoli 1999). Overall, 381 participants were allocated to chemotherapy with interleukin‐2 and 354 to chemotherapy alone. Meta‐analysis suggested a higher response rate for chemotherapy alone, although the difference was not statistically significant (Analysis 5.3, RR 0.85, 95% CI 0.64 to 1.13; heterogeneity: Tau² = 0.00; Chi² = 0.68, df = 2, P = 0.71; I² = 0%; moderate‐quality evidence; downgraded due to imprecision).
Chemotherapy with interferon‐alpha and interleukin‐2 versus without interferon‐alpha and interleukin‐2
This comparison included seven studies (Atkins 2008; Atzpodien 2002; Eton 2002; Johnston 1998; Middleton 2007; Ridolfi 2002a; Rosenberg 1999). Overall, 474 participants were allocated to chemotherapy with both interferon‐alpha and interleukin‐2 and 296 to chemotherapy alone. Meta‐analysis showed a statistically significant higher response rate for biochemotherapy (Analysis 6.3, RR 1.36, 95% CI 1.11 to 1.67; heterogeneity: Tau² = 0.00; Chi² = 6.16, df = 6, P = 0.41; I² = 3%; high‐quality evidence). When the analysis was restricted to the first‐line setting, results were similar (Analysis 7.3, RR 1.45, 95% CI 1.15 to 1.83; heterogeneity: Tau² = 0.00; Chi² = 4.25, df = 4, P = 0.37; I² = 6%).
Immune checkpoint inhibitors
Anti‐CTLA4 monoclonal antibodies plus chemotherapy versus chemotherapy alone (first line)
This comparison included two studies (Ribas 2013; Robert 2011). Overall, 578 participants were allocated to anti‐CTLA4 monoclonal antibodies and chemotherapy and 579 to chemotherapy alone. Meta‐analysis suggested a higher response rate for the combined regimen, although the difference was not statistically significant (Analysis 10.3, RR 1.28, 95% CI 0.92 to 1.77; heterogeneity: Tau² = 0.00; Chi² = 0.68, df = 1, P = 0.41; I² = 0%; moderate‐quality evidence; downgraded due to imprecision).
Anti‐CTLA4 monoclonal antibodies with immunostimulating agents versus without immunostimulating agents (second line)
This comparison included two studies (Hodi 2010a; Hodi 2014) Overall, 526 participants were allocated to anti‐CTLA4 monoclonal antibodies and with immunostimulating agents (gp100 in Hodi 2010a and GM‐CSF in Hodi 2014), and 259 to anti‐CTLA4 monoclonal antibodies alone. Meta‐analysis suggested a higher response rate for the combined regimen, although the difference was not statistically significant (Analysis 11.3, RR 0.74, 95% CI 0.38 to 1.47; heterogeneity: Tau² = 0.15; Chi² = 2.53, df = 1, P = 0.11; I² = 60%; low‐quality evidence; downgraded due to inconsistency and imprecision).
Anti‐PD1 monoclonal antibodies versus chemotherapy
This comparison included three studies (Ribas 2015; Robert 2015a; Weber 2015). Overall, 847 participants were allocated to anti‐PD1 monoclonal antibodies and 520 to chemotherapy alone. Meta‐analysis showed a statistically significant higher response rate for anti‐PD1 monoclonal antibodies (Analysis 12.3, RR 3.42, 95% CI 2.38 to 4.92; heterogeneity: Tau² = 0.02; Chi² = 2.35, df = 2, P = 0.31; I² = 15%; high‐quality evidence).
Anti‐PD1 monoclonal antibodies versus anti‐CTLA4 monoclonal antibodies
This comparison included two studies (Larkin 2015; Robert 2015b). Overall, 872 participants were allocated to anti‐PD1 monoclonal antibodies and 593 to anti‐CTLA4 monoclonal antibodies. Meta‐analysis showed a statistically significant higher response rate for anti‐PD1 monoclonal antibodies (Analysis 13.3, RR 2.47, 95% CI 2.01 to 3.04; heterogeneity: Tau² = 0.00; Chi² = 0.87, df = 1, P = 0.35; I² = 0%; high‐quality evidence).
Anti‐CTLA4 monoclonal antibodies with anti‐PD1 monoclonal antibodies versus without anti‐PD1 monoclonal antibodies
This comparison included two studies (Larkin 2015; Postow 2015). Overall, 386 participants were allocated to combination therapy with anti‐PD1 anti‐CTLA4 monoclonal antibodies and 352 to anti‐CTLA4 monoclonal antibodies alone. Meta‐analysis showed a statistically significant higher response rate for the combined regimen (Analysis 14.2, RR 3.50, 95% CI 2.07 to 5.92; heterogeneity: Tau² = 0.08; Chi² = 1.63, df = 1, P = 0.20; I² = 39%; high‐quality evidence).
Small‐molecule targeted drugs
BRAF inhibitors versus chemotherapy
This comparison included two studies (Hauschild 2012; McArthur 2014). Overall, 524 participants were allocated to single agent BRAF inhibitor and 401 to chemotherapy alone. Meta‐analysis showed a statistically significant higher response rate for single agent BRAF inhibitor (Analysis 18.3, RR 6.78, 95% CI 4.84 to 9.49; heterogeneity: Tau² = 0.00; Chi² = 0.10, df = 1, P = 0.75; I² = 0%; high‐quality evidence).
MEK inhibitors versus chemotherapy
This comparison included three studies (Flaherty 2012b; Gupta 2014; Robert 2013). Overall, 300 participants were allocated to single agent MEK inhibitor and 196 to chemotherapy alone. Meta‐analysis showed a statistically significant higher response rate for single agent MEK inhibitor (Analysis 19.3, RR 2.01, 95% CI 1.35 to 2.99; heterogeneity: Tau² = 0.00; Chi² = 1.51, df = 2, P = 0.47; I² = 0%; high‐quality evidence).
BRAF inhibitors with MEK inhibitors versus without MEK inhibitors
This comparison included four studies (Flaherty 2012a; Larkin 2014; Long 2015; Robert 2015). Overall, 918 participants were allocated to combination of BRAF and MEK inhibitors and 866 to single agent BRAF inhibitor. Meta‐analysis showed a statistically significant higher response rate for combination therapy (Analysis 20.3, RR 1.32, 95% CI 1.20 to 1.46; heterogeneity: Tau² = 0.00; Chi² = 3.90, df = 3, P = 0.27; I² = 23%; high‐quality evidence).
Chemotherapy with other agents versus without other agents
Chemotherapy with Bacillus Calmette‐Guérin (BCG) versus without BCG
Six studies investigated this comparison (Costanzi 1982; Mastrangelo 1979; Newlands 1976; Ramseur 1978; Veronesi 1984; Verschraegen 1993). Overall, 658 participants were allocated to chemotherapy with BCG and 649 to chemotherapy alone. Meta‐analysis suggested a higher response rate for chemotherapy alone, although the difference was not statistically significant (Analysis 8.2, RR 0.85, 95% CI 0.65 to 1.12; heterogeneity: Tau² = 0.00; Chi² = 4.76, df = 5, P = 0.45; I² = 0%; moderate‐quality evidence; downgraded due to imprecision).
Chemotherapy with Corynebacterium parvum versus without C parvum
Seven studies investigated this comparison (Clunie 1980; Gough 1978; Kokoschka 1978; Presant 1979; Robidoux 1982; Thatcher 1986; Veronesi 1984). Overall, 247 participants were allocated to chemotherapy with C parvum and 290 to chemotherapy alone. Meta‐analysis suggested a higher response rate for chemotherapy plus C parvum, although the difference was not statistically significant (Analysis 9.2, RR 1.03, 95% CI 0.77 to 1.38; heterogeneity: Tau² = 0.00; Chi² = 5.63, df = 6, P = 0.47; I² = 0%; moderate‐quality evidence; downgraded due to imprecision).
Chemotherapy with tamoxifen versus without tamoxifen
Four studies investigated this comparison (Agarwala 1999; Cocconi 1992; Falkson 1998; Rusthoven 1996). Tamoxifen‐based polychemotherapy was administered to 326 participants and 317 received cytotoxic chemotherapy alone. Tamoxifen was associated with a non statistically significant higher response rate (Analysis 2.3, RR 1.33, 95% CI 0.94 to 1.89; heterogeneity: Tau² = 0.02; Chi² = 3.44, df = 3, P = 0.33; I² = 13%; moderate‐quality evidence; downgraded due to imprecision).
Chemotherapy with sorafenib versus without sorafenib
This comparison included three studies (Flaherty 2013a; Hauschild 2009a; McDermott 2008). Overall, 596 participants were allocated to standard chemotherapy plus sorafenib and 598 to chemotherapy alone. Meta‐analysis suggested a higher response rate for chemotherapy plus sorafenib, although the difference was not statistically significant (Analysis 15.3, RR 1.17, 95% CI 0.91 to 1.50; heterogeneity: Tau² = 0.00; Chi² = 1.41, df = 2, P = 0.49; I² = 0%; moderate‐quality evidence; downgraded due to imprecision).
Chemotherapy with elesclomol versus without elesclomol
This comparison included two studies (O'Day 2011; O'Day 2013). Overall, 378 participants were allocated to standard chemotherapy plus elesclomol and 354 to chemotherapy alone. Meta‐analysis suggested a higher response rate for chemotherapy plus elesclomol, although the difference was not statistically significant (Analysis 16.3, RR 1.86, 95% CI 0.98 to 3.50; heterogeneity: Tau² = 0.00; Chi² = 0.12, df = 1, P = 0.73; I² = 0%; moderate‐quality evidence; downgraded due to imprecision).
Chemotherapy with anti‐angiogenic drugs versus without anti‐angiogenic drugs
This comparison included two studies (Cui 2013; Kim 2012). Overall, 199 participants were allocated to standard chemotherapy plus anti‐angiogenic drugs bevacizumab (Kim 2012) and endostar (Cui 2013) and 125 to chemotherapy alone. Meta‐analysis suggested a statistically significant higher response rate for the combination of chemotherapy plus anti‐angiogenic agents, although the difference was not statistically significant (Analysis 17.3, RR 1.71, 95% CI 0.96 to 3.03; heterogeneity: Tau² = 0.00; Chi² = 0.20, df = 1, P = 0.65; I² = 0%; moderate‐quality evidence; downgraded due to imprecision).
Other comparisons
Single agent chemotherapy versus other single agent chemotherapy
Meta‐analysis was feasible for the comparison between temozolomide and dacarbazine. Three trials were eligible (Chiarion‐Sileni 2011; Middleton 2000; Patel 2011). Overall, 659 and 654 participants were allocated to temozolomide and dacarbazine, respectively. Temozolomide was associated with a non statistically significant higher response rate compared to single agent dacarbazine (Analysis 3.3, RR 1.21, 95% CI 0.85 to 1.73; heterogeneity: Tau² = 0.03; Chi² = 2.75, df = 2 (P = 0.25); I² = 27%; moderate‐quality evidence; downgraded due to imprecision).
Quality of life
Polychemotherapy versus single agent chemotherapy
No data were available for this comparison.
Biochemotherapy versus chemotherapy
Chemotherapy with interferon‐alpha versus without interferon‐alpha
The effect on quality of life after dacarbazine plus recombinant interferon‐alpha was compared to dacarbazine alone for participants with metastatic malignant melanoma. In Young 2001, no differences in quality of life were observed between treatment groups. The same finding was reported in Thomson 1993 but fatigue and activity, as measured using linear analogue scale of assessment (LASA) scale and functional living index respectively, both improved in the combination treatment group.
Chemotherapy with interferon‐alpha and interleukin‐2 versus without interferon‐alpha and interleukin‐2
Chiarion‐Sileni 2003 used the Rotterdam Symptom Checklist (RSCL) questionnaire to compare quality of life in advanced melanoma participants receiving biochemotherapy or chemotherapy. Deterioration in overall quality of life reported with biochemotherapy was significantly worse than with chemotherapy. Mean scores decreased in all domains in the biochemotherapy group, but in the chemotherapy group, only activity level and physical symptom distress scores showed deterioration.
Interleukin‐2 with histamine versus without histamine
This comparison was assessed in Agarwala 2002 but quality of life was evaluated and reported in an extension study (Beusterien 2003). Three distinct assessments were completed by participants at different time points. Overall State of Health (OSH) and General Health Perception (GHP) scores did not differ significantly between groups. However, Quality of Well Being Scale ‐ Self‐Administered (QWB‐SA) scores deteriorated more quickly over time in the interleukin‐2 only group compared to the interleukin‐2 plus histamine group. This led to a significant difference in median quality‐adjusted survival duration in favour of the interleukin‐2 plus histamine group.
Immune checkpoint inhibitors
Anti‐CTLA4 monoclonal antibodies (first line)
Sherrill 2013 conducted a quality‐adjusted time without symptoms of disease or toxicity of treatment (Q‐TWIST) analysis for participants with untreated stage III/IV melanoma to compare quality of life after ipilimumab plus dacarbazine versus placebo plus dacarbazine. Quality‐adjusted survival was not significantly different between the groups during the first year of study (0.50 months favouring the ipilimumab/dacarbazine group) but after extended follow‐up, this difference gradually increased to 1.5 months, 2.36 months and 3.28 months at 2, 3 and 4 years, respectively.
Anti‐CTLA4 monoclonal antibodies with immunostimulating agents versus without other immunostimulating agents (second line)
This comparison was evaluated in Revicki 2012 where health‐related quality of life (HRQoL) outcomes were assessed during the study's 12 week treatment induction period for participants with stage III or IV melanoma. Ipilimumab with or without gp1000 vaccine was compared to gp100 vaccine alone and was shown to have no significant negative impact on HRQoL compared to gp100 alone. Constipation was reported to be significantly improved in the ipilimumab arms compared to the gp100 alone arm.
Anti‐PD1 monoclonal antibodies versus chemotherapy
In KEYNOTE‐002, a randomised, controlled phase II trial, participants with ipilimumab‐refractory melanoma were treated with either pembrolizumab (anti‐PD1 monoclonal antibody) or chemotherapy (Ribas 2015). In terms of health‐related quality of life, participants treated with pembrolizumab consistently reported less deterioration in individual function and symptoms scales when compared to those treated with chemotherapy. Furthermore, fewer participants in the pembrolizumab group reported decrements of more than 10 points in the global health status quality of life score compared to the chemotherapy group.
Small‐molecule targeted drugs
BRAF inhibitors versus chemotherapy
In Grob 2014, single agent dabrafenib (a BRAF inhibitor) was found to be superior to dacarbazine chemotherapy in improving quality of life for participants with metastatic melanoma in the BREAK‐3 study. More specifically, on the basis of EORTC QLQ‐C30 questionnaires, there was an enhancement of emotional and social functioning as well as an improvement in unwanted symptoms such as nausea and vomiting, appetite loss, diarrhoea, fatigue, dyspnoea and insomnia.
MEK inhibitors versus chemotherapy
In Schadendorf 2014, participants with BRAF mutated metastatic melanoma from the METRIC study were assessed in terms of quality of life after receiving the MEK inhibitor trametinib as a single agent versus chemotherapy. Based on EORTC QLQ‐C30 questionnaires the trametinib group showed improvement from baseline in various parameters including better global health, physical, role, and social functioning as well as reduction in fatigue, pain, insomnia, nausea and vomiting, constipation and dyspnoea.
BRAF inhibitors with versus without MEK inhibitors
Impact on quality of life with the combination of dabrafenib and trametinib versus dabrafenib monotherapy in participants with BRAF mutated metastatic melanoma was evaluated in Schadendorf 2015. Global health dimension scores from baseline were better in the combination therapy group. A trend favouring combination therapy was also observed for pain, insomnia as well as physical, social, role, emotional and cognitive functioning. However, the opposite trend was reported for nausea and vomiting, diarrhoea, dyspnoea and constipation with significant improvements from baseline in the dabrafenib monotherapy group.
Other comparisons
Kiebert 2003 investigated temozolomide versus dacarbazine and assessed quality of life in participants being treated for metastatic melanoma. Kiebert 2003 found that treatment with temozolomide led to functional improvements, improved emotional well‐being and decreased symptoms compared to treatment with dacarbazine. At 12 weeks post‐treatment, participants in the temozolomide group reported better EORTC QLQ‐C30 subscale scores in all but two function and symptom categories with better physical functioning, less fatigue and reduced sleep disturbances. Improvements in all symptoms except diarrhoea were in favour of temozolomide at week 24 and there was near significant enhancement in cognitive functioning.
Fotemustine versus dacarbazine
Avril 2004 assessed fotemustine versus dacarbazine. No significant difference was observed between treatment arms.
Vindesine versus observation
Quality of life after adjuvant treatment with single agent vindesine was compared to observation alone in participants with metastasised melanoma after complete metastasectomy in Eigentler 2008. However, feedback from EORTC‐QLQ questionnaires was insufficient to draw any conclusions.
Polychemotherapy versus best supportive care
Best supportive care plus a polychemotherapy regimen consisting of cisplatin, vindesine and dacarbazine was compared to best supportive care alone for quality of life impact in participants with advanced melanoma in Hofmann 2011. Despite the deterioration in global health status reported in both arms, no statistically significant difference was observed between the treatments in any aspect of quality of life based on EORTC QLQ‐C30 questionnaires.
Economic evaluation
The economic aspects of various treatments were assessed in a single study; therefore no reliable conclusions could be drawn (Middleton 2000). The treatment costs of single agent dacarbazine and single agent temozolomide for advanced malignant melanoma were evaluated by Hillner 2000 and compared as part of a post hoc economic analysis independent from the actual clinical trial (Middleton 2000). Hillner 2000 combined costs and survival duration to analyse the incremental cost‐effectiveness of temozolomide over dacarbazine. Despite dacarbazine displaying a trend toward superior cost‐effectiveness, statistically, temozolomide was deemed to be equally effective, if not better at improving survival, with a higher but acceptable incremental cost per life‐year below the threshold of USD 50,000.
We identified one ongoing phase III RCT (NCT02821013) which plans to evaluate the economic aspects of continuous versus intermittent anti‐PD‐1 therapy in participants with metastatic melanoma.
Network meta‐analysis findings
We focused attention on four drug classes (chemotherapy, biochemotherapy, immune checkpoint inhibitors and small‐molecule targeted drugs) and two primary outcomes (progression‐free survival and toxicity) for the network meta‐analysis. Reasons for this decision are provided in the following sections.
Drug classes
Chemotherapy was chosen as the most common treatment among the included trials, which made chemotherapy the ideal common comparator (a key feature in network meta‐analysis, especially when performed according to the augmented data technique as suggested by White 2015, as we did; see Figure 5). We applied the following principles for other drug classes:
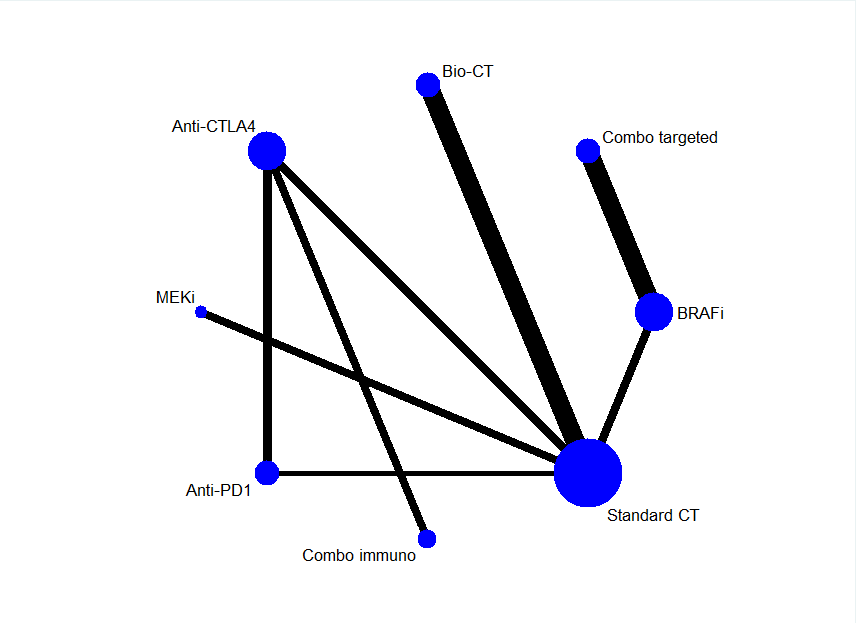
Network plot
-
We chose drug classes for which high‐quality evidence was available for effects on patient survival based on direct comparison data. This choice was dictated by the need to include high‐quality data in the analysis: network meta‐analysis enables indirect comparisons to be made and generate treatment ranking (information not provided by conventional pair‐wise meta‐analysis). However, reliability of findings unavoidably hinges on the quality of imputed data.
-
We aimed to reduce the complexity of the network (by decreasing the number of nodes connecting each drug regimen to the common comparator, especially when few trials or only one trial represented a single drug regimen) and increase the robustness of the network (by decreasing the number of drug regimens analysed, especially when few trials or only one trial represented a single drug regimen), and therefore, decrease the likelihood of model instability or lack of model convergence.
-
We focused our attention on drugs currently approved for melanoma treatment to provide information that is most useful in routine clinical practice.
Outcomes
We chose one survival outcome (progression‐free survival) to represent treatment benefit, and toxicity to represent treatment harm. We chose to investigate progression‐free survival instead of overall survival because:
-
Progression‐free survival is widely accepted as a surrogate of overall survival, especially in the advanced/metastatic setting (as was the case for this review); progression‐free survival is generally used as the outcome for drug approval in this setting.
-
Data for overall survival are not yet mature for recent treatments (such as immune checkpoint inhibitors and small‐molecule targeted drugs), which are currently acknowledged as the most effective therapies for people with melanoma.
-
Progression‐free survival data are available for more studies compared to overall survival data (which is, at least in part, a corollary of the previous consideration).
-
Progression‐free survival is virtually free from the issue (typical of overall survival) of the cross‐over effect, that is, participants failing one treatment (e.g. less effective reference therapy) are given another treatment (e.g. more effective experimental therapy), which can confound the results of data analysis.
Adopting these criteria, a total of 19 studies were eligible for inclusion in the network meta‐analysis (Atkins 2008; Eton 2002; Flaherty 2012a; Flaherty 2012b; Gupta 2014; Hauschild 2012; Larkin 2014; Larkin 2015; Long 2015; McArthur 2014; Middleton 2007; Postow 2015; Ribas 2013; Ridolfi 2002a; Robert 2011; Robert 2013; Robert 2015; Robert 2015a; Robert 2015b). Studies compared eight treatments: chemotherapy; biochemotherapy (with both interferon‐alpha and interleukin‐2); anti‐CTLA4 monoclonal antibodies; anti‐PD1 monoclonal antibodies; anti‐CTLA4 plus anti‐PD1 monoclonal antibodies; BRAF inhibitors; MEK inhibitors; and BRAF plus MEK inhibitors (see network plot, Figure 5).
A total of 7632 participants were randomised to receive either conventional chemotherapy (N = 1777), biochemotherapy (N = 507), anti‐CTLA4 monoclonal antibodies (N = 886), anti‐PD1 monoclonal antibodies (N = 1407), anti‐CTLA4 plus PD‐1 monoclonal antibodies (N = 408), BRAF inhibitors (N = 1285), MEK inhibitors (N = 259), or BRAF plus MEK inhibitors (N = 918).
Progression‐free survival
Progression‐free survival data were available for all trials (Atkins 2008; Eton 2002; Flaherty 2012a; Flaherty 2012b; Gupta 2014; Hauschild 2012; Larkin 2014; Larkin 2015; Long 2015; McArthur 2014; Middleton 2007; Postow 2015; Ridolfi 2002a; Robert 2011; Robert 2013; Robert 2015; Robert 2015a; Robert 2015b) except Ribas 2013.
Network meta‐analysis, which was conducted to investigate treatment modalities, generated 28 comparisons. Network meta‐analysis results were consistent with standard pair‐wise meta‐analysis for seven comparisons: biochemotherapy versus chemotherapy; anti‐PD1 monoclonal antibodies versus chemotherapy; anti‐PD1 monoclonal antibodies versus anti‐CTLA4 monoclonal antibodies; anti‐CTLA4 plus anti‐PD1 monoclonal antibodies versus anti‐CTLA4 monoclonal antibodies; BRAF inhibitors versus chemotherapy; MEK inhibitors versus chemotherapy; and BRAF plus MEK inhibitors versus BRAF inhibitors (Figure 6).
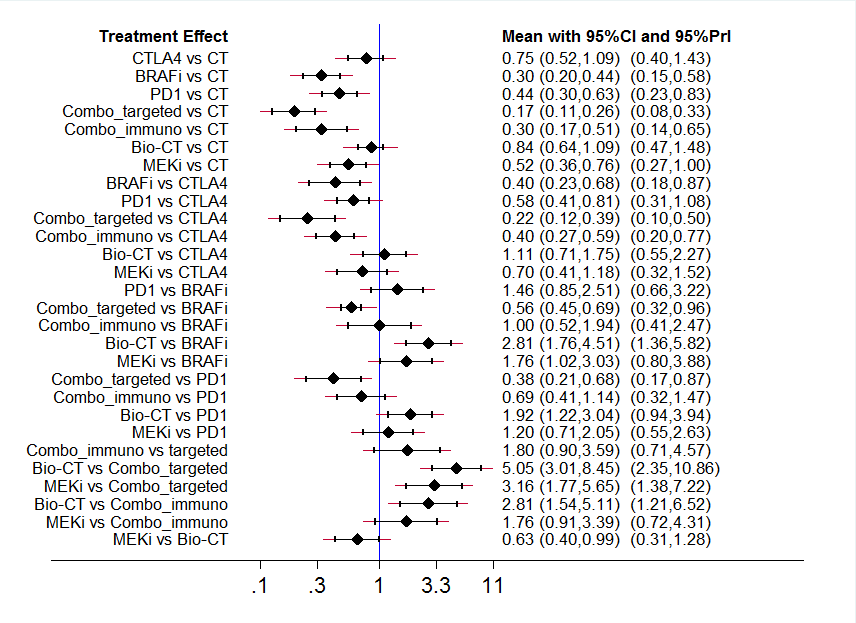
Interval plot: network meta‐analysis results for progression‐free survival. The network included eight treatment modalities. The effect measure is reported as hazard ratio (HR). CI: confidence interval; PrI: predictive interval.
Overall, we did not observe statistically significant network inconsistency: the P value of the design‐by‐treatment interaction model (which addresses both loop and design inconsistency at the global network level) was equal to 0.764. A comparison between findings of conventional pair‐wise meta‐analysis and indirect comparisons generated by network meta‐analysis was feasible only for the anti‐PD1 versus anti‐CTLA4 monoclonal antibodies comparison. The results showed a high correlation between both types of meta‐analysis technique: the HR was 0.54 (95% CI 0.50 to 0.60) for conventional meta‐analysis and 0.58 (95% CI 0.41 to 0.81) for network meta‐analysis (ratio of ratio = 0.93, low risk of loop inconsistency).
Indirect comparisons indicated that (Figure 6):
-
Compared to chemotherapy, both combination of immune checkpoint inhibitors (HR 0.30, 95% CI 0.17 to 0.51; moderate‐quality evidence, downgraded due to indirectness) and combination of small‐molecule targeted drugs (HR 0.17, 95% CI 0.11 to 0.26; moderate‐quality evidence, downgraded due to indirectness) improved progression‐free survival. Anti‐CTLA4 monoclonal antibodies did not significantly improve progression‐free survival (very low‐quality evidence; downgraded due to inconsistency, imprecision and indirectness).
-
Compared to anti‐CTLA4 monoclonal antibodies, both BRAF inhibitors (HR 0.40, 95% CI 0.23 to 0.68; moderate‐quality evidence; downgraded due to indirectness), and combination of small‐molecule targeted drugs (HR 0.22, 95% CI 0.12 to 0.39; moderate‐quality evidence; downgraded due to indirectness) were associated with better progression‐free survival. In contrast, neither biochemotherapy (very low‐quality evidence; downgraded due to inconsistency, imprecision and indirectness) nor MEK inhibitors (very low‐quality evidence; downgraded due to inconsistency, imprecision and indirectness) significantly differed from anti‐CTLA4 monoclonal antibodies.
-
Compared to BRAF inhibitors, both biochemotherapy (HR 2.81, 95% CI 1.76 to 4.51; moderate‐quality evidence, downgraded due to indirectness) and MEK inhibitors (HR 1.76, 95% CI 1.02 to 3.03; very low‐quality evidence, downgraded due to inconsistency, imprecision and indirectness) were associated with worse progression‐free survival. Neither anti‐PD1 monoclonal antibodies (very low‐quality evidence, downgraded due to inconsistency, imprecision and indirectness) nor combination of immune checkpoint inhibitors (very low‐quality evidence, downgraded due to inconsistency, imprecision and indirectness) significantly differed from BRAF inhibitors.
-
Compared to anti‐PD1 monoclonal antibodies, the combination of small‐molecule targeted drugs improved progression‐free survival (HR 0.38, 95% CI 0.21 to 0.68; moderate‐quality evidence, downgraded due to indirectness), whereas biochemotherapy was associated with worse progression‐free survival (HR 1.92, 95% CI 1.22 to 3.04; low‐quality evidence, downgraded due to inconsistency and indirectness). Neither combination of immune checkpoint inhibitors (very low‐quality evidence, downgraded due to inconsistency, imprecision and indirectness) nor MEK inhibitors (very low‐quality evidence, downgraded due to inconsistency, imprecision and indirectness) significantly differed from anti‐PD1 monoclonal antibodies.
-
Compared to the combination of small‐molecule targeted drugs, both biochemotherapy (HR 5.05, 95% CI 3.01 to 8.45; moderate‐quality evidence, downgraded due to indirectness) and MEK inhibitors (HR 3.16, 95% CI 1.77 to 5.65; moderate‐quality evidence, downgraded due to indirectness) were associated with worse progression‐free survival. Combination of immune checkpoint inhibitors did not significantly differ from combination of small‐molecule targeted drugs (very low‐quality evidence, downgraded due to inconsistency, imprecision and indirectness).
-
Compared to combination of immune checkpoint inhibitors, biochemotherapy was associated with worse progression‐free survival (HR 2.81, 95% CI 1.54 to 5.11; moderate‐quality evidence, downgraded due to indirectness). MEK inhibitors did not significantly differ from combination of immune checkpoint inhibitors (very low‐quality evidence, downgraded due to inconsistency, imprecision and indirectness).
-
Compared to biochemotherapy, MEK inhibitors improved progression‐free survival (HR 0.63, 95% CI 0.40 to 0.99; very low‐quality evidence, downgraded due to inconsistency, imprecision and indirectness).
Toxicity
Toxicity data were available for all studies included in the network meta‐analysis (Atkins 2008; Eton 2002; Flaherty 2012a; Flaherty 2012b; Gupta 2014; Hauschild 2012; Larkin 2014; Larkin 2015; Long 2015; McArthur 2014; Middleton 2007; Postow 2015; Ribas 2013; Ridolfi 2002a; Robert 2011; Robert 2013; Robert 2015; Robert 2015a; Robert 2015b) (Figure 7).
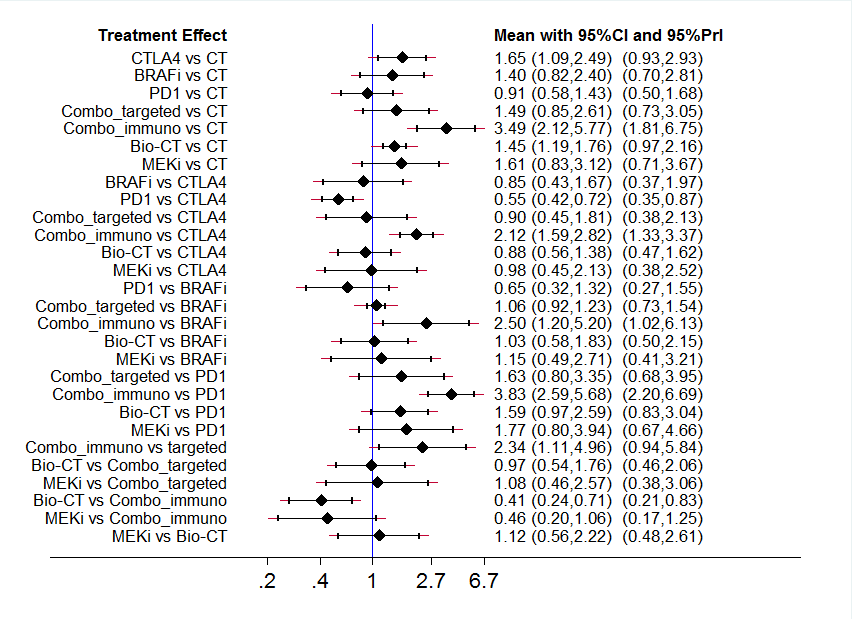
Interval plot: network meta‐analysis results for high grade toxicity. The network included eight treatment modalities. The effect measure is reported as relative risk (RR). CI: confidence interval; PrI: predictive interval.
Network meta‐analysis to investigate treatment modalities generated 28 comparisons. Network meta‐analysis results were consistent with standard pair‐wise meta‐analysis for seven comparisons: biochemotherapy versus chemotherapy; anti‐PD1 monoclonal antibodies versus chemotherapy; anti‐PD1 monoclonal antibodies versus anti‐CTLA4 monoclonal antibodies; anti‐CTLA4 plus anti‐PD1 monoclonal antibodies versus anti‐CTLA4 monoclonal antibodies; BRAF inhibitors versus chemotherapy; MEK inhibitors versus chemotherapy; and BRAF plus MEK inhibitors versus BRAF inhibitors) (Figure 6).
A comparison between direct and indirect evidence (findings of conventional pair‐wise meta‐analysis versus findings of indirect comparisons generated by network meta‐analysis) was feasible only for the anti‐PD1 versus anti‐CTLA4 monoclonal antibodies comparison. The results showed a good correlation between types of meta‐analysis technique: the RR was 0.70 (95% CI 0.54 to 0.91) for conventional meta‐analysis and 0.55 (95% CI 0.42 to 0.72) for network meta‐analysis (ratio of ratio = 1.27, low risk of loop inconsistency). However, when we looked at the overall network inconsistency, we found a highly statistically significant inconsistency (treatment by design interaction model P = 0.001), which undermines the reliability of the following findings regarding indirect comparisons (Figure 7):
-
Compared to chemotherapy, both anti‐CTLA4 monoclonal antibodies (RR 1.65, 95% CI 1.09 to 2.49; very low‐quality evidence; downgraded due to inconsistency, imprecision and indirectness) and combination of immune checkpoint inhibitors (RR 3.49, 95% CI 2.12 to 5.77; moderate‐quality evidence, downgraded due to indirectness) increased toxicity. Combination of small‐molecule targeted drugs did not significantly differ from chemotherapy (very low‐quality evidence; downgraded due to inconsistency, imprecision and indirectness).
-
None of BRAF inhibitors (very low‐quality evidence; downgraded due to inconsistency, imprecision and indirectness), combination of small‐molecule targeted drugs (very low‐quality evidence; downgraded due to inconsistency, imprecision and indirectness), biochemotherapy (very low‐quality evidence; downgraded due to inconsistency, imprecision and indirectness), or MEK inhibitors (very low‐quality evidence; downgraded due to inconsistency, imprecision and indirectness) significantly differed from anti‐CTLA4 monoclonal antibodies.
-
Compared to BRAF inhibitors, combination of immune checkpoint inhibitors increased toxicity (RR 2.50, 95% CI 1.20 to 5.20; moderate‐quality evidence, downgraded due to indirectness). None of anti‐PD1 monoclonal antibodies (very low‐quality evidence; downgraded due to inconsistency, imprecision and indirectness), biochemotherapy (very low‐quality evidence; downgraded due to inconsistency, imprecision and indirectness) or MEK inhibitors (very low‐quality evidence; downgraded due to inconsistency, imprecision and indirectness) significantly differed from BRAF inhibitors.
-
Compared to anti‐PD1 monoclonal antibodies, the combination of immune checkpoint inhibitors increased toxicity (RR 3.83, 95% CI 2.59 to 5.68; moderate‐quality evidence, downgraded due to indirectness). None of combination of small‐molecule targeted drugs (very low‐quality evidence, downgraded due to inconsistency, imprecision and indirectness), biochemotherapy (very low‐quality evidence, downgraded due to inconsistency, imprecision and indirectness), or MEK inhibitors (very low‐quality evidence, downgraded due to inconsistency, imprecision and indirectness) significantly differed from anti‐PD1 monoclonal antibodies.
-
Compared to the combination of small‐molecule targeted drugs, the combination of immune checkpoint inhibitors increased toxicity (RR 2.34, 95% CI 1.11 to 4.96; low‐quality evidence, downgraded due to inconsistency and indirectness). Neither biochemotherapy (very low‐quality evidence, downgraded due to inconsistency, imprecision and indirectness) nor MEK inhibitors (very low‐quality evidence, downgraded due to inconsistency, imprecision and indirectness) significantly differed from the combination of small‐molecule targeted drugs.
-
Compared to the combination of immune checkpoint inhibitors, biochemotherapy was associated with lower toxicity (RR 0.41, 95% CI 0.24 to 0.71; moderate‐quality evidence, downgraded due to indirectness). MEK inhibitors did not significantly differ from the combination of immune checkpoint inhibitors (very low‐quality evidence, downgraded due to inconsistency, imprecision and indirectness).
-
MEK inhibitors did not significantly differ from biochemotherapy (very low‐quality evidence, downgraded due to inconsistency, imprecision and indirectness).
Ranking findings
Results of ranking analysis for progression‐free survival (expressed as surface under the cumulative ranking (SUCRA) values, ranging from 0 (worst case) to 1 (best case)) suggested that the combination of BRAF plus MEK inhibitors is the best treatment option (SUCRA: 0.99), followed by BRAF inhibitors (SUCRA: 0.77) and combination of anti‐CLA4 plus anti‐PD1 monoclonal antibodies (SUCRA: 0.77), anti‐PD1 monoclonal antibodies (SUCRA: 0.56), MEK inhibitors (SUCRA: 0.46), anti‐CTAL4 monoclonal antibodies (SUCRA: 0.25), biochemotherapy (SUCRA: 0.18), and conventional chemotherapy (SUCRA: 0.02).
Ranking analysis results for (high grade) toxicity suggested that anti‐PD1 monoclonal antibodies were associated with the best safety profile (SUCRA: 0.91), followed by chemotherapy (SUCRA: 0.87), BRAF inhibitors (SUCRA: 0.55), biochemotherapy (SUCRA: 48), the combination of BRAF plus MEK inhibitors (SUCRA: 0.42), MEK inhibitors (SUCRA: 0.41), anti‐CTLA4 monoclonal antibodies (SUCRA: 0.36), and the combination of anti‐CTLA4 plus anti‐PD1 monoclonal antibodies (SUCRA: 0.01). However, these results cannot be considered fully reliable due to the finding of network inconsistency as described in the preceding paragraph.
The findings for both efficacy (progression‐free survival) and acceptability (inverse of toxicity) were combined together in a bivariate ranking plot. Noticeably, in this plot toxicity is transformed into acceptability by using the inverse values of the corresponding relative risks: therefore, higher values indicate higher acceptability (due to lower toxicity) (Figure 8): accordingly, the ideal treatment (highest performance = best efficacy + best acceptability) should appear in the upper right corner of the plot. The combination of BRAF plus MEK inhibitors was associated with the highest treatment efficacy, but it was also associated with lower acceptability. In contrast, anti‐PD1 monoclonal antibodies showed the best acceptability performance, but resulted less effective than the combination of small‐molecule targeted drugs. Accordingly, no 'ideal' treatment is available.

Ranking plot. Ranking plot representing simultaneously the efficacy (progression‐free survival) on the X axis and the acceptability (the inverse of toxicity) on the Y axis. The network included eight treatments for patients with metastatic melanoma. Optimal treatment should be characterised by both high efficacy and acceptability and should be in the right upper corner of this graph.
Quality assessment of trials and evidence grading
None of the studies included in the network meta‐analysis presented a severe risk of bias (as described in Risk of bias in included studies). Furthermore, the analysis of the comparison‐adjusted funnel plot (a funnel plot specifically adapted for network meta‐analysis) did not indicate any evident risk of publication bias (Figure 9). These findings, coupled with the absence of network inconsistency and the lack of violation of the transitivity assumption, enabled us to grade the evidence generated from indirect comparisons for progression‐free survival with confidence.

Comparison adjusted funnel plot for network meta‐analysis of progression‐free survival
In contrast, significant network inconsistency detected during toxicity data analysis add some uncertainty on the findings observed for this outcome.
Other findings
Immunostimulating agents
Immunostimulating agents other than those described above (cytokines (e.g. interferon‐alpha and interleukin‐2), immune checkpoint inhibitors, bioproducts of bacteria such as BCG and Cparvum) have been tested in clinical trials for the treatment of people with metastatic melanoma. In particular, gp100 (a melanoma associated antigen) and granulocyte‐macrophage colony stimulating factor (GM‐CSF) were administered in association with anti‐CTLA4 monoclonal antibody ipilimumab and evaluated in single RCTs (ipilimumab with gp100, Hodi 2010a; ipilimumab plus GM‐CSF, Hodi 2014). The gp100 melanoma antigen was also tested in combination with interleukin‐2 (Schwartzentruber 2011a). Another agent, thymosin‐alpha, was tested in association with interferon and dacarbazine (Maio 2010). In single studies, these combinations, except gp100 plus ipilimumab, resulted in prolonged survival with minimal toxicity. GM‐CSF significantly reduced ipilimumab toxicity.
When these findings were combined in a meta‐analysis, the addition of immunostimulating agents had an impact on participants' overall survival (Analysis 21.1, HR 0.82, 95% CI 0.67 to 0.99). However, this result was characterised by high between‐study heterogeneity (I² = 53%). Sensitivity analysis conducted using the leave‐one‐out procedure suggested that when Hodi 2010a was excluded, heterogeneity dropped to 0% and treatment effect was greater (HR 0.75, 95% CI 0.64 to 0.88): this effect was likely due to adding gp100 to ipilimumab did not add any therapeutic benefit. We also found a non‐significant positive effect of immunostimulating agents on progression‐free survival (HR 0.92, 95% CI 0.74 to 1.14, Analysis 21.2), although this result did not reach statistical significance and heterogeneity was high (I² = 74%). Again, analysis without Hodi 2010a yielded no heterogeneity (I² = 0%) and showed a statistically significant progression‐free survival advantage (HR 0.82, 95% CI 0.73 to 0.92). Analysis for objective tumour response showed better response rates for combined treatment although with high heterogeneity (RR 1.23, 95% CI 0.60 to 2.50; I² = 72%, Analysis 21.3). Unfortunately, we could not identify the source of heterogeneity. Similarly, there was a non‐significant reduction in high‐grade toxicity (RR 0.92, 95% CI 0.77 to 1.08; I² = 45%, Analysis 21.4). We could not identify possible reasons for heterogeneity.
Lenalidomide did not improve tumour response (5.3% versus 5.8%; P = 0.82), time to progression (median 3.0 months versus 2.1 months; P = 0.19), or overall survival (median 5.9 months versus 7.4 months, respectively; P = 0.32) compared to placebo in participants with metastatic melanoma (Eisen 2010).
Taxanes
The taxanes docetaxel and paclitaxel were administered to participants enrolled in the control arm of several studies (Flaherty 2013a; Gupta 2014; Hamid 2014; Hauschild 2009a; Kim 2012; O'Day 2009; O'Day 2013; Weber 2015; Zimpfer‐Rechner 2003). Paclitaxel was the experimental treatment in two studies (Bedikian 2011; Hersh 2015) and tested as docosahexaenoic acid‐paclitaxel by Bedikian 2011 and nab‐paclitaxel by Hersh 2015. Although docosahexaenoic acid‐paclitaxel did not impact participant outcomes, nab‐paclitaxel improved progression‐free survival (the primary study endpoint) compared to dacarbazine (HR 0.79, 95% CI 0.63 to 0.99).
Adjuvant therapies after surgery
Three trials investigated different systemic therapeutic strategies after surgery: chemotherapy with vindesine (Eigentler 2008); chemo‐immunotherapy with dacarbazine and C parvum (Balch 1984); and a polypeptide vaccine or GM‐CSF (Lawson 2015) without showing any difference in either tumour response or prognosis.
Discussion
Summary of main results
This Cochrane Review summarised the available evidence on systemic treatments for people with metastatic melanoma. While effectiveness of conventional chemotherapy alone has never been convincingly proven, our results suggest that more than one treatment is more effective than chemotherapy. For instance, the addition of immunostimulating cytokines (such as interleukin‐2 and interferon‐alpha) to chemotherapy (biochemotherapy) prolongs progression‐free survival (high‐quality evidence) (at the cost of higher rates of toxicity (high‐quality evidence)), although this result does not translate into a significant overall survival benefit (high‐quality evidence) (summary of findings Table 9).
In recent years, two new classes of therapeutic agents have been implemented in the clinical setting: immune checkpoint inhibitors (anti‐CTLA4 and anti‐PD1 monoclonal antibodies) and small‐molecule targeted drugs (BRAF and MEK inhibitors), which are active exclusively against BRAF‐mutated melanoma. These new treatments have revolutionised the landscape of metastatic melanoma treatment. The results of our meta‐analysis showed that when chemotherapy was combined with anti‐CTLA4 monoclonal antibodies (ipilimumab and tremelimumab), progression‐free survival was likely to be significantly improved compared to chemotherapy alone. However, this benefit is probably associated with higher toxicity rates (moderate‐quality evidence) and comparative effectiveness may not translate into a significant overall survival advantage (summary of findings Table 3). Compared to conventional chemotherapy, anti‐PD1 monoclonal antibodies (nivolumab and pembrolizumab) improved overall survival (high‐quality evidence), probably leads to longer progression‐free survival (moderate‐quality evidence), and may lead to a lower incidence of high‐grade toxicity (low‐quality evidence) (summary of findings Table 1). When comparing both immune checkpoint inhibitors (i.e. anti‐PD1 monoclonal antibodies and anti‐CTLA4 monoclonal antibodies) against each other, anti‐PD1 monoclonal antibodies improved overall survival and progression‐free survival more than anti‐CTLA4 monoclonal antibodies (both high‐quality evidence), and the former may result in better toxicity (low‐quality evidence) (summary of findings Table 2). Moreover, the combination of anti‐PD1 and anti‐CTLA4 monoclonal antibodies yielded better results in terms of progression‐free survival (high‐quality evidence) compared to anti‐CTLA4 monoclonal antibodies alone; there may be no significant difference in toxicity (low‐quality evidence) (summary of findings Table 4). No data for overall survival were available for this comparison.
Among small‐molecule targeted drugs, BRAF inhibitors for BRAF‐mutated melanoma significantly improved both progression‐free survival and overall survival (both high‐quality evidence) compared to conventional chemotherapy; there may be no significant difference in toxicity (low‐quality evidence) (summary of findings Table 5). Compared to chemotherapy, MEK inhibitors for BRAF‐mutated melanoma probably increased progression‐free survival (moderate‐quality evidence), but are likely to have higher toxicity rates (moderate‐quality evidence). MEK inhibitors may not significantly improve overall survival (summary of findings Table 6). Interestingly, when a BRAF inhibitor was combined with a MEK inhibitor the combination therapy for BRAF‐mutated melanoma performed better in terms of overall survival (high‐quality evidence) and probably in terms of progression‐free survival (moderate‐quality evidence) compared to single agent BRAF inhibitor; however, there was likely to be no significant difference in toxicity (moderate‐quality evidence) (summary of findings Table 7). The results of BRAF inhibitors are exclusively limited to people with a BRAF‐mutated melanoma, because this drug class is only active against this type of melanoma.
Chemotherapy combined with anti‐angiogenic drugs (bevacizumab and endostar, both of which are recently implemented compounds) may also improve both overall survival (moderate‐quality evidence) and progression‐free survival (moderate‐quality evidence) compared to chemotherapy alone (summary of findings Table 8); the combination may have no difference on toxicity (low‐quality evidence). Polychemotherapy did not result in significantly better survival (either overall or progression‐free survival) than chemotherapy (both high‐quality evidence) and probably burdens people being treated with higher toxicity rates (moderate‐quality evidence) (summary of findings Table 10).
We also conducted a network meta‐analysis. The results of the network meta‐analysis whose agreed with standard pair‐wise meta‐analysis results in terms of direct comparisons, and enabled us to make indirect comparisons between treatments not formally compared in clinical trials. Network meta‐analysis findings suggested that a combination of BRAF and MEK inhibitors was the most effective treatment strategy for BRAF‐mutated melanoma, at least in terms of progression‐free survival (Figure 8). However, this combination therapy is burdened by a higher rate of severe toxicity compared to as observed among people treated with the anti‐PD1 monoclonal antibodies, which were associated with the best acceptability (Figure 8).
Data on quality of life and costs were quite scarce, so conclusions could be drawn on these concepts (with special regard to the sustainability of newer agents, the cost of which is much higher than conventional chemotherapy agents).
Moreover, future research should focus on direct comparisons of drugs that have not been directly compared in randomised controlled trials (RCTs). The efficacy of combinations of new drug classes such as immune checkpoint inhibitors and small‐molecule targeted drugs (on which no data are yet available) should also be considered.
Overall completeness and applicability of evidence
This Cochrane Review provides an unprecedented overview of systemic treatments for people with metastatic melanoma. Overall, the available evidence was directly relevant and sufficiently comprehensive to appropriately address the review's aims.
Newly introduced classes of drugs (immune check point inhibitors and targeted drugs inhibiting BRAF or MEK) demonstrated significant therapeutic effects. An important aspect to note is that BRAF inhibitors are active only against BRAF‐mutated melanoma, which represents roughly half of all metastatic melanoma. Results from our network meta‐analysis suggest a combination of BRAF and MEK inhibitors to be the most effective treatment strategy for people with BRAF‐mutated melanoma (Figure 8). However, this finding was based on data assessing progression‐free survival only and should be confirmed by mature overall survival data.
Longer follow‐up periods are needed before similar conclusions could be speculated for overall survival. In particular, data for anti‐PD1 monoclonal antibodies combined with anti‐CTLA4 agents are not yet sufficiently mature to inform a definitive overall survival analysis. The relatively short follow‐up periods of trials reporting on immune checkpoint inhibitors and small‐molecule targeted drugs are presented in Characteristics of included studies: long‐term outcomes from these trials should improve the applicability of study results. In the meantime, because progression‐free survival correlates well with overall survival (at least in the metastatic setting), and is therefore considered to be a reliable surrogate for overall survival (which is why many anticancer drugs are approved for clinical use worldwide on the basis of progression‐free survival data only), our results provide useful information to make a reasonably reliable judgement on the usefulness of these therapies for the treatment of people with metastatic melanoma.
Data on quality of life and costs were very limited so conclusions could not be drawn. In particular, cost‐effectiveness of new therapies is yet to be determined for metastatic melanoma (Cashin 2008). As a result, it is unclear how treatment for people living with melanoma can be sustained, particularly from a global point of view (Wise 2016).
Quality of the evidence
The available evidence (based on findings from 122 RCTs that involved 28,561 participants) on systemic treatments for people with metastatic melanoma informed identification of effective classes of drugs for improving objective tumour response, progression‐free survival and overall survival.
Overall, the risk of bias of included studies can be considered as limited. Considering the 122 included studies and the seven bias domains assessed, we performed 854 evaluations (Figure 4): only seven evaluations (< 1%) assigned high risk of bias for six trials (Beretta 1976; Carvajal 2014; Hamid 2014; Hofmann 2011; Ranson 2007; Richtig 2004). Of note, none of the six high risk of bias trials were included in meta‐analyses or contributed to any conclusions on treatment efficacy. We assessed that only 21 studies (17%) were at low risk of bias for all domains (Bedikian 2006; Cui 2013; Eisen 2010; Flaherty 2012b; Flaherty 2013a; Glaspy 2009; Hauschild 2009a; Hersh 2015; Hodi 2010a; Larkin 2015; Lawson 2015; Long 2015; McDermott 2008; O'Day 2013; Ribas 2015; Robert 2013; Robert 2015a; Schadendorf 2006; Schwartzentruber 2011a; Weber 2015; Wolchok 2010). We assessed a further 22 trials (18%) at low risk of bias for four domains and one domain at unclear risk of bias (Atkins 2008; Bajetta 2006a; Bedikian 2011; Chiarion‐Sileni 2011; Eigentler 2008; Gupta 2014; Hauschild 2001; Hauschild 2012; Hodi 2014; Kaufmann 2005; Keilholz 2005; Larkin 2014; Maio 2010; McArthur 2014; Middleton 2007; Middleton 2015; O'Day 2009; Patel 2011; Ribas 2013; Robert 2015; Robert 2015b; Testori 2008). Most included studies (n = 73, 60%) were assessed at unclear risk of bias for two or more domains. Because uncertainty was mainly sustained by lack of information provided in study reports, our findings underscore the importance of mandating key information as a requirement for publishing trial results (and exploiting online repositories for supplemental material). This recommendation has been made many times by international guidelines, such as the CONSORT group (Schulz 2010).
GRADE assessment showed that most evidence was high‐ to moderate‐quality for three of four outcomes (overall survival, progression‐free survival and tumour response). GRADE evaluations of overall survival indicated high‐quality evidence in 50% (9/18) assessments; moderate‐quality evidence in four (22%) and low‐quality evidence in five (28%) assessments. GRADE evaluations for progression‐free survival indicated high‐quality evidence in 35% (6/17) assessments; moderate‐quality evidence in eight (47%) and low‐quality evidence in five (18%) assessments. Assessment for tumour response found high‐quality evidence in 42% (8/19) assessments; moderate‐quality evidence for 53% (10/19) and low‐quality evidence in one (5%) assessment. In contrast, evidence for toxicity was mainly moderate‐ to low‐quality: only one of 16 evaluations was high quality (6%); moderate quality in 59% (8/16) and low‐quality in 44% (7/16) assessments. The main reasons for downgrading evidence were inconsistency of findings (remarkable between‐study heterogeneity) and imprecision of the effect estimate (mostly linked to confidence intervals including both a meaningful effect and a small/null effect or even a meaningful opposite effect). Of note, we could not find reasonable sources of between‐study heterogeneity, and the definition of heterogeneity itself was limited by the often low number of studies available for each comparison and outcome. Formal assessment of publication bias was rarely feasible due to the few studies available for each comparison and outcome (mostly fewer than 10).
Limitations exist when investigating toxicity across trials because this is often reported as incidence of a given event (i.e. rates of study participants who developed an adverse event). consequently, the overall rate of participants who experienced toxicity (and its grade) was missing from several studies. Meta‐analyses of toxicity are characterised by relevant heterogeneity, suggesting challenges in toxicity reporting.
Although eligible trials have similar inclusion criteria, some differences do exist, as shown in the Characteristics of included studies tables. In studies investigating small‐molecule targeted drugs, all participants had BRAF mutated melanoma, but some studies testing immune checkpoint inhibitors enrolled both BRAF mutated and BRAF wild type melanomas, although participants with BRAF mutated disease were in the minority (Larkin 2014; Postow 2015). Theoretically, this may introduce bias when results of targeted therapy and immunotherapy were compared in the network meta‐analysis: people with or without this mutation may have an intrinsically different natural history. However, it should be noted that the association between BRAF mutational status and patient prognosis is quite controversial (Edlundh‐Rose 2006; Long 2011; Meckbach 2014), which may minimises this risk of bias.
Criteria for inclusion of participants with brain metastases differed across trials. People with brain metastases were generally excluded or included only if no active disease was evident at imaging evaluation three months after brain treatment. However, both targeted drugs (Long 2012a) and immune checkpoint inhibitors (Di Giacomo 2012; Margolin 2012) have demonstrated therapeutic activity in this particular subgroup of people with advanced disease, although immune checkpoint inhibitor treatment showed little or no activity in those who were symptomatic.
As expected, the quality of evidence for network meta‐analysis findings was generally lower than observed in direct comparison meta‐analysis due to intrinsic indirectness (which was a reason for downgrading shared for all evaluations). GRADE assessment for progression‐free survival found that 43% (9/21) provided moderate‐quality evidence, 5% (1/21) provided low‐quality evidence and 52% (11/21) provide very low‐quality evidence. In line with evidence quality assessment in direct comparisons, quality of evidence for toxicity was lower than observed for efficacy outcomes. Most GRADE evaluations yielded low‐ (1/21, 5%) and very low‐quality evidence (16/20, 76%); only 19% (4/21) of evaluations found moderate‐quality evidence.
In many cases, trials were sponsored by pharmaceutical companies producing the tested drug: this was especially true for new classes of drugs, such as immune checkpoint inhibitors and small‐molecule targeted drugs.
Potential biases in the review process
Our literature search was likely to detect all relevant randomised controlled trials. Nevertheless, it is always possible that we overlooked some potentially relevant trials; moreover, it is possible that some trials have not been indexed by the databases searched. However, the main conclusions of this review were based on trials that will be widely and well known by melanoma experts worldwide. Therefore, the included studies should represent the current knowledge in this field of cancer medicine reasonable well.
We did not contact the contact relevant individuals and organisations for information about unpublished or ongoing studies. There is a chance that some ongoing studies may have been completed and results may be available.
Agreements and disagreements with other studies or reviews
The present review had wider selection criteria compared to previous Cochrane Reviews on treatments for metastatic melanoma that investigated the effectiveness of chemotherapy (Crosby 2000) and biochemotherapy (Sasse 2007). Crosby 2000 aimed to assess whether conventional chemotherapy was superior to placebo (or best supportive care), but findings were inconclusive because no RCTs addressing this issue were found by the authors. In the present review, there was no formal evidence of superiority for chemotherapy compared to best supportive care or placebo, although this information was based on the findings of one study (Eisen 2010). Chemotherapy (with special regard to dacarbazine) has been the reference treatment in several contemporary trials testing new agents: our analysis showed that biochemotherapy, immune checkpoint inhibitors and small‐molecule targeted drugs are more effective or likely to be more effective than conventional chemotherapy in terms of progression‐free survival (Figure 8), and that the anti‐PD1 antibodies (immune checkpoint inhibitor) and BRAF inhibitors (small‐molecule targeted drugs) performed better than chemotherapy in terms of overall survival. Therefore, although it remains unclear whether or not chemotherapy is beneficial for people with metastatic melanoma, we can state that treatments which are more effective than chemotherapy are available currently.
Two previous reviews could not demonstrate that biochemotherapy was more effective than chemotherapy alone (Ives 2007; Sasse 2007). In this review, we found that biochemotherapy impacted favourably on participant progression‐free survival. Both Ives 2007 and Sasse 2007 included fewer studies than this review; furthermore, they used number of events at fixed time points (using relative risks or odds ratios as effect measures), which we consider a non optimal way of analysing time to event (survival) data (we expressed survival data as hazard ratios).
Some network meta‐analyses have been published recently on the treatment of metastatic melanoma. These have focused on the most recent therapeutic developments in this field, that is, the implementation of immune checkpoint inhibitors (anti‐CTLA4 and anti‐PD1 monoclonal antibodies) and small‐molecule targeted drugs (BRAF and MEK inhibitors). Devji 2017 limited analysis to results obtained for participants with BRAF‐mutated melanoma, and Ciren 2016 analysed only tumour response data (no survival data considered). Pasquali 2017 reported on both efficacy (survival) and toxicity findings. The results of all three network meta‐analyses agree with our findings and results.
RAS‐RAF‐MEK‐ERK pathway. Copyright © 2018 Claire Gorry: reproduced with permission.
Risk of bias graph: review authors' judgements about each risk of bias item presented as percentages across all included studies.
Risk of bias summary: review authors' judgements about each risk of bias item for each included study.
Interval plot: network meta‐analysis results for progression‐free survival. The network included eight treatment modalities. The effect measure is reported as hazard ratio (HR). CI: confidence interval; PrI: predictive interval.
Interval plot: network meta‐analysis results for high grade toxicity. The network included eight treatment modalities. The effect measure is reported as relative risk (RR). CI: confidence interval; PrI: predictive interval.
Ranking plot. Ranking plot representing simultaneously the efficacy (progression‐free survival) on the X axis and the acceptability (the inverse of toxicity) on the Y axis. The network included eight treatments for patients with metastatic melanoma. Optimal treatment should be characterised by both high efficacy and acceptability and should be in the right upper corner of this graph.
Comparison adjusted funnel plot for network meta‐analysis of progression‐free survival

Comparison 1: Polychemotherapy versus single agent chemotherapy, Outcome 1: Overall survival

Comparison 1: Polychemotherapy versus single agent chemotherapy, Outcome 2: Progression‐free survival

Comparison 1: Polychemotherapy versus single agent chemotherapy, Outcome 3: Tumour response

Comparison 1: Polychemotherapy versus single agent chemotherapy, Outcome 4: Toxicity (≥ G3)

Comparison 2: Chemotherapy ± tamoxifen, Outcome 1: Overall survival

Comparison 2: Chemotherapy ± tamoxifen, Outcome 2: Progression‐free survival

Comparison 2: Chemotherapy ± tamoxifen, Outcome 3: Tumour response

Comparison 2: Chemotherapy ± tamoxifen, Outcome 4: Toxicity (≥ G3)

Comparison 3: Temozolomide versus dacarbazine, Outcome 1: Overall survival

Comparison 3: Temozolomide versus dacarbazine, Outcome 2: Progression‐free survival

Comparison 3: Temozolomide versus dacarbazine, Outcome 3: Tumour response

Comparison 3: Temozolomide versus dacarbazine, Outcome 4: Toxicity (≥ G3)

Comparison 4: Chemotherapy ± interferon‐alpha, Outcome 1: Overall survival

Comparison 4: Chemotherapy ± interferon‐alpha, Outcome 2: Progression‐free survival

Comparison 4: Chemotherapy ± interferon‐alpha, Outcome 3: Tumour response

Comparison 4: Chemotherapy ± interferon‐alpha, Outcome 4: Toxicity (≥ G3)

Comparison 5: Chemotherapy ± interleukin‐2, Outcome 1: Overall survival

Comparison 5: Chemotherapy ± interleukin‐2, Outcome 2: Progression‐free survival

Comparison 5: Chemotherapy ± interleukin‐2, Outcome 3: Tumour response

Comparison 6: Chemotherapy ± interferon‐alpha and interleukin‐2, Outcome 1: Overall survival

Comparison 6: Chemotherapy ± interferon‐alpha and interleukin‐2, Outcome 2: Progression‐free survival

Comparison 6: Chemotherapy ± interferon‐alpha and interleukin‐2, Outcome 3: Tumour response

Comparison 6: Chemotherapy ± interferon‐alpha and interleukin‐2, Outcome 4: Toxicity (≥ G3)

Comparison 7: Chemotherapy ± interferon‐alpha and interleukin‐2 (first line), Outcome 1: Overall survival

Comparison 7: Chemotherapy ± interferon‐alpha and interleukin‐2 (first line), Outcome 2: Progression‐free survival

Comparison 7: Chemotherapy ± interferon‐alpha and interleukin‐2 (first line), Outcome 3: Tumour response

Comparison 7: Chemotherapy ± interferon‐alpha and interleukin‐2 (first line), Outcome 4: Toxicity (≥ G3)

Comparison 8: Chemotherapy ± Bacille Calmette‐Guérin (BCG), Outcome 1: Overall survival

Comparison 8: Chemotherapy ± Bacille Calmette‐Guérin (BCG), Outcome 2: Tumour response

Comparison 9: Chemotherapy ± Corynebacterium parvum, Outcome 1: Overall survival

Comparison 9: Chemotherapy ± Corynebacterium parvum, Outcome 2: Tumour response

Comparison 10: Anti‐CTLA4 monoclonal antibodies (first line), Outcome 1: Overall survival

Comparison 10: Anti‐CTLA4 monoclonal antibodies (first line), Outcome 2: Progression‐free survival

Comparison 10: Anti‐CTLA4 monoclonal antibodies (first line), Outcome 3: Tumour response

Comparison 10: Anti‐CTLA4 monoclonal antibodies (first line), Outcome 4: Toxicity (≥ G3)

Comparison 11: Anti‐CTLA4 monoclonal antibodies ± other immunostimulating agents (second line), Outcome 1: Overall survival

Comparison 11: Anti‐CTLA4 monoclonal antibodies ± other immunostimulating agents (second line), Outcome 2: Progression‐free survival

Comparison 11: Anti‐CTLA4 monoclonal antibodies ± other immunostimulating agents (second line), Outcome 3: Tumour response

Comparison 11: Anti‐CTLA4 monoclonal antibodies ± other immunostimulating agents (second line), Outcome 4: Toxicity (≥ G3)

Comparison 12: Anti‐PD1 monoclonal antibodies versus chemotherapy, Outcome 1: Overall survival

Comparison 12: Anti‐PD1 monoclonal antibodies versus chemotherapy, Outcome 2: Progression‐free survival

Comparison 12: Anti‐PD1 monoclonal antibodies versus chemotherapy, Outcome 3: Tumour response

Comparison 12: Anti‐PD1 monoclonal antibodies versus chemotherapy, Outcome 4: Toxicity (≥ G3)

Comparison 13: Anti‐PD1 monoclonal antibodies versus anti‐CTLA4 monoclonal antibodies, Outcome 1: Overall survival

Comparison 13: Anti‐PD1 monoclonal antibodies versus anti‐CTLA4 monoclonal antibodies, Outcome 2: Progression‐free survival

Comparison 13: Anti‐PD1 monoclonal antibodies versus anti‐CTLA4 monoclonal antibodies, Outcome 3: Tumour response

Comparison 13: Anti‐PD1 monoclonal antibodies versus anti‐CTLA4 monoclonal antibodies, Outcome 4: Toxicity (≥ G3)

Comparison 14: Anti‐PD1 monoclonal antibodies and anti‐CTLA4 monoclonal antibodies versus anti‐CTLA4 monoclonal antibodies alone, Outcome 1: Progression‐free survival

Comparison 14: Anti‐PD1 monoclonal antibodies and anti‐CTLA4 monoclonal antibodies versus anti‐CTLA4 monoclonal antibodies alone, Outcome 2: Tumour response

Comparison 14: Anti‐PD1 monoclonal antibodies and anti‐CTLA4 monoclonal antibodies versus anti‐CTLA4 monoclonal antibodies alone, Outcome 3: Toxicity (≥ G3)

Comparison 15: Chemotherapy ± sorafenib, Outcome 1: Overall survival

Comparison 15: Chemotherapy ± sorafenib, Outcome 2: Progression‐free survival

Comparison 15: Chemotherapy ± sorafenib, Outcome 3: Tumour response

Comparison 15: Chemotherapy ± sorafenib, Outcome 4: Toxicity (≥ G3)

Comparison 16: Chemotherapy ± elesclomol, Outcome 1: Overall survival

Comparison 16: Chemotherapy ± elesclomol, Outcome 2: Progression‐free survival

Comparison 16: Chemotherapy ± elesclomol, Outcome 3: Tumour response

Comparison 16: Chemotherapy ± elesclomol, Outcome 4: Toxicity (≥ G3)

Comparison 17: Chemotherapy ± anti‐angiogenic drugs, Outcome 1: Overall survival

Comparison 17: Chemotherapy ± anti‐angiogenic drugs, Outcome 2: Progression‐free survival

Comparison 17: Chemotherapy ± anti‐angiogenic drugs, Outcome 3: Tumour response

Comparison 17: Chemotherapy ± anti‐angiogenic drugs, Outcome 4: Toxicity (≥ G3)

Comparison 18: Single agent BRAF inhibitor, Outcome 1: Overall survival

Comparison 18: Single agent BRAF inhibitor, Outcome 2: Progression‐free survival

Comparison 18: Single agent BRAF inhibitor, Outcome 3: Tumour response

Comparison 18: Single agent BRAF inhibitor, Outcome 4: Toxicity (≥ G3)

Comparison 19: Single agent MEK inhibitor, Outcome 1: Overall survival

Comparison 19: Single agent MEK inhibitor, Outcome 2: Progression‐free survival

Comparison 19: Single agent MEK inhibitor, Outcome 3: Tumour response

Comparison 19: Single agent MEK inhibitor, Outcome 4: Toxicity (≥ G3)

Comparison 20: Combination of BRAF and MEK inhibitors versus single agent BRAF inhibitor, Outcome 1: Overall survival

Comparison 20: Combination of BRAF and MEK inhibitors versus single agent BRAF inhibitor, Outcome 2: Progression‐free survival

Comparison 20: Combination of BRAF and MEK inhibitors versus single agent BRAF inhibitor, Outcome 3: Tumour response

Comparison 20: Combination of BRAF and MEK inhibitors versus single agent BRAF inhibitor, Outcome 4: Toxicity (≥ G3)

Comparison 21: Immunostimulating agents, Outcome 1: Overall survival

Comparison 21: Immunostimulating agents, Outcome 2: Progression‐free survival

Comparison 21: Immunostimulating agents, Outcome 3: Tumour response

Comparison 21: Immunostimulating agents, Outcome 4: Toxicity (≥ G3)
| Anti‐PD1 monoclonal antibodies compared with chemotherapy for the treatment of metastatic melanoma | ||||||
| Patient or population: people with cutaneous melanoma Settings: hospital (metastatic disease) Intervention: anti‐PD1 monoclonal antibodies Comparison: chemotherapy | ||||||
| Outcomes | Illustrative comparative risks* (95% CI) | Relative effect | No of Participants | Quality of the evidence | Comments | |
|---|---|---|---|---|---|---|
| Assumed risk | Corresponding risk | |||||
| Chemotherapy | Anti‐PD1 | |||||
| Overall survival† | 600 per 1000† | 320 per 1000† | HR 0.42 (0.37 to 0.48) | N = 418 | ⊕⊕⊕⊕ | ‐ |
| Progression‐free survival† | 850 per 1000† | 610 per 1000† | HR 0.49 (0.39 to 0.61) | N = 957 | ⊕⊕⊕⊝ | ‐ |
| Tumour response | 81 per 1000 | 277 per 1000 | RR 3.42 (2.38 to 4.92) | N = 1367 | ⊕⊕⊕⊕ | ‐ |
| Toxicity (≥ G3) | 300 per 1000 | 165 per 1000 | RR0.55 (0.31 to 0.97) | N = 1360 | ⊕⊕⊝⊝ | ‐ |
| * The basis for the assumed risk (e.g. the median control group risk across studies) is provided in footnotes. The corresponding risk (and its 95% confidence interval) is based on the assumed risk in the comparison group and the relative effect of the intervention (and its 95% CI). † Numbers presented refer to event rates (i.e. death rates and progression rates). CI: confidence interval; HR: hazard ratio | ||||||
| GRADE Working Group grades of evidence | ||||||
| Assumed risk in the control population: 1‐year overall survival rate = 40%. Assumed risk in the control population: 1‐year progression‐free survival rate = 15%. Assumed risk in the control population: tumour response rate across control arms of included trials. Assumed risk in the control population: toxicity rate across control arms of included trials. a Not downgraded: high‐quality evidence. b Downgraded by one level: inconsistency (between‐study heterogeneity). c Downgraded by two levels: inconsistency (between‐study heterogeneity) and imprecision (CI includes both a meaningful benefit (relative risk reduction > 25%) and a small/null benefit (relative risk reduction < 10%)). | ||||||
| Anti‐PD1 monoclonal antibodies compared with anti‐CTLA4 monoclonal antibodies for the treatment of metastatic melanoma | ||||||
| Patient or population: people with cutaneous melanoma Settings: hospital (metastatic disease) Intervention: anti‐PD1 monoclonal antibodies Comparison: anti‐CTLA4 monoclonal antibodies | ||||||
| Outcomes | Illustrative comparative risks* (95% CI) | Relative effect | No of Participants | Quality of the evidence | Comments | |
|---|---|---|---|---|---|---|
| Assumed risk | Corresponding risk | |||||
| Anti‐CTLA4 | Anti‐PD1 | |||||
| Overall survival† | 600 per 1000† | 438 per 1000† | HR 0.63 (0.60 to 0.66) | N = 764 | ⊕⊕⊕⊕ | ‐ |
| Progression‐free survival† | 850 per 1000† | 641 per 1000† | HR 0.54 (0.50 to 0.60) | n = 1465 | ⊕⊕⊕⊕ | ‐ |
| Tumour response | 157 per 1000 | 388 per 1000 | RR 2.47 (2.01 to 3.04) | N = 1465 | ⊕⊕⊕⊕ | ‐ |
| Toxicity (≥ G3) | 398 per 1000 | 278 per 1000 | RR 0.70 (0.54 to 0.91) | N = 1465 | ⊕⊕⊝⊝ | ‐ |
| *The basis for the assumed risk (e.g. the median control group risk across studies) is provided in footnotes. The corresponding risk (and its 95% confidence interval) is based on the assumed risk in the comparison group and the relative effect of the intervention (and its 95% CI). † Numbers presented refer to event rates (i.e. death rates and progression rates). CI: confidence interval; RR: risk ratio; HR: hazard ratio. | ||||||
| GRADE Working Group grades of evidence | ||||||
| Assumed risk in the control population: 1‐year overall survival rate = 40%. Assumed risk in the control population: 1‐year progression‐free survival rate = 15%. Assumed risk in the control population: tumour response rate across control arms of included trials. Assumed risk in the control population: toxicity rate across control arms of included trials. a Not downgraded: high‐quality evidence. b Downgraded by two levels: inconsistency (between‐study heterogeneity) and imprecision (CI includes both a meaningful benefit (relative risk reduction > 25%) and a small/null benefit (relative risk reduction < 10%). | ||||||
| Anti‐CTLA4 monoclonal antibodies plus chemotherapy compared with chemotherapy for the treatment of metastatic melanoma | ||||||
| Patient or population: people with cutaneous melanoma Settings: hospital (metastatic disease) Intervention: anti‐CTLA4 monoclonal antibodies plus chemotherapy (combo) Comparison: chemotherapy | ||||||
| Outcomes | Illustrative comparative risks* (95% CI) | Relative Effect | No of Participants | Quality of the evidence | Comments | |
|---|---|---|---|---|---|---|
| Assumed risk | Corresponding risk | |||||
| Chemotherapy | Combo | |||||
| Overall survival† | 600 per 1000† | 524 per 1000† | HR 0.81 (0.65 to 1.01) | N = 1157 | ⊕⊕⊝⊝ | ‐ |
| Progression‐free survival† | 850 per 1000† | 763 per 1000† | HR 0.76 (0.63 to 0.92) | N = 502 | ⊕⊕⊕⊝ | ‐ |
| Tumour response | 100 per 1000 | 128 per 1000 | RR 1.28 (0.92 to 1.77) | N = 1157 | ⊕⊕⊕⊝ | ‐ |
| Toxicity (≥ G3) | 352 per 1000 | 595 per 1000 | RR 1.69 (1.19 to 2.42) | N = 1142 | ⊕⊕⊕⊝ | ‐ |
| * The basis for the assumed risk (e.g. the median control group risk across studies) is provided in footnotes. The corresponding risk (and its 95% confidence interval) is based on the assumed risk in the comparison group and the relative effect of the intervention (and its 95% CI). † Numbers presented refer to event rates (i.e. death rates and progression rates). CI: confidence interval; HR: hazard ratio. | ||||||
| GRADE Working Group grades of evidence | ||||||
| Assumed risk in the control population: 1‐year overall survival rate = 40%. Assumed risk in the control population: 1‐year progression‐free survival rate = 15%. Assumed risk in the control population: tumour response rate across control arms of included trials. Assumed risk in the control population: toxicity rate across control arms of included trials. a Downgraded by two levels: inconsistency (between‐study heterogeneity) and imprecision (CI includes both a meaningful benefit (relative risk reduction > 25%) and a harmful effect). b Downgraded by one level: imprecision (CI includes both a meaningful benefit (relative risk reduction > 25%) and a small/null benefit (relative risk reduction < 10%)). c Downgraded by one level: imprecision (CI includes both a meaningful benefit (relative risk increase > 25%) and a harmful effect). d Downgraded by one level: inconsistency (between‐study heterogeneity). | ||||||
| Anti‐CTLA4 plus anti‐PD1 monoclonal antibodies compared with anti‐CTLA4 monoclonal antibodies for the treatment of metastatic melanoma | ||||||
| Patient or population: people with cutaneous melanoma Settings: hospital (metastatic disease) Intervention: Anti‐CTLA4 plus Anti‐PD1 monoclonal antibodies (combo) Comparison: Anti‐CTLA4 monoclonal antibodies | ||||||
| Outcomes | Illustrative comparative risks* (95% CI) | Relative effect | No of Participants | Quality of the evidence | Comments | |
|---|---|---|---|---|---|---|
| Assumed risk | Corresponding risk | |||||
| Anti‐CTLA4 | Combo | |||||
| Overall survival | See comment | See comment | See comment | See comment | See comment | Outcome not measured |
| Progression‐free survival† | 750 per 1000† | 425 per 1000† | HR 0.40 (0.35 to 0.46) | N = 738 | ⊕⊕⊕⊕ | ‐ |
| Tumour response | 182 per 1000 | 636 per 1000 | RR 3.50 (2.07 to 5.92) | N = 738 | ⊕⊕⊕⊕ | ‐ |
| Toxicity (≥ G3) | 521 per 1000 | 818 per 1000 | RR 1.57 (0.85 to 2.92) | N = 764 | ⊕⊕⊝⊝ | ‐ |
| * The basis for the assumed risk (e.g. the median control group risk across studies) is provided in footnotes. The corresponding risk (and its 95% confidence interval) is based on the assumed risk in the comparison group and the relative effect of the intervention (and its 95% CI). † Numbers presented refer to event rates (i.e. progression rates). CI: confidence interval | ||||||
| GRADE Working Group grades of evidence | ||||||
| Assumed risk in the control population: 1‐year progression‐free survival rate = 25%. Assumed risk in the control population: tumour response rate across control arms of included trials. Assumed risk in the control population: toxicity rate across control arms of included trials. a Not downgraded: high‐quality evidence. b Downgraded by two levels: inconsistency (between‐study heterogeneity) and imprecision (CI includes both a meaningful harm (relative risk increase > 25%) and a beneficial effect) | ||||||
| BRAF inhibitors compared with chemotherapy for the treatment of metastatic melanoma | ||||||
| Patient or population: people with cutaneous melanoma Settings: hospital (metastatic disease) Intervention: BRAF inhibitors Comparison: chemotherapy | ||||||
| Outcomes | Illustrative comparative risks* (95% CI) | Relative effect | No of Participants | Quality of the evidence | Comments | |
|---|---|---|---|---|---|---|
| Assumed risk | Corresponding risk | |||||
| Chemotherapy | BRAF inhibitors | |||||
| Overall survival† | 600 per 1000† | 307 per 1000† | HR 0.40 (0.28 to 0.57) | N = 925 | ⊕⊕⊕⊕ | ‐ |
| Progression‐free survival† | 850 per 1000† | 401 per 1000† | HR 0.27 (0.21 to 0.34) | N = 925 | ⊕⊕⊕⊕ | ‐ |
| Tumour response | 82 per 1000 | 556 per 1000 | RR 6.78 (4.84 to 9.49) | N = 925 | ⊕⊕⊕⊕ | ‐ |
| Toxicity (≥ G3) | 341 per 1000 | 433 per 1000 | RR 1.27 (0.48 to 3.33) | N = 408 | ⊕⊕⊝⊝ | ‐ |
| * The basis for the assumed risk (e.g. the median control group risk across studies) is provided in footnotes. The corresponding risk (and its 95% confidence interval) is based on the assumed risk in the comparison group and the relative effect of the intervention (and its 95% CI). † Numbers presented refer to event rates (i.e. death rates and progression rates). | ||||||
| GRADE Working Group grades of evidence | ||||||
| Assumed risk in the control population: 1‐year overall survival rate = 40%. Assumed risk in the control population: 1‐year progression‐free survival rate = 15%. Assumed risk in the control population: tumour response rate across control arms of included trials. Assumed risk in the control population: toxicity rate across control arms of included trials. a Not downgraded: high‐quality evidence. b Downgraded by two levels: inconsistency (between‐study heterogeneity) and imprecision (CI includes both a meaningful harm (relative risk increase > 25%) and a meaningful benefit (relative risk reduction > 25%)). | ||||||
| MEK inhibitors compared with chemotherapy for the treatment of metastatic melanoma | ||||||
| Patient or population: people with cutaneous melanoma Settings: hospital (metastatic disease) Intervention: MEK inhibitors Comparison: chemotherapy | ||||||
| Outcomes | Illustrative comparative risks* (95% CI) | Relative effect | No of Participants | Quality of the evidence | Comments | |
|---|---|---|---|---|---|---|
| Assumed risk | Corresponding risk | |||||
| Chemotherapy | MEK inhibitors | |||||
| Overall survival† | 600 per 1000† | 541 per 1000† | HR 0.85 (0.58 to 1.25) | N = 496 | ⊕⊕⊝⊝ | ‐ |
| Progression‐free survival† | 850 per 1000† | 667 per 1000† | HR 0.58 (0.42 to 0.80) | N = 496 | ⊕⊕⊕⊝ | ‐ |
| Tumour response | 138 per 1000 | 277 per 1000 | RR 2.01 (1.35 to 2.99) | N = 496 | ⊕⊕⊕⊕ | ‐ |
| Toxicity (≥ G3) | 413 per 1000 | 665 per 1000 | RR 1.61 (1.08 to 2.41) | N = 91 | ⊕⊕⊕⊝ | ‐ |
| *The basis for the assumed risk (e.g. the median control group risk across studies) is provided in footnotes. The corresponding risk (and its 95% confidence interval) is based on the assumed risk in the comparison group and the relative effect of the intervention (and its 95% CI). † Numbers presented refer to event rates (i.e. death rates and progression rates). | ||||||
| GRADE Working Group grades of evidence | ||||||
| Assumed risk in the control population: 1‐year overall survival rate = 40%. Assumed risk in the control population: 1‐year progression‐free survival rate = 15%. Assumed risk in the control population: tumour response rate across control arms of included trials. Assumed risk in the control population: toxicity rate across control arms of included trials. a Downgraded by two levels: inconsistency (between‐study heterogeneity) and imprecision (CI includes both a meaningful benefit (relative risk reduction > 25%) and a harmful effect). b Downgraded by one level: inconsistency (between‐study heterogeneity). c Not downgraded: high‐quality evidence. d Downgraded by one level: imprecision (sample size lower than optimal information size, calculated to be equal to 400 participants). | ||||||
| BRAF plus MEK inhibitors compared with BRAF inhibitors for the treatment of metastatic melanoma | ||||||
| Patient or population: people cutaneous melanoma Settings: hospital (metastatic disease) Intervention: BRAF inhibitor plus MEK inhibitor (combo) Comparison: BRAF inhibitor | ||||||
| Outcomes | Illustrative comparative risks* (95% CI) | Relative effect | No of Participants | Quality of the evidence | Comments | |
|---|---|---|---|---|---|---|
| Assumed risk | Corresponding risk | |||||
| BRAF inhibitor | Combo | |||||
| Overall survival† | 350 per 1000† | 260 per 1000† | HR 0.70 (0.59 to 0.82) | N = 1784 | ⊕⊕⊕⊕ | ‐ |
| Progression‐free survival† | 700 per 1000† | 490 per 1000† | HR 0.56 (0.44 to 0.71) | N = 1784 | ⊕⊕⊕⊝ | ‐ |
| Tumour response | 494 per 1000 | 652 per 1000 | RR 1.32 (1.20 to 1.46) | N = 1784 | ⊕⊕⊕⊕ | ‐ |
| Toxicity (≥ G3) | 495 per 1000 | 500 per 1000 | RR 1.01 (0.85 to 1.20) | N = 1774 | ⊕⊕⊕⊝ | ‐ |
| * The basis for the assumed risk (e.g. the median control group risk across studies) is provided in footnotes. The corresponding risk (and its 95% confidence interval) is based on the assumed risk in the comparison group and the relative effect of the intervention (and its 95% CI). † Numbers presented refer to event rates (i.e. death rates and progression rates). CI confidence interval; HR: hazard ratio | ||||||
| GRADE Working Group grades of evidence | ||||||
| Assumed risk in the control population: 1‐year overall survival rate = 65%. Assumed risk in the control population: 1‐year progression‐free survival rate = 30%. Assumed risk in the control population: tumour response rate across control arms of included trials. Assumed risk in the control population: toxicity rate across control arms of included trials. a Not downgraded: high‐quality evidence. b Downgraded by one level: inconsistency (between‐study heterogeneity). | ||||||
| Anti‐angiogenic drugs plus chemotherapy compared with chemotherapy for the treatment of metastatic melanoma | ||||||
| Patient or population: people with cutaneous melanoma Settings: hospital (metastatic disease) Intervention: Anti‐angiogenic drug plus chemotherapy (combo) Comparison: chemotherapy | ||||||
| Outcomes | Illustrative comparative risks* (95% CI) | Relative effect | No of Participants | Quality of the evidence | Comments | |
|---|---|---|---|---|---|---|
| Assumed risk | Corresponding risk | |||||
| Chemotherapy | Combo | |||||
| Overall survival† | 600 per 1000† | 423 per 1000† | HR 0.60 (0.45 to 0.81) | N = 324 | ⊕⊕⊕⊝ | ‐ |
| Progression‐free survival† | 850 per 1000† | 730 per 1000† | HR 0.69 (0.52 to 0.92) | N = 324 | ⊕⊕⊕⊝ | ‐ |
| Tumour response | 104 per 1000 | 178 per 1000 | RR 1.71 (0.96 to 3.03) | N = 324 | ⊕⊕⊕⊝ | ‐ |
| Toxicity (≥ G3) | 272 per 1000 | 185 per 1000 | RR 0.68 (0.09 to 5.32) | N = 324 | ⊕⊕⊝⊝ | ‐ |
| * The basis for the assumed risk (e.g. the median control group risk across studies) is provided in footnotes. The corresponding risk (and its 95% confidence interval) is based on the assumed risk in the comparison group and the relative effect of the intervention (and its 95% CI). † Numbers presented refer to event rates (i.e. death rates and progression rates). | ||||||
| GRADE Working Group grades of evidence | ||||||
| Assumed risk in the control population: 1‐year overall survival rate = 40%. Assumed risk in the control population: 1‐year progression‐free survival rate = 15%. Assumed risk in the control population: tumour response rate across control arms of included trials. Assumed risk in the control population: toxicity rate across control arms of included trials. a Downgraded by one level: imprecision (sample size lower than optimal information size, calculated to be equal to 400 participants). b Downgraded by two levels: inconsistency (between‐study heterogeneity) and imprecision (sample size lower than optimal information size, calculated to be equal to 400 participants). | ||||||
| Biochemotherapy compared with chemotherapy for the treatment of metastatic melanoma | ||||||
| Patient or population: people with cutaneous melanoma Settings: hospital (metastatic disease) Intervention: biochemotherapy (chemotherapy combined with both interferon‐alpha and interleukin‐2) Comparison: chemotherapy | ||||||
| Outcomes | Illustrative comparative risks* (95% CI) | Relative effect | No of Participants | Quality of the evidence | Comments | |
|---|---|---|---|---|---|---|
| Assumed risk | Corresponding risk | |||||
| Chemotherapy | Biochemotherapy | |||||
| Overall survival† | 600 per 1000† | 577 per 1000† | HR 0.94 (0.84 to 1.06) | N = 1317 | ⊕⊕⊕⊕ | ‐ |
| Progression‐free survival† | 850 per 1000 ° | 818 per 1000† | HR 0.90 (0.83 to 0.99) | N = 964 | ⊕⊕⊕⊕ | ‐ |
| Tumour response | 192 per 1000 | 262 per 1000 | RR 1.36 (1.12 to 1.66) | N = 770 | ⊕⊕⊕⊕ | ‐ |
| Toxicity (≥ G3) | 631 per 1000 | 852 per 1000 | RR 1.35 (1.14 to 1.61) | N = 631 | ⊕⊕⊕⊕ | ‐ |
| *The basis for the assumed risk (e.g. the median control group risk across studies) is provided in footnotes. The corresponding risk (and its 95% confidence interval) is based on the assumed risk in the comparison group and the relative effect of the intervention (and its 95% CI). † Numbers presented refer to event rates (i.e. death rates and progression rates). | ||||||
| GRADE Working Group grades of evidence | ||||||
| Assumed risk in the control population: 1‐year overall survival rate = 40%. Assumed risk in the control population: 1‐year progression‐free survival rate = 15%. Assumed risk in the control population: tumour response rate across control arms of included trials. Assumed risk in the control population: toxicity rate across control arms of included trials. a Not downgraded: high‐quality evidence. | ||||||
| Polychemotherapy compared with chemotherapy for the treatment of metastatic melanoma | ||||||
| Patient or population: people with cutaneous melanoma Settings: hospital (metastatic disease) Intervention: polychemotherapy Comparison: chemotherapy | ||||||
| Outcomes | Illustrative comparative risks* (95% CI) | Relative effect | No of Participants | Quality of the evidence | Comments | |
|---|---|---|---|---|---|---|
| Assumed risk | Corresponding risk | |||||
| Chemotherapy | Polychemotherapy | |||||
| Overall survival† | 600 per 1000† | 596 per 1000† | HR 0.99 (0.85 to 1.16) | N = 594 | ⊕⊕⊕⊕ | ‐ |
| Progression‐freesurvival† | 850 per 1000† | 869 per 1000† (822 to 907) | HR 1.07 (0.91 to 1.25) | N = 398 (n = 5) | ⊕⊕⊕⊕ | ‐ |
| Tumour response | 143 per 1000 | 182 per 1000 | RR 1.27 (1.02 to 1.58) | N = 1885 | ⊕⊕⊕⊝ | ‐ |
| Toxicity (≥ G3) | 189 per 1000 | 372 per 1000 | RR 1.97 (1.44 to 2.71) | N = 390 | ⊕⊕⊕⊝ | ‐ |
| *The basis for the assumed risk (e.g. the median control group risk across studies) is provided in footnotes. The corresponding risk (and its 95% confidence interval) is based on the assumed risk in the comparison group and the relative effect of the intervention (and its 95% CI). † Numbers presented refer to event rates (i.e. death rates and progression rates). | ||||||
| GRADE Working Group grades of evidence | ||||||
| Assumed risk in the control population: 1‐year overall survival rate = 40%. Assumed risk in the control population: 1‐year progression‐free survival rate = 15%. Assumed risk in the control population: tumour response rate across control arms of included trials. Assumed risk in the control population: toxicity rate across control arms of included trials. a Not downgraded: high‐quality evidence. b Downgraded by one level: imprecision (CI includes both a meaningful benefit (relative risk increase > 25%) and a small/null benefit (relative risk increase < 10%)). c Downgraded by one level: imprecision (sample size lower than optimal information size, calculated to be equal to 400 participants). | ||||||
| Term | Explanation |
|---|---|
| Actinomycin‐D | A polypeptide used as an antibiotic and antineoplastic agent as a result of its ability to inhibit transcription |
| AJCC TNM staging | This is the most widely used tumour staging classification system, which has been developed and constantly updated by the American Joint Committee on Cancer (AJCC) for describing the extent of disease progression in people with cancer. It uses in part the TNM scoring system: tumour size, lymph nodes affected, metastases. Individuals affected by specific tumour type are assigned to categories describing risk of death |
| AJCC TNM stage III | People at this disease stage have melanoma metastasis in their regional lymph node (i.e. the first lymph nodes draining the skin area affected by the melanoma) |
| AJCC TNM stage IIIC | Stage IIIC is a higher risk subgroup among people with lymph node metastasis. The category includes people with all primary tumour stages (T stages) and those with clinically positive lymph nodes, or 4 or more positive lymph nodes |
| AJCC TNM stage IV | People with this disease stage have melanoma metastasis to distant sites (e.g. lung, liver, brain, bone) |
| Anti‐angiogenic agents | Drugs aimed to disrupt tumour vascularisation and reduce blood supply to malignant cells; examples include bevacizumab and endostar |
| Antigen | A substance that invokes the body's immune response |
| Aranoza | An alkylating agent that is used as a chemotherapy drug for various cancers including melanoma as part of combination chemotherapy regimens |
| Bacille Calmette‐Guérin (BCG) | BCG is a vaccine used in the prevention of tuberculosis. However, it is also a form of cancer immunotherapy with established effects in superficial (non‐muscle invading) bladder cancer |
| Bevacizumab | Bevacizumab (Avastin) is an angiogenesis inhibitor approved for use for people with various metastatic cancers. Bevacizumab acts through blockade of vascular endothelial growth factor A (VEGF‐A) that prevents development of new vessels necessary for tumours to grow |
| Bleomycin | An antineoplastic agent used in chemotherapy regimens for various tumours. Belomycin acts through cleavage of DNA within cells |
| Biochemotherapy | A combination of chemotherapy plus immunostimulating cytokines, such as interleukin‐2 and interferon‐alpha |
| Bosentan | An endothelin receptor inhibitor that causes reduced DNA synthesis and promotes apoptosis through competitive antagonism with the anti‐apoptotic factor endothelin‐1, often secreted by cancer cells in an autocrine or paracrine manner |
| BRAF | A gene that makes a protein called B‐Raf. BRAF is involved in sending signals within cells that direct their growth. In some cancers, this gene has mutated (Melanoma Institute Australia 2017) |
| Carmustine | An alkylating agent that prevents DNA replication and cell proliferation used in chemotherapy for various cancers |
| Cobimetinib | An inhibitor of MAPK kinase (MEK) approved for use in metastatic melanoma with BRAF V600E/K mutation usually in combination with a BRAF inhibitor |
| Corynebacterium parvum | C parvum is an aerobic, gram positive bacterium that has been reported to have antineoplastic potential |
| Cyclophosphamide | An alkylating agent used in auto‐immune diseases and various tumours as a chemotherapy drug |
| Cytokine | Small proteins produced by a broad range of cells that are important in cell signalling; they are immunostimulating agents |
| Cytotoxic | Cell killing |
| CTLA4 (cytotoxic T‐cell lymphocyte‐associated antigen‐4) | CTLA4 is a receptor located on the surface of T‐cells that down regulates the immune system (an immune checkpoint). The inhibition of this receptor with monoclonal antibodies, such as ipilimumab and tremelimumab, 'unleashes' the immune response to fight against malignant cells |
| Dabrafenib | An inhibitor of the BRAF kinase that has been approved for people with advanced melanoma carrying the BRAF V600E mutation |
| Dacarbazine | A chemotherapy drug that belongs to the family of alkylating agents that is used in the treatment of various cancers, including melanoma |
| Dendritic cell | These are antigen‐presenting cells that link the innate to the adaptive immune systems via processing antigens and presenting them to T‐lymphocytes. Their role is crucial for proper functioning of vaccines, including cancer vaccines |
| Elesclomol | A drug that causes the accumulation of reactive oxygen species to trigger apoptosis in cancer cells via oxidative stress. It is approved for use for people with metastatic melanoma |
| Endostar | A modified recombinant human endostatin that acts as an anti‐angiogenic agent to prevent the formation of new blood vessels that are necessary for tumour growth and survival |
| Fotemustine | A chemotherapy drug that belongs to the family of alkylating agents and has been approved for the treatment of metastatic melanoma |
| G3 and G4 | G3 (grade 3) and G4 (grade 4) toxicity refers to the highest degree of adverse events due to a systemic treatment. This system grades the toxicity related to a given system or organ (e.g. hepatic, cardiac, haematologic) |
| gp100 | A known melanoma antigen that can be applied to develop a cancer vaccine through processing and presentation by dendritic cells to lymphocytes |
| Granulocyte macrophage ‐ colony‐stimulating factor (GM‐CSF) | A cytokine that stimulates stem cells to give rise to granulocytes and monocytes and boosts the immune system |
| Hydroxyurea | A chemotherapy agent that acts through reducing the generation of deoxyribonucleotides, the building blocks of DNA, to inhibit adequate synthesis of DNA. It is used as a chemotherapy drug for people with myeloproliferative disorders |
| Immune checkpoints | Signalling proteins that protect against auto‐immunity and regulate the immune response; these checkpoints can be hijacked by cancer cells to evade T‐cell‐mediated death, i.e. stopping an immune response to the tumour. CTLA4 and PD1 are both immune checkpoints |
| Immune checkpoint inhibitors | Drugs that override the signalling/activation of immune checkpoints to encourage cytotoxic T‐cell recognition of cancer (i.e. an immune response). These are monoclonal antibodies blocking either CTLA4 or PD1 (two immune checkpoints), known as anti‐CTLA4 and anti‐PD1 monoclonal antibodies |
| Immunomodulating | Stimulates or suppresses the immune system |
| Immunostimulating | Stimulates an immune response |
| Interferon‐alpha | Interferon‐alpha is used for the postoperative treatment of people with AJCC TNM stages II (primary tumour at high risk of disease progression with negative lymph nodes) and III (positive lymph nodes) and to enhance the efficacy of chemotherapy in those who have metastatic melanoma |
| Interleukin‐2 | Interleukin‐2 is a protein that regulates the activities of leucocytes (particularly lymphocytes) that are responsible for immunity. The receptor for interleukin‐2 is expressed by lymphocytes. A recombinant form of human interleukin‐2 has been approved by the FDA for the treatment of melanoma and renal cell cancer |
| Lomustine | An oral alkylating chemotherapeutic agent used mainly to treat brain tumours because it crosses the blood‐brain barrier |
| MEK | Mitogen‐activated protein kinase (MEK) is part of the MAPK signalling pathway (see 'RAS‐RAF‐MEK‐ERK pathway' below), which is activated in melanoma |
| Monoclonal antibodies | Monoclonal antibodies are a type of targeted drug therapy; they work by recognising and finding specific proteins on cancer cells (they work in different ways depending on the protein they are targeting) (Cancer Research UK 2017) |
| Oblimersen | A bcl‐2 antisense oligodeoxynucleotide that reduces cancer cell survival and proliferation by blocking the generation of the anti‐apoptotic protein bcl‐2 thus promoting programmed cell death in cancer cells |
| Oncogene | A gene thats activation or over expression favours cancer growth |
| Paclitaxel | A chemotherapy agent targeting the protein tubulin. The drug interferes with the dynamics of microtubule formation and breakdown leading to problems during cell division and triggering of apoptosis. DHA‐ and nab‐paclitaxel are modified forms of the drug |
| PD1 (programmed cell death protein‐1) | PD1 is a receptor located on the surface of the T‐cells that down regulates the immune system (an immune checkpoint). The inhibition of this receptor with monoclonal antibodies, such as nivolumab and pembrolizumab, 'unleashes' immune response to fight against malignant cells |
| PF‐3512676 | An synthetic oligonucleotide that acts as a Toll‐like receptor‐9 (TLR‐9) agonist. It is used as an immunomodulatory agent alone, or in combination with chemotherapy, to boost anti‐tumour effects by enhancing B‐cell proliferation and antigen‐specific antibody production and cytokine secretion |
| Polychemotherapy | A combination of multiple chemotherapeutic agents |
| Procarbazine | An alkylating agent used as an antineoplastic chemotherapy drug in various tumours such as glioblastoma multiforme and Hodgkin's lymphoma |
| Programmed death‐1 (PD‐1) | PD‐1 is an inhibitory receptor located on the surface of the T‐cells that down regulates the immune system when bound by its ligands (PD‐L1 and PD‐L2, often found on cancer cells). The inhibition of this receptor with monoclonal antibodies, such as pembrolizumab and nivolumab, releases the brake on immune cells thus allowing them to freely fight malignant cells |
| Ramucirumab | A human monoclonal antibody that targets the vascular endothelial growth factor receptor 2 (VEGFR2) to block VEGF binding and thus inhibit angiogenesis. It is approved for use in advanced gastric adenocarcinoma and metastatic non‐small cell lung carcinoma |
| RAS‐RAF‐MEK‐ERK pathway | This is also known as 'MAPK/ERK pathway', which is a chain of proteins in the cell that communicates a signal from a receptor on the surface of the cell to the nucleus of the cell (where DNA is located). When one of the proteins in the pathway is mutated, it can be stuck in the 'on' or 'off' position, which is a necessary step in the development of many cancers, including melanoma. Drugs, such as BRAF and MEK inhibitors, can reverse this switch |
| Small‐molecule inhibitors | Low molecular weight drugs targeting molecules mutated or overexpressed in tumours; examples include BRAF inhibitors (which block the BRAF protein) or MEK inhibitors (which block the MEK protein) |
| Sorafenib | An inhibitor of various tyrosine protein kinases including RAF |
| Selumetinib | An inhibitor of the MAPK kinase (MEK) downstream of BRAF |
| T‐cell | A white blood cell type, which plays a key role in immunity |
| Tasisulam | A small‐molecule agent that induces apoptosis through the intrinsic mitochondrial pathway |
| Tamoxifen | A cytostatic hormonal therapeutic agent used mainly as a treatment for oestrogen receptor positive breast cancer. Tamoxifen acts through competing with oestrogen for its receptor thus reducing oestrogen‐related effects in breast tissue such as DNA synthesis and cell proliferation |
| Temozolomide | An oral alkylating agent that can be used in chemotherapy regimens for various cancers such as glioblastoma multiforme |
| Trametinib | An inhibitor of MAPK kinase (MEK) 1 and 2 approved for use in people with V600E‐mutated metastatic melanoma |
| Vemurafenib | A small‐molecule inhibitor of mutated BRAF, an oncogene involved in cell survival or proliferation |
| Vincristine | An anti‐mitotic agent that binds tubulin thus preventing cell proliferation and triggering apoptosis |
| Vindesine | An anti‐mitotic agent that acts by targeting microtubules and preventing cell division thus useful as a chemotherapy drug in various cancers |
| Vitespen | A tumour‐derived heat shock protein that is used as an adjuvant in cancer immunotherapy |
| Study ID | Reason for exclusion from meta‐analysis |
|---|---|
| Single study investigating tasisulam | |
| Single study investigating bosentan | |
| Single study comparing dacarbazine and best supportive care | |
| Single study investigating dendritic cells therapy | |
| Single study investigating histamine with interleukin‐2 | |
| Different polychemotherapy regimens not compared in other studies | |
| Different polychemotherapy regimens not compared in other studies | |
| Different polychemotherapy regimens not compared in other studies | |
| Different PEG‐interferon schedules tested | |
| Inpatient and outpatient interleukin‐2‐based regimens not compared in other studies | |
| Different lenalidomide schedules not compared in other studies | |
| Different polychemotherapy regimens not compared in other studies | |
| Study comparing biochemotherapy versus biotherapy | |
| Study comparing alternating and sequential biochemotherapy and chemotherapy | |
| Single study investigating Indomethacine with interferon | |
| Different single‐agent chemotherapy regimens not compared in other studies | |
| Different polychemotherapy regimens not compared in other studies | |
| Different temozolomide and interferon schedules tested | |
| Different polychemotherapy regimens not compared in other studies | |
| Different interferon‐based regimens not compared in other studies | |
| Different biochemotherapy regimens not compared in other studies | |
| Single study investigating chemotherapy and COX‐2 inhibitor | |
| Single study comparing interleukin‐2 with versus without interferon‐alpha | |
| Different ipilimumab schedules tested | |
| Single study comparing fotemustine and dacarbazine | |
| Single study testing Intetumumab | |
| Single study testing lomeguatrib | |
| Single study testing nab‐paclitaxel | |
| Single study testing oblimersen | |
| Single study testing DHA‐paclitaxel | |
| Single study testing PF‐3512676 | |
| Single study testing ramucirumab | |
| Single study testing dacarbazine and C parvum after surgery | |
| Single study testing vindesine after surgery | |
| Single study testing GM‐CSF and a polypeptide vaccination after surgery | |
| Single study testing lenalidomide | |
| Single study testing veliparib | |
| Single study testing vetaspen |
| Comparison | Experimental (class of) drug | Study ID |
|---|---|---|
| Polychemotherapy versus single agent chemotherapy | Polychemotherapy | |
| Biochemotherapy versus chemotherapy | Interferon‐alpha | |
| Interleukin‐2 | ||
| Interleukin‐2 plus interferon‐alpha | ||
| Immune checkpoint inhibitors versus chemotherapy (or other immune checkpoint inhibitors) | Anti‐CTLA4 monoclonal antibodies | |
| Anti‐PD1 monoclonal antibodies | ||
| Anti‐CTLA4 plus anti‐PD1 monoclonal antibodies | ||
| Small‐molecule targeted drugs versus chemotherapy (or other small‐molecule targeted drugs) | BRAF inhibitors | |
| MEK inhibitors | ||
| BRAF plus MEK inhibitors | ||
| Chemotherapy with versus without other agents | Bacille Calmette‐Guérin (BCG) | |
| Corynebacterium parvum | ||
| Tamoxifen | ||
| Anti‐angiogenic drugs | ||
| Sorafenib | ||
| Elesclomol | ||
| Single agent chemotherapy versus other single agent chemotherapy | Temozolomide | |
| Hodi 2010a; Hodi 2014; Maio 2010; Schwartzentruber 2011a were included in a meta‐analysis of immunostimulating agents. | ||
| Outcome or subgroup title | No. of studies | No. of participants | Statistical method | Effect size |
| 1.1 Overall survival Show forest plot | 6 | 594 | Hazard Ratio (IV, Random, 95% CI) | 0.99 [0.85, 1.16] |
| 1.2 Progression‐free survival Show forest plot | 5 | 398 | Hazard Ratio (IV, Random, 95% CI) | 1.07 [0.91, 1.25] |
| 1.3 Tumour response Show forest plot | 14 | 1885 | Risk Ratio (M‐H, Random, 95% CI) | 1.27 [1.02, 1.58] |
| 1.4 Toxicity (≥ G3) Show forest plot | 3 | 514 | Risk Ratio (M‐H, Fixed, 95% CI) | 1.97 [1.44, 2.71] |
| Outcome or subgroup title | No. of studies | No. of participants | Statistical method | Effect size |
| 2.1 Overall survival Show forest plot | 4 | 643 | Hazard Ratio (IV, Random, 95% CI) | 1.03 [0.80, 1.33] |
| 2.2 Progression‐free survival Show forest plot | 2 | 475 | Hazard Ratio (IV, Random, 95% CI) | 1.06 [0.93, 1.22] |
| 2.3 Tumour response Show forest plot | 4 | 643 | Risk Ratio (M‐H, Random, 95% CI) | 1.33 [0.94, 1.89] |
| 2.4 Toxicity (≥ G3) Show forest plot | 1 | 271 | Risk Ratio (M‐H, Random, 95% CI) | 0.70 [0.38, 1.28] |
| Outcome or subgroup title | No. of studies | No. of participants | Statistical method | Effect size |
| 3.1 Overall survival Show forest plot | 3 | 1313 | Hazard Ratio (IV, Random, 95% CI) | 0.98 [0.85, 1.12] |
| 3.2 Progression‐free survival Show forest plot | 3 | 1313 | Hazard Ratio (IV, Random, 95% CI) | 0.87 [0.74, 1.03] |
| 3.3 Tumour response Show forest plot | 3 | 1313 | Risk Ratio (M‐H, Random, 95% CI) | 1.21 [0.85, 1.73] |
| 3.4 Toxicity (≥ G3) Show forest plot | 2 | 1164 | Risk Ratio (M‐H, Random, 95% CI) | 1.15 [0.98, 1.35] |
| Outcome or subgroup title | No. of studies | No. of participants | Statistical method | Effect size |
| 4.1 Overall survival Show forest plot | 11 | 1785 | Hazard Ratio (IV, Random, 95% CI) | 0.87 [0.73, 1.04] |
| 4.2 Progression‐free survival Show forest plot | 6 | 1272 | Hazard Ratio (IV, Random, 95% CI) | 0.87 [0.74, 1.01] |
| 4.3 Tumour response Show forest plot | 15 | 2419 | Risk Ratio (M‐H, Random, 95% CI) | 1.36 [1.12, 1.66] |
| 4.4 Toxicity (≥ G3) Show forest plot | 3 | 791 | Risk Ratio (M‐H, Random, 95% CI) | 1.72 [0.37, 7.95] |
| Outcome or subgroup title | No. of studies | No. of participants | Statistical method | Effect size |
| 5.1 Overall survival Show forest plot | 2 | 644 | Hazard Ratio (IV, Random, 95% CI) | 0.95 [0.82, 1.11] |
| 5.2 Progression‐free survival Show forest plot | 1 | 363 | Hazard Ratio (IV, Random, 95% CI) | 0.87 [0.70, 1.08] |
| 5.3 Tumour response Show forest plot | 3 | 735 | Risk Ratio (M‐H, Random, 95% CI) | 0.85 [0.64, 1.13] |
| Outcome or subgroup title | No. of studies | No. of participants | Statistical method | Effect size |
| 6.1 Overall survival Show forest plot | 7 | 1307 | Hazard Ratio (IV, Random, 95% CI) | 0.94 [0.84, 1.06] |
| 6.2 Progression‐free survival Show forest plot | 6 | 964 | Hazard Ratio (IV, Random, 95% CI) | 0.90 [0.83, 0.99] |
| 6.3 Tumour response Show forest plot | 7 | 1307 | Risk Ratio (M‐H, Random, 95% CI) | 1.36 [1.11, 1.67] |
| 6.4 Toxicity (≥ G3) Show forest plot | 2 | 657 | Risk Ratio (M‐H, Random, 95% CI) | 1.35 [1.14, 1.61] |
| Outcome or subgroup title | No. of studies | No. of participants | Statistical method | Effect size |
| 7.1 Overall survival Show forest plot | 5 | 1118 | Hazard Ratio (IV, Random, 95% CI) | 0.96 [0.83, 1.10] |
| 7.2 Progression‐free survival Show forest plot | 4 | 775 | Hazard Ratio (IV, Random, 95% CI) | 0.86 [0.76, 0.99] |
| 7.3 Tumour response Show forest plot | 5 | 1118 | Risk Ratio (M‐H, Random, 95% CI) | 1.45 [1.15, 1.83] |
| 7.4 Toxicity (≥ G3) Show forest plot | 1 | 241 | Risk Ratio (M‐H, Random, 95% CI) | 1.45 [1.12, 1.87] |
| Outcome or subgroup title | No. of studies | No. of participants | Statistical method | Effect size |
| 8.1 Overall survival Show forest plot | 2 | 154 | Hazard Ratio (IV, Random, 95% CI) | 0.87 [0.61, 1.25] |
| 8.2 Tumour response Show forest plot | 6 | 770 | Risk Ratio (M‐H, Random, 95% CI) | 0.85 [0.65, 1.12] |
| Outcome or subgroup title | No. of studies | No. of participants | Statistical method | Effect size |
| 9.1 Overall survival Show forest plot | 4 | 242 | Hazard Ratio (IV, Random, 95% CI) | 0.95 [0.74, 1.22] |
| 9.2 Tumour response Show forest plot | 7 | 537 | Risk Ratio (M‐H, Random, 95% CI) | 1.03 [0.77, 1.38] |
| Outcome or subgroup title | No. of studies | No. of participants | Statistical method | Effect size |
| 10.1 Overall survival Show forest plot | 2 | 1157 | Hazard Ratio (IV, Random, 95% CI) | 0.81 [0.65, 1.01] |
| 10.2 Progression‐free survival Show forest plot | 1 | 502 | Hazard Ratio (IV, Random, 95% CI) | 0.76 [0.63, 0.92] |
| 10.3 Tumour response Show forest plot | 2 | 1157 | Risk Ratio (M‐H, Random, 95% CI) | 1.28 [0.92, 1.77] |
| 10.4 Toxicity (≥ G3) Show forest plot | 2 | 1142 | Risk Ratio (M‐H, Random, 95% CI) | 1.69 [1.19, 2.42] |
| Outcome or subgroup title | No. of studies | No. of participants | Statistical method | Effect size |
| 11.1 Overall survival Show forest plot | 2 | 784 | Hazard Ratio (IV, Random, 95% CI) | 0.83 [0.52, 1.33] |
| 11.2 Progression‐free survival Show forest plot | 2 | 785 | Hazard Ratio (IV, Random, 95% CI) | 1.06 [0.75, 1.51] |
| 11.3 Tumour response Show forest plot | 2 | 785 | Risk Ratio (M‐H, Random, 95% CI) | 0.74 [0.38, 1.47] |
| 11.4 Toxicity (≥ G3) Show forest plot | 2 | 785 | Risk Ratio (M‐H, Random, 95% CI) | 0.87 [0.69, 1.11] |
| Outcome or subgroup title | No. of studies | No. of participants | Statistical method | Effect size |
| 12.1 Overall survival Show forest plot | 1 | 418 | Hazard Ratio (IV, Random, 95% CI) | 0.42 [0.37, 0.48] |
| 12.2 Progression‐free survival Show forest plot | 2 | 957 | Hazard Ratio (IV, Random, 95% CI) | 0.49 [0.39, 0.61] |
| 12.3 Tumour response Show forest plot | 3 | 1367 | Risk Ratio (M‐H, Random, 95% CI) | 3.42 [2.38, 4.92] |
| 12.4 Toxicity (≥ G3) Show forest plot | 3 | 1360 | Risk Ratio (M‐H, Random, 95% CI) | 0.55 [0.31, 0.97] |
| Outcome or subgroup title | No. of studies | No. of participants | Statistical method | Effect size |
| 13.1 Overall survival Show forest plot | 1 | 834 | Hazard Ratio (IV, Random, 95% CI) | 0.63 [0.60, 0.66] |
| 13.2 Progression‐free survival Show forest plot | 2 | 1465 | Hazard Ratio (IV, Random, 95% CI) | 0.54 [0.50, 0.60] |
| 13.3 Tumour response Show forest plot | 2 | 1465 | Risk Ratio (M‐H, Random, 95% CI) | 2.47 [2.01, 3.04] |
| 13.4 Toxicity (≥ G3) Show forest plot | 2 | 1435 | Risk Ratio (M‐H, Random, 95% CI) | 0.70 [0.54, 0.91] |
| Outcome or subgroup title | No. of studies | No. of participants | Statistical method | Effect size |
| 14.1 Progression‐free survival Show forest plot | 2 | 738 | Hazard Ratio (IV, Random, 95% CI) | 0.40 [0.35, 0.46] |
| 14.2 Tumour response Show forest plot | 2 | 738 | Risk Ratio (M‐H, Random, 95% CI) | 3.50 [2.07, 5.92] |
| 14.3 Toxicity (≥ G3) Show forest plot | 2 | 764 | Risk Ratio (M‐H, Random, 95% CI) | 1.57 [0.85, 2.92] |
| Outcome or subgroup title | No. of studies | No. of participants | Statistical method | Effect size |
| 15.1 Overall survival Show forest plot | 3 | 1194 | Hazard Ratio (IV, Random, 95% CI) | 1.00 [0.88, 1.14] |
| 15.2 Progression‐free survival Show forest plot | 3 | 1194 | Hazard Ratio (IV, Random, 95% CI) | 0.89 [0.73, 1.09] |
| 15.3 Tumour response Show forest plot | 3 | 1194 | Risk Ratio (M‐H, Random, 95% CI) | 1.17 [0.91, 1.50] |
| 15.4 Toxicity (≥ G3) Show forest plot | 3 | 1194 | Risk Ratio (M‐H, Random, 95% CI) | 1.08 [0.93, 1.26] |
| Outcome or subgroup title | No. of studies | No. of participants | Statistical method | Effect size |
| 16.1 Overall survival Show forest plot | 1 | 651 | Hazard Ratio (IV, Random, 95% CI) | 1.10 [0.92, 1.32] |
| 16.2 Progression‐free survival Show forest plot | 2 | 732 | Hazard Ratio (IV, Random, 95% CI) | 0.75 [0.50, 1.13] |
| 16.3 Tumour response Show forest plot | 2 | 732 | Risk Ratio (M‐H, Random, 95% CI) | 1.86 [0.98, 3.50] |
| 16.4 Toxicity (≥ G3) Show forest plot | 1 | 651 | Risk Ratio (M‐H, Random, 95% CI) | 1.22 [1.00, 1.50] |
| Outcome or subgroup title | No. of studies | No. of participants | Statistical method | Effect size |
| 17.1 Overall survival Show forest plot | 2 | 324 | Hazard Ratio (IV, Random, 95% CI) | 0.60 [0.45, 0.81] |
| 17.2 Progression‐free survival Show forest plot | 2 | 324 | Hazard Ratio (IV, Random, 95% CI) | 0.69 [0.52, 0.92] |
| 17.3 Tumour response Show forest plot | 2 | 324 | Risk Ratio (M‐H, Random, 95% CI) | 1.71 [0.96, 3.03] |
| 17.4 Toxicity (≥ G3) Show forest plot | 2 | 324 | Risk Ratio (M‐H, Random, 95% CI) | 0.68 [0.09, 5.32] |
| Outcome or subgroup title | No. of studies | No. of participants | Statistical method | Effect size |
| 18.1 Overall survival Show forest plot | 2 | 925 | Hazard Ratio (IV, Random, 95% CI) | 0.40 [0.28, 0.57] |
| 18.2 Progression‐free survival Show forest plot | 2 | 925 | Hazard Ratio (IV, Random, 95% CI) | 0.27 [0.21, 0.34] |
| 18.3 Tumour response Show forest plot | 2 | 925 | Risk Ratio (M‐H, Random, 95% CI) | 6.78 [4.84, 9.49] |
| 18.4 Toxicity (≥ G3) Show forest plot | 2 | 925 | Risk Ratio (M‐H, Random, 95% CI) | 1.27 [0.48, 3.33] |
| Outcome or subgroup title | No. of studies | No. of participants | Statistical method | Effect size |
| 19.1 Overall survival Show forest plot | 3 | 496 | Hazard Ratio (IV, Random, 95% CI) | 0.85 [0.58, 1.25] |
| 19.2 Progression‐free survival Show forest plot | 3 | 496 | Hazard Ratio (IV, Random, 95% CI) | 0.58 [0.42, 0.80] |
| 19.3 Tumour response Show forest plot | 3 | 496 | Risk Ratio (M‐H, Random, 95% CI) | 2.01 [1.35, 2.99] |
| 19.4 Toxicity (≥ G3) Show forest plot | 1 | 91 | Risk Ratio (M‐H, Fixed, 95% CI) | 1.61 [1.08, 2.41] |
| Outcome or subgroup title | No. of studies | No. of participants | Statistical method | Effect size |
| 20.1 Overall survival Show forest plot | 4 | 1784 | Hazard Ratio (IV, Random, 95% CI) | 0.70 [0.59, 0.82] |
| 20.2 Progression‐free survival Show forest plot | 4 | 1784 | Hazard Ratio (IV, Random, 95% CI) | 0.56 [0.44, 0.71] |
| 20.3 Tumour response Show forest plot | 4 | 1784 | Risk Ratio (M‐H, Random, 95% CI) | 1.32 [1.20, 1.46] |
| 20.4 Toxicity (≥ G3) Show forest plot | 4 | 1774 | Risk Ratio (M‐H, Random, 95% CI) | 1.01 [0.85, 1.20] |
| Outcome or subgroup title | No. of studies | No. of participants | Statistical method | Effect size |
| 21.1 Overall survival Show forest plot | 4 | 1458 | Hazard Ratio (IV, Random, 95% CI) | 0.82 [0.67, 0.99] |
| 21.2 Progression‐free survival Show forest plot | 4 | 1458 | Hazard Ratio (IV, Random, 95% CI) | 0.92 [0.74, 1.14] |
| 21.3 Tumour response Show forest plot | 4 | 1451 | Risk Ratio (M‐H, Random, 95% CI) | 1.23 [0.60, 2.50] |
| 21.4 Toxicity (≥ G3) Show forest plot | 4 | 1458 | Risk Ratio (M‐H, Random, 95% CI) | 0.92 [0.77, 1.08] |